Overview & Outlook for the P/C Insurance Industry Drivers of Revenue, Cost and Competition in the...
82
Overview & Outlook for the P/C Insurance Industry Drivers of Revenue, Cost and Competition in the Aftermath of the “Great Recession” Independent Insurance Agents of Westchester County Tarrytown, NY March 3, 2011 Download at www.iii.org/presentations Robert P. Hartwig, Ph.D., CPCU, President & Economist Insurance Information Institute 110 William Street New York, NY 10038 Tel: 212.346.5520 Cell: 917.453.1885 [email protected]
-
Upload
derrick-mclaughlin -
Category
Documents
-
view
214 -
download
0
Transcript of Overview & Outlook for the P/C Insurance Industry Drivers of Revenue, Cost and Competition in the...
Overview & Outlook for the P/C Insurance Industry
Drivers of Revenue, Cost and Competition in the Aftermath of the “Great Recession”
Independent Insurance Agents of Westchester County Tarrytown, NYMarch 3, 2011
Download at www.iii.org/presentationsRobert P. Hartwig, Ph.D., CPCU, President & Economist
Insurance Information Institute 110 William Street New York, NY 10038Tel: 212.346.5520 Cell: 917.453.1885 [email protected] www.iii.org
2
Presentation Outline
Reasons for Optimism, Causes for Concern in the P/C Insurance Industry P/C Profitability Overview & Outlook 5 Key Pillars of Profitability: Past, Present & Future
Underwriting Pricing Trends (Commercial Lines) Investments Expenses Leverage
External Factors Influencing Profitability Tort System Review: Overview and Causes for Concern Regulatory Environment
Exposure Analysis: Where Will Growth Come from in the Aftermath of the Great Recession?” Crisis-Driven Exposure Issues: Commercial Lines Growth in the Post-Crisis World
Catastrophe Loss Review Q&A
3
Reasons for Optimism, Causes for Concern in the P/C
Insurance Industry
The Outlook for the Economy Has Brightened, But the Outlook
for P/C Insurance Is Mixed

4
Reasons for Optimism, Causes for Concern in the P/C Insurance Industry
Economic Recovery in US is Self-Sustaining and Strengthening No Double Dip Recession Economy is more resilient than most pundits presume
Consumer Confidence is Gradually Improving Consumer Spending is Recovering Gradually Consumer and Business Lending Are Expanding Housing Market Remains Weak, but Some Improvement Expected in 2011 Inflation Remains Tame
Runaway inflation is highly unlikely; Fed has things under control Deflation—threat has virtually disappeared
Private Sector Hiring is Consistently Positive for 13 Months Acceleration in hiring later in 2011 No significant secondary spike in unemployment
Sovereign Debt, Muni Bond “Crises” Overblown Current Middle East Turmoil Poses Little Risk to US Economy Interest Rates Are Rising but Remain Low by Historical Standards Stock and Bond Markets More Stable, Less Volatile Political Environment Is More Hospitable to Business Interests

5
Reasons for Optimism, Causes for Concern in the P/C Insurance Industry
Era of Mass P/C Insurance Exposure Destruction Has Ended Personal and commercial exposure growth is virtually certain in 2011
But restoration of destroyed exposure will take 3-5 years in US
Exposure Growth Returned in in 2nd Half 2010, Will Accelerate in 2011
P/C Industry Saw Growth in 2010 (+0.8%) for the First Time Since 2006
Increasing Private Sector Hiring Will Drive Payrolls/WC Exposures Wage growth is also positive and could modestly accelerate
Increase in Demand for Commercial Insurance Is in its Earliest Stages and Will Accelerate in 2011 Includes workers comp, commercial auto, marine, many liability coverages, D&O
Laggards: Property, inland marine, aviation
Personal Lines: Auto leads, homeowners lags
Investment Environment Is/Remains Much More Favorable Return of realized capital gains as a profit driver
Interest rates are low but are risingBoost to investment income
Agent Commissions Should Begin to Rise in 2011
Demand, Capital Management Strategies Will Temper Overcapitalization
8
P/C Insurance Industry Financial Overview
Profit Recovery ContinuesEarly Stage Growth Begins
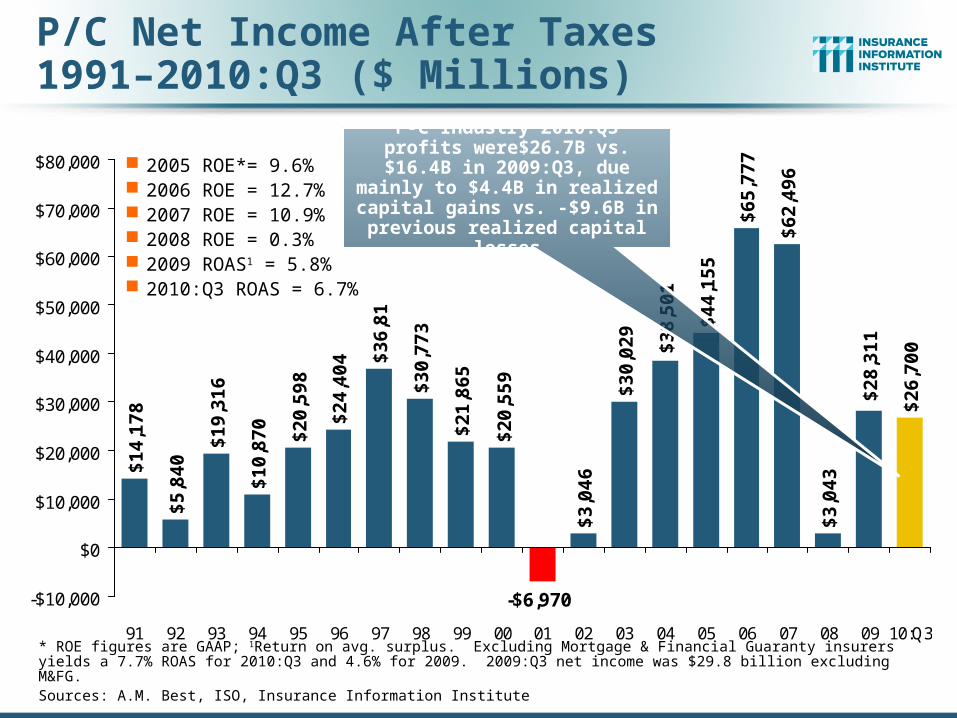
P/C Net Income After Taxes1991–2010:Q3 ($ Millions)
$1
4,1
78
$5
,84
0
$1
9,3
16
$1
0,8
70
$2
0,5
98
$2
4,4
04 $
36
,81
9
$3
0,7
73
$2
1,8
65
$3
,04
6
$3
0,0
29
$6
2,4
96
$3
,04
3
$2
6,7
00
$2
8,3
11
-$6,970
$6
5,7
77
$4
4,1
55
$2
0,5
59
$3
8,5
01
-$10,000
$0
$10,000
$20,000
$30,000
$40,000
$50,000
$60,000
$70,000
$80,000
91 92 93 94 95 96 97 98 99 00 01 02 03 04 05 06 07 08 09 10:Q3
2005 ROE*= 9.6% 2006 ROE = 12.7% 2007 ROE = 10.9% 2008 ROE = 0.3% 2009 ROAS1 = 5.8% 2010:Q3 ROAS = 6.7%
P-C Industry 2010:Q3 profits were$26.7B vs.$16.4B in 2009:Q3,
due mainly to $4.4B in realized capital gains vs. -$9.6B in previous
realized capital losses
* ROE figures are GAAP; 1Return on avg. surplus. Excluding Mortgage & Financial Guaranty insurers yields a 7.7% ROAS for 2010:Q3 and 4.6% for 2009. 2009:Q3 net income was $29.8 billion excluding M&FG.Sources: A.M. Best, ISO, Insurance Information Institute
10
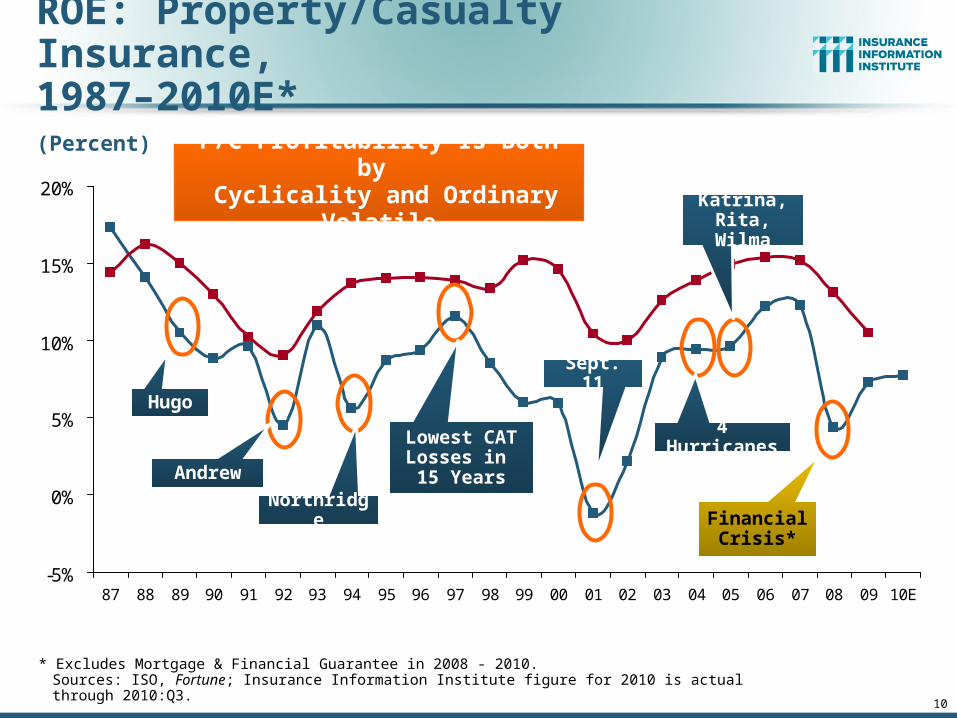
ROE: Property/Casualty Insurance,1987–2010E*
* Excludes Mortgage & Financial Guarantee in 2008 - 2010.Sources: ISO, Fortune; Insurance Information Institute figure for 2010 is actual through 2010:Q3.
-5%
0%
5%
10%
15%
20%
87 88 89 90 91 92 93 94 95 96 97 98 99 00 01 02 03 04 05 06 07 08 09 10E
P/C Profitability Is Both by Cyclicality and Ordinary Volatile
Hugo
Andrew
Northridge
Lowest CAT Losses in 15 Years
Sept. 11
Katrina, Rita, Wilma
4 Hurricanes
Financial Crisis*
(Percent)

A 100 Combined Ratio Isn’t What ItOnce Was: Investment Impact on ROEs
Combined Ratio / ROE
* 2009 and 2010:Q3 figures are return on average statutory surplus. 2008, 2009 and 2010:H1figures exclude mortgage and financial guaranty insurersSource: Insurance Information Institute from A.M. Best and ISO data.
97.5
100.6 100.1 100.7
92.6
99.5 99.7101.0
7.7%7.3%
9.6%
15.9%
14.3%
12.7%
4.4%
8.9%
80
85
90
95
100
105
110
1978 1979 2003 2005 2006 2008* 2009* 2010:Q3*0%
3%
6%
9%
12%
15%
18%
Combined Ratio ROE*
Combined Ratios Must Be Lower in Today’s DepressedInvestment Environment to Generate Risk Appropriate ROEs
A combined ratio of about 100 generated ~7.5% ROE in 2009/10,
10% in 2005 and 16% in 1979
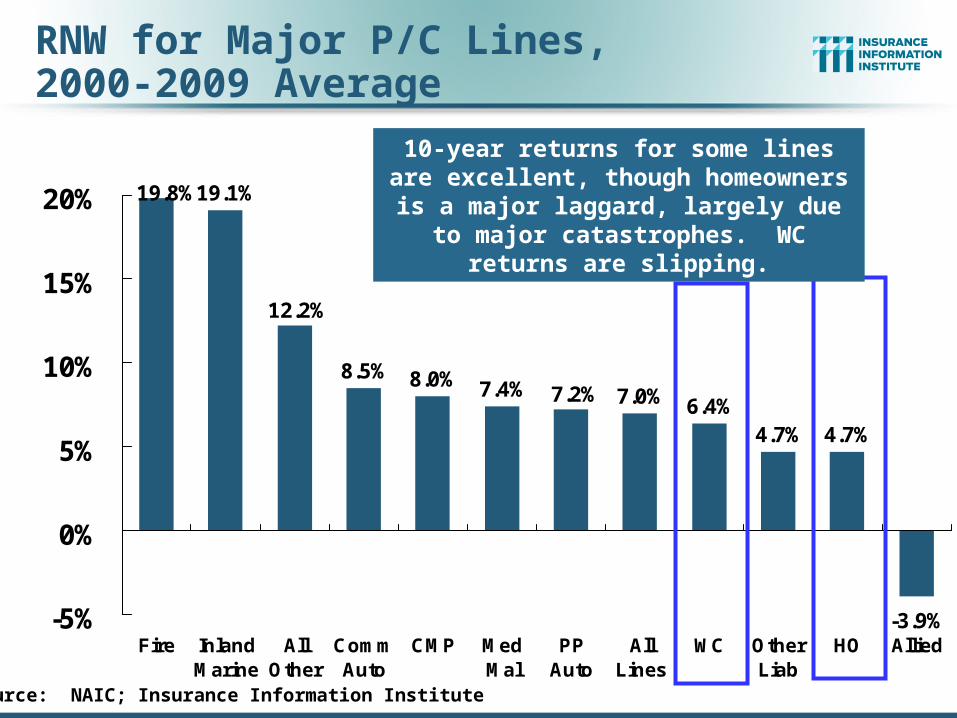
RNW for Major P/C Lines,2000-2009 Average
19.1%
8.5% 8.0% 7.4% 7.0% 6.4%4.7% 4.7%
-3.9%
19.8%
12.2%
7.2%
-5%
0%
5%
10%
15%
20%
Fire InlandMarine
AllOther
CommAuto
CMP MedMal
PPAuto
AllLines
WC OtherLiab
HO Allied
Source: NAIC; Insurance Information Institute
10-year returns for some lines are excellent, though homeowners is a major
laggard, largely due to major catastrophes. WC returns are slipping.
Profit Pillar #1UNDERWRITING
14
Cyclicality is Driven Primarily by the Industry’s Underwriting
Cycle, Not the Economy
15
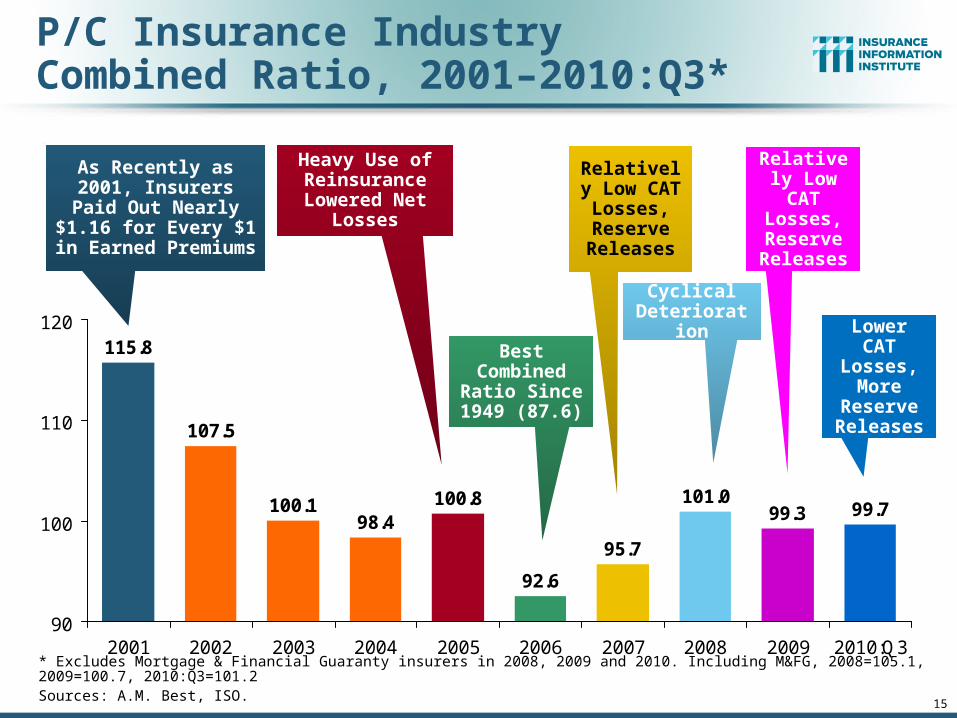
P/C Insurance Industry Combined Ratio, 2001–2010:Q3*
* Excludes Mortgage & Financial Guaranty insurers in 2008, 2009 and 2010. Including M&FG, 2008=105.1, 2009=100.7, 2010:Q3=101.2 Sources: A.M. Best, ISO.
95.7
99.3 99.7101.0
92.6
100.898.4
100.1
107.5
115.8
90
100
110
120
2001 2002 2003 2004 2005 2006 2007 2008 2009 2010:Q3
Best Combined
Ratio Since 1949 (87.6)
As Recently as 2001, Insurers Paid Out
Nearly $1.16 for Every $1 in Earned
Premiums
Relatively Low CAT Losses, Reserve Releases
Cyclical Deterioration
Heavy Use of Reinsurance Lowered Net
Losses
Relatively Low CAT Losses, Reserve Releases
Lower CAT
Losses, More
Reserve Releases

Underwriting Gain (Loss)1975–2010:Q3*
* Includes mortgage and financial guarantee insurers.Sources: A.M. Best, ISO; Insurance Information Institute.
Large Underwriting Losses Are NOT Sustainable in Current Investment Environment
-$55
-$45
-$35
-$25
-$15
-$5
$5
$15
$25
$35
75 77 79 81 83 85 87 89 91 93 95 97 99 01 03 05 07 09
The industry recorded a $6.2B underwriting
loss in 2010:Q3 compared to $3.2B in
2009:Q3
Cumulative underwriting deficit from 1975 through
2009 is $445B
($ Billions)
17
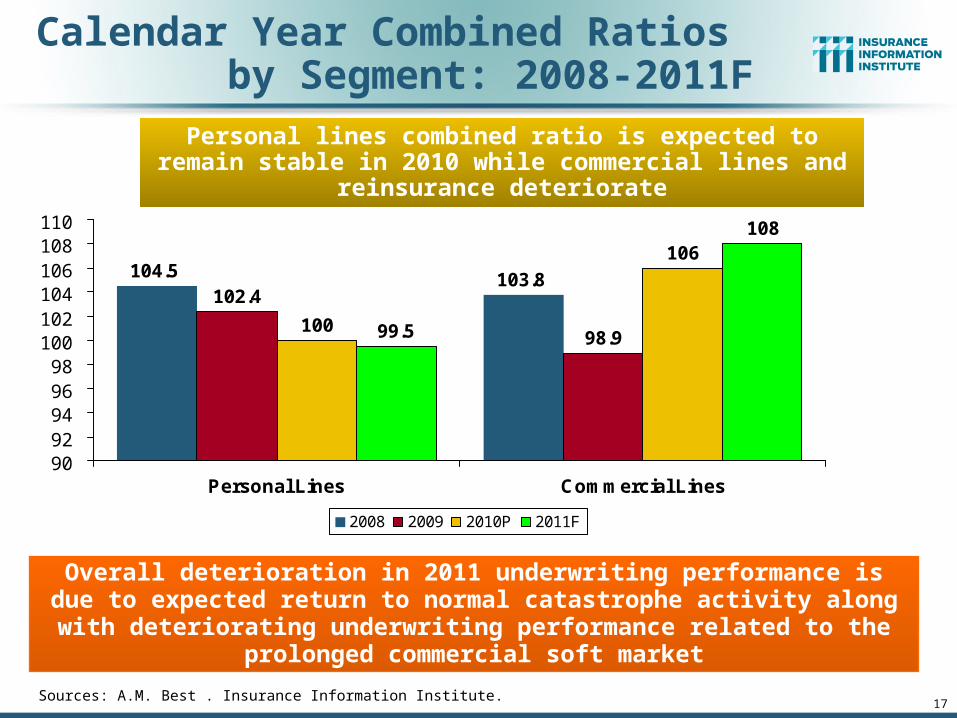
Calendar Year Combined Ratios by Segment: 2008-2011F
Sources: A.M. Best . Insurance Information Institute.
102.4
98.9100
106
99.5
108
103.8104.5
9092949698
100102104106108110
Personal Lines Commercial Lines
2008 2009 2010P 2011F
Overall deterioration in 2011 underwriting performance is due to expected return to normal catastrophe activity along with deteriorating underwriting
performance related to the prolonged commercial soft market
Personal lines combined ratio is expected to remain stable in 2010 while commercial lines and reinsurance deteriorate
21
Performance by Segment:Commercial/Personal Lines
Auto/Home Outperform Most Commercial Lines
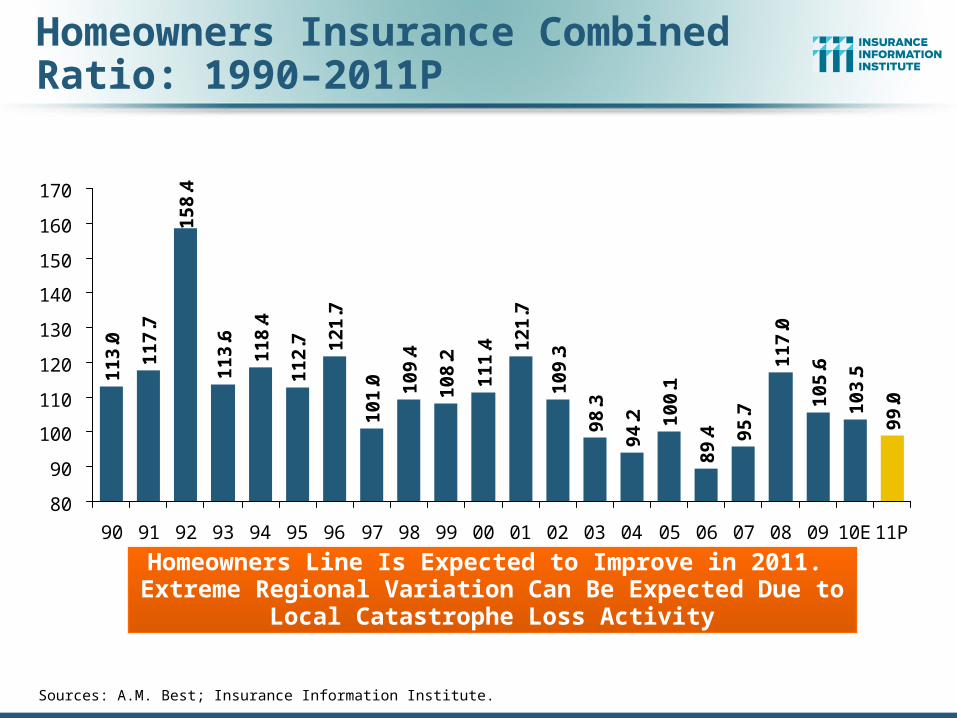
Homeowners Insurance Combined Ratio: 1990–2011P
11
3.0
11
7.7
15
8.4
11
3.6
10
1.0 10
9.4
10
8.2
11
1.4 1
21
.7
10
9.3
98
.3
94
.2 10
0.1
89
.4 95
.7
11
7.0
10
5.6
10
3.5
99
.0
11
8.4
11
2.7 12
1.7
80
90
100
110
120
130
140
150
160
170
90 91 92 93 94 95 96 97 98 99 00 01 02 03 04 05 06 07 08 09 10E11P
Homeowners Line Is Expected to Improve in 2011. Extreme Regional Variation Can Be Expected Due to Local Catastrophe
Loss Activity
Sources: A.M. Best; Insurance Information Institute.

Private Passenger Auto Combined Ratio: 1993–2011P
10
1.7
10
1.3
10
1.3
10
1.0
10
9.5
10
7.9
10
4.2
98
.4
94
.3
95
.1
95
.5 98
.3 10
0.3
10
1.3
99
.0
98
.5
99
.5 10
1.1
10
3.5
80
85
90
95
100
105
110
115
93 94 95 96 97 98 99 00 01 02 03 04 05 06 07 08 09 10E 11P
Private Passenger Auto Accounts for 34% of Industry Premiums and Remains the Profit Juggernaut of the P/C Insurance Industry
Sources: A.M. Best; Insurance Information Institute.
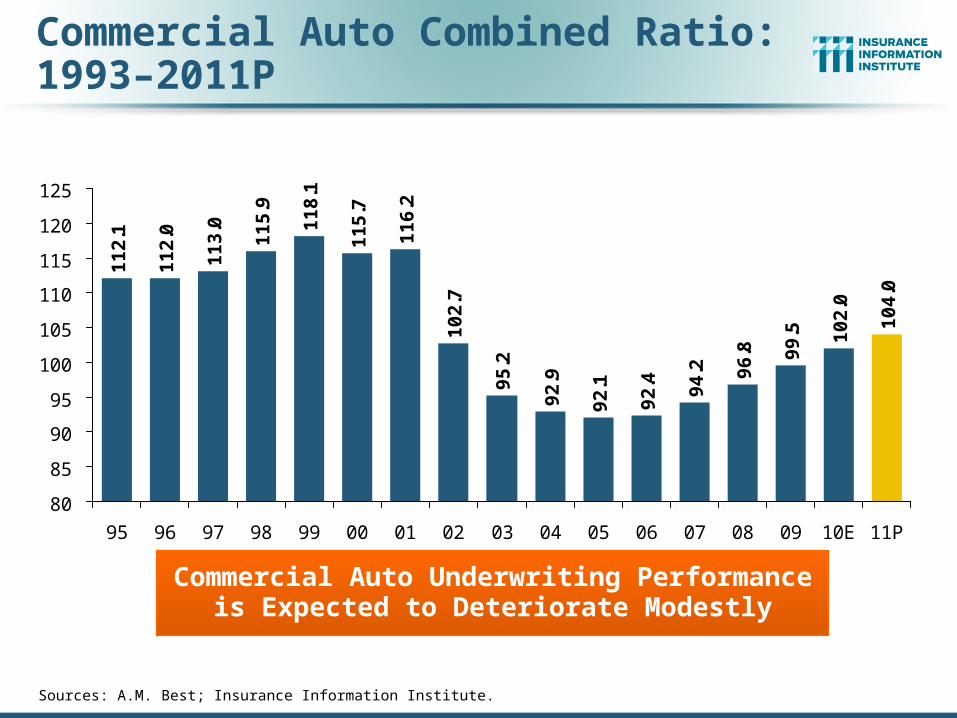
Commercial Auto Combined Ratio: 1993–2011P
11
2.1
11
2.0
11
3.0
11
5.9
10
2.7
95
.2
92
.9
92
.1
92
.4 94
.2 96
.8 99
.5 10
2.0
10
4.0
11
8.1
11
5.7
11
6.2
80
85
90
95
100
105
110
115
120
125
95 96 97 98 99 00 01 02 03 04 05 06 07 08 09 10E 11P
Sources: A.M. Best; Insurance Information Institute.
Commercial Auto Underwriting Performance is Expected to Deteriorate Modestly
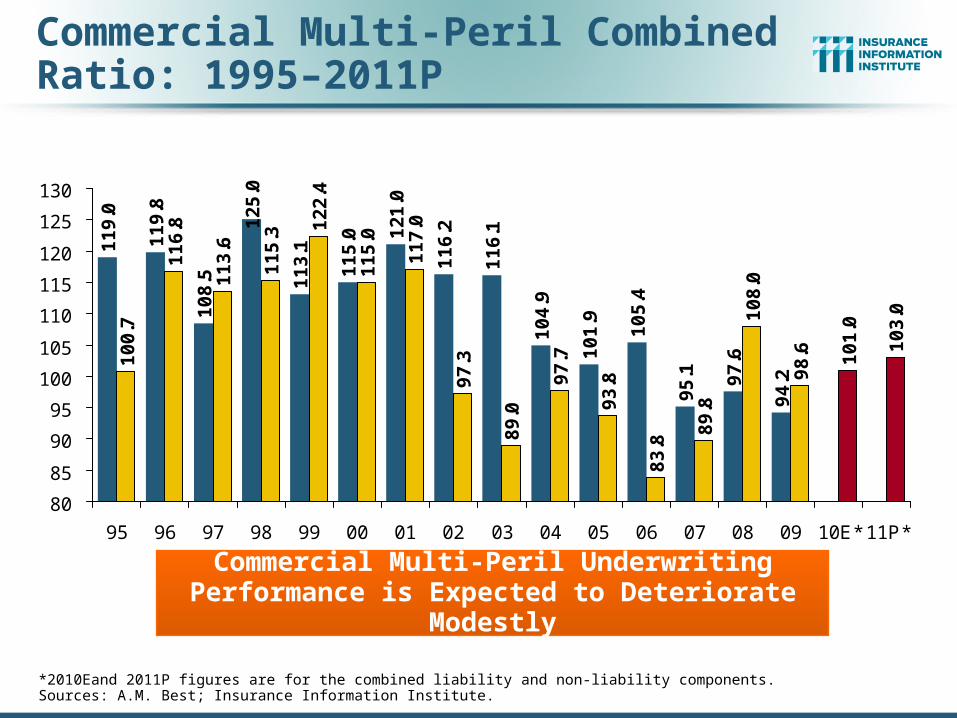
Commercial Multi-Peril Combined Ratio: 1995–2011P
11
9.0
11
9.8
10
8.5
12
5.0
11
6.2
11
6.1
10
4.9
10
1.9
10
5.4
95
.1 97
.6
94
.2
10
0.7
11
6.8
11
3.6
11
5.3
12
2.4
11
5.0
11
7.0
97
.3
89
.0
97
.7
93
.8
83
.8
89
.8
10
8.0
98
.6 10
1.0
10
3.0
11
3.1
11
5.0 1
21
.0
80
85
90
95
100
105
110
115
120
125
130
95 96 97 98 99 00 01 02 03 04 05 06 07 08 09 10E* 11P*
Commercial Multi-Peril Underwriting Performance is Expected to Deteriorate Modestly
*2010Eand 2011P figures are for the combined liability and non-liability components.Sources: A.M. Best; Insurance Information Institute.

Workers Compensation Combined Ratio: 1994–2011P
10
2.0
97
.0 10
0.0
10
1.0
11
0.9
11
0.0
10
7.0
10
2.7
98
.4 10
3.5
10
4.4 1
10
.5
11
7.5 12
1.5
12
1.7
10
7.0
11
5.3
11
8.2
80
85
90
95
100
105
110
115
120
125
130
94 95 96 97 98 99 00 01 02 03 04 05 06 07 08 09 10E 11P
Workers Comp Underwriting Results Are Deteriorating Markedly and the Worst They
Have Been in a DecadeSources: A.M. Best; Insurance Information Institute.
28
New York No-Fault Update
Costs Among the Highest in the US and Continue to Rise
29
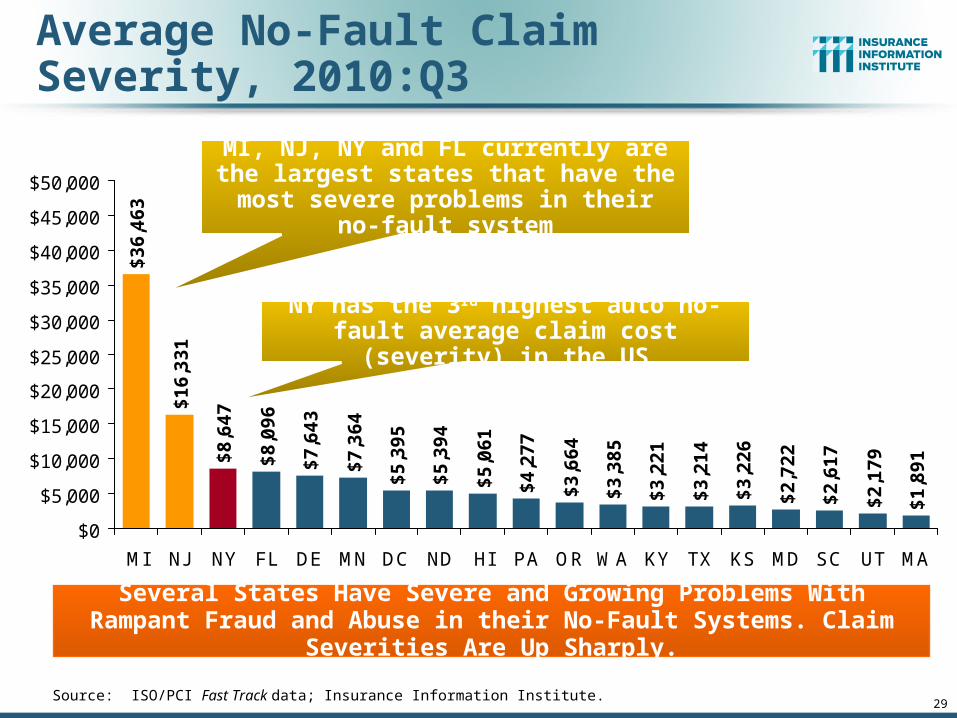
Average No-Fault Claim Severity, 2010:Q3
$1
6,3
31
$8
,64
7
$8
,09
6
$5
,39
4
$5
,06
1
$4
,27
7
$3
,66
4
$3
,38
5
$3
,22
1
$3
,21
4
$3
,22
6
$2
,72
2
$2
,61
7
$2
,17
9
$1
,89
1
$3
6,4
63
$7
,64
3
$7
,36
4
$5
,39
5
$0
$5,000
$10,000
$15,000
$20,000
$25,000
$30,000
$35,000
$40,000
$45,000
$50,000
MI NJ NY FL DE MN DC ND HI PA OR WA KY TX KS MD SC UT MA
Several States Have Severe and Growing Problems With Rampant Fraud and Abuse in their No-Fault Systems. Claim Severities Are Up Sharply.
Source: ISO/PCI Fast Track data; Insurance Information Institute.
MI, NJ, NY and FL currently are the largest states that have the most severe
problems in their no-fault system
NY has the 3rd highest auto no-fault average claim cost (severity) in the US
30
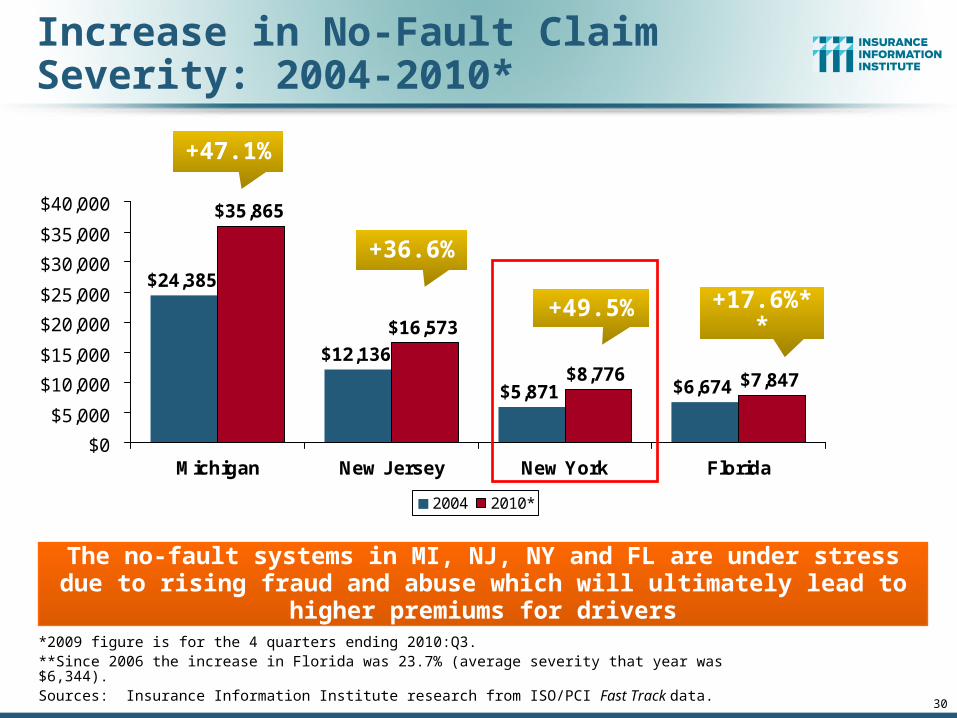
Increase in No-Fault Claim Severity: 2004-2010*
*2009 figure is for the 4 quarters ending 2010:Q3.**Since 2006 the increase in Florida was 23.7% (average severity that year was $6,344). Sources: Insurance Information Institute research from ISO/PCI Fast Track data.
$35,865
$16,573
$8,776 $7,847$6,674$5,871
$12,136
$24,385
$0
$5,000
$10,000
$15,000
$20,000
$25,000
$30,000
$35,000
$40,000
Michigan New Jersey New York Florida
2004 2010*
The no-fault systems in MI, NJ, NY and FL are under stress due to rising fraud and abuse which will ultimately lead to higher premiums for drivers
+47.1%
+36.6%
+49.5% +17.6%**
31
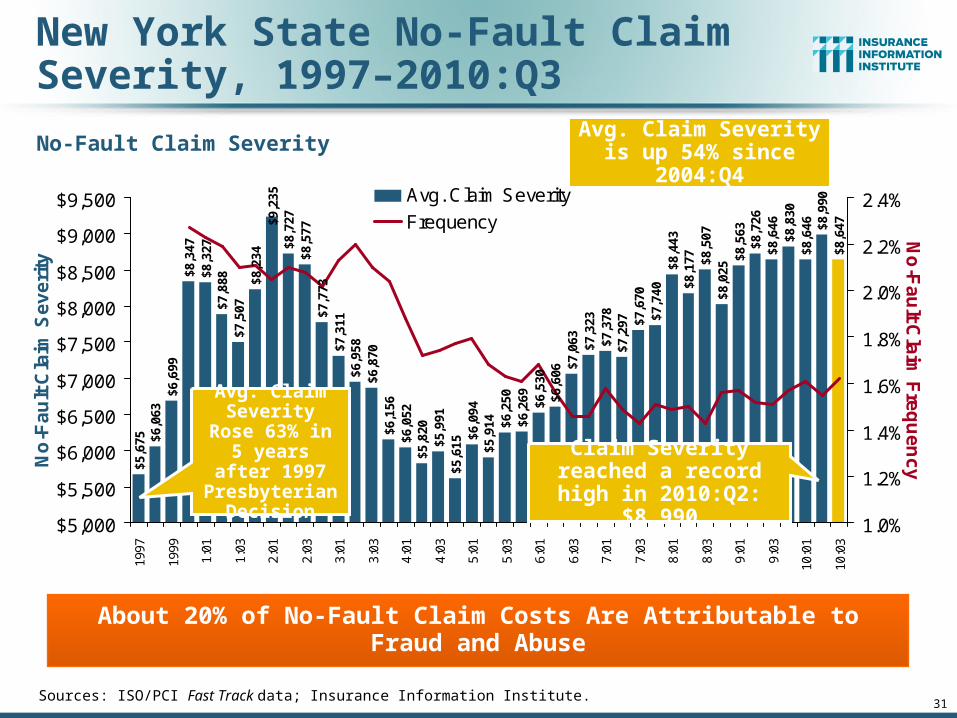
New York State No-Fault Claim Severity, 1997–2010:Q3
Sources: ISO/PCI Fast Track data; Insurance Information Institute.
$5,6
75 $6,0
63$6
,699
$8,3
47$8
,327
$7,8
88$7
,507
$8,2
34$9
,235
$8,7
27$8
,577
$7,7
73$7
,311
$6,9
58$6
,870
$6,1
56$6
,052
$5,8
20$5
,991
$5,6
15$6
,094
$5,9
14 $6,2
50$6
,269 $6
,530
$6,6
06$7
,063 $7
,323
$7,3
78$7
,297 $7
,670
$7,7
40$8
,443
$8,1
77 $8,5
07$8
,025
$8,5
63$8
,726
$8,6
46$8
,830
$8,6
46 $8,9
90$8
,647
$5,000
$5,500
$6,000
$6,500
$7,000
$7,500
$8,000
$8,500
$9,000
$9,500
1997
1999
1:01
1:03
2:01
2:03
3:01
3:03
4:01
4:03
5:01
5:03
6:01
6:03
7:01
7:03
8:01
8:03
9:01
9:03
10:0
1
10:0
3
No
-Fa
ult
Cla
im S
ev
eri
ty
1.0%
1.2%
1.4%
1.6%
1.8%
2.0%
2.2%
2.4%
No
-Fa
ult C
laim
Fre
qu
en
cy
Avg. Claim Severity
Frequency
About 20% of No-Fault Claim Costs Are Attributable to Fraud and Abuse
No-Fault Claim Severity
Claim Severity reached a record high in 2010:Q2: $8,990
Avg. Claim Severity Rose 63% in 5 years
after 1997 Presbyterian
Decision
Avg. Claim Severity is up 54% since 2004:Q4

Financial Strength & Underwriting
32
Cyclical Pattern is P-C Impairment History is Directly Tied to
Underwriting, Reserving & Pricing
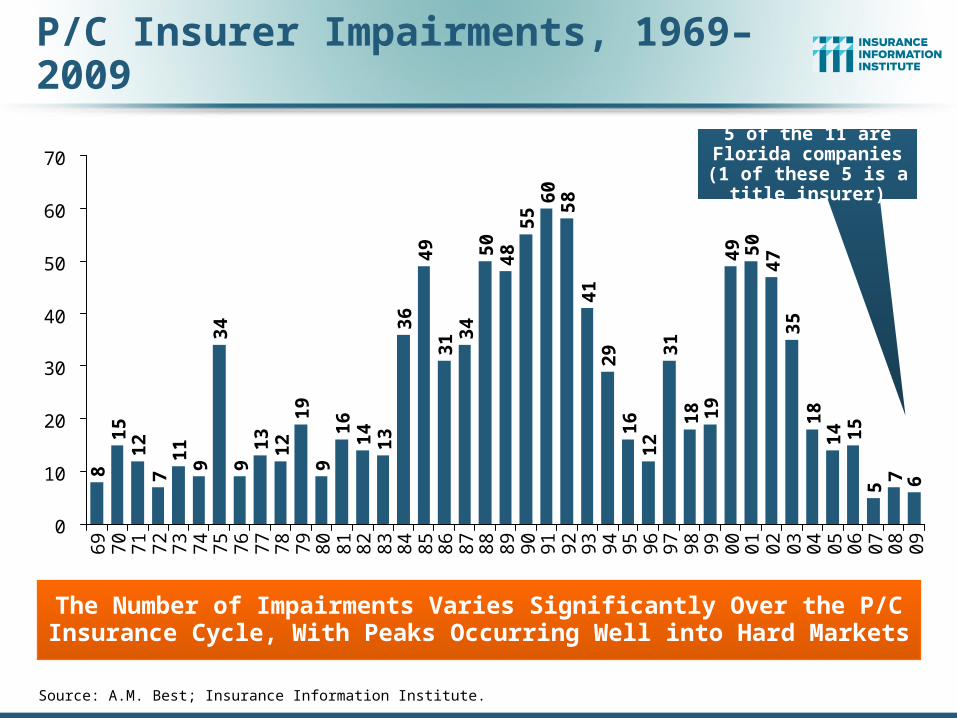
P/C Insurer Impairments, 1969–20098
15
12
71
19
34
91
31
21
99
16
14
13
36
49
31 3
45
04
85
56
05
84
12
91
61
23
11
8 19
49 50
47
35
18
14 15
7 65
0
10
20
30
40
50
60
70
69
70
71
72
73
74
75
76
77
78
79
80
81
82
83
84
85
86
87
88
89
90
91
92
93
94
95
96
97
98
99
00
01
02
03
04
05
06
07
08
09
Source: A.M. Best; Insurance Information Institute.
The Number of Impairments Varies Significantly Over the P/C Insurance Cycle, With Peaks Occurring Well into Hard Markets
5 of the 11 are Florida companies (1 of these
5 is a title insurer)
35
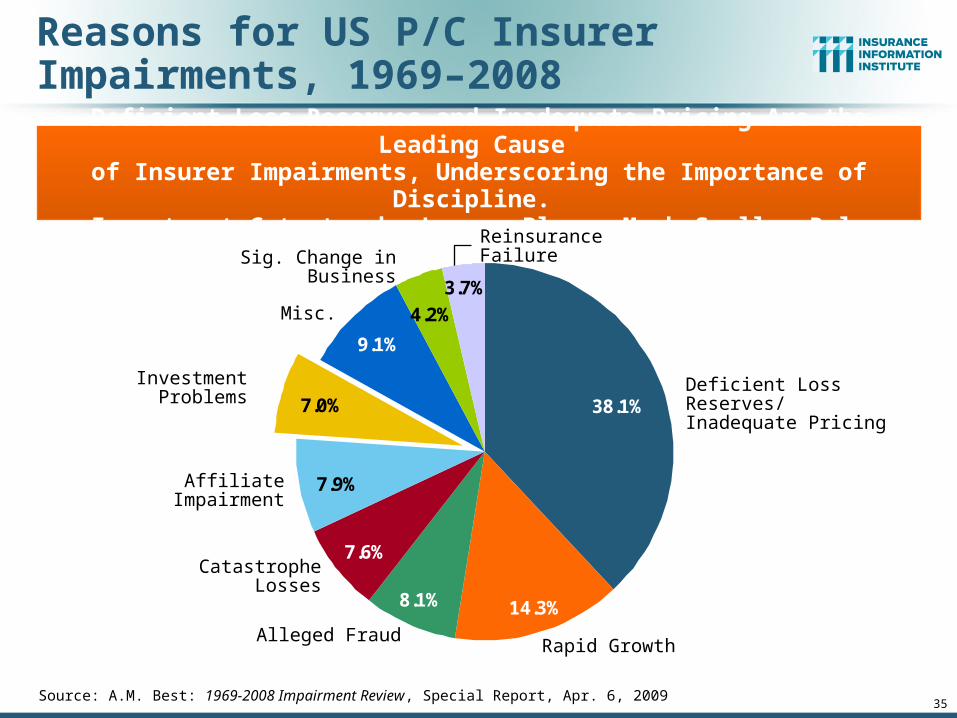
Reasons for US P/C Insurer Impairments, 1969–2008
38.1%
14.3%8.1%
7.6%
7.9%
7.0%
9.1%
4.2%
3.7%
Source: A.M. Best: 1969-2008 Impairment Review, Special Report, Apr. 6, 2009
Deficient Loss Reserves and Inadequate Pricing Are the Leading Cause of Insurer Impairments, Underscoring the Importance of Discipline.
Investment Catastrophe Losses Play a Much Smaller Role
Deficient Loss Reserves/Inadequate Pricing
Reinsurance Failure
Rapid GrowthAlleged Fraud
Catastrophe Losses
Affiliate Impairment
Investment Problems
Misc.
Sig. Change in Business

Profit Pillar #2PRICING
36
Pricing is Key to Profitability Trends in Personal and
Commercial
37
-5%
0%
5%
10%
15%
20%
25%
71 72 73 74 75 76 77 78 79 80 81 82 83 84 85 86 87 88 89 90 91 92 93 94 95 96 97 98 99 00 01 02 03 04 05 06 07 08 0910
F
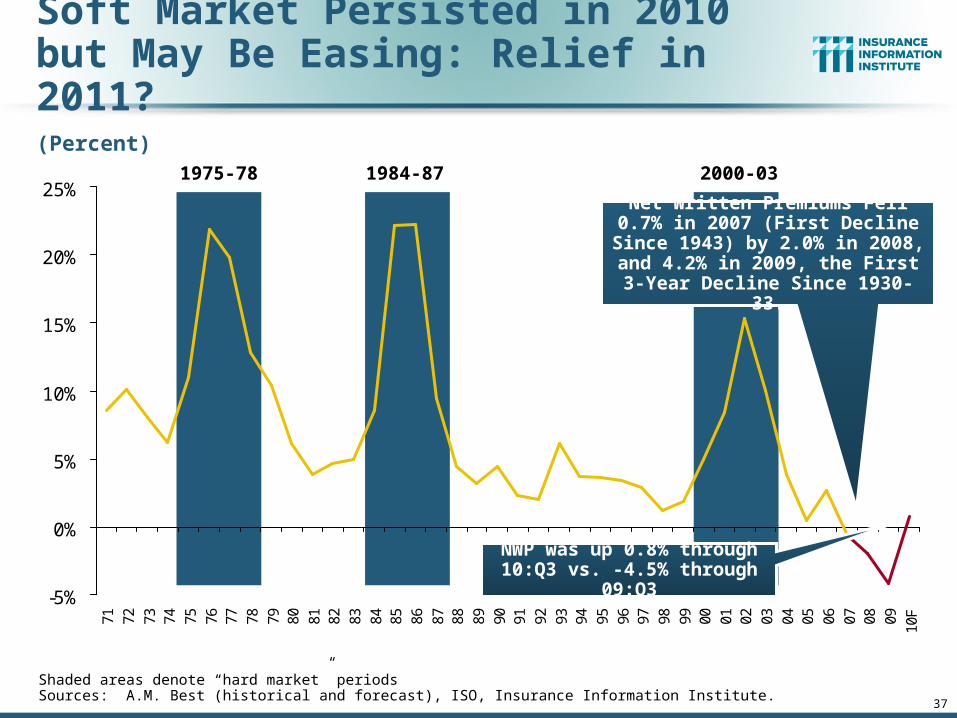
Soft Market Persisted in 2010 but May Be Easing: Relief in 2011?
(Percent)1975-78 1984-87 2000-03
Shaded areas denote “hard market” periodsSources: A.M. Best (historical and forecast), ISO, Insurance Information Institute.
Net Written Premiums Fell 0.7% in 2007 (First Decline Since 1943) by 2.0% in 2008, and 4.2% in 2009, the First 3-Year Decline Since 1930-33.
NWP was up 0.8% through 10:Q3 vs. -4.5% through 09:Q3

38
Auto & Home vs. All Lines, Net WrittenPremium Growth, 2000–2009
14.5%
-0.9%0.9%
9.2%
2.2%
5.7%
-4.9%
15.3%
5.0%
-5%
-3%
-1%
1%
3%
5%
7%
9%
11%
13%
15%
00 01 02 03 04 05 06 07 08 09
Private Passenger AutoHomeownersAll Lines
Sources: A.M. Best; Insurance Information Institute.
Average 2000-2009Auto = 2.9
Home = 6.5%All Lines = 3.4%
While homeowners insurance has grown faster than auto over the past decade, auto is
generally more profitable
39
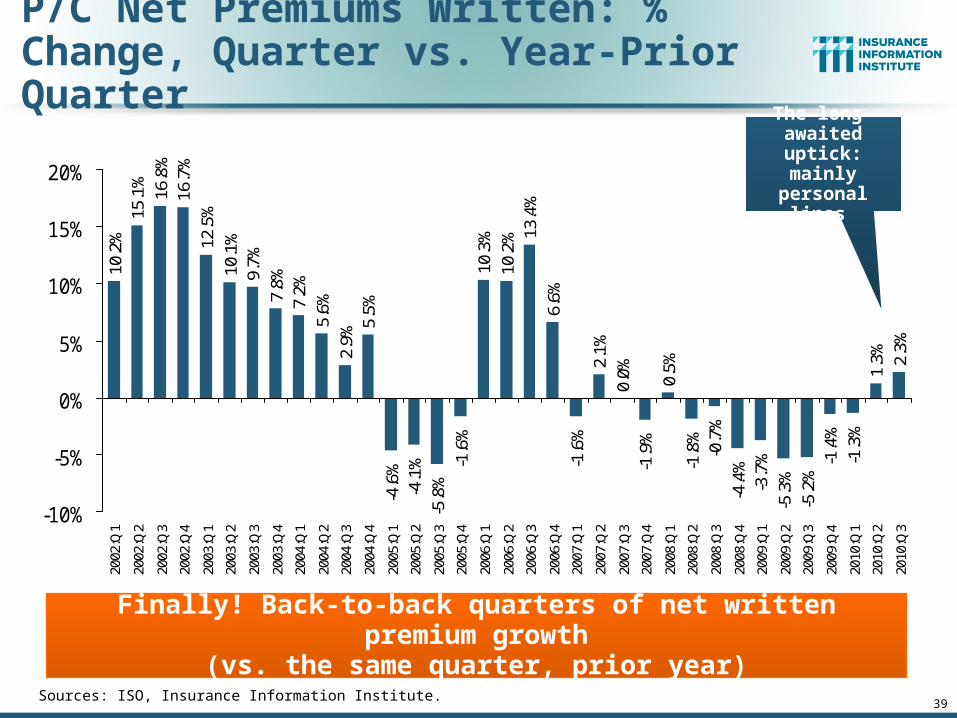
P/C Net Premiums Written: % Change, Quarter vs. Year-Prior Quarter
Sources: ISO, Insurance Information Institute.
Finally! Back-to-back quarters of net written premium growth(vs. the same quarter, prior year)
10.2
%15
.1%
16.8
%16
.7%
12.5
%10
.1%
9.7%
7.8%
7.2%
5.6%
2.9%
5.5%
-4.6
%-4
.1%
-5.8
%-1
.6%
10.3
%10
.2% 13
.4%
6.6%
-1.6
%2.
1%0.
0%-1
.9%
0.5%
-1.8
%-0
.7%
-4.4
%-3
.7%
-5.3
%-5
.2%
-1.4
%-1
.3%
1.3% 2.
3%
-10%
-5%
0%
5%
10%
15%
20%
2002
:Q1
2002
:Q2
2002
:Q3
2002
:Q4
2003
:Q1
2003
:Q2
2003
:Q3
2003
:Q4
2004
:Q1
2004
:Q2
2004
:Q3
2004
:Q4
2005
:Q1
2005
:Q2
2005
:Q3
2005
:Q4
2006
:Q1
2006
:Q2
2006
:Q3
2006
:Q4
2007
:Q1
2007
:Q2
2007
:Q3
2007
:Q4
2008
:Q1
2008
:Q2
2008
:Q3
2008
:Q4
2009
:Q1
2009
:Q2
2009
:Q3
2009
:Q4
2010
:Q1
2010
:Q2
2010
:Q3
The long-awaited uptick:
mainly personal lines

40
Net Written Premium Growth by Segment: 2008-2011F
-0.1%
-9.4%
2.8%
-2.0%
2.5%
0.3%
-3.1%
-0.1%
-12%
-10%
-8%
-6%
-4%
-2%
0%
2%
4%
Personal Lines Commercial Lines
2008 2009E 2010P 2011F
Rate and exposure are more favorable in personal lines, whereas a prolonged soft market and sluggish recovery from the recession
weigh on commercial lines.
Personal lines growth resumed in 2010 and will continue in 2011, while commercial lines contracted
again in 2010 and but will stabilize in 2011
Sources: A.M. Best; Insurance Information Institute.
41
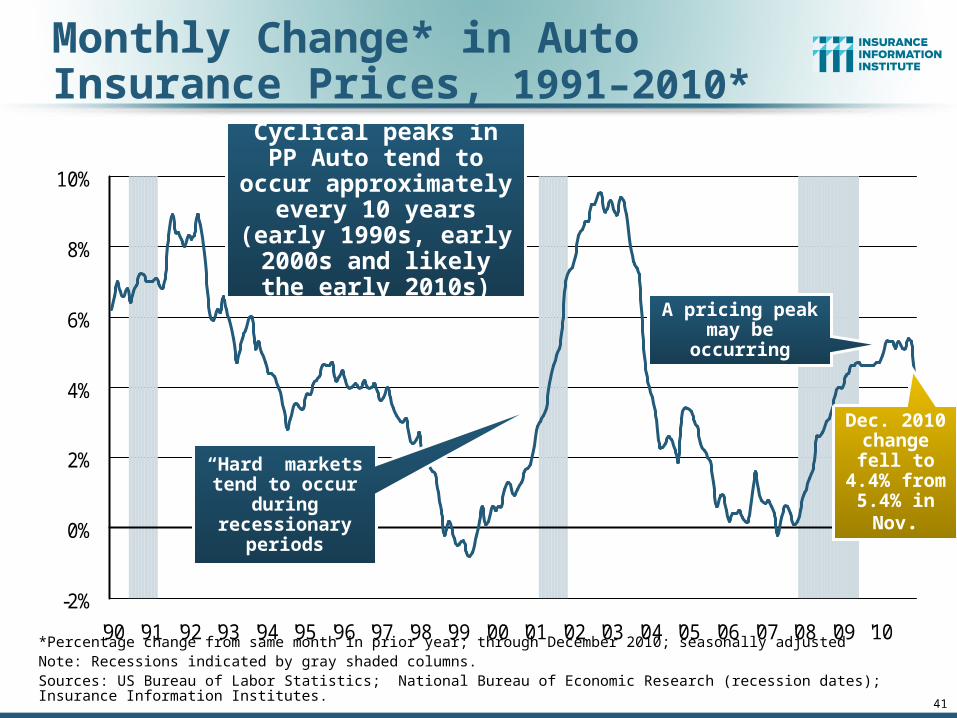
Monthly Change* in Auto Insurance Prices, 1991–2010*
*Percentage change from same month in prior year; through December 2010; seasonally adjustedNote: Recessions indicated by gray shaded columns.Sources: US Bureau of Labor Statistics; National Bureau of Economic Research (recession dates); Insurance Information Institutes.
-2%
0%
2%
4%
6%
8%
10%
'90 '91 '92 '93 '94 '95 '96 '97 '98 '99 '00 '01 '02 '03 '04 '05 '06 '07 '08 '09 '10
Cyclical peaks in PP Auto tend to occur
approximately every 10 years (early 1990s, early
2000s and likely the early 2010s)
“Hard” markets tend to occur
during recessionary
periods
A pricing peak may be occurring
Dec. 2010 change fell
to 4.4% from 5.4%
in Nov.
42
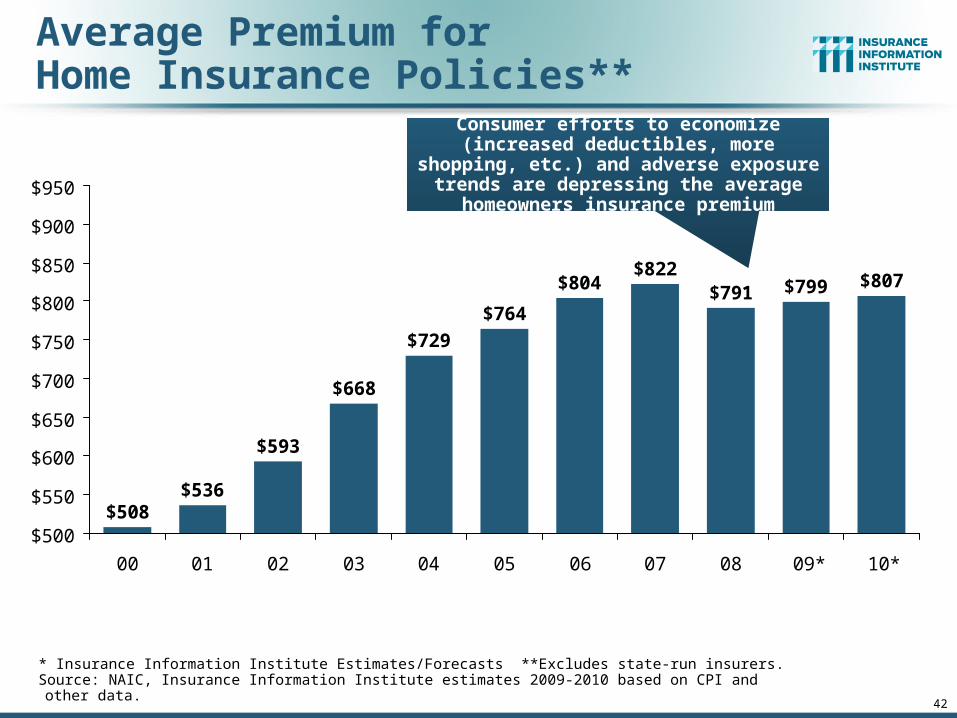
Average Premium forHome Insurance Policies**
* Insurance Information Institute Estimates/Forecasts **Excludes state-run insurers.Source: NAIC, Insurance Information Institute estimates 2009-2010 based on CPI and other data.
$508$536
$593
$668
$822$791 $799 $807$804
$764
$729
$500
$550
$600
$650
$700
$750
$800
$850
$900
$950
00 01 02 03 04 05 06 07 08 09* 10*
Consumer efforts to economize (increased deductibles, more shopping, etc.) and
adverse exposure trends are depressing the average homeowners insurance premium

43
Average Commercial Rate Change,All Lines, (1Q:2004–3Q:2010)
-3.2
%
-5.9
%
-7.0
%
-9.4
%
-9.7
% -8.2
%
-4.6
%
-2.7
%
-3.0
%
-5.3
%
-9.6
%
-11
.3%
-11
.8%
-13
.3%
-12
.0%
-13
.5%
-12
.9% -1
1.0
%
-6.4
% -5.1
%
-4.9
%
-5.8
%
-5.6
%
-5.3
%
-6.4
% -5.2
%
-0.1
%
-16%
-14%
-12%
-10%
-8%
-6%
-4%
-2%
0%
1Q
04
2Q
04
3Q
04
4Q
04
1Q
05
2Q
05
3Q
05
4Q
05
1Q
06
2Q
06
3Q
06
4Q
06
1Q
07
2Q
07
3Q
07
4Q
07
1Q
08
2Q
08
3Q
08
4Q
08
1Q
09
2Q
09
3Q
09
4Q
09
1Q
10
2Q
10
3Q
10
Source: Council of Insurance Agents & Brokers; Insurance Information Institute
KRW Effect
Magnitude of Price Declines Shrank
During Crisis, Reflecting Shrinking
Capital, Reduced Investment Gains,
Deteriorating Underwriting
Performance, Higher Cat Losses and
Costlier Reinsurance
(Percent)
Market Remains Soft as Capital Restored and
Underwriting Losses Remain Modest

Profit Pillar #3INVESTMENTS
47
Investment Performance is a Key Driver of Profitability
Does It Influence Underwriting?
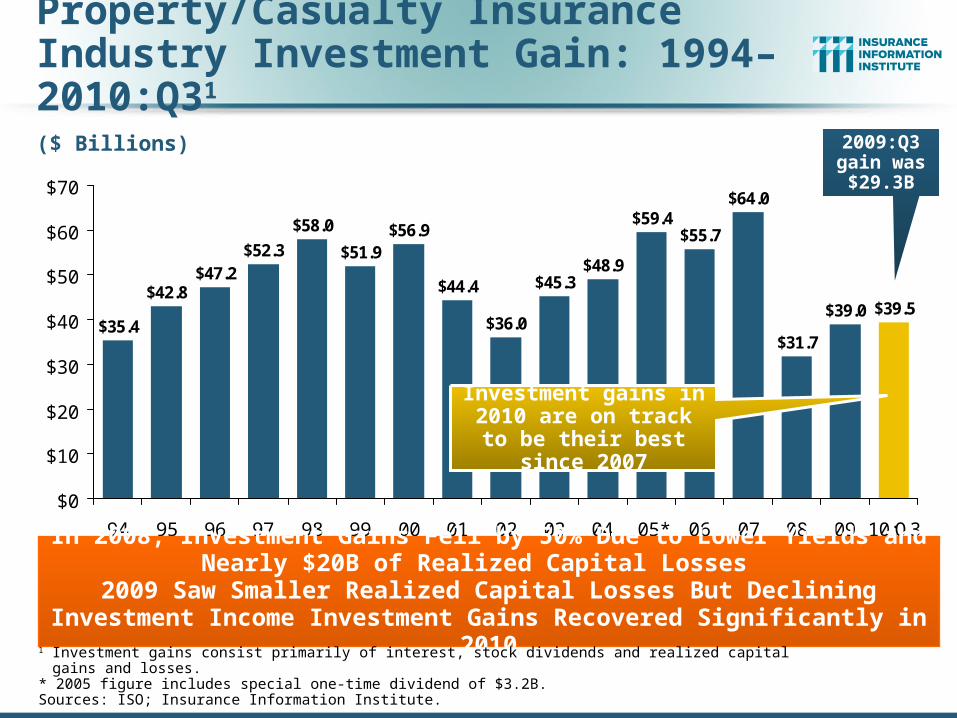
Property/Casualty Insurance Industry Investment Gain: 1994–2010:Q31
$35.4
$42.8$47.2
$52.3
$44.4
$36.0
$45.3$48.9
$59.4$55.7
$64.0
$31.7
$39.0 $39.5
$58.0
$51.9$56.9
$0
$10
$20
$30
$40
$50
$60
$70
94 95 96 97 98 99 00 01 02 03 04 05* 06 07 08 09 10:Q3In 2008, Investment Gains Fell by 50% Due to Lower Yields and
Nearly $20B of Realized Capital Losses 2009 Saw Smaller Realized Capital Losses But Declining Investment Income
Investment Gains Recovered Significantly in 20101 Investment gains consist primarily of interest, stock dividends and realized capital gains and losses.* 2005 figure includes special one-time dividend of $3.2B.Sources: ISO; Insurance Information Institute.
($ Billions) 2009:Q3 gain was $29.3B
Investment gains in 2010 are on track to be their best since 2007

50
Treasury Yield Curves: Pre-Crisis (July 2007) vs. January 2011
0.09% 0.14% 0.19% 0.29%0.62%
2.66%
3.29%
4.82% 4.96% 5.04% 4.96% 4.82% 4.82% 4.88% 5.00% 4.93% 5.00%5.19%
1.93%
0.99%
4.42%4.17%
0%
1%
2%
3%
4%
5%
6%
1M 3M 6M 1Y 2Y 3Y 5Y 7Y 10Y 20Y 30Y
January 2011 Yield Curve*Pre-Crisis (July 2007)
Treasury yield curve is near its most depressed level in at least 45 years,
though longer yields rose in late 2010 as economy improved. Investment
income is falling as a result.
The Fed’s Announced Intention to Pursue Additional Quantitative Easing Could Depress Rates in the 7 to 10-Year Maturity Range through
June
Sources: Board of Governors of the United States Federal Reserve Bank; Insurance Information Institute.
QE2 Target
51
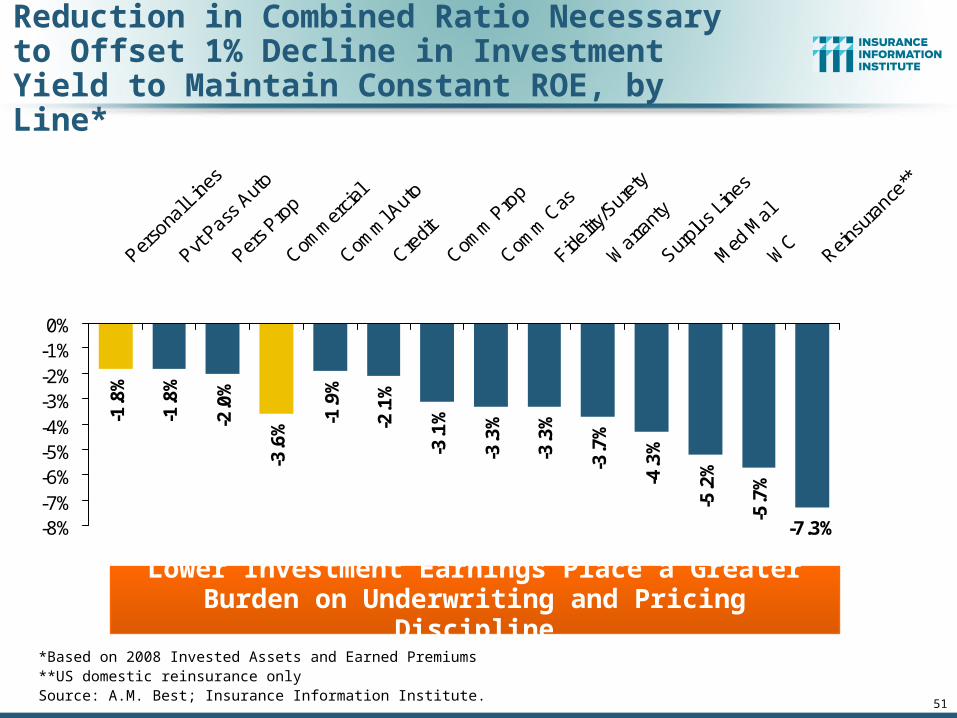
-1.8
%
-1.8
%
-2.0
%
-3.6
%
-3.3
%
-3.3
%
-3.7
%
-4.3
%
-5.2
%
-5.7
%
-7.3%
-1.9
%
-2.1
%
-3.1
%
-8%-7%-6%-5%-4%-3%-2%-1%0%
Perso
nal L
ines
Pvt Pass
Aut
o
Pers P
rop
Comm
ercia
l
Comm
l Auto
Credit
Comm
Pro
p
Comm
Cas
Fidelity
/Sure
ty
War
rant
y
Surplu
s Line
s
Med
Mal
WC
Reinsu
ranc
e**
Lower Investment Earnings Place a Greater Burden on Underwriting and Pricing Discipline
*Based on 2008 Invested Assets and Earned Premiums**US domestic reinsurance onlySource: A.M. Best; Insurance Information Institute.
Reduction in Combined Ratio Necessary to Offset 1% Decline in Investment Yield to Maintain Constant ROE, by Line*

52*Net admitted assets. Sources: NAIC; Insurance Information Institute research.
Invested assets totaled $1.26 trillion
Generally, insurers invest conservatively, with over 2/3 of invested assets in bonds
Only 18% of invested assets were in common or preferred stock
Portfolio Factsas of 12/31/2009
68.8%
6.2%18.0%
7.0%
Bonds
Common & Preferred Stock
As of December 31, 2009
Cash & Short-term
Investments
Other
Distribution of P/C Insurance Industry’s Investment Portfolio
53
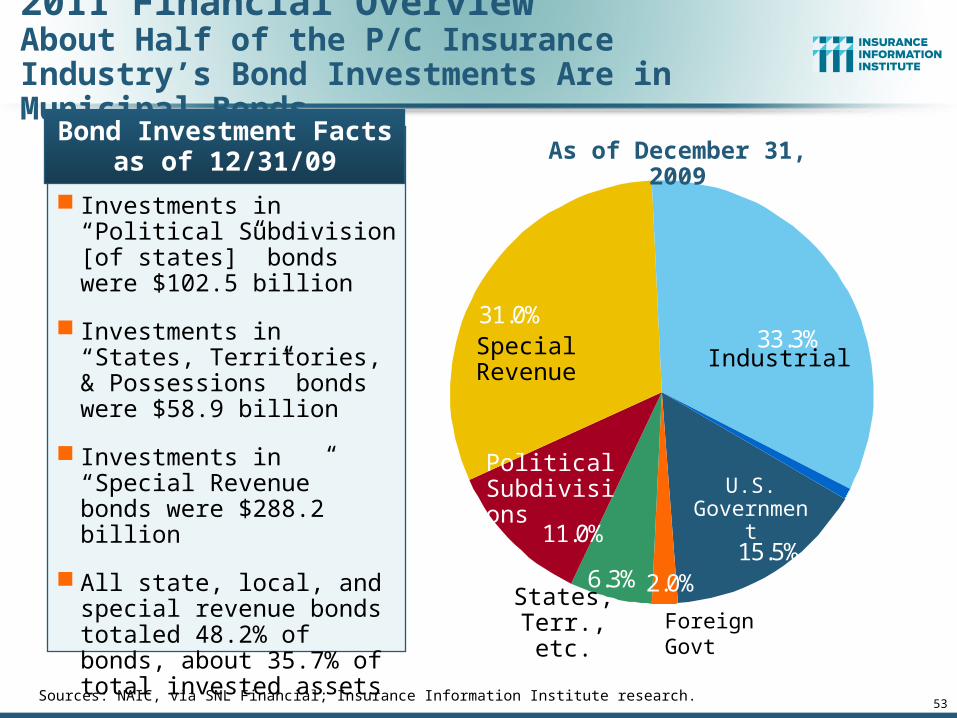
2011 Financial Overview About Half of the P/C Insurance Industry’s Bond Investments Are in Municipal Bonds
Sources: NAIC, via SNL Financial; Insurance Information Institute research.
Investments in “Political Subdivision [of states]” bonds were $102.5 billion
Investments in “States, Territories, & Possessions” bonds were $58.9 billion
Investments in “Special Revenue” bonds were $288.2 billion
All state, local, and special revenue bonds totaled 48.2% of bonds, about 35.7% of total invested assets
Bond Investment Factsas of 12/31/09
0.9%
2.0%15.5%
6.3%
11.0%
31.0%33.3%
U.S. Government
Special Revenue
As of December 31, 2009
States, Terr., etc.
Industrial
Foreign Govt
Political Subdivisions
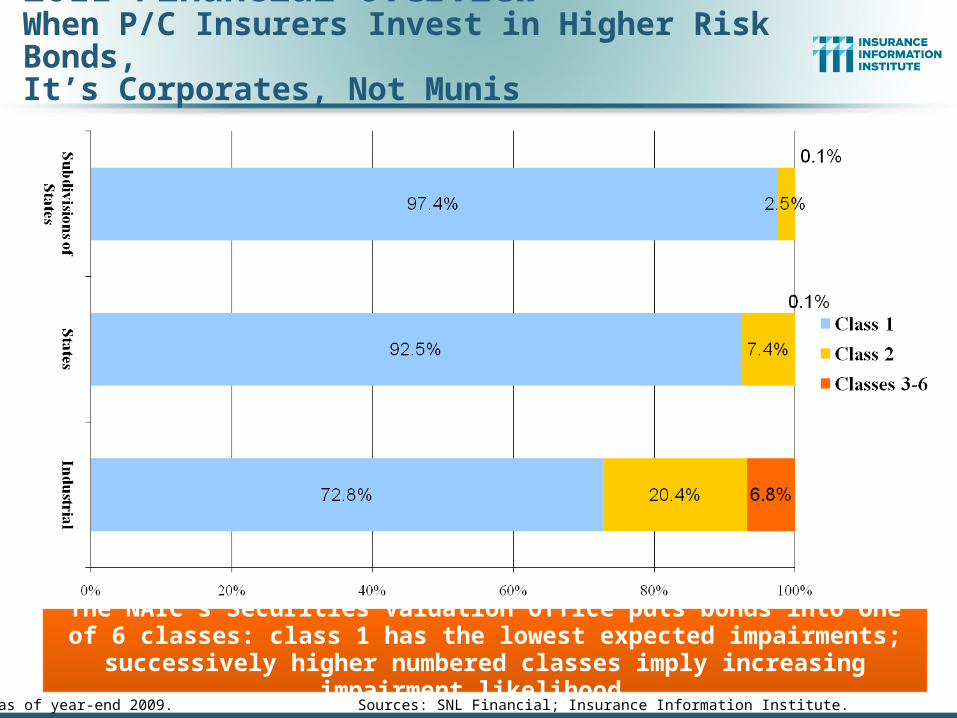
2011 Financial Overview When P/C Insurers Invest in Higher Risk Bonds,It’s Corporates, Not Munis
Data are as of year-end 2009. Sources: SNL Financial; Insurance Information Institute.
The NAIC’s Securities Valuation Office puts bonds into one of 6 classes: class 1 has the lowest expected impairments; successively higher
numbered classes imply increasing impairment likelihood.

Profit Pillar #4EXPENSES
55
Will Expense Ratios Fall As Premium Growth Turns Positive?

Underwriting Expense Ratio*All P/C Lines, 1994-2010E**
25.9%26.1%
26.3%26.5%
26.3%
27.0%
27.4%
28.1%
28.6%
25.5%
25.0%
24.5%
27.0%
25.3%
27.6%
28.0%27.4%
22%
23%
24%
25%
26%
27%
28%
29%
94 95 96 97 98 99 00 01 02 03 04 05 06 07 08 09 10E
*Ratio of expenses incurred to net premiums written.**2010 figure based on data through 2010:Q3.Source: A.M. Best; Insurance Information Institute.
Underwriting expense ratios are up
significantly as premiums fall faster
than expenses during generally soft market
conditions

Underwriting Expense Ratio*:Personal vs. Commercial Lines, 1990-2010E**
24.3%24.7%
24.4% 24.3%
26.4%26.6%
27.7%28.2%
29.9%
24.5%
26.4%
26.4%26.2%
24.7%24.7%24.6%24.4%
23.4%23.7%
23.5%
25.0%
23.9%
25.6%
25.6%
24.8%
30.5%30.6%
25.6%
28.5%
26.4%
26.6%
25.0%
29.1%
30.0%30.5%
28.4%
28.3%27.4%
27.8%
28.7%
29.3%
29.9%
20%
22%
24%
26%
28%
30%
32%
90
91
92
93
94
95
96
97
98
99
00
01
02
03
04
05
06
07
08
09
10
E
Personal Lines Commercial Lines
*Ratio of expenses incurred to net premiums written.**2010 figures are estimates.Source: A.M. Best; Insurance Information Institute.
Commercial lines expense ratios are
highly cyclical

Profit Pillar #5LEVERAGE
59
Efficient Deployment of Capital Exerts a Significant Impact on
Profitability
61
Policyholder Surplus, 2006:Q4–2010:Q3
Sources: ISO, A.M .Best.
($ Billions)
$487.1$496.6
$512.8$521.8
$478.5
$455.6
$437.1
$463.0
$490.8
$511.5
$540.7$530.5
$544.8
$505.0$515.6$517.9
$420
$440
$460
$480
$500
$520
$540
$560
06:Q4 07:Q1 07:Q2 07:Q3 07:Q4 08:Q1 08:Q2 08:Q3 08:Q4 09:Q1 09:Q2 09:Q3 09:Q4 10:Q1 10:Q2 10:Q3
2007:Q3Previous Surplus Peak
Quarterly Surplus Changes Since 2007:Q3 Peak
09:Q1: -$84.7B (-16.2%) 09:Q2: -$58.8B (-11.2%)09:Q3: -$31.0B (-5.9%)09:Q4: -$10.3B (-2.0%)
10:Q1: +$18.9B (+3.6%)10:Q2: +$8.7B (+1.7%)10:Q3: +$23.0B (+4.4%)
Surplus set a new record in 2010:Q3*
*Includes $22.5B of paid-in capital from a holding company parent for one insurer’s investment in a non-insurance business in early 2010.
The Industry now has $1 of surplus for every $0.77 of
NPW—the strongest claims-paying status in its history.
66
2.1
1.9
2.7
2.5
2.3
1.8
1.7
1.7
1.9
1.9
1.9
1.9
1.7
1.6
1.6
1.4
1.4
1.3
1.3
1.1
1.1
0.9
1.1
30
.94
0.8
60
.84
1.2
91
.17
1.0
70
.99
0.8
40
.91
0.7
90.9
50
.82
1.6
2.0
2.52.5
1.8
2.1
0.0
0.5
1.0
1.5
2.0
2.5
3.0
70
72
74
76
78
80
82
84
86
88
90
92
94
96
98 0
02
04
06
08
10
*
The Premium-to-Surplus Ratio in 2010 Implies that P/C Insurers Held $1 in Surplus Against Each $0.79 Written in Premiums. In 1974, Each $1 of
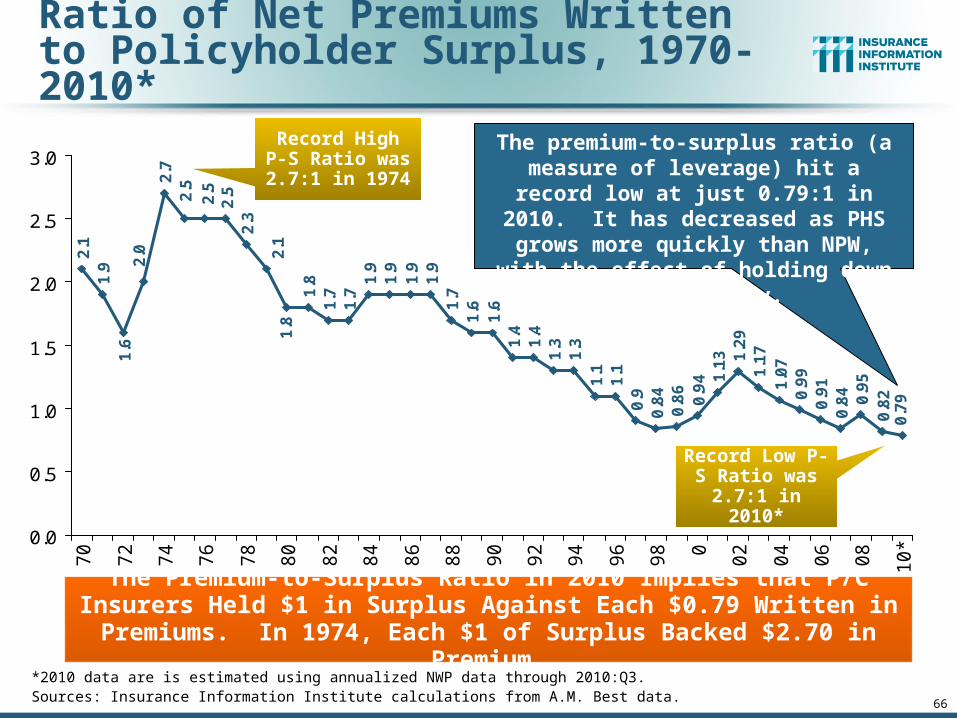
Surplus Backed $2.70 in Premium.*2010 data are is estimated using annualized NWP data through 2010:Q3.Sources: Insurance Information Institute calculations from A.M. Best data.
Ratio of Net Premiums Writtento Policyholder Surplus, 1970-2010*
The premium-to-surplus ratio (a measure of leverage) hit a record low at just 0.79:1 in 2010. It has decreased as PHS grows
more quickly than NPW, with the effect of holding down profitability.
Record High P-S Ratio was 2.7:1
in 1974
Record Low P-S Ratio was 2.7:1
in 2010*
Merger & Acquisition
67
Capital Cycles Can Drive Consolidation
68
$0
$10
$20
$30
$40
$50
$60
88 89 90 91 92 93 94 95 96 97 98 99 00 01 02 03 04 05 06 07 08 0910E
Tra
ns
ac
tio
n V
alu
e
0
20
40
60
80
100
120
140
Nu
mb
er o
f Tra
ns
ac
tion
s
Transaction Value Number of Transactions
($ Billions)
Note: U.S. Company was the acquirer and/or target.
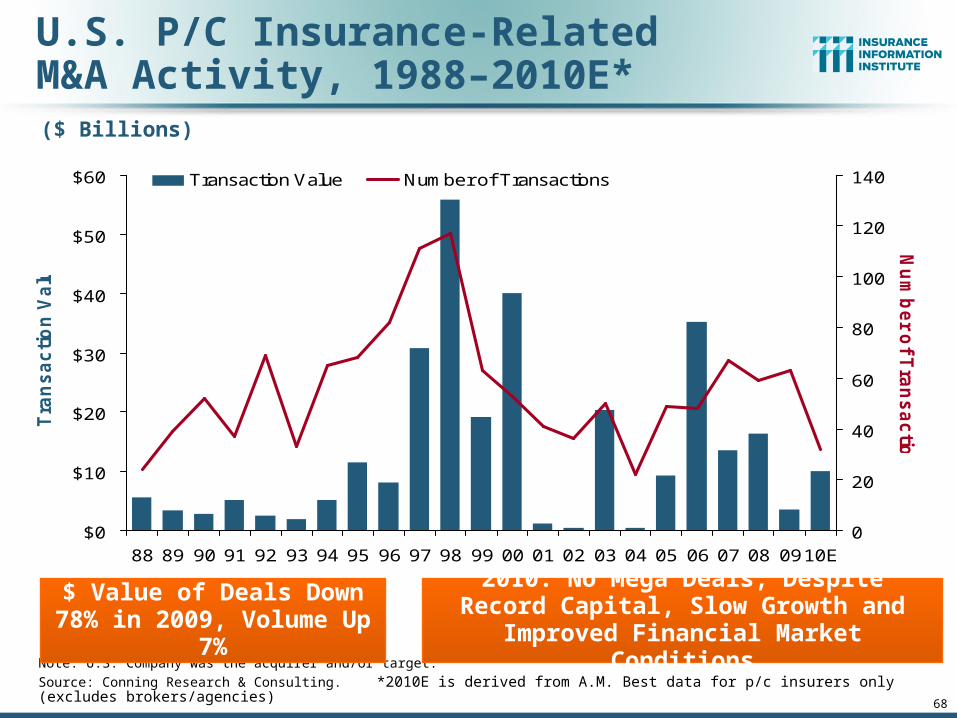
Source: Conning Research & Consulting. *2010E is derived from A.M. Best data for p/c insurers only (excludes brokers/agencies)
$ Value of Deals Down 78% in 2009, Volume Up 7%
2010: No Mega Deals, Despite Record Capital, Slow Growth and Improved
Financial Market Conditions
U.S. P/C Insurance-RelatedM&A Activity, 1988–2010E*
Secondary Profit PillarsOPERATING ENVIRONMENT
REGULATORY ENVIRONMENT
69
Many Other Factors Influence P/C Insurer Profitability

Shifting Legal Liability & Tort Environment
70
Is the Tort PendulumSwinging Against Insurers?
73
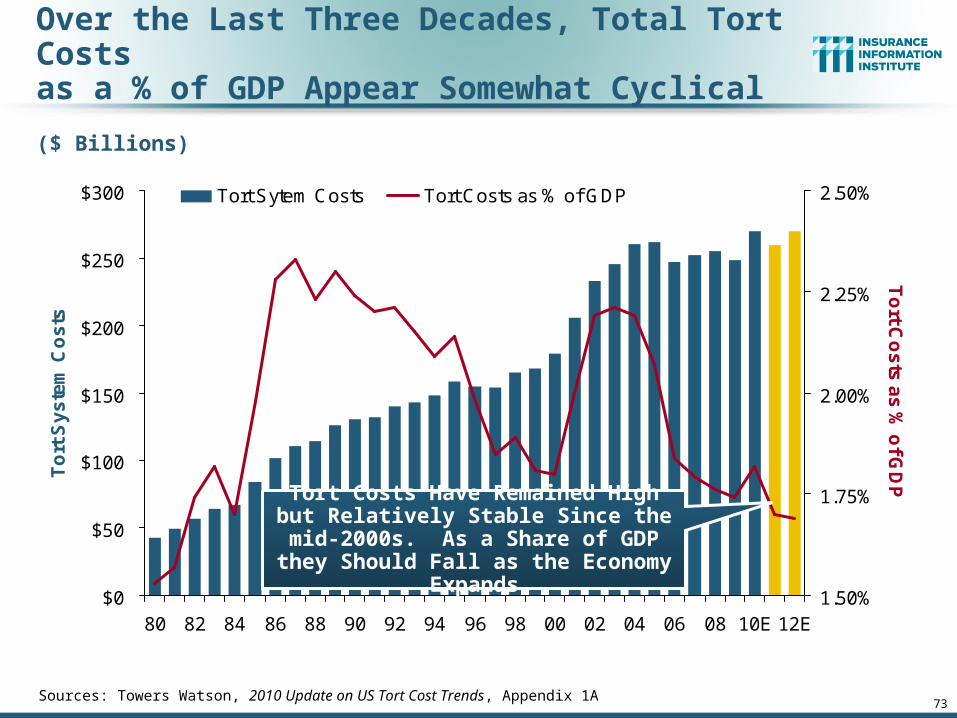
Over the Last Three Decades, Total Tort Costs as a % of GDP Appear Somewhat Cyclical
$0
$50
$100
$150
$200
$250
$300
80 82 84 86 88 90 92 94 96 98 00 02 04 06 08 10E 12E
To
rt S
ys
tem
Co
sts
1.50%
1.75%
2.00%
2.25%
2.50%
To
rt Co
sts
as
% o
f GD
P
Tort Sytem Costs Tort Costs as % of GDP
($ Billions)
Sources: Towers Watson, 2010 Update on US Tort Cost Trends, Appendix 1A
Tort Costs Have Remained High but Relatively Stable Since the mid-2000s. As a Share of GDP they Should Fall as
the Economy Expands

Inflation
92
Is it a Threat to Claim Cost Severities
93
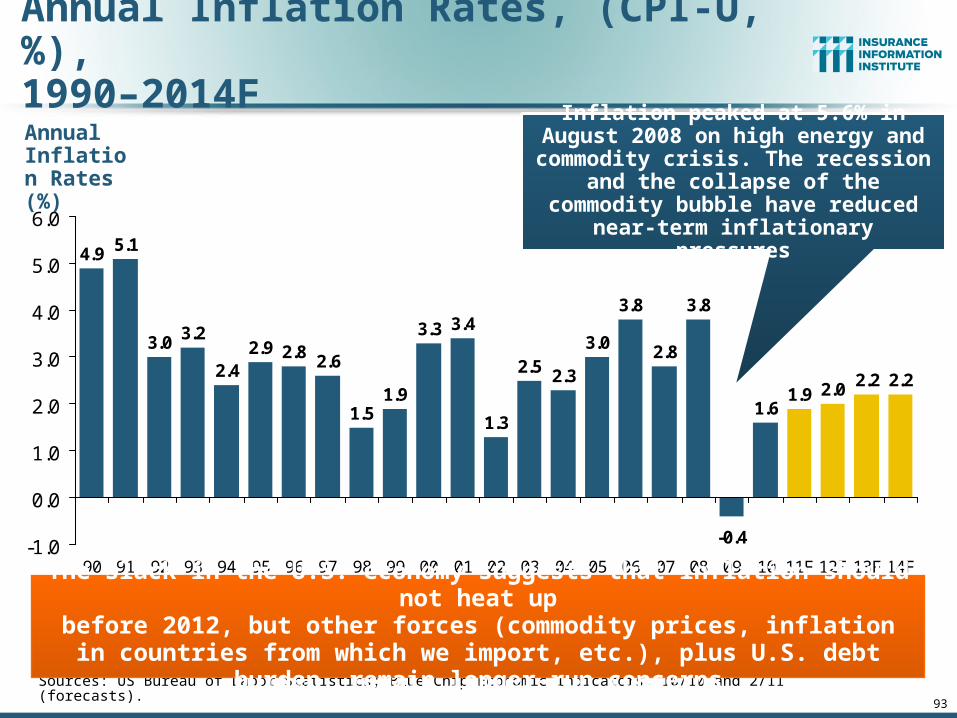
Annual Inflation Rates, (CPI-U, %),1990–2014F
2.8 2.6
1.51.9
3.3 3.4
1.3
2.5 2.3
3.0
3.8
2.8
3.8
-0.4
1.61.9 2.0 2.2 2.2
2.92.4
3.23.0
5.14.9
-1.0
0.0
1.0
2.0
3.0
4.0
5.0
6.0
90 91 92 93 94 95 96 97 98 99 00 01 02 03 04 05 06 07 08 09 10 11F 12F 13F 14F
Sources: US Bureau of Labor Statistics; Blue Chip Economic Indicators, 10/10 and 2/11 (forecasts).
The slack in the U.S. economy suggests that inflation should not heat upbefore 2012, but other forces (commodity prices, inflation in countries from which we import, etc.), plus U.S. debt burden, remain longer-run concerns
Annual Inflation Rates (%)
Inflation peaked at 5.6% in August 2008 on high energy and commodity crisis. The recession and the collapse of the commodity bubble have reduced near-
term inflationary pressures

P/C Insurance Claim Cost Drivers Grow Faster than even the Medical CPI Suggests
Source: Bureau of Labor Statistics; Insurance Information Institute.
1.6%1.0%
3.4%
8.8%
6.1%
3.3%
4.3%
3.1%
0%
3%
6%
9%
Overall CPI "Core" CPI Medical CPI InpatientHospitalServices
OutpatientHospitalServices
Physicians'Services
PrescriptionDrugs
Medical CareCommodities
Price Changes in 2010
Healthcare costs are a major liability, med pay, and PIP claim cost driver. They are likely to grow faster than the CPI for the next few years, at least
94
Excludes Food and Energy
Economic Drivers of P/C Insurance Exposures
95
Growth in the Wakeof the “Great Recession”
96
US Real GDP Growth*
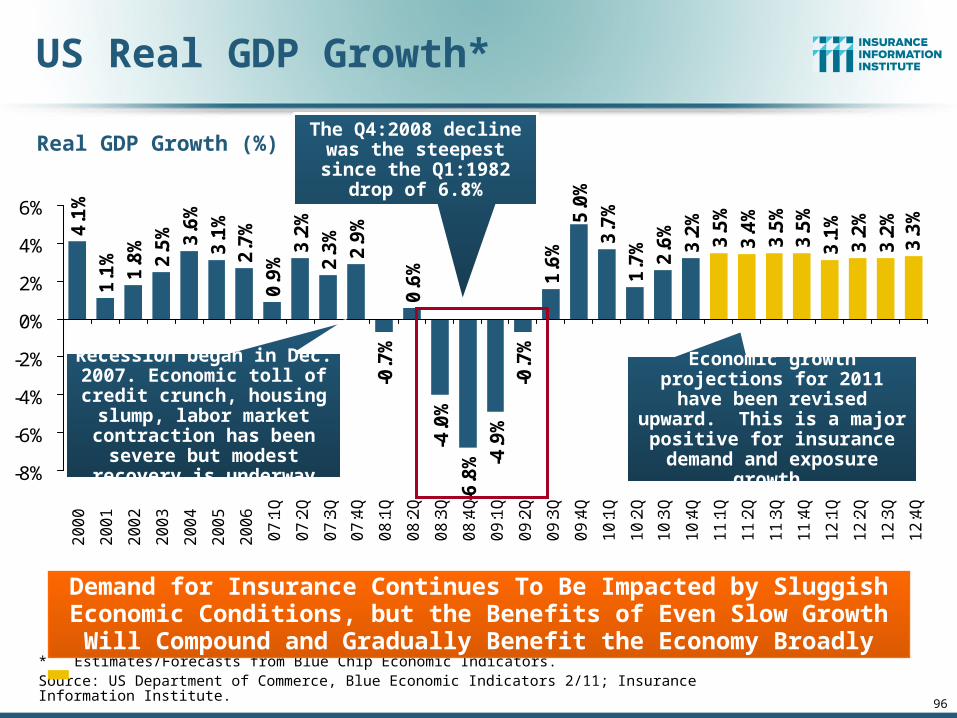
* Estimates/Forecasts from Blue Chip Economic Indicators.Source: US Department of Commerce, Blue Economic Indicators 2/11; Insurance Information Institute.
2.7
%
0.9
%
3.2
%
2.3
%
2.9
%
-0.7
%
0.6
%
-4.0
%
-6.8
% -4.9
%
-0.7
%
1.6
%
5.0
%
3.7
%
1.7
%
2.6
%
3.2
%
3.5
%
3.4
%
3.5
%
3.5
%
3.1
%
3.2
%
3.2
%3
.3%
4.1
%
1.1
%
1.8
%
2.5
% 3.6
%
3.1
%
-8%
-6%
-4%
-2%
0%
2%
4%
6%
2
00
0
2
00
1
2
00
2
2
00
3
2
00
4
2
00
5
2
00
6
07
:1Q
07
:2Q
07
:3Q
07
:4Q
08
:1Q
08
:2Q
08
:3Q
08
:4Q
09
:1Q
09
:2Q
09
:3Q
09
:4Q
10
:1Q
10
:2Q
10
:3Q
10
:4Q
11
:1Q
11
:2Q
11
:3Q
11
:4Q
12
:1Q
12
:2Q
12
:3Q
12
:4Q
Demand for Insurance Continues To Be Impacted by Sluggish Economic Conditions, but the Benefits of Even Slow Growth Will Compound and
Gradually Benefit the Economy Broadly
Real GDP Growth (%)
Recession began in Dec. 2007. Economic toll of credit
crunch, housing slump, labor market contraction has
been severe but modest recovery is underway
The Q4:2008 decline was the steepest since the Q1:1982 drop of 6.8%
Economic growth projections for 2011 have been revised
upward. This is a major positive for insurance demand
and exposure growth.
97
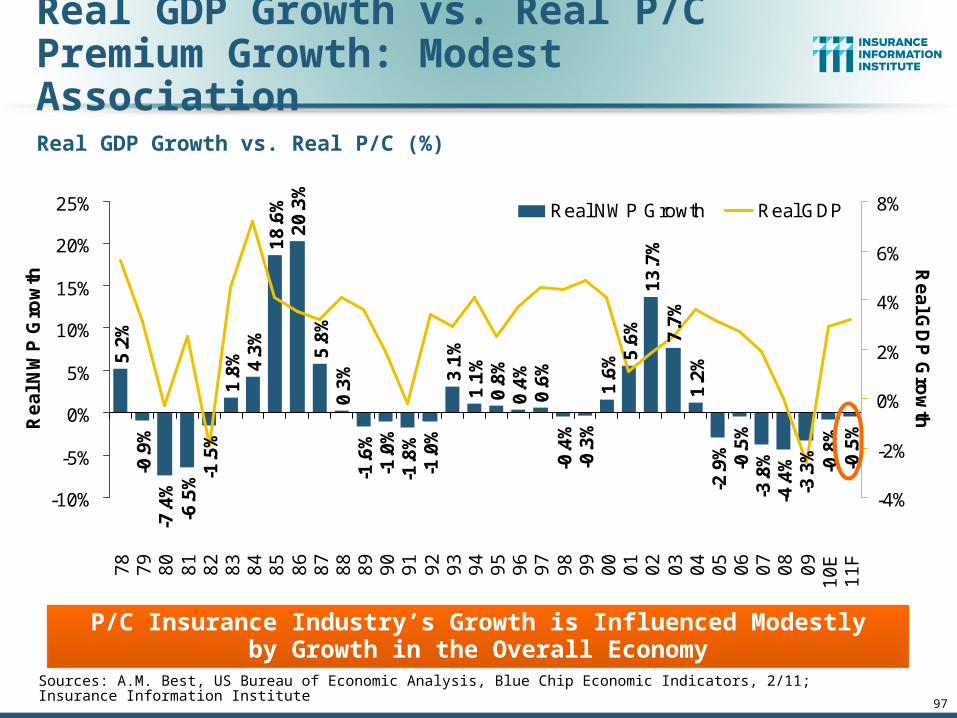
Real GDP Growth vs. Real P/CPremium Growth: Modest Association
Sources: A.M. Best, US Bureau of Economic Analysis, Blue Chip Economic Indicators, 2/11; Insurance Information Institute
4.3
%1
8.6
%2
0.3
%5
.8%
0.3
%-1
.6%
-1.0
%-1
.8%
-1.0
%3
.1%
1.1
%0
.8%
0.4
%0
.6%
-0.4
%-0
.3%
1.6
% 5.6
%1
3.7
%7
.7%
1.2
%-2
.9%
-0.5
%-3
.8%
-4.4
%-3
.3%
-0.8
%-0
.5%
5.2
%-0
.9%
-7.4
%-6
.5% -1
.5%
1.8
%
-10%
-5%
0%
5%
10%
15%
20%
25%
78
79
80
81
82
83
84
85
86
87
88
89
90
91
92
93
94
95
96
97
98
99
00
01
02
03
04
05
06
07
08
09
10
E1
1F
Re
al N
WP
Gro
wth
-4%
-2%
0%
2%
4%
6%
8%
Re
al G
DP
Gro
wth
Real NWP Growth Real GDP
P/C Insurance Industry’s Growth is Influenced Modestlyby Growth in the Overall Economy
Real GDP Growth vs. Real P/C (%)

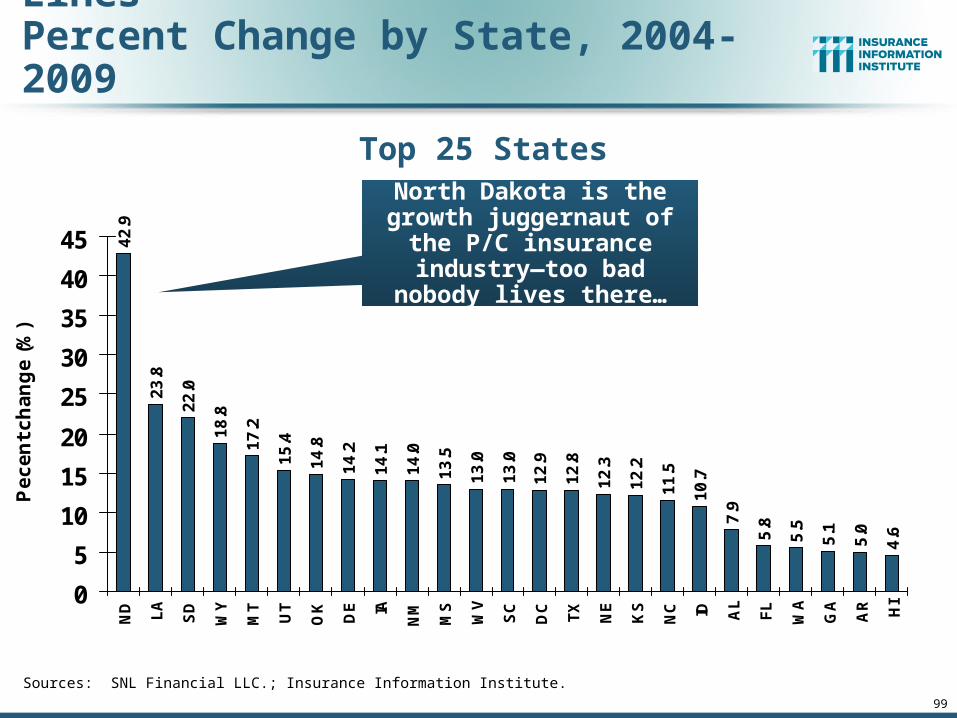
2011 Financial Overview State Economic Growth Varied in 2009
98
Mountain, Plains states still growing the fastest
Some Southeast states growing well, but others
among the weakest
99
Direct Premiums Written: All Lines Percent Change by State, 2004-2009
42
.9
23
.8
22
.0
18
.8
17
.2
15
.4
14
.8
14
.2
14
.1
14
.0
13
.5
13
.0
13
.0
12
.9
12
.8
12
.3
12
.2
11
.5
10
.7
7.9
5.8
5.5
5.1
5.0
4.6
0
5
10
15
20
25
30
35
40
45
ND LA
SD
WY
MT
UT
OK
DE IA
NM
MS
WV
SC
DC
TX
NE
KS
NC ID AL
FL
WA
GA
AR HI
Pe
ce
nt
ch
an
ge
(%
)
Sources: SNL Financial LLC.; Insurance Information Institute.
Top 25 States
North Dakota is the growth juggernaut of the P/C
insurance industry—too bad nobody lives there…

100
4.5
4.2
2.6
2.5
2.4
2.0
0.9
0.7
0.6
0.5
0.0
-0.1
-2.8
-3.1
-3.5
-3.7
-5.2
-8.2
-9.2
-14
.8
-15
.2
-0.5
-1.2
-1.6
-1.8
-2.4
-20
-15
-10
-5
0
5A
K
VA
TN
KY
MD
MO AZ
OR WI
NV
NY IN PA
MN
VT
CO
CT RI
NJ IL
ME
OH
NH
MA MI
CA
Pe
ce
nt
ch
an
ge
(%
)
Sources: SNL Financial LLC; Insurance Information Institute.
Bottom 25 States
States with the poorest performing economies also produced the most negative net change in premiums of
the past 5 years
Over the 5 years from 2004-2009, 15 states saw premiums shrink,one had no growth, and 4 others grew premiums by less than 1%
Direct Premiums Written: All Lines Percent Change by State, 2004-2009
Premium growth in NY totaled 0.0% from
2004 through 2009
101
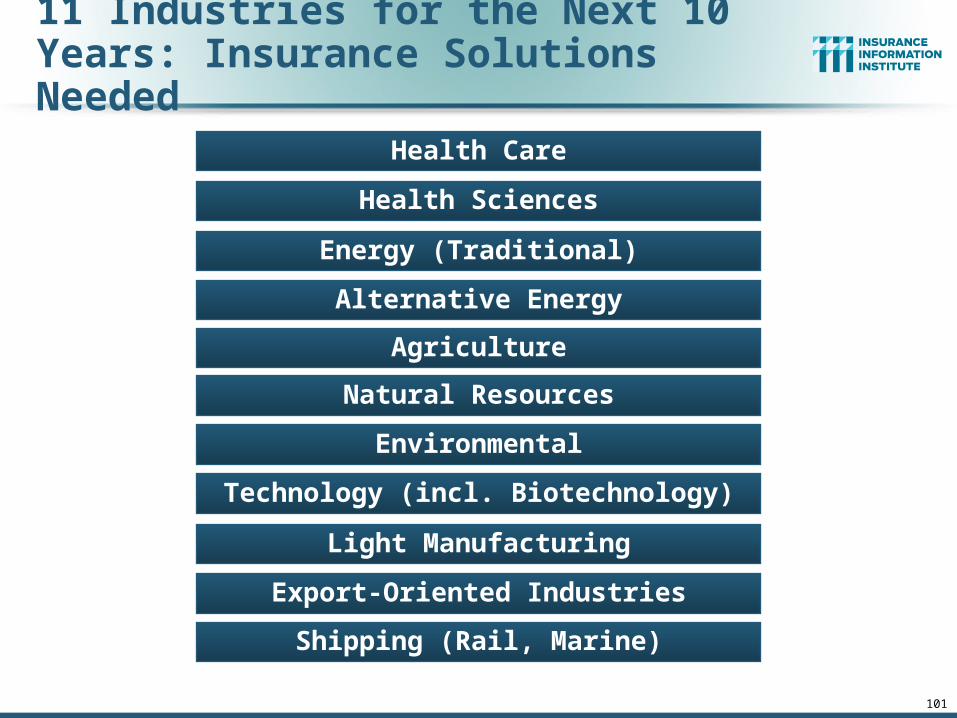
11 Industries for the Next 10 Years: Insurance Solutions Needed
Shipping (Rail, Marine)
Health Sciences
Health Care
Energy (Traditional)
Alternative Energy
Agriculture
Natural Resources
Environmental
Technology (incl. Biotechnology)
Light Manufacturing
Export-Oriented Industries
102
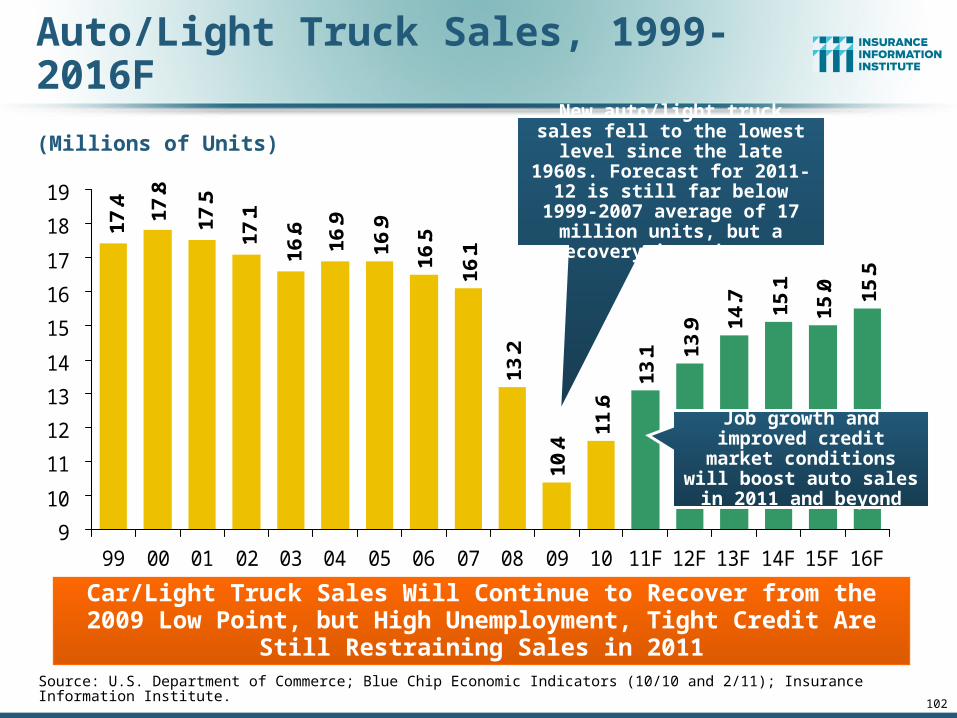
16.9
16.5
16.1
13.2
10.4
11.6
13.1 13
.9 14.7 15
.1
15.0 15
.5
16.9
16.617
.117.5
17.8
17.4
9
10
11
12
13
14
15
16
17
18
19
99 00 01 02 03 04 05 06 07 08 09 10 11F 12F 13F 14F 15F 16F
(Millions of Units)
Auto/Light Truck Sales, 1999-2016F
Source: U.S. Department of Commerce; Blue Chip Economic Indicators (10/10 and 2/11); Insurance Information Institute.
Car/Light Truck Sales Will Continue to Recover from the 2009 Low Point, but High Unemployment, Tight Credit Are Still Restraining Sales in 2011
New auto/light truck sales fell to the lowest level since the late 1960s. Forecast for 2011-12 is
still far below 1999-2007 average of 17 million units, but a recovery is underway.
Job growth and improved credit market conditions will boost auto sales in
2011 and beyond

103
(Millions of Units)
New Private Housing Starts, 1990-2016F
1.4
8
1.4
7 1.6
2
1.6
4
1.5
7
1.6
0 1.7
1 1.8
5 1.9
6 2.0
7
1.8
0
1.3
6
0.9
1
0.5
5
0.5
9
0.6
7
0.8
9
1.2
0 1.3
3 1.4
3
1.5
0
1.3
51.4
6
1.2
9
1.2
0
1.0
11.1
9
0.3
0.5
0.7
0.9
1.1
1.3
1.5
1.7
1.9
2.1
90 91 92 93 94 95 96 97 98 99 00 01 02 03 04 05 06 07 08 09 10 11F12F13F14F15F16F
Source: U.S. Department of Commerce; Blue Chip Economic Indicators (10/10 and 2/11); Insurance Information Institute.
Little Exposure Growth Likely for Homeowners Insurers Until 2012. Also Affects Commercial Insurers with Construction Risk Exposure, Surety
New home starts plunged
72% from 2005-2009; A
net annual decline of 1.49 million units, lowest since
records began in 1959
I.I.I. estimates that each incremental 100,000 decline in housing starts costs home insurers
$87.5 million in new exposure (gross premium). The net exposure loss in 2009 vs. 2005 is
estimated at about $1.3 billion
Job growth, improved credit
market conditions and demographics
will eventually boost home construction
106
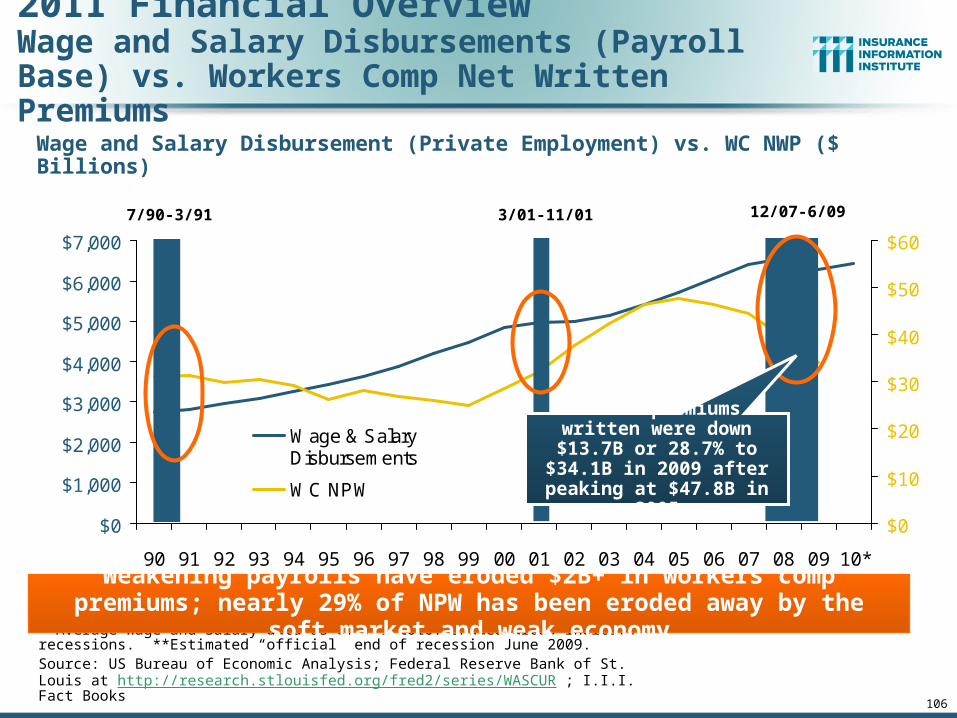
Wage and Salary Disbursement (Private Employment) vs. WC NWP ($ Billions)
2011 Financial Overview Wage and Salary Disbursements (Payroll Base) vs. Workers Comp Net Written Premiums
* Average Wage and Salary data as of 7/1/2010. Shaded areas indicate recessions. **Estimated “official” end of recession June 2009.Source: US Bureau of Economic Analysis; Federal Reserve Bank of St. Louis at http://research.stlouisfed.org/fred2/series/WASCUR ; I.I.I. Fact Books
Weakening payrolls have eroded $2B+ in workers comp premiums; nearly 29% of NPW has been eroded away by the soft market and weak economy
7/90-3/91 3/01-11/01
$0
$1,000
$2,000
$3,000
$4,000
$5,000
$6,000
$7,000
90 91 92 93 94 95 96 97 98 99 00 01 02 03 04 05 06 07 08 09 10*
$0
$10
$20
$30
$40
$50
$60
Wage & SalaryDisbursements
WC NPW
WC net premiums written were down $13.7B or 28.7%
to $34.1B in 2009 after peaking at $47.8B in 2005
12/07-6/09
66%
68%
70%
72%
74%
76%
78%
80%
82%
Ma
r 0
1
Ju
n 0
1
Se
p 0
1
De
c 0
1
Ma
r 0
2
Ju
n 0
2
Se
p 0
2
De
c 0
2
Ma
r 0
3
Ju
n 0
3
Se
p 0
3
De
c 0
3
Ma
r 0
4
Ju
n 0
4
Se
p 0
4
De
c 0
4
Ma
r 0
5
Ju
n 0
5
Se
p 0
5
De
c 0
5
Ma
r 0
6
Ju
n 0
6
Se
p 0
6
De
c 0
6
Ma
r 0
7
Ju
n 0
7
Se
p 0
7
De
c 0
7
Ma
r 0
8
Ju
n 0
8
Se
p 0
8
De
c 0
8
Ma
r 0
9
Ju
n 0
9
Se
p 0
9
De
c 0
9
Ma
r 1
0
Ju
n 1
0
Se
p 1
0
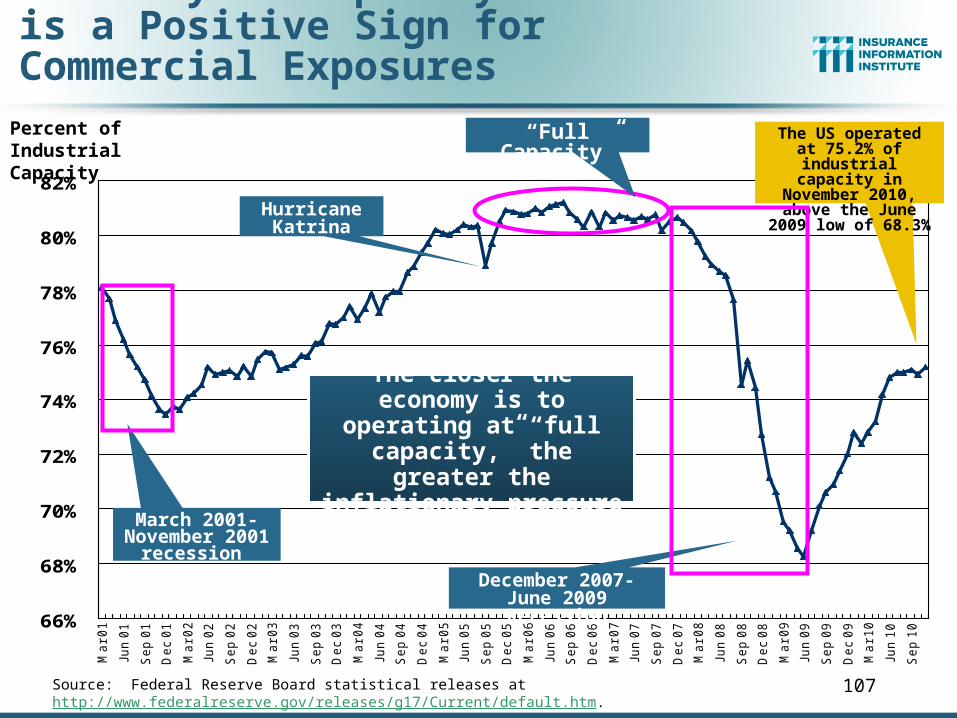
Recovery in Capacity Utilization is a Positive Sign for Commercial Exposures
Source: Federal Reserve Board statistical releases at http://www.federalreserve.gov/releases/g17/Current/default.htm. 107
Percent of Industrial Capacity
Hurricane Katrina
March 2001-November 2001
recession
“Full Capacity”
The closer the economy is to operating at “full
capacity,” the greater the inflationary pressure
The US operated at 75.2% of industrial
capacity in November 2010, above the June
2009 low of 68.3%
December 2007-June 2009 Recession
108
43,6
9448
,125
69,3
0062
,436
64,0
04 71,2
77 81,2
3582
,446
63,8
5363
,235
64,8
5371
,549
70,6
4362
,304
52,3
7451
,959
53,5
4954
,027
44,3
6737
,884
35,4
7240
,099
38,5
4035
,037
34,3
1739
,201
19,6
95 28,3
2243
,546
60,8
3743
,016
0
10,000
20,000
30,000
40,000
50,000
60,000
70,000
80,000
90,000
80 81 82 83 84 85 86 87 88 89 90 91 92 93 94 95 96 97 98 99 00 01 02 03 04 05 06 07 08 0910
:3Q
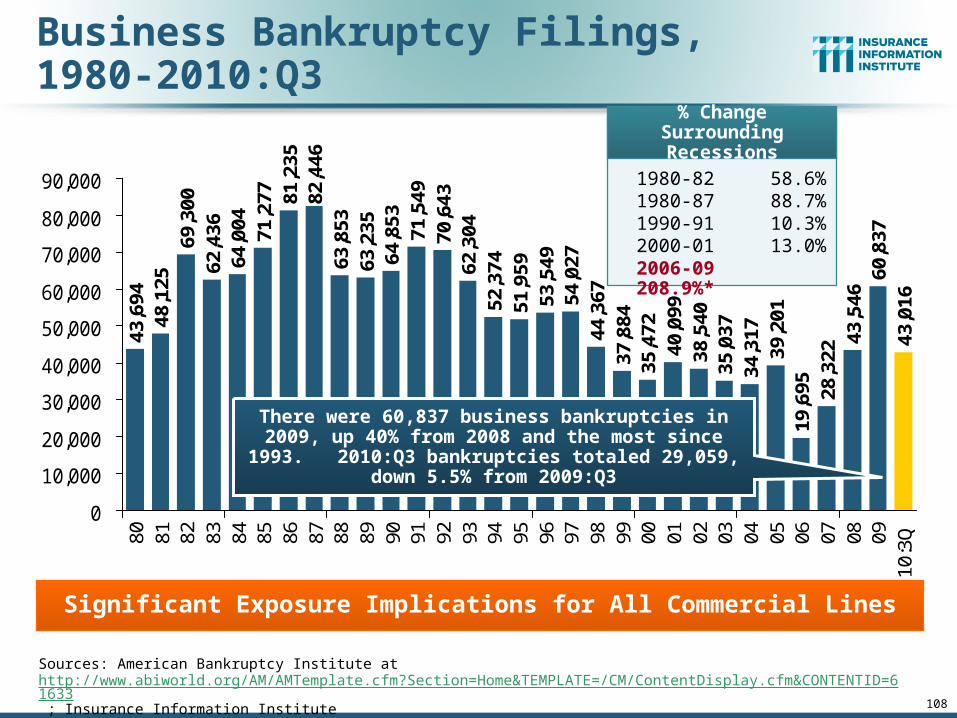
Business Bankruptcy Filings,1980-2010:Q3
Sources: American Bankruptcy Institute at http://www.abiworld.org/AM/AMTemplate.cfm?Section=Home&TEMPLATE=/CM/ContentDisplay.cfm&CONTENTID=61633 ; Insurance Information Institute
Significant Exposure Implications for All Commercial Lines
There were 60,837 business bankruptcies in 2009, up 40% from 2008 and the most since 1993. 2010:Q3
bankruptcies totaled 29,059, down 5.5% from 2009:Q3
% Change Surrounding Recessions
1980-82 58.6%1980-87 88.7%1990-91 10.3%2000-01 13.0%2006-09 208.9%*
111
Labor Market Trends
Massive Job Losses Sapped the Economy and Commercial/Personal
Lines Exposure, But Trend is Improving
112
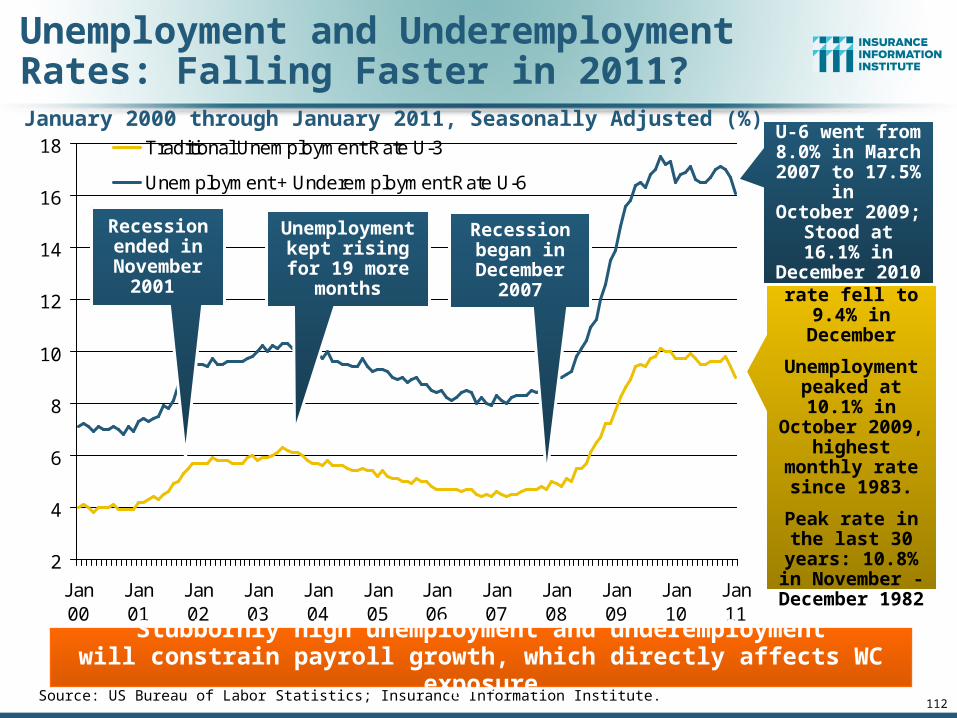
Unemployment and Underemployment Rates: Falling Faster in 2011?
2
4
6
8
10
12
14
16
18
Jan00
Jan01
Jan02
Jan03
Jan04
Jan05
Jan06
Jan07
Jan08
Jan09
Jan10
Jan11
Traditional Unemployment Rate U-3
Unemployment + Underemployment Rate U-6
Unemployment rate fell to 9.4%
in December
Unemployment peaked at 10.1% in October 2009, highest monthly rate since 1983.
Peak rate in the last 30 years:
10.8% in November -
December 1982
Source: US Bureau of Labor Statistics; Insurance Information Institute.
U-6 went from 8.0% in March
2007 to 17.5% in October 2009; Stood at 16.1%
in December 2010
January 2000 through January 2011, Seasonally Adjusted (%)
Recession ended in
November 2001
Unemployment kept rising for
19 more months
Recession began in
December 2007
Stubbornly high unemployment and underemploymentwill constrain payroll growth, which directly affects WC exposure

18
67
92
13
65 1
27
42
15
-10
9-1
46
5 97
23
-12
-85 -58
-16
1-2
53
-23
0-2
57
-34
7-4
56
-54
7-7
34 -66
7-8
06 -7
07
-74
4 -64
9-3
34
-45
2-2
97 -2
15
-18
6-2
62
75
-83
16 6
2
24
15
1 61 1
17
14
31
12 1
93
12
81
39
50
15
8
(1,000)
(800)
(600)
(400)
(200)
0
200
400
Jan
-07
Fe
b-0
7M
ar-
07
Ap
r-0
7M
ay-
07
Jun
-07
Jul-
07
Au
g-0
7S
ep
-07
Oct
-07
No
v-0
7D
ec-
07
Jan
-08
Fe
b-0
8M
ar-
08
Ap
r-0
8M
ay-
08
Jun
-08
Jul-
08
Au
g-0
8S
ep
-08
Oct
-08
No
v-0
8D
ec-
08
Jan
-09
Fe
b-0
9M
ar-
09
Ap
r-0
9M
ay-
09
Jun
-09
Jul-
09
Au
g-0
9S
ep
-09
Oct
-09
No
v-0
9D
ec-
09
Jan
-10
Fe
b-1
0M
ar-
10
Ap
r-1
0M
ay-
10
Jun
-10
Jul-
10
Au
g-1
0S
ep
-10
Oct
-10
No
v-1
0D
ec-
10
Jan
-11
Monthly Change in Private Employment
January 2008 through January 2011* (Thousands)
Private Employers Added 1.411 million Jobs in 2010 After Having Shed 4.66 Million Jobs in 2009 and 3.81 Million in 2008
Source: US Bureau of Labor Statistics: http://www.bls.gov/ces/home.htm; Insurance Information Institute
Monthly Losses in Dec. 08–Mar. 09 Were
the Largest in the Post-WW II Period
Private employers added jobs in every month in 2010 for a total of
1.346 million for the year
113,000 private sector jobs were created in
December

115
US Unemployment Rate
4.5
%
4.5
%
4.6
%
4.8
%
4.9
% 5.4
% 6.1
%
6.9
%
8.1
%
9.3
%
9.6
% 10
.0%
9.7
%
9.6
%
9.6
%
9.5
%
9.4
%
9.2
%
9.0
%
8.8
%
8.6
%
8.5
%
8.3
%
9.6
%
4.0%
5.0%
6.0%
7.0%
8.0%
9.0%
10.0%
11.0%
07
:Q1
07
:Q2
07
:Q3
07
:Q4
08
:Q1
08
:Q2
08
:Q3
08
:Q4
09
:Q1
09
:Q2
09
:Q3
09
:Q4
10
:Q1
10
:Q2
10
:Q3
10
:Q4
11
:Q1
11
:Q2
11
:Q3
11
:Q4
12
:Q1
12
:Q2
12
:Q3
12
:Q4
Rising unemployment eroded payrolls
and workers comp’s
exposure base.
Unemployment peaked at 10% in
late 2009.
* = actual; = forecastsSources: US Bureau of Labor Statistics; Blue Chip Economic Indicators (2/11); Insurance Information Institute
2007:Q1 to 2012:Q4F*
Unemployment forecasts remain stubbornly high
through 2011, but still imply millions of new
jobs will created.
117
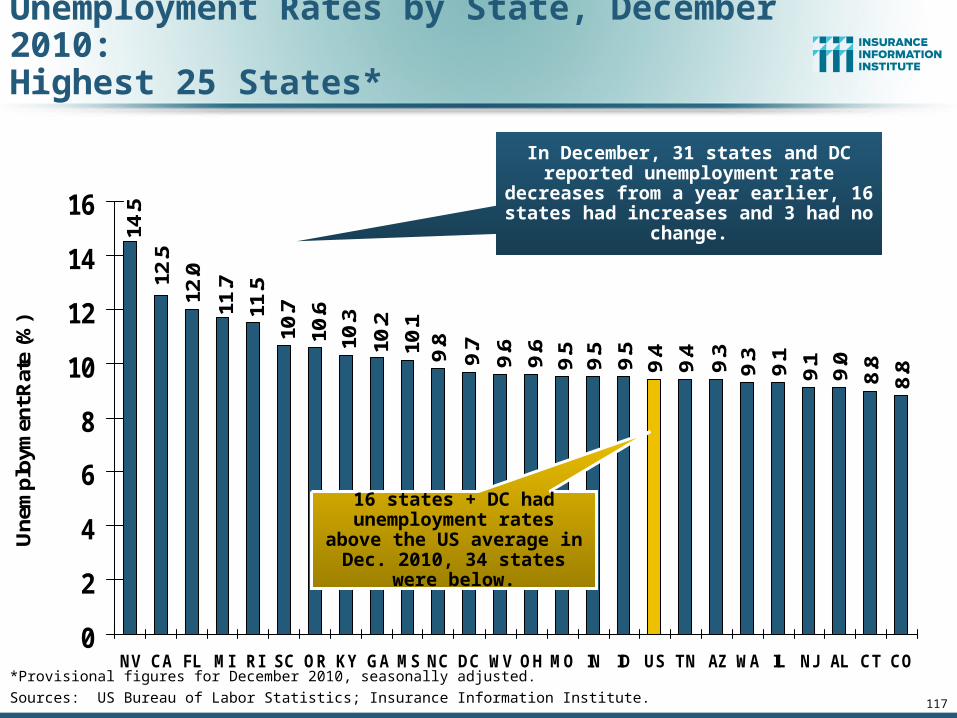
Unemployment Rates by State, December 2010:Highest 25 States*
8.89.
59.
59.7
9.5
9.6
9.6
9.3
9.1
9.3
8.89.
4
9.0
9.19.4
10.611
.5
9.810
.110
.2
10.3
10.7
12.5
12.0
11.7
14.5
0
2
4
6
8
10
12
14
16
NV CA FL MI RI SC OR KY GA MS NC DC WV OH MO IN ID US TN AZ WA IL NJ AL CT CO
Une
mpl
oym
ent R
ate
(%)
*Provisional figures for December 2010, seasonally adjusted.
Sources: US Bureau of Labor Statistics; Insurance Information Institute.
In December, 31 states and DC reported unemployment rate decreases from a
year earlier, 16 states had increases and 3 had no change.
16 states + DC had unemployment rates above
the US average in Dec. 2010, 34 states were below.
118
6.7
6.4
6.3
5.8
6.8
6.87.
37.
4
4.44.6
5.5
7.07.2
3.8
6.4
8.1
8.2
7.5
7.57.
98.08.28.
5
8.5
8.38.
5
0
2
4
6
8
10
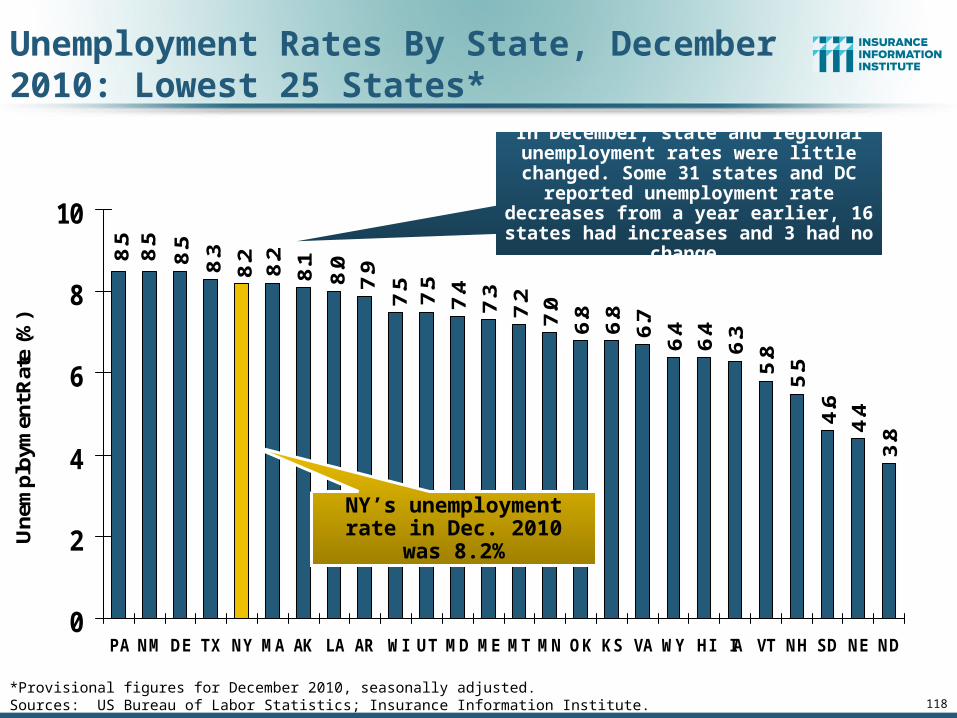
PA NM DE TX NY MA AK LA AR WI UT MD ME MT MN OK KS VA WY HI IA VT NH SD NE ND
Une
mpl
oym
ent R
ate
(%)
Unemployment Rates By State, December 2010: Lowest 25 States*
*Provisional figures for December 2010, seasonally adjusted.Sources: US Bureau of Labor Statistics; Insurance Information Institute.
In December, state and regional unemployment rates were little changed.
Some 31 states and DC reported unemployment rate decreases from a
year earlier, 16 states had increases and 3 had no change.
NY’s unemployment rate in Dec. 2010 was 8.2%

123
Catastrophic Loss –Catastrophe Losses Trends Are
Trending Adversely
124
$8
.3
$7
.4
$2
.6 $1
0.1
$8
.3
$4
.6
$2
6.5
$5
.9 $1
2.9 $
27
.5
$6
1.9
$9
.2
$6
.7
$2
7.1
$1
0.6
$1
3.6
$1
00
.0
$7
.5
$2
.7
$4
.7
$2
2.9
$5
.5 $1
6.9
$0
$20
$40
$60
$80
$100
$120
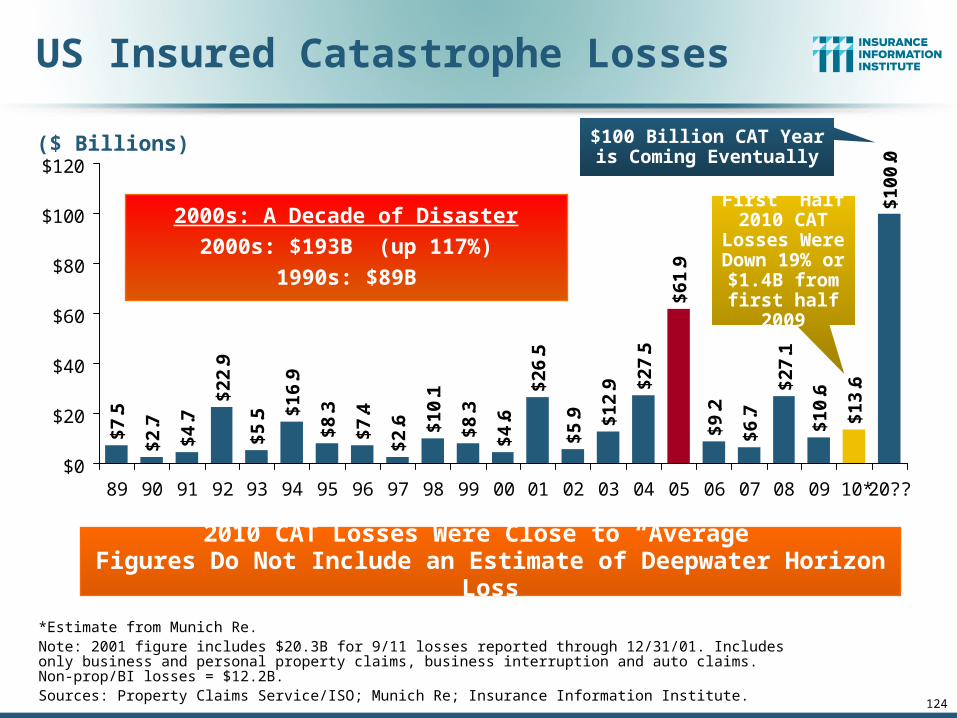
89 90 91 92 93 94 95 96 97 98 99 00 01 02 03 04 05 06 07 08 09 10*20??
US Insured Catastrophe Losses
*Estimate from Munich Re.Note: 2001 figure includes $20.3B for 9/11 losses reported through 12/31/01. Includes only business and personal property claims, business interruption and auto claims. Non-prop/BI losses = $12.2B.Sources: Property Claims Service/ISO; Munich Re; Insurance Information Institute.
2010 CAT Losses Were Close to “Average” Figures Do Not Include an Estimate of Deepwater Horizon Loss
$100 Billion CAT Year is Coming Eventually
First Half 2010 CAT
Losses Were Down 19% or $1.4B from
first half 2009
($ Billions)
2000s: A Decade of Disaster
2000s: $193B (up 117%)
1990s: $89B
125
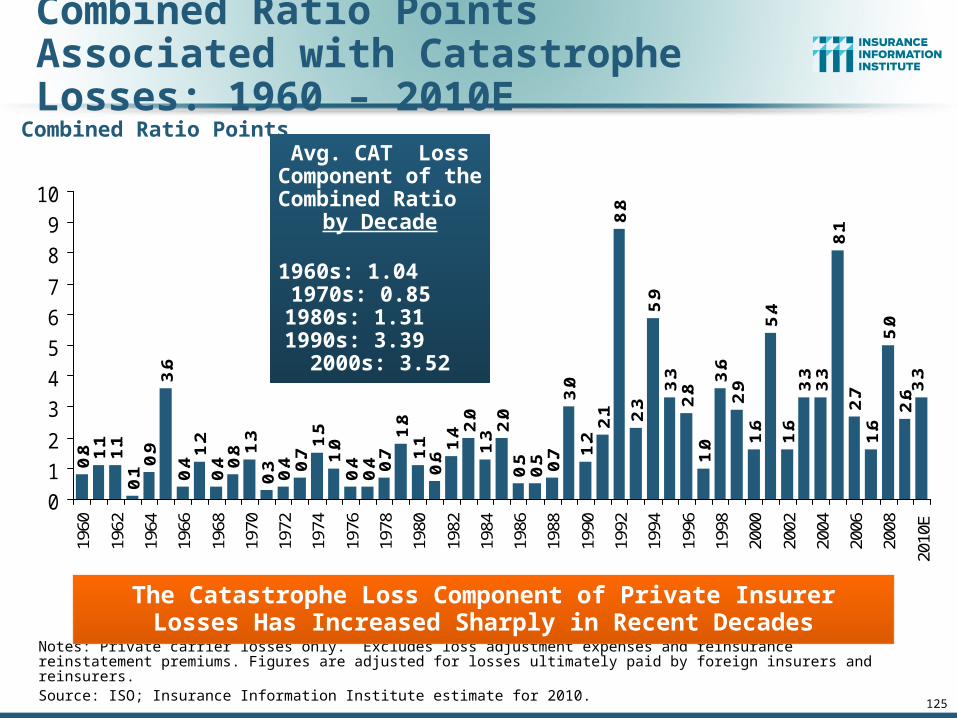
Combined Ratio Points Associated with Catastrophe Losses: 1960 – 2010E
Notes: Private carrier losses only. Excludes loss adjustment expenses and reinsurance reinstatement premiums. Figures are adjusted for losses ultimately paid by foreign insurers and reinsurers.Source: ISO; Insurance Information Institute estimate for 2010.
0.4
1.2
0.4 0.
8 1.3
0.3 0.4 0.
71.
51.
00.
40.
4 0.7
1.8
1.1
0.6
1.4 2.
01.
3 2.0
0.5
0.5 0.7
3.0
1.2
2.1
8.8
2.3
5.9
3.3
2.8
1.0
3.6
2.9
1.6
5.4
1.6
3.3
3.3
8.1
2.7
1.6
5.0
2.6 3.
33.6
0.9
0.1
1.1
1.1
0.8
0
1
2
3
4
5
6
7
8
9
10
1960
1962
1964
1966
1968
1970
1972
1974
1976
1978
1980
1982
1984
1986
1988
1990
1992
1994
1996
1998
2000
2002
2004
2006
2008
2010
E
The Catastrophe Loss Component of Private Insurer Losses Has Increased Sharply in Recent Decades
Avg. CAT Loss Component of the Combined Ratio
by Decade
1960s: 1.04 1970s: 0.85 1980s: 1.31 1990s: 3.39
2000s: 3.52
Combined Ratio Points

Nu
mb
er
Geophysical (earthquake, tsunami, volcanic activity)
Climatological (temperature extremes, drought, wildfire)
Meteorological (storm)
Hydrological (flood, mass movement)
Natural Disasters in the United States, 1980 – 2010Number of Events (Annual Totals 1980 – 2010)
Source: MR NatCatSERVICE 126
There were a record 247 natural disaster events in
the US in 2010
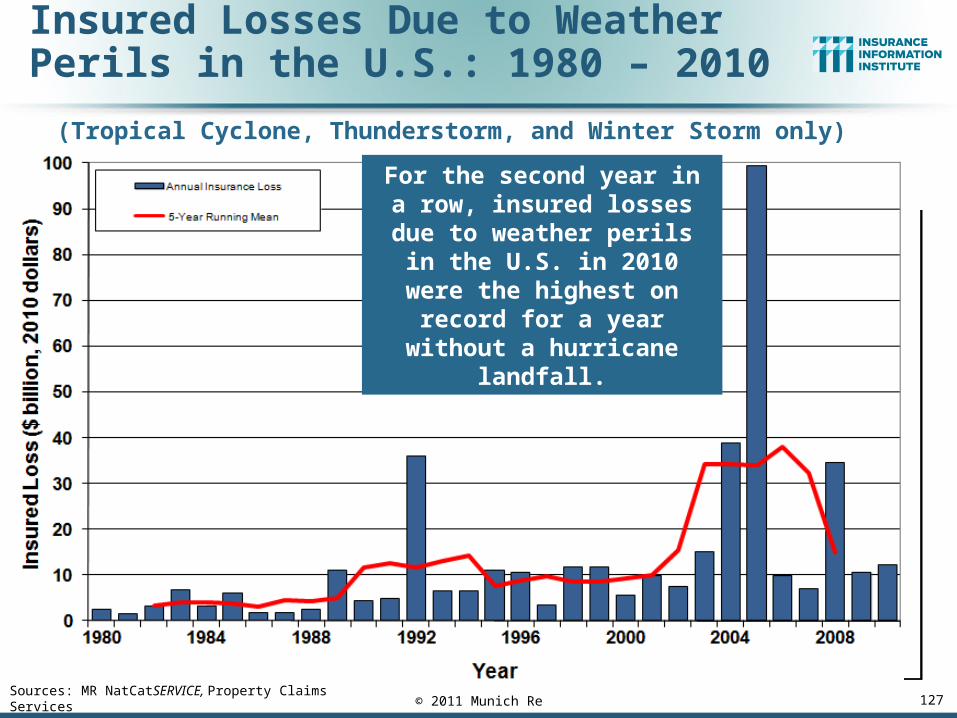
For the second year in a row, insured losses due to
weather perils in the U.S. in 2010 were the highest on
record for a year without a hurricane landfall.
Insured Losses Due to Weather Perils in the U.S.: 1980 – 2010
Sources: MR NatCatSERVICE, Property Claims Services 127© 2011 Munich Re
(Tropical Cyclone, Thunderstorm, and Winter Storm only)
Source: Property Claims Service, MR NatCatSERVICE
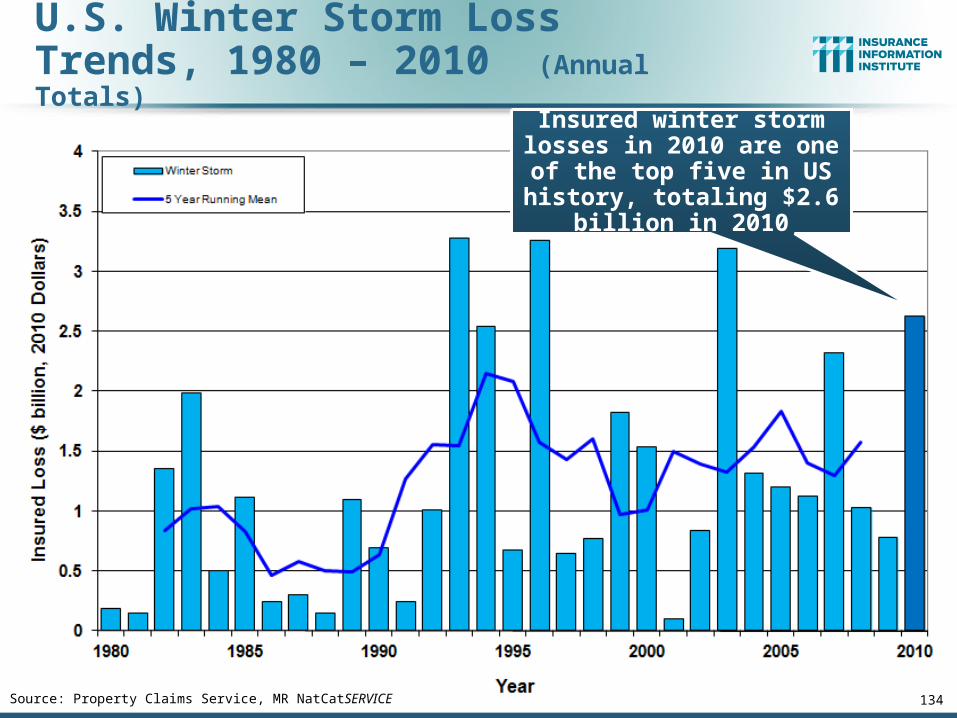
U.S. Winter Storm Loss Trends, 1980 – 2010 (Annual Totals)
134
Insured winter storm losses in 2010 are one of the top five in US history, totaling
$2.6 billion in 2010

U.S. Thunderstorm Loss Trends, 1980 – 2010 (Annual Totals)
Source: Property Claims Service, MR NatCatSERVICE 135
Thunderstorm losses in 2010 totaled $9.5 billion, the
3rd highest ever
Average thunderstorm losses have now quintupled since
the early 1980s
Hurricanes get all the headlines, but thunderstorms are consistent
producers of large scale loss
www.iii.org
Thank you for your timeand your attention!
Twitter: twitter.com/bob_hartwigDownload: www.iii.org/presentations
Insurance Information Institute Online: