Outperform ©Qx Mµ& k 9® è +-b® b =ô 7ÍQ¢...
7
Materials | Company Bringing China to the World SWS Research Co. Ltd is a subsidiary of ShenwanHongyuan Securities. 99 East Nanjing Road, Shanghai | +86 21 2329 7818 www.swsresearch.com 30 October, 2017 Outperform Downgrade 业绩符合预期,增速逐步放缓 安徽海螺 (914:HK) Market Data: 27 Oct Closing Price (HK$) 33.0 Price Target (HK$) 39.0 HSCEI 11643 HSCCI 4395 52-week High/Low (HK$) 34.15/22.55 Market Cap (USD Mn) 20787 Market Cap (HK$ Mn) 162210 Shares Outstanding (Mn) 5,299 Exchange Rate (RMB-HK$) 1.27 Price Performance Chart: Source: Bloomberg Analyst Hunter Du BIW266 A0230517100001 [email protected] (+86) 21 2329 7241 Financial summary and valuation 2015 2016 2017E 2018E 2019E Revenue (Rmbm) 50,976 55,932 64,980 68,620 69,090 YOY (%) (16.1) 9.7 16.2 5.6 0.7 Net income (Rmbm) 7,516 8,574 14,897 15,375 15,411 YOY (%) (31.6) 14.1 73.7 3.2 0.2 EPS (Rmb) 1.42 1.62 2.81 2.90 2.91 Diluted EPS (Rmb) 1.42 1.62 2.81 2.90 2.91 ROE (%) 10.72 11.24 17.47 16.27 14.86 Debt/asset (%) 18.5 16.1 15.0 15.2 14.2 Dividend Yield (%) 1.65 2.18 4.33 4.47 4.48 P/E (x) 18.4 16.1 9.3 9.0 9.0 P/B (x) 2.0 1.8 1.6 1.5 1.3 EV/EBITDA (x) 8.3 7.2 5.0 4.6 4.1 Note: Diluted EPS is calculated as if all outstanding convertible securities, such as convertible preferred shares, convertible debentures, stock options and warrants, were exercised. P/E is calculated as closing price divided by each year’s EPS. 安徽海螺公布了 17 年第三季度的利润为人民币 30.9 亿元 EPS 为 0.58 元(同比 增长 18%,3Q16 的 EPS 为人民币 0.49 元)。该业绩符合我们之前的预期,印证了 水泥行业的毛利强劲复苏观点。该利润占海螺 17 年全年预测利润的 21%。 3Q17 的高毛利保持稳定。在 17 年第三季度,安徽海螺销量为 77 百万吨水泥和熟 料(同比增长 7%),吨售价为人民币 237 元(环比减少 7 元,同比增长 42 元)。吨成本为人民币 162 元,环比不变,同比增加了 42 元,从而 3Q17 的吨毛 利 74 元,环比减少 8 元,同比增长了人民币 9 元。海螺 17 年三季度的强势表现 再次让我们确认了基建和房产需求稳定带动水泥毛利复苏,以及供给侧改革引起 的限产和价格协同所致的原因。同时,公司高销量确保了在同业竞争对手面前保 持份额优势 强劲现金资产 海螺 2017 年三季度净现金为人民币 107 亿元,对比第一季度人 民币 16 亿元,对比 2Q17 净现金 45 亿元,净负债率为-12.5%,对比 2Q17 的-6%。 公司有 207 亿人民币现金在手(第二季度为 205 亿元),为未来潜在并购或提高分 红率增大概率 17 年四季度毛利增长,增长率减速。尽管基建和房产需求将会在 17 年下半年减 速,我们预计总体需求会渐渐减弱,而海螺由于其在华东和西北部(需求强劲) 的强大优势,所受影响有限。随着、旺季的到来,我们看见水泥价格已经开始在 华东上升,吨售价已经上涨人民币 50 元。由于华东沿江库存低位,且需求稳定, 我们预计华东水泥价格将在旺季四季度持续上涨。由于严格的政府规制导致海外 扩张减速,基于公司当下充裕的现金状况,我们预计海螺的股息支付率会增加 5%。不过,由于海螺卓越水泥成绩由去年下半年开始提速,我们预计公司增长率 会在 4 季度继续放缓。 降至增持。我们对水泥毛利复苏乐观,海螺水泥凭借其强劲的资产负债和成本优 势保持增长,但是现估值吨企业价值人民币 518 元,已经恢复到历史高位。我们 微调 17E 每股净利润从人民币 2.92 元至 2.81 元(同比增长 74%),18E 每股净 利润 3.12 元下调至 2.90 元(同比增长 3%),我们上调目标价从港币 34.5 元至 39 元,对应 17 年吨企业价值人民币 610 元。基于 18.2%的上行空间,我们下调至 增持评级 The company does not hold any equities or derivatives of the listed company mentioned in this report (“target”), but then we shall provide financial advisory services subject to the relevant laws and regulations. Any affiliates of the company may hold equities of the target, which may exceed 1 percent of issued shares subject to the relevant laws and regulations. The company may also provide investment banking services to the target. The Company fulfills its duty of disclosure within its sphere of knowledge. The clients may contact [email protected] for relevant disclosure materials or log into www.swsresearch.com under disclosure column for further information. The clients shall have a comprehensive understanding of the disclosure and disclaimer upon the last page.
Transcript of Outperform ©Qx Mµ& k 9® è +-b® b =ô 7ÍQ¢...
Materials | Company Bringing China to the World
SWS Research Co. Ltd is a subsidiary of ShenwanHongyuan Securities. 99 East Nanjing Road, Shanghai | +86 21 2329 7818 www.swsresearch.com
30 October, 2017
Outperform Downgrade
业绩符合预期,增速逐步放缓
安徽海螺 (914:HK) Market Data: 27 Oct
Closing Price (HK$) 33.0
Price Target (HK$) 39.0
HSCEI 11643
HSCCI 4395
52-week High/Low (HK$) 34.15/22.55
Market Cap (USD Mn) 20787
Market Cap (HK$ Mn) 162210
Shares Outstanding (Mn) 5,299
Exchange Rate (RMB-HK$) 1.27
Price Performance Chart:
Source: Bloomberg
Analyst Hunter Du BIW266 A0230517100001 [email protected] (+86) 21 2329 7241
Financial summary and valuation 2015 2016 2017E 2018E 2019E
Revenue (Rmbm) 50,976 55,932 64,980 68,620 69,090 YOY (%) (16.1) 9.7 16.2 5.6 0.7 Net income (Rmbm) 7,516 8,574 14,897 15,375 15,411 YOY (%) (31.6) 14.1 73.7 3.2 0.2 EPS (Rmb) 1.42 1.62 2.81 2.90 2.91 Diluted EPS (Rmb) 1.42 1.62 2.81 2.90 2.91 ROE (%) 10.72 11.24 17.47 16.27 14.86 Debt/asset (%) 18.5 16.1 15.0 15.2 14.2 Dividend Yield (%) 1.65 2.18 4.33 4.47 4.48 P/E (x) 18.4 16.1 9.3 9.0 9.0 P/B (x) 2.0 1.8 1.6 1.5 1.3 EV/EBITDA (x) 8.3 7.2 5.0 4.6 4.1 Note: Diluted EPS is calculated as if all outstanding convertible securities, such as convertible preferred shares, convertible
debentures, stock options and warrants, were exercised. P/E is calculated as closing price divided by each year’s EPS.
安徽海螺公布了 17 年第三季度的利润为人民币 30.9 亿元 EPS 为 0.58元(同比
增长 18%,3Q16 的 EPS为人民币 0.49 元)。该业绩符合我们之前的预期,印证了
水泥行业的毛利强劲复苏观点。该利润占海螺 17 年全年预测利润的 21%。
3Q17 的高毛利保持稳定。在 17 年第三季度,安徽海螺销量为 77 百万吨水泥和熟
料(同比增长 7%),吨售价为人民币 237 元(环比减少 7 元,同比增长 42
元)。吨成本为人民币 162 元,环比不变,同比增加了 42 元,从而 3Q17 的吨毛
利 74 元,环比减少 8 元,同比增长了人民币 9 元。海螺 17 年三季度的强势表现
再次让我们确认了基建和房产需求稳定带动水泥毛利复苏,以及供给侧改革引起
的限产和价格协同所致的原因。同时,公司高销量确保了在同业竞争对手面前保
持份额优势
强劲现金资产 海螺 2017 年三季度净现金为人民币 107 亿元,对比第一季度人
民币 16 亿元,对比 2Q17 净现金 45 亿元,净负债率为-12.5%,对比 2Q17 的-6%。
公司有 207 亿人民币现金在手(第二季度为 205 亿元),为未来潜在并购或提高分
红率增大概率
17 年四季度毛利增长,增长率减速。尽管基建和房产需求将会在 17 年下半年减
速,我们预计总体需求会渐渐减弱,而海螺由于其在华东和西北部(需求强劲)
的强大优势,所受影响有限。随着、旺季的到来,我们看见水泥价格已经开始在
华东上升,吨售价已经上涨人民币 50 元。由于华东沿江库存低位,且需求稳定,
我们预计华东水泥价格将在旺季四季度持续上涨。由于严格的政府规制导致海外
扩张减速,基于公司当下充裕的现金状况,我们预计海螺的股息支付率会增加
5%。不过,由于海螺卓越水泥成绩由去年下半年开始提速,我们预计公司增长率
会在 4 季度继续放缓。
降至增持。我们对水泥毛利复苏乐观,海螺水泥凭借其强劲的资产负债和成本优
势保持增长,但是现估值吨企业价值人民币 518 元,已经恢复到历史高位。我们
微调 17E 每股净利润从人民币 2.92 元至 2.81元(同比增长 74%),18E 每股净
利润 3.12 元下调至 2.90元(同比增长 3%),我们上调目标价从港币 34.5 元至
39 元,对应 17 年吨企业价值人民币 610 元。基于 18.2%的上行空间,我们下调至
增持评级
The company does not hold any equities or
derivatives of the listed company
mentioned in this report (“target”), but then
we shall provide financial advisory services
subject to the relevant laws and
regulations. Any affiliates of the company
may hold equities of the target, which may
exceed 1 percent of issued shares subject
to the relevant laws and regulations. The
company may also provide investment
banking services to the target. The
Company fulfills its duty of disclosure within
its sphere of knowledge. The clients may
contact [email protected] for
relevant disclosure materials or log into
www.swsresearch.com under disclosure
column for further information. The clients
shall have a comprehensive understanding
of the disclosure and disclaimer upon the
last page.
October 12, 2010 Building Materials | Company Research
Please refer to the last page for important disclosures Page 1
January 12,2015 Food, Beverage & Tobacco | Company Research
Oct 30, 2017 Materials | Company Research
Anhui Conch Cement posted 3Q17 net profit of Rmb3.1bn and EPS of Rmb0.58 (+18% YoY), representing 21% of our 17E forecast and confirming our positive view on margin recovery in the cement industry. We revise down our EPS forecasts from Rmb2.92 to Rmb2.81 in 17E (+73% YoY), from Rmb3.12 to Rmb2.90 in 18E (+3% YoY), and from Rmb3.28 to Rmb2.91 in 19E (flattish YoY). We raise our target price from HK$34.50 to HK$39.00, representing a 17E EV/capacity of Rmb610/t. With 18.2% upside, we downgrade our rating from BUY to Outperform.
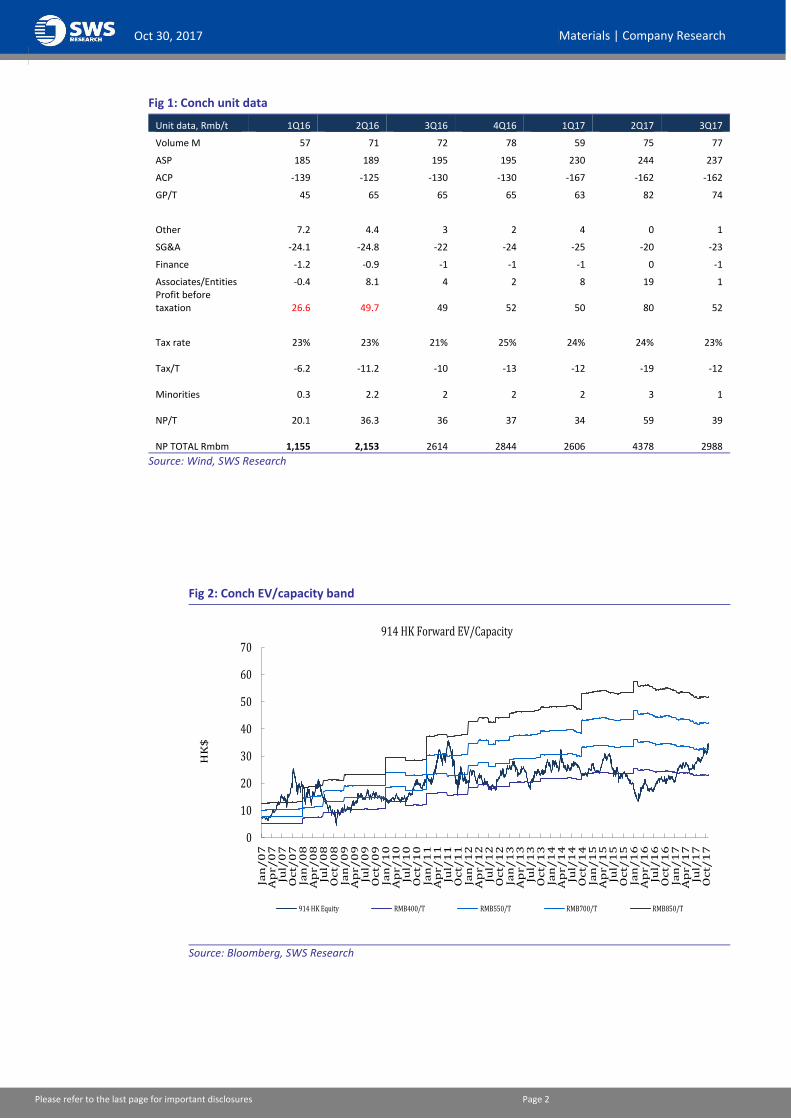
Stable margin. Conch delivered 77mt of cement and clinker in 3Q17 (+7% YoY), with an average selling price (ASP) of Rmb237/t (down Rmb7/t QoQ and Rmb42/t YoY). Its unit cost reached Rmb162/t (flat QoQ and up Rmb42/t YoY), resulting in a unit margin of Rmb74/t in 3Q17 (down Rmb8/t QoQ and Rmb9/t YoY). Conch’s strong performance in 3Q17 confirms our assumption of cement margin recovery on the back of infrastructure and property demand growth and supply-side reforms, which limit overall capacity. Conch maintained its market share, thanks to increasing sale volume.
Strong cash position. Conch’s net cash reached Rmb10.7bn in 3Q17 (vs Rmb1.7 in 1Q17 and Rmb4.5bn in net debt in 2Q17). Its net gearing reached -12.5% (vs -6% in 2Q17). We note Conch has Rmb20.7bn in cash on hand (vs Rmb20.5bn in 2Q17), which may be used for future acquisitions or dividend distribution.
Higher margin and moderating growth in 4Q17. As infrastructure and property demand slows down in 2H17, we expect general demand to also gradually slow down, but expect Conch to be more resilient than peers thanks to its strong exposure to eastern and northwestern China, which benefit from higher demand. As the peak season approaches, we note cement prices already started to increase by Rmb50/t in eastern China and anticipate more price hikes in 4Q17 due to lower inventories and stable demand. As overseas expansion slows down due to stricter government regulation, we forecast Conch’s dividend payout ratio will increase by 5ppts given the company’s current strong cash position. However, we believe its revenue growth is likely to moderate in 4Q17, due to a high base effect.
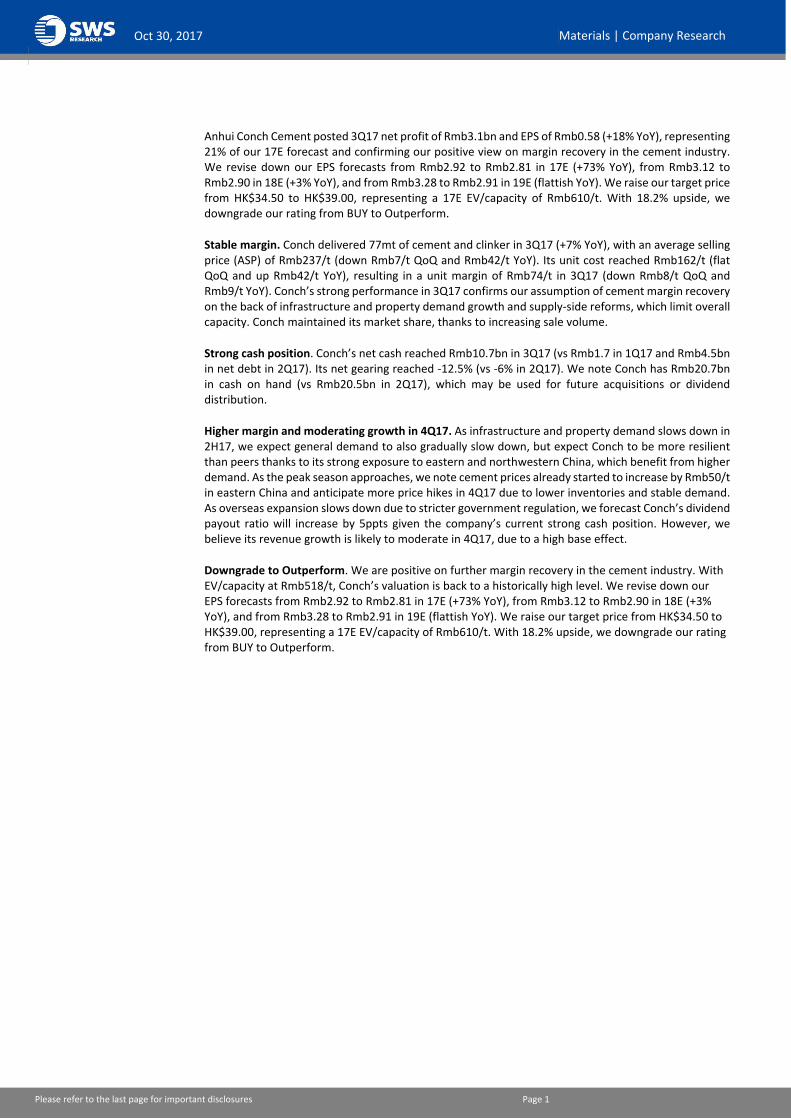
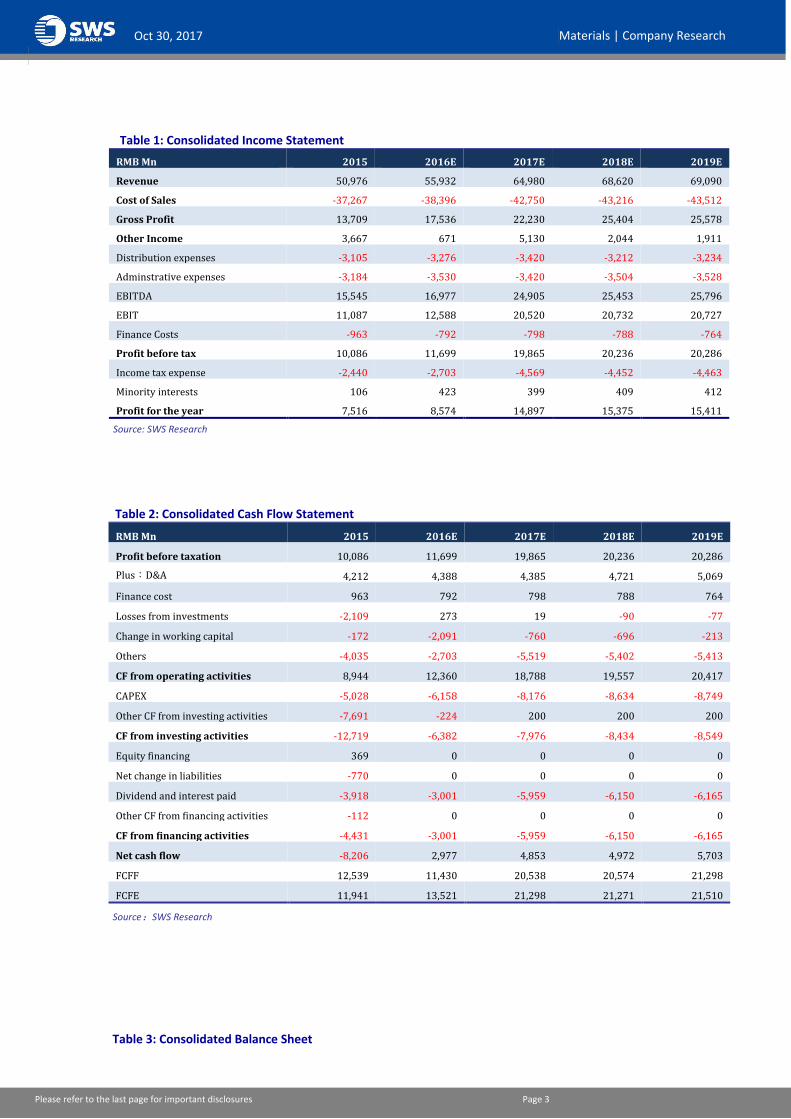
Downgrade to Outperform. We are positive on further margin recovery in the cement industry. With EV/capacity at Rmb518/t, Conch’s valuation is back to a historically high level. We revise down our EPS forecasts from Rmb2.92 to Rmb2.81 in 17E (+73% YoY), from Rmb3.12 to Rmb2.90 in 18E (+3% YoY), and from Rmb3.28 to Rmb2.91 in 19E (flattish YoY). We raise our target price from HK$34.50 to HK$39.00, representing a 17E EV/capacity of Rmb610/t. With 18.2% upside, we downgrade our rating from BUY to Outperform.
October 12, 2010 Building Materials | Company Research
Please refer to the last page for important disclosures Page 2
January 12,2015 Food, Beverage & Tobacco | Company Research
Oct 30, 2017 Materials | Company Research
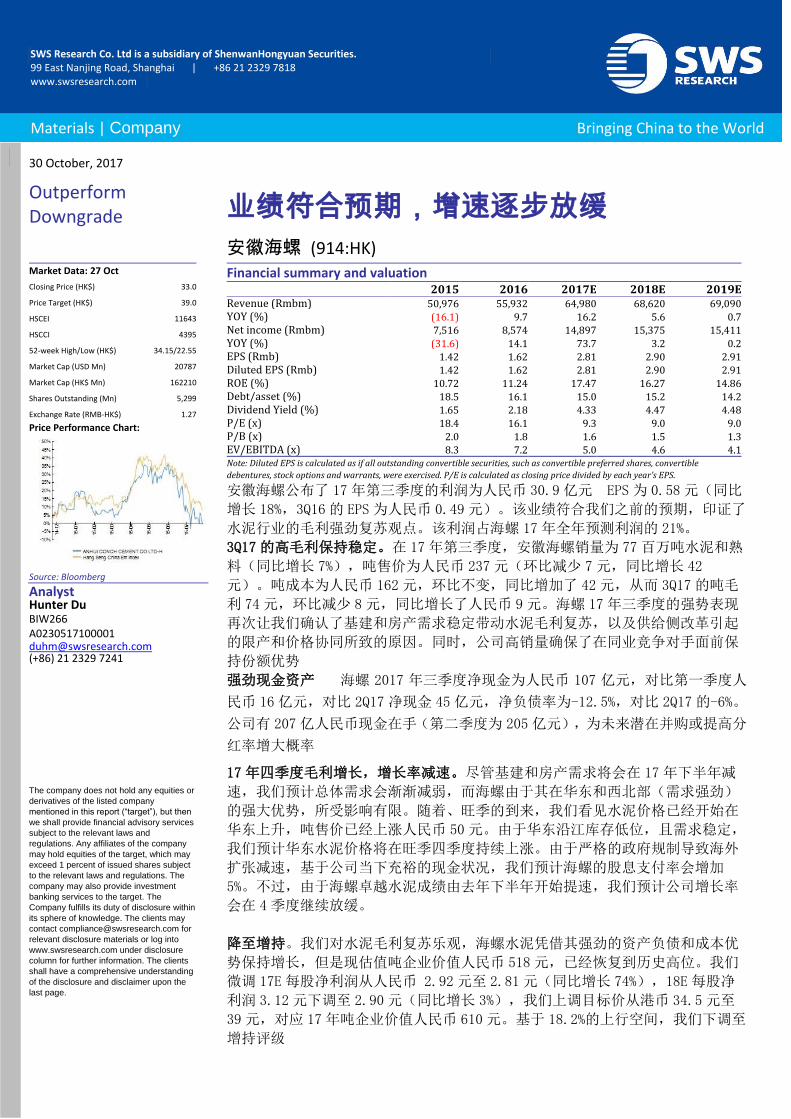
Fig 1: Conch unit data
Unit data, Rmb/t 1Q16 2Q16 3Q16 4Q16 1Q17 2Q17 3Q17
Volume M 57 71 72 78 59 75 77
ASP 185 189 195 195 230 244 237
ACP -139 -125 -130 -130 -167 -162 -162
GP/T 45 65 65 65 63 82 74
Other 7.2 4.4 3 2 4 0 1
SG&A -24.1 -24.8 -22 -24 -25 -20 -23
Finance -1.2 -0.9 -1 -1 -1 0 -1
Associates/Entities -0.4 8.1 4 2 8 19 1 Profit before taxation 26.6 49.7 49 52 50 80 52
Tax rate 23% 23% 21% 25% 24% 24% 23%
Tax/T
-6.2
-11.2 -10 -13 -12 -19 -12
Minorities
0.3
2.2 2 2 2 3 1
NP/T
20.1
36.3 36 37 34 59 39
NP TOTAL Rmbm
1,155
2,153 2614 2844 2606 4378 2988
Source: Wind, SWS Research
Fig 2: Conch EV/capacity band
Source: Bloomberg, SWS Research
0
10
20
30
40
50
60
70
Jan
/0
7A
pr/
07
Jul/
07
Oc
t/0
7Ja
n/
08
Ap
r/
08
Jul/
08
Oc
t/0
8Ja
n/
09
Ap
r/
09
Jul/
09
Oc
t/0
9Ja
n/
10
Ap
r/
10
Jul/
10
Oc
t/1
0Ja
n/
11
Ap
r/
11
Jul/
11
Oc
t/1
1Ja
n/
12
Ap
r/
12
Jul/
12
Oc
t/1
2Ja
n/
13
Ap
r/
13
Jul/
13
Oc
t/1
3Ja
n/
14
Ap
r/
14
Jul/
14
Oc
t/1
4Ja
n/
15
Ap
r/
15
Jul/
15
Oc
t/1
5Ja
n/
16
Ap
r/
16
Jul/
16
Oc
t/1
6Ja
n/
17
Ap
r/
17
Jul/
17
Oc
t/1
7
HK
$
914 HK Forward EV/Capacity
914 HK Equity RMB400/T RMB550/T RMB700/T RMB850/T
October 12, 2010 Building Materials | Company Research
Please refer to the last page for important disclosures Page 3
January 12,2015 Food, Beverage & Tobacco | Company Research
Oct 30, 2017 Materials | Company Research
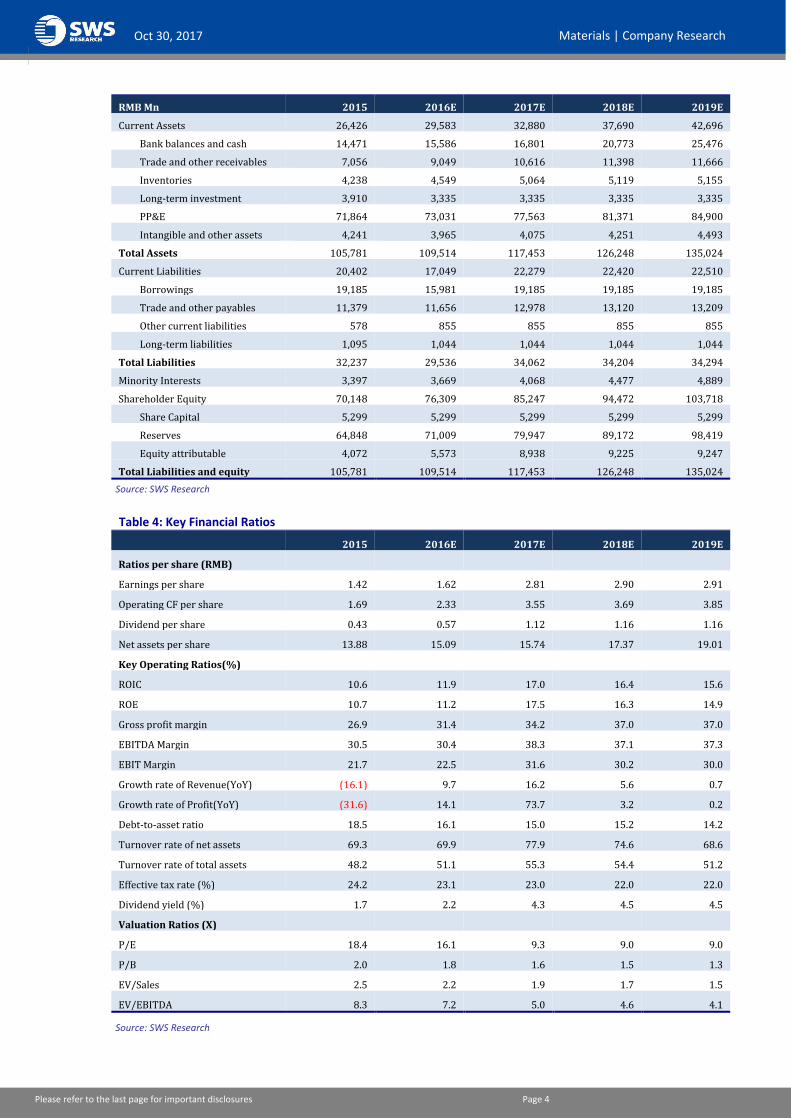
Table 1: Consolidated Income Statement
Table 2: Consolidated Cash Flow Statement
RMB Mn 2015 2016E 2017E 2018E 2019E
Profit before taxation 10,086 11,699 19,865 20,236 20,286
Plus:D&A 4,212 4,388 4,385 4,721 5,069
Finance cost 963 792 798 788 764
Losses from investments -2,109 273 19 -90 -77
Change in working capital -172 -2,091 -760 -696 -213
Others -4,035 -2,703 -5,519 -5,402 -5,413
CF from operating activities 8,944 12,360 18,788 19,557 20,417
CAPEX -5,028 -6,158 -8,176 -8,634 -8,749
Other CF from investing activities -7,691 -224 200 200 200
CF from investing activities -12,719 -6,382 -7,976 -8,434 -8,549
Equity financing 369 0 0 0 0
Net change in liabilities -770 0 0 0 0
Dividend and interest paid -3,918 -3,001 -5,959 -6,150 -6,165
Other CF from financing activities -112 0 0 0 0
CF from financing activities -4,431 -3,001 -5,959 -6,150 -6,165
Net cash flow -8,206 2,977 4,853 4,972 5,703
FCFF 12,539 11,430 20,538 20,574 21,298
FCFE 11,941 13,521 21,298 21,271 21,510
Source:SWS Research
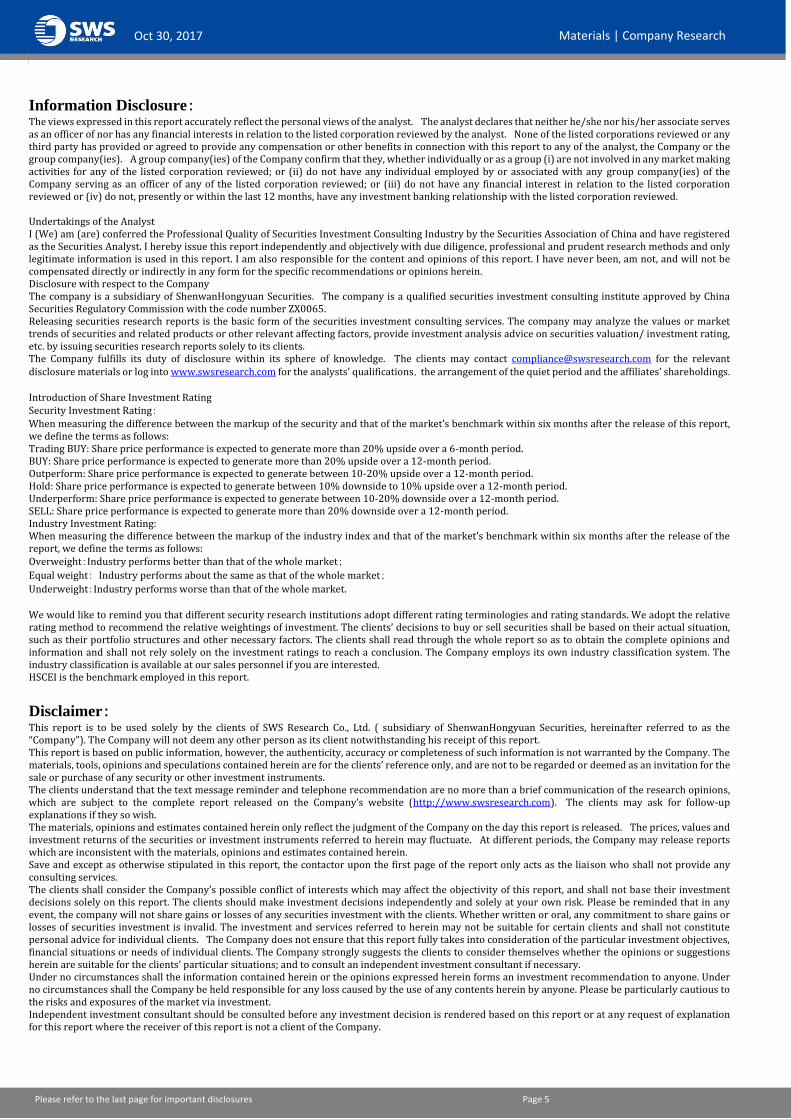
Table 3: Consolidated Balance Sheet
RMB Mn 2015 2016E 2017E 2018E 2019E
Revenue 50,976 55,932 64,980 68,620 69,090
Cost of Sales -37,267 -38,396 -42,750 -43,216 -43,512
Gross Profit 13,709 17,536 22,230 25,404 25,578
Other Income 3,667 671 5,130 2,044 1,911
Distribution expenses -3,105 -3,276 -3,420 -3,212 -3,234
Adminstrative expenses -3,184 -3,530 -3,420 -3,504 -3,528
EBITDA 15,545 16,977 24,905 25,453 25,796
EBIT 11,087 12,588 20,520 20,732 20,727
Finance Costs -963 -792 -798 -788 -764
Profit before tax 10,086 11,699 19,865 20,236 20,286
Income tax expense -2,440 -2,703 -4,569 -4,452 -4,463
Minority interests 106 423 399 409 412
Profit for the year 7,516 8,574 14,897 15,375 15,411
Source: SWS Research
October 12, 2010 Building Materials | Company Research
Please refer to the last page for important disclosures Page 4
January 12,2015 Food, Beverage & Tobacco | Company Research
Oct 30, 2017 Materials | Company Research
RMB Mn 2015 2016E 2017E 2018E 2019E
Current Assets 26,426 29,583 32,880 37,690 42,696
Bank balances and cash 14,471 15,586 16,801 20,773 25,476
Trade and other receivables 7,056 9,049 10,616 11,398 11,666
Inventories 4,238 4,549 5,064 5,119 5,155
Long-term investment 3,910 3,335 3,335 3,335 3,335
PP&E 71,864 73,031 77,563 81,371 84,900
Intangible and other assets 4,241 3,965 4,075 4,251 4,493
Total Assets 105,781 109,514 117,453 126,248 135,024
Current Liabilities 20,402 17,049 22,279 22,420 22,510
Borrowings 19,185 15,981 19,185 19,185 19,185
Trade and other payables 11,379 11,656 12,978 13,120 13,209
Other current liabilities 578 855 855 855 855
Long-term liabilities 1,095 1,044 1,044 1,044 1,044
Total Liabilities 32,237 29,536 34,062 34,204 34,294
Minority Interests 3,397 3,669 4,068 4,477 4,889
Shareholder Equity 70,148 76,309 85,247 94,472 103,718
Share Capital 5,299 5,299 5,299 5,299 5,299
Reserves 64,848 71,009 79,947 89,172 98,419
Equity attributable 4,072 5,573 8,938 9,225 9,247
Total Liabilities and equity 105,781 109,514 117,453 126,248 135,024
Source: SWS Research
Table 4: Key Financial Ratios
2015 2016E 2017E 2018E 2019E
Ratios per share (RMB)
Earnings per share 1.42 1.62 2.81 2.90 2.91
Operating CF per share 1.69 2.33 3.55 3.69 3.85
Dividend per share 0.43 0.57 1.12 1.16 1.16
Net assets per share 13.88 15.09 15.74 17.37 19.01
Key Operating Ratios(%)
ROIC 10.6 11.9 17.0 16.4 15.6
ROE 10.7 11.2 17.5 16.3 14.9
Gross profit margin 26.9 31.4 34.2 37.0 37.0
EBITDA Margin 30.5 30.4 38.3 37.1 37.3
EBIT Margin 21.7 22.5 31.6 30.2 30.0
Growth rate of Revenue(YoY) (16.1) 9.7 16.2 5.6 0.7
Growth rate of Profit(YoY) (31.6) 14.1 73.7 3.2 0.2
Debt-to-asset ratio 18.5 16.1 15.0 15.2 14.2
Turnover rate of net assets 69.3 69.9 77.9 74.6 68.6
Turnover rate of total assets 48.2 51.1 55.3 54.4 51.2
Effective tax rate (%) 24.2 23.1 23.0 22.0 22.0
Dividend yield (%) 1.7 2.2 4.3 4.5 4.5
Valuation Ratios (X)
P/E 18.4 16.1 9.3 9.0 9.0
P/B 2.0 1.8 1.6 1.5 1.3
EV/Sales 2.5 2.2 1.9 1.7 1.5
EV/EBITDA 8.3 7.2 5.0 4.6 4.1
Source: SWS Research
October 12, 2010 Building Materials | Company Research
Please refer to the last page for important disclosures Page 5
January 12,2015 Food, Beverage & Tobacco | Company Research
Oct 30, 2017 Materials | Company Research
Information Disclosure: The views expressed in this report accurately reflect the personal views of the analyst. The analyst declares that neither he/she nor his/her associate serves as an officer of nor has any financial interests in relation to the listed corporation reviewed by the analyst. None of the listed corporations reviewed or any third party has provided or agreed to provide any compensation or other benefits in connection with this report to any of the analyst, the Company or the group company(ies). A group company(ies) of the Company confirm that they, whether individually or as a group (i) are not involved in any market making activities for any of the listed corporation reviewed; or (ii) do not have any individual employed by or associated with any group company(ies) of the Company serving as an officer of any of the listed corporation reviewed; or (iii) do not have any financial interest in relation to the listed corporation reviewed or (iv) do not, presently or within the last 12 months, have any investment banking relationship with the listed corporation reviewed. Undertakings of the Analyst I (We) am (are) conferred the Professional Quality of Securities Investment Consulting Industry by the Securities Association of China and have registered as the Securities Analyst. I hereby issue this report independently and objectively with due diligence, professional and prudent research methods and only legitimate information is used in this report. I am also responsible for the content and opinions of this report. I have never been, am not, and will not be compensated directly or indirectly in any form for the specific recommendations or opinions herein. Disclosure with respect to the Company The company is a subsidiary of ShenwanHongyuan Securities. The company is a qualified securities investment consulting institute approved by China Securities Regulatory Commission with the code number ZX0065. Releasing securities research reports is the basic form of the securities investment consulting services. The company may analyze the values or market trends of securities and related products or other relevant affecting factors, provide investment analysis advice on securities valuation/ investment rating, etc. by issuing securities research reports solely to its clients. The Company fulfills its duty of disclosure within its sphere of knowledge. The clients may contact [email protected] for the relevant disclosure materials or log into www.swsresearch.com for the analysts' qualifications,the arrangement of the quiet period and the affiliates’ shareholdings. Introduction of Share Investment Rating Security Investment Rating: When measuring the difference between the markup of the security and that of the market’s benchmark within six months after the release of this report, we define the terms as follows: Trading BUY: Share price performance is expected to generate more than 20% upside over a 6-month period. BUY: Share price performance is expected to generate more than 20% upside over a 12-month period. Outperform: Share price performance is expected to generate between 10-20% upside over a 12-month period. Hold: Share price performance is expected to generate between 10% downside to 10% upside over a 12-month period. Underperform: Share price performance is expected to generate between 10-20% downside over a 12-month period. SELL: Share price performance is expected to generate more than 20% downside over a 12-month period. Industry Investment Rating: When measuring the difference between the markup of the industry index and that of the market’s benchmark within six months after the release of the report, we define the terms as follows: Overweight:Industry performs better than that of the whole market;
Equal weight: Industry performs about the same as that of the whole market;
Underweight:Industry performs worse than that of the whole market. We would like to remind you that different security research institutions adopt different rating terminologies and rating standards. We adopt the relative rating method to recommend the relative weightings of investment. The clients’ decisions to buy or sell securities shall be based on their actual situation, such as their portfolio structures and other necessary factors. The clients shall read through the whole report so as to obtain the complete opinions and information and shall not rely solely on the investment ratings to reach a conclusion. The Company employs its own industry classification system. The industry classification is available at our sales personnel if you are interested. HSCEI is the benchmark employed in this report.
Disclaimer: This report is to be used solely by the clients of SWS Research Co., Ltd. ( subsidiary of ShenwanHongyuan Securities, hereinafter referred to as the “Company”). The Company will not deem any other person as its client notwithstanding his receipt of this report. This report is based on public information, however, the authenticity, accuracy or completeness of such information is not warranted by the Company. The materials, tools, opinions and speculations contained herein are for the clients’ reference only, and are not to be regarded or deemed as an invitation for the sale or purchase of any security or other investment instruments. The clients understand that the text message reminder and telephone recommendation are no more than a brief communication of the research opinions, which are subject to the complete report released on the Company’s website (http://www.swsresearch.com). The clients may ask for follow-up explanations if they so wish. The materials, opinions and estimates contained herein only reflect the judgment of the Company on the day this report is released. The prices, values and investment returns of the securities or investment instruments referred to herein may fluctuate. At different periods, the Company may release reports which are inconsistent with the materials, opinions and estimates contained herein. Save and except as otherwise stipulated in this report, the contactor upon the first page of the report only acts as the liaison who shall not provide any consulting services. The clients shall consider the Company’s possible conflict of interests which may affect the objectivity of this report, and shall not base their investment decisions solely on this report. The clients should make investment decisions independently and solely at your own risk. Please be reminded that in any event, the company will not share gains or losses of any securities investment with the clients. Whether written or oral, any commitment to share gains or losses of securities investment is invalid. The investment and services referred to herein may not be suitable for certain clients and shall not constitute personal advice for individual clients. The Company does not ensure that this report fully takes into consideration of the particular investment objectives, financial situations or needs of individual clients. The Company strongly suggests the clients to consider themselves whether the opinions or suggestions herein are suitable for the clients’ particular situations; and to consult an independent investment consultant if necessary. Under no circumstances shall the information contained herein or the opinions expressed herein forms an investment recommendation to anyone. Under no circumstances shall the Company be held responsible for any loss caused by the use of any contents herein by anyone. Please be particularly cautious to the risks and exposures of the market via investment. Independent investment consultant should be consulted before any investment decision is rendered based on this report or at any request of explanation for this report where the receiver of this report is not a client of the Company.
October 12, 2010 Building Materials | Company Research
Please refer to the last page for important disclosures Page 6
January 12,2015 Food, Beverage & Tobacco | Company Research
Oct 30, 2017 Materials | Company Research
The Company possesses all copyrights of this report which shall be treated as non-public information. The Company reserves all rights related to this report. Unless otherwise indicated in writing, all the copyrights of all the materials herein belong to the Company. In the absence of any prior authorization by the Company in writing, no part of this report shall be copied, photocopied, replicated or redistributed to any other person in any form by any means, or be used in any other ways which will infringe upon the copyrights of the Company. All the trademarks, service marks and marks used herein are trademarks, service marks or marks of the Company, and no one shall have the right to use them at any circumstances without the prior consent of the Company. This report may be translated into different languages. The Company does not warrant that the translations are free from errors or discrepancies. This report is for distribution in Hong Kong only to persons who fall within the definition of professional investors whether under the Securities and Futures Ordinance (Chapter 571 of the laws of Hong Kong) (the “SFO”) or the Securities and Futures (Professional Investor) Rules (Chapter 571D of the laws of the Hong Kong under the SFO). This report is for distribution in the United Kingdom only to persons who (i) have professional experience in matters relating to investments falling within Article 19(5) of the Financial Services and Markets Act 2000 (Financial Promotion) order 2001 (as amended) (the “Order”) or (ii) are persons falling within Article 49(2)(a) to (d) (“High Net Worth Companies, Unincorporated Associations, etc”) of the Order (All such persons together being referred to as “Relevant Persons”). This document is directed only at Relevant Persons. Other Persons who are not Relevant Persons must not act or rely upon this document or any of its contents.
Distribution in Singapore If distributed in Singapore, this report is meant only for Accredited Investors and Institutional Investors as defined under Section 4A of the Securities and Futures Act of Singapore. If you are not an Accredited Investor or an Institutional Investor, you shall ignore the report and its contents. The Singapore recipients of the report are to contact the Singapore office of ShenwanHongyuan Singapore Private Limited.at 65-6323-5208, or 65-6323-5209 in respect of any matters arising from, or in connection with, the report.