
Third Party Use of Legislative Data - Presentation for NCSL-NALIT

Comparing BI Options for Microsoft Dynamics: Out of the Box vs. Third-Party Solutions
JON S. OESCH – VP OF SALES – JET REPORTS
The Probing Question
A common question among users of Dynamics® ERP systems is: ‘I just bought a new and expensive ERP system from one of the most well-respected technology companies on the planet, shouldn’t BI and reporting capability come with it?’
Well, it does! In fact Gartner ranks Microsoft as a strong leader among BI platformsi. Even better, the solution that you now own is made up of tools that many in your company are already familiar with.
Microsoft’s approach to providing a robust BI solution to its customers is to leverage the already widely-used platform components that most companies already own and use on a daily basis – namely Office (Excel), SQL Server and SharePoint.
Some History and Explanation, Please
Microsoft first started talking publically about BI way back in the late 90’sii and today some form of BI is integrated into the Dynamics ERP’s themselves. For instance, OLAP cubes are a part of the role-based interfaces in AX 2009 and 2012 — among other Dynamics products. They come via a set of predefined metrics (measures and dimensions) and Key Performance Indicators (KPIs). These metrics and KPIs are administered from the ERP application and integrated with the different role-based screens. The technology used behind the scenes is Microsoft SQL Server and Microsoft SQL Server Analysis Services (SSAS). Therefore, such a solution can be applied to any front-end that is compatible with Microsoft SQL Server.
What Microsoft has done then, is to integrate familiar tools like Excel and SharePoint along with more power-user oriented tools Like SQL Server, Analysis Services and the like.
It is a smart play by Microsoft — just think of how much easier it will be to roll-out a business solution to the organization when you tell them they can access all of the information they need using Excel and SharePoint.
Why is it so hard to get data out of Dynamics?

The following list provides an overview of the platform products, technologies and applications that form the current Microsoft BI stack:
Data Platforms: core relational (SQL Server) and multi-dimensional (SQL Server Analysis Services) database engines to facilitate the storage and retrieval of data for reporting and analysis.
Data integration services: platform services (SQL Server Integration Services) to support the extraction,transformation, and loading (ETL) of data from multiple homogeneous and/or heterogeneous datasources to facilitate consolidated reporting and analysis.
A reporting platform (SQL Server Reporting Services) that consists of services and tools to enable designing, deploying, integrating, and managing reports required to address information analysis requirements.
Ad hoc end-user reporting and analysis tools (Microsoft® Office Excel® and Power BI) to facilitate self-service reporting and analysis.
A portal and collaboration platform (Microsoft® Office SharePoint® Server) to enable web portals to present, access, and share information.
It is an impressive list and most anybody in the Dynamics community will agree that Microsoft has the best BI and reporting platform in the world. Enter the caveat – ‘best’ does not mean ‘easy to use’, ‘easy to customize’ or even ‘generally accessible’ to business users.
The Fine Print
To use the tools listed above it is recommended that a team be technically skilled, have a background in software development acquired through formal education (preferably certified in each application) and work experience. Microsoft itself recommends their BI stack be manipulated by professional organizations such as Independent Software Vendors (ISV’s), Value Added Resellers (VAR’s), Solution Integrators (SI’s), IT Developers and Microsoft Developers who implement Microsoft Dynamicsiii.
What this means to the organization using Dynamics is that in order to create a usable BI environment from the app, or even to perform ad hoc reporting (think GL sub ledger report or trial balances during a month end close) is that they must have these skills on staff to create and maintain information gathering or analytic capabilities. Even with the skills in house, a common complaint from Dynamics users is about the time lag between an information request and its delivered date.
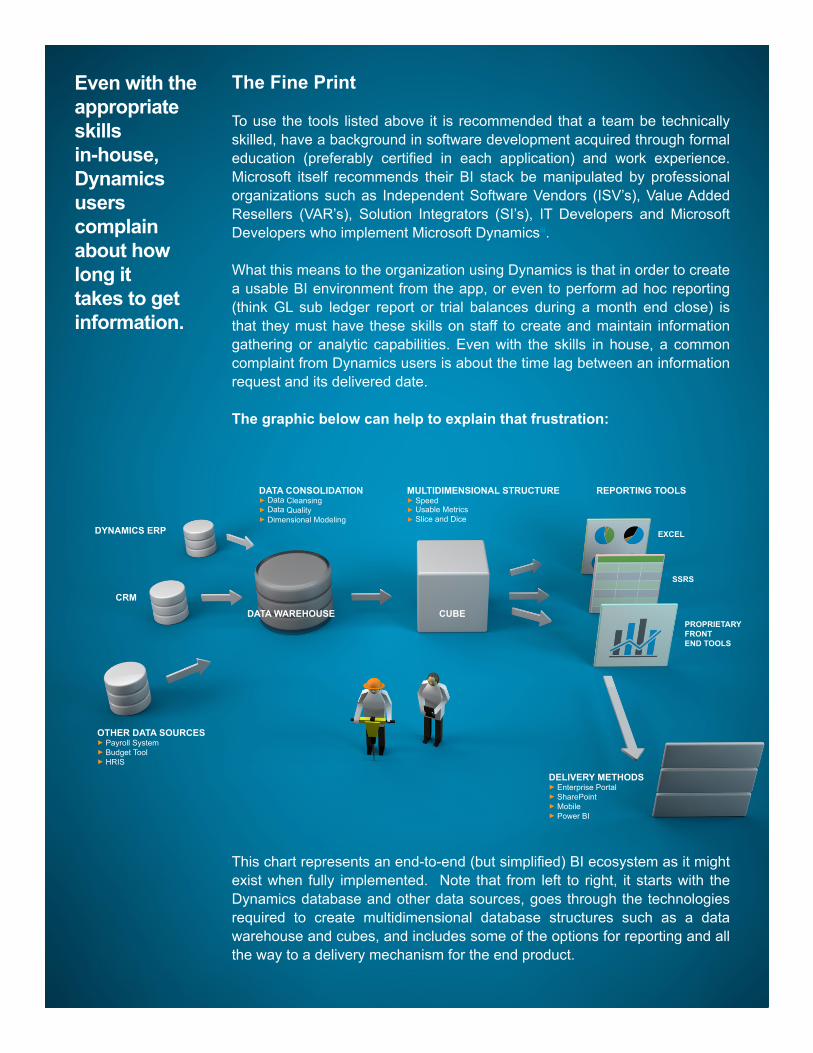
The graphic below can help to explain that frustration:
This chart represents an end-to-end (but simplified) BI ecosystem as it might exist when fully implemented. Note that from left to right, it starts with the Dynamics database and other data sources, goes through the technologies required to create multidimensional database structures such as a data warehouse and cubes, and includes some of the options for reporting and all the way to a delivery mechanism for the end product.
Even with the appropriate skills in-house, Dynamics users complain about how long it takes to get information.
DYNAMICS ERP
DATA CONSOLIDATION► Data Cleansing► Data Quality► Dimensional Modeling
MULTIDIMENSIONAL STRUCTURE► Speed► Usable Metrics► Slice and Dice
REPORTING TOOLS
EXCEL
SSRS
PROPRIETARY FRONT END TOOLS
DELIVERY METHODS► Enterprise Portal► SharePoint► Mobile► Power BI
DATA WAREHOUSE CUBECRM
OTHER DATA SOURCES► Payroll System► Budget Tool► HRIS

Each section of the map represents not only a different technology, but also a different skill set needed to make the technology work. So, in terms of these skills, from left to right you have:
► The database folks who understand how the database structure was built and why ► The technical folks who can write SQL and MDX code in BIDS, can use Integration and Analysis Services and understand the principles of Data Warehousing and OLAP ► The folks who understand how the data should be presented and can use Reporting Services, Excel or a different, proprietary tool to write reports and build dashboards ► A data delivery expert who is not only has user-experience design skills but understands the organizations’ specific SharePoint implementation or yet another proprietary tool
These skills certainly exist in the Dynamics user community, but the problem comes in when you bring these different skill sets into the same room in order to build a cohesive BI environment. They simply don’t speak the same language and you end up with an understanding that is not shared across the organization at best, or competing visions and priorities at worst.
The people who suffer the most are the general business users who need to be able to use the data to support the organization and make decisions – you know, the people that BI was designed to empower in the first place. This is a problem that can be overcome by gathering the proper skill sets, but for many organizations that solution adds up to time and money spent, and opportunity wasted.
The people who suffer most are the users that BI was designed to help in the first place.
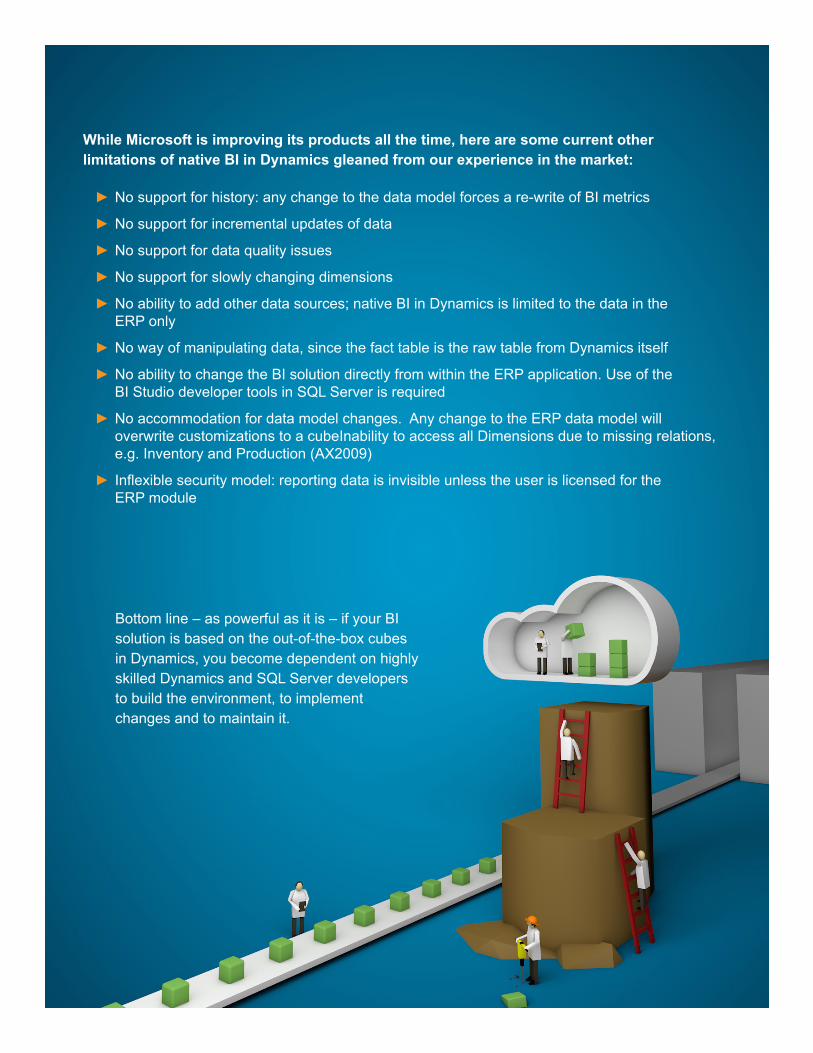
While Microsoft is improving its products all the time, here are some current other limitations of native BI in Dynamics gleaned from our experience in the market:
► No support for history: any change to the data model forces a re-write of BI metrics
► No support for incremental updates of data
► No support for data quality issues
► No support for slowly changing dimensions
► No ability to add other data sources; native BI in Dynamics is limited to the data in the ERP only
► No way of manipulating data, since the fact table is the raw table from Dynamics itself
► No ability to change the BI solution directly from within the ERP application. Use of the BI Studio developer tools in SQL Server is required
► No accommodation for data model changes. Any change to the ERP data model will overwrite customizations to a cubeInability to access all Dimensions due to missing relations, e.g. Inventory and Production (AX2009)
► Inflexible security model: reporting data is invisible unless the user is licensed for the ERP module
Bottom line – as powerful as it is – if your BI solution is based on the out-of-the-box cubes in Dynamics, you become dependent on highly skilled Dynamics and SQL Server developers to build the environment, to implement changes and to maintain it.
There is a Solution – But Not All Solutions Are Equal
There is an alternative and it is one that is enabled by Microsoft’s own strategy. Microsoft has long been a ‘best of breed’ company. This means that they generally don’t build the peripheral products that make their ERP’s work better. They concentrate on core ERP functionality and leave the ‘ac-cessories’ up to the ISV’s who exist in the partner channel. In the case of reporting and BI, Micro-soft has assembled some great tools which make a perfect platform for their ISV partners to fill the gaps in functionality, user experience and self-sufficiency.
Hence, there are lots of ISV-created BI products on the market today. Evaluating them can be a tricky proposition though. Since Dynamics is your ERP system and likely your primary data source, some important things to consider are:
► Does the product make full use of the Microsoft BI stack? If the answer is ‘yes’ then you can be fairly sure that you are looking at a fundamentally-sound product with a lot of power. If the answer is ‘No’, or ‘Yes, but…’ then you might be running the risk of adding unnecessary components to your final BI solution, or even chaining yourself to proprietary tools that result in dreaded ‘vendor lock.’
► How quickly does the product allow you to get value out of it? Will your team need to learn a new set of tools and technologies not only to customize and maintain your BI environment, but simply to start using it effectively from day one?
► What is the implementation methodology of the vendor? Does the vendor follow a proven set of best practices that allow you to take business requirements and reliably turn them into end user facing data structures?
The following tables provide a partial framework of things to look for when evaluating solutions:
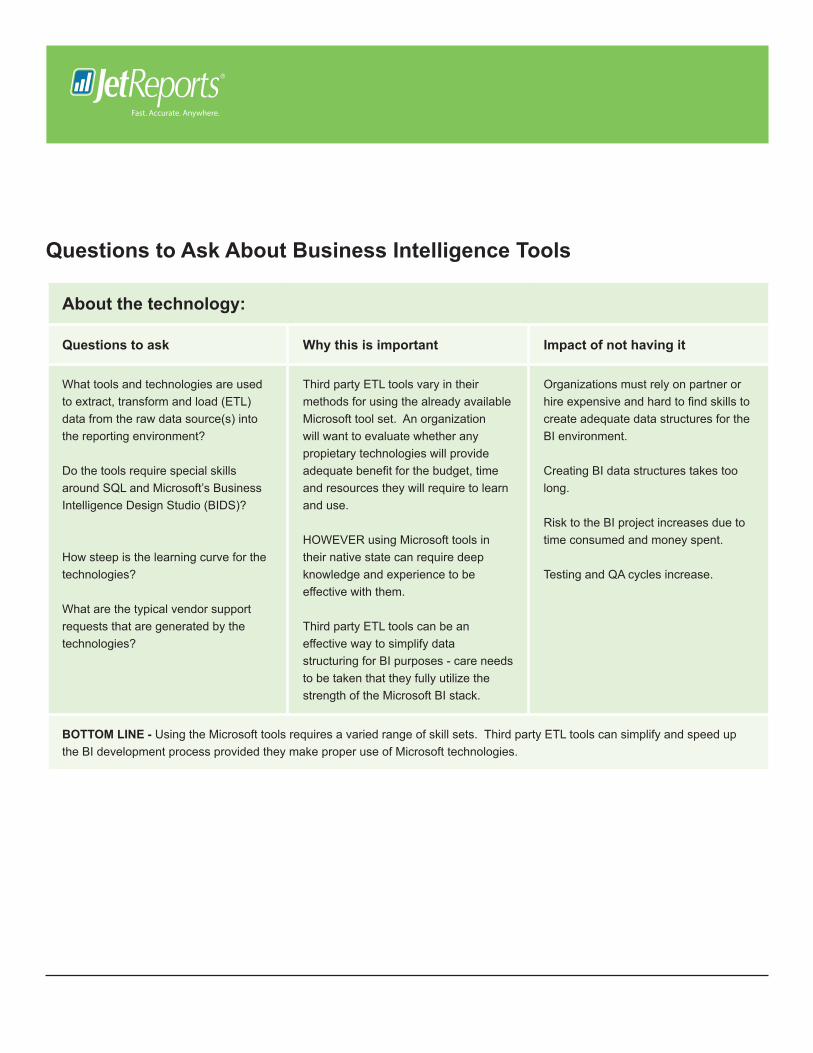
Questions to Ask About Business Intelligence Tools
About the technology:
Questions to ask Why this is important Impact of not having it
What tools and technologies are used to extract, transform and load (ETL) data from the raw data source(s) into the reporting environment?
Do the tools require special skills around SQL and Microsoft’s Business Intelligence Design Studio (BIDS)?
How steep is the learning curve for the technologies?
What are the typical vendor support requests that are generated by the technologies?
Third party ETL tools vary in their methods for using the already available Microsoft tool set. An organization will want to evaluate whether any propietary technologies will provide adequate benefit for the budget, time and resources they will require to learn and use.
HOWEVER using Microsoft tools in their native state can require deep knowledge and experience to be effective with them.
Third party ETL tools can be an effective way to simplify data structuring for BI purposes - care needs to be taken that they fully utilize the strength of the Microsoft BI stack.
Organizations must rely on partner or hire expensive and hard to find skills to create adequate data structures for the BI environment.
Creating BI data structures takes too long.
Risk to the BI project increases due to time consumed and money spent.
Testing and QA cycles increase.
BOTTOM LINE - Using the Microsoft tools requires a varied range of skill sets. Third party ETL tools can simplify and speed up the BI development process provided they make proper use of Microsoft technologies.
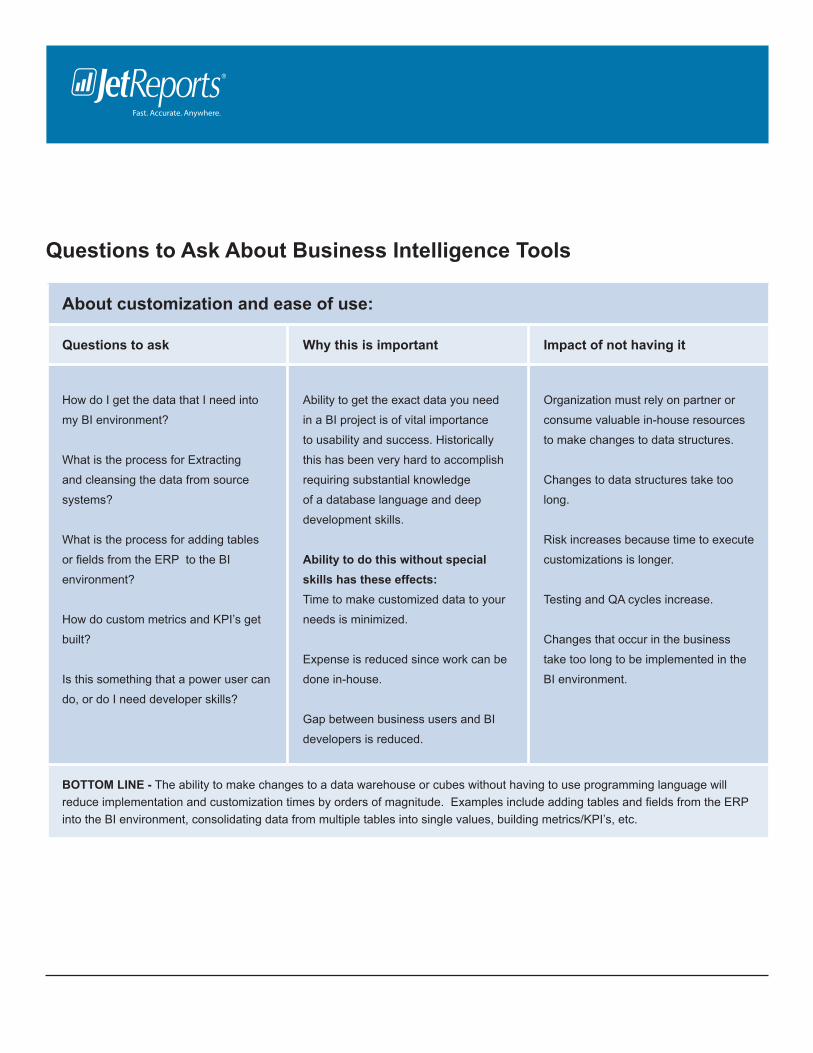
Questions to Ask About Business Intelligence Tools
About customization and ease of use:
Questions to ask Why this is important Impact of not having it
How do I get the data that I need into
my BI environment?
What is the process for Extracting
and cleansing the data from source
systems?
What is the process for adding tables
or fields from the ERP to the BI
environment?
How do custom metrics and KPI’s get
built?
Is this something that a power user can
do, or do I need developer skills?
Ability to get the exact data you need
in a BI project is of vital importance
to usability and success. Historically
this has been very hard to accomplish
requiring substantial knowledge
of a database language and deep
development skills.
Ability to do this without special skills has these effects:Time to make customized data to your
needs is minimized.
Expense is reduced since work can be
done in-house.
Gap between business users and BI
developers is reduced.
Organization must rely on partner or
consume valuable in-house resources
to make changes to data structures.
Changes to data structures take too
long.
Risk increases because time to execute
customizations is longer.
Testing and QA cycles increase.
Changes that occur in the business
take too long to be implemented in the
BI environment.
BOTTOM LINE - The ability to make changes to a data warehouse or cubes without having to use programming language will reduce implementation and customization times by orders of magnitude. Examples include adding tables and fields from the ERP into the BI environment, consolidating data from multiple tables into single values, building metrics/KPI’s, etc.

Questions to Ask About Business Intelligence Tools
About combining disparate data sources:
Questions to ask Why this is important Impact of not having it
Can the BI project include more than one data source?
What is the method for adding a data source?
Which types of data sources can be added?
Most companies have more than one data source and combining the data from these disparate sources is often the main goal of a BI project.
Most third party tools include a way to combine disparate data sources, but there are vast differences in the methods used to accomplish this.
Not being able to combine multiple data sources would be a major flaw in any BI solution, and so most have that ability. The ability to do it simply and effectively is a major concern because it can be a complicated task and the solution you choose should make it as simple as possible.
Inability to include critical data in BI analytics.
The need to use multiple databases and multiple reporting solutions to produce a comprehensive piece of analysis.
Organization must rely on partner or valuable in house resources to produce comprehensive analysis.
Major delays in report productionand additional expense devoted to report production.
BOTTOM LINE - The ability to add and consolidate data from multiple data sources regardless of type or origin is a necessity for any BI project.
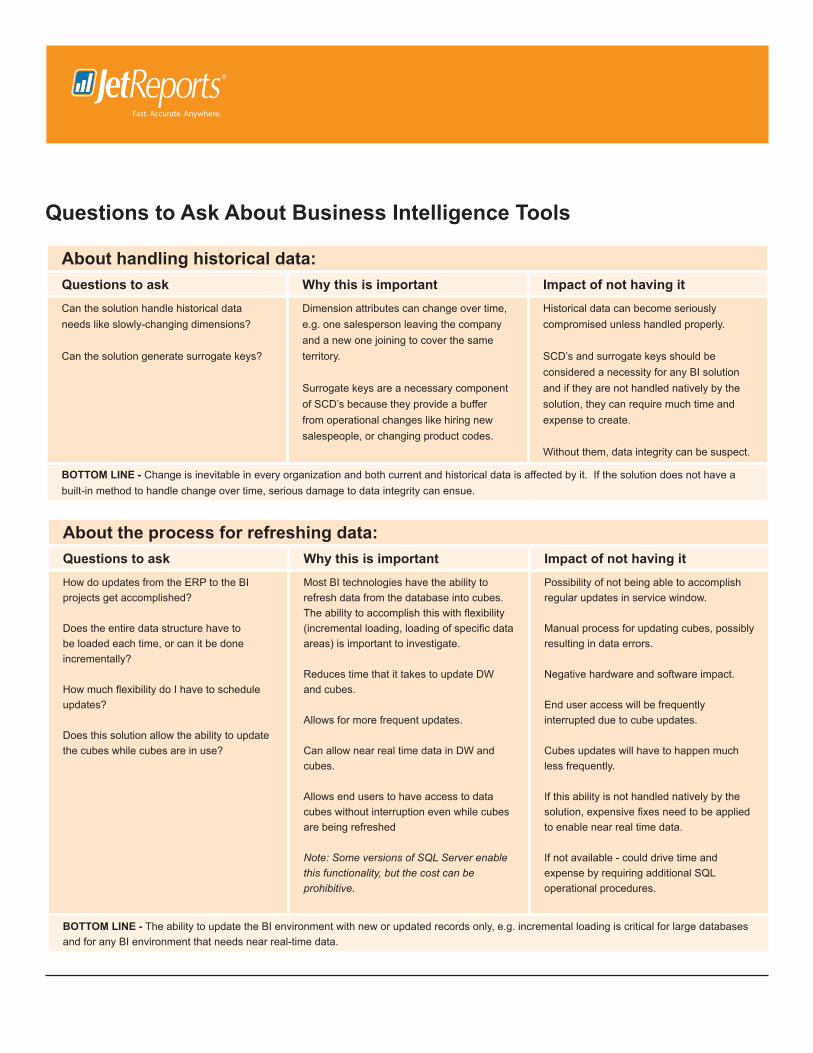
Questions to Ask About Business Intelligence Tools
About the process for refreshing data:Questions to ask Why this is important Impact of not having itHow do updates from the ERP to the BI projects get accomplished?
Does the entire data structure have to be loaded each time, or can it be done incrementally?
How much flexibility do I have to schedule updates?
Does this solution allow the ability to update the cubes while cubes are in use?
Most BI technologies have the ability to refresh data from the database into cubes. The ability to accomplish this with flexibility (incremental loading, loading of specific data areas) is important to investigate.
Reduces time that it takes to update DW and cubes.
Allows for more frequent updates.
Can allow near real time data in DW and cubes.
Allows end users to have access to data cubes without interruption even while cubes are being refreshed
Note: Some versions of SQL Server enable this functionality, but the cost can be prohibitive.
Possibility of not being able to accomplish regular updates in service window.
Manual process for updating cubes, possibly resulting in data errors.
Negative hardware and software impact.
End user access will be frequently interrupted due to cube updates.
Cubes updates will have to happen much less frequently.
If this ability is not handled natively by the solution, expensive fixes need to be applied to enable near real time data.
If not available - could drive time and expense by requiring additional SQL operational procedures.
BOTTOM LINE - The ability to update the BI environment with new or updated records only, e.g. incremental loading is critical for large databases and for any BI environment that needs near real-time data.
About handling historical data:Questions to ask Why this is important Impact of not having itCan the solution handle historical data needs like slowly-changing dimensions?
Can the solution generate surrogate keys?
Dimension attributes can change over time, e.g. one salesperson leaving the company and a new one joining to cover the same territory.
Surrogate keys are a necessary component of SCD’s because they provide a buffer from operational changes like hiring new salespeople, or changing product codes.
Historical data can become seriously compromised unless handled properly.
SCD’s and surrogate keys should be considered a necessity for any BI solution and if they are not handled natively by the solution, they can require much time and expense to create.
Without them, data integrity can be suspect.
BOTTOM LINE - Change is inevitable in every organization and both current and historical data is affected by it. If the solution does not have a built-in method to handle change over time, serious damage to data integrity can ensue.

Questions to Ask About Business Intelligence Tools
About documenting the data structure:
Questions to ask Why this is important Impact of not having it
What is the process for documenting where the data in the data warehouse and cubes came from and how it was combined?
A data map of the BI environment will be used constantly by end users, system developers, system administrators and auditors to explain the meaning of the data, the origin / lineage, how the changes were made and the overall structure.
Manual processes needed for data lineage results in many hours of work and constant updates.
Discovery of out-of-date documentation can result in audit risk.
BOTTOM LINE - Documentation of the source data behind a BI project is critical since it will be used as a new “system of record.” Unless this is done automatically, it can be a time consuming and expensive process.
About implementation processes:
Questions to ask Why this is important Impact of not having it
What methodology will be used for implementing the solution?
Is a set of reputable and proven best practices being followed?
How quickly can a usable solution be delivered?
ERP and BI are different. ERP is a relatively static environment designed to enforce a process and record events in a consistent way. BI is meant to allow flexibility in the way data is configured and consumed. Hence, BI requires a different method of implementation.
Money spent and time to value hinge on a solution that is usable from day one. Customizations need to be developed in an agile manner in order to comprehend the dynamic nature of BI and reporting needs.
Business Intelligence is a dynamic process. Companies and environments change constantly. If a solution is not able to be quickly installed, customizations take too long to configure and user requests too long to incorporate — user acceptance and general usability of the tool decline rapidly.
BOTTOM LINE - Implementation means how quickly the solution can be installed and rolled out to end users, as well as how quickly it can be customized to a specific environment. This is often an underrated feature in a BI solution.
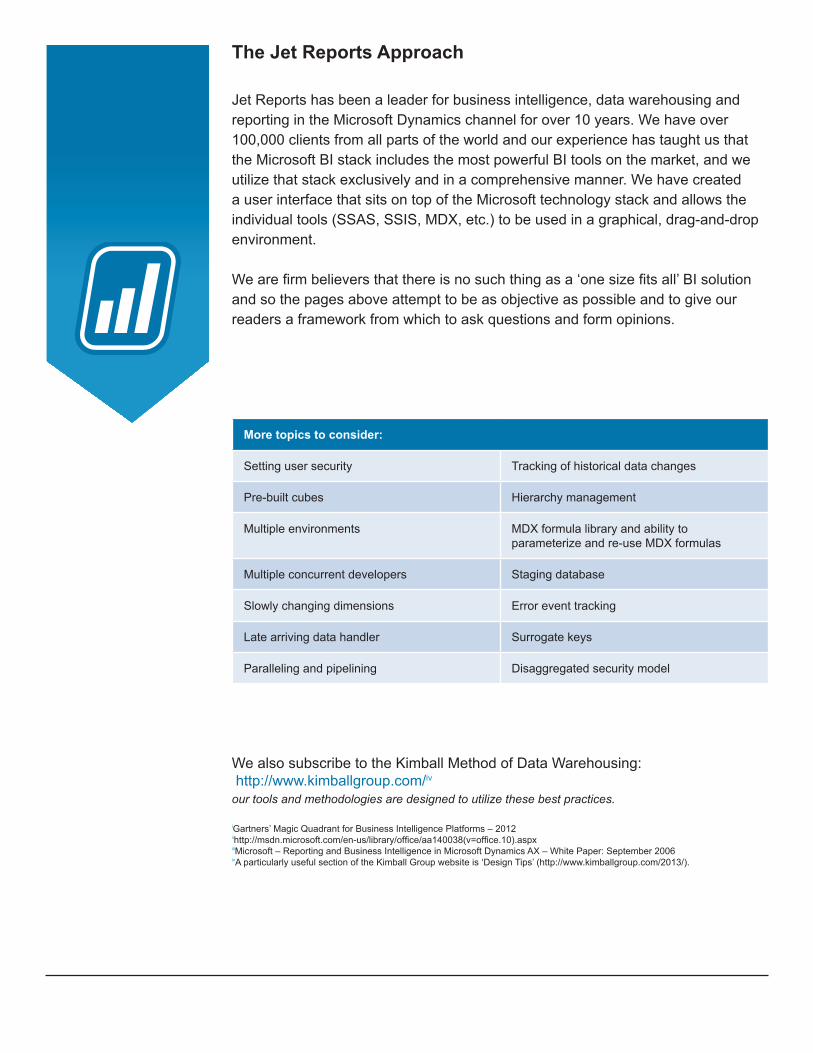
The Jet Reports Approach
Jet Reports has been a leader for business intelligence, data warehousing and reporting in the Microsoft Dynamics channel for over 10 years. We have over 100,000 clients from all parts of the world and our experience has taught us that the Microsoft BI stack includes the most powerful BI tools on the market, and we utilize that stack exclusively and in a comprehensive manner. We have created a user interface that sits on top of the Microsoft technology stack and allows the individual tools (SSAS, SSIS, MDX, etc.) to be used in a graphical, drag-and-drop environment.
We are firm believers that there is no such thing as a ‘one size fits all’ BI solution and so the pages above attempt to be as objective as possible and to give our readers a framework from which to ask questions and form opinions.
More topics to consider:
Setting user security Tracking of historical data changes
Pre-built cubes Hierarchy management
Multiple environments MDX formula library and ability to parameterize and re-use MDX formulas
Multiple concurrent developers Staging database
Slowly changing dimensions Error event tracking
Late arriving data handler Surrogate keys
Paralleling and pipelining Disaggregated security model
We also subscribe to the Kimball Method of Data Warehousing: http://www.kimballgroup.com/iv
our tools and methodologies are designed to utilize these best practices.
iGartners’ Magic Quadrant for Business Intelligence Platforms – 2012iihttp://msdn.microsoft.com/en-us/library/office/aa140038(v=office.10).aspxiiiMicrosoft – Reporting and Business Intelligence in Microsoft Dynamics AX – White Paper: September 2006ivA particularly useful section of the Kimball Group website is ‘Design Tips’ (http://www.kimballgroup.com/2013/).

To learn more about Comparing BI Options for Microsoft Dynamics: contact us today!
Jet Reports delivers unparalleled access to data through fast and flexible reporting and business analytics solutions that are cost effective, provide rapid time-to-value and are built specifically for the needs of Microsoft ERP users. Embedded within the familiar Excel environment, Jet Reports leverages the existing skillsets of users and offers out-of-the-box reports and dashboards so companies can immediately eliminate all expensive, time consuming and error-prone manual tasks to get the accurate business information they need, when and where they need it.
Over 10,000 companies rely on Jet Reports every day for their financial reporting.
Jonathan OeschLoves ERP, Loves Data. Loves what happens when data from a transaction processing system gets turned into usable information that people can rely on; “It’s like that chemistry lab in college where you walk in with your raw supplies and leave with a perfectly round rubber ball.”
VP of Sales at Jet Reports. Speaks, writes, blogs and tweets about BI strategy – sometimes in his sleep.
Your author
Jet Reports | www.jetreports.com