Organizers: Hokkaido University, University of Alaska, Japan
70
Transcript of Organizers: Hokkaido University, University of Alaska, Japan
Organizers: Hokkaido University, University of Alaska, Japan Aerospace Exploration Agency(JAXA), Remote Sensing Technology Center of Japan(RESTEC). Co-organizers: Japan Airlines, Hokkaido Railway Company, Hokkaido Branch of The Asahi Simbun Company, Hokkaido Federation of Land Improvement Association, Sapporo International Communication Plaza Foundation, Global COE Program "Center for Next-Generation Information Technology based on Knowledge Discovery and Knowledge Federation. Supported by: Hokkaido Government, Hokkaido Bureau of Economy, Trade and Industry, Ministry of Land, Infrastructure and Transport Hokkaido Regional Development Bureau, Hokkaido Broadcasting Co.,Ltd. This publication was partially supporeted by a Grant-in-Aid for Scientific Research (A) (Project No. 20241042 headed by Prof. Toshihisa Honma, Hokkaido University) from the Japan Society for the Promotion of Science.

Program
5 July, Saturday afternoon 14:00 - 14:30 Opening Ceremony Chair: Toshihisa Honma (Hokkaido University) Opening remarks: Hiroshi Saeki (President, Hokkaido University) Mark Hamilton (President, University of Alaska) Henry Singarasa (President, University of Palangkaraya) Yasushi Horikawa (Director, Japan Aerospace Exploration Agency) Tsuguhiko Katagi (Director, Remote Sensing Technology Center of Japan)
14:30 - 17:50 Session 1 Tropical Regions Chair: Toshio Iwakuma (Hokkaido University) 14:30 - 15:20 Keynote Speech: Bambang Setiadi (National Standardization Agency, Indonesia) Toward standardization of methods for measurement of greenhouse gases: An intermediate step (S1-00) 15:20 - 15:50 Invited Paper 1: Suwido H. Limin (Center for International Cooperation in Management
of Tropical Peatland,University of Palangkaraya) THE LOCAL AND GLOBAL IMPORTANCE OF TROPICAL PEATLANDS: CASE STUDY OF THE FORMER MEGA RICE PROJECT IN CENTRAL
KALIMANTAN, INDONESIA (S1-01) 15:50 - 16:20 Invited Paper 2: Hidenori Takahashi (Hokkaido-Kalimantan Exchange Association for
Culture, Science and Technology) Peat fire, air pollution and hydrological process in a tropical peatland, Central
Kalimantan, Indonesia (S1-02) 16:20 - 16:30 Break 16:30 - 17:00 Invited Paper 3: Masanobu Shimada (Japan Aerospace Exploration Agency) Kyoto and Carbon Project - Kyoto and Carbon Initiative project - wall to wall monitoring of the global forest using the ALOS/PALSAR (S1-03) 17:00 - 17:30 Invited Paper 4: Noriyuki Kobayashi (Law School of Nihon University) Socio-economic aspects of peatland management (S1-04) 17:30 - 17:50 Discussion

6 July, Sunday
9:30 - 12:00 Session 2 Arctic Region Chair: Masami Fukuda (University of Alaska Fairbanks) 9:30 - 10:30 Keynote Speech : John E. Walsh (International Arctic Research Center, University of
Alaska Fairbanks) Attribution of recent arctic change (S2-00) 10:30 - 11:00 Invited Paper 1: Larry Hinzman (International Arctic Research Center, University of
Alaska Fairbanks) Achieving climate predictability through understanding of the arctic system (S2-01)
11:00 - 11:30 Invited Paper 2: Yojiro Matsuura (Forestry and Forest Products Research Institute) Comparative study on circumpolar forest ecosystems (S2-02) 11:30 - 12:00 Invited Paper 3: Keiji Kushida (Hokkaido University) Remote sensing of wildfire influence on carbon budget in boreal forests (S2-03) 12:00 - 13:00 Lunch break 13:00 - 17:00 Poster session 13:00 - 13:15 Short introduction of posters 18:00 - Reception (Welcome dinner)
7 July, Monday morning 9:00 - 12:00 Session 3 Other Regions and Global Aspect Chair: Koji Yamazaki (Hokkaido University) 9:00 - 9:50 Keynote Speech: Atsumu Ohmura (Institute for Atmospheric and Climate Science,
Swiss Federal Institute of Technology (E.T.H.)) Detection of Global Change: Are we succeeding with this endeavour ? (S3-00) 9:50 - 10:10 Invited Paper 1: Ralf Greve (Hokkaido University) Rapid decay of the Greenland and Antarctic ice sheets? (S3-01) 10:10 - 10:20 Break 10:20 - 10:50 Invited Paper 2: Kenneth F. Drinkwater (Institute of Marine Research, Norway) Comparative Marine Ecosystem Studies in Subarctic Regions (S3-02) 10:50 - 11:20 Invited Paper 3: Masafumi Kamachi (Meteorological Research Institute, Japan) Ocean Change Detected From Ocean Analysis/Reanalysis Datasets MOVE/MRI.COM_RA (S3-03) 11:20 - 11:50 Invited Paper 4: Asanobu Kitamoto (National Institute of Informatics, Japan) Digital Typhoon: A Data-Centric Approach to Events on the Earth (S3-04) 11:50 - 12:00 Discussion 12:00 - 13:00 Lunch break
7 July, Monday afternoon 13:00 - 16:15 Session 4 Wild Fire in Asia - Sentinel Asia - Chair: Takashi Moriyama (Japan Aerospace Exploration Agency) 13:00 - 13:15 Invited Paper 1: Kazuya Kaku (Japan Aerospace Exploration Agency) Sentinel Asia (S4-01) 13:15 - 13:30 Invited Paper 2: Masami Fukuda (University of Alaska Fairbanks) Overview of Sentinel Asia Wild Fire Initiative (S4-02) 13:30 - 13:45 Invited Paper 3: Futoshi Takiguchi (Japan Aerospace Exploration Agency) Space Applications of JAXA contribute to Earth (S4-03)

13:45 - 14:45 Invited Papers 4-7: From Asian countries Part 1 4 Siri Akaakara (National Park Wildlife and Plant Conservation Department,
Thailand) Forest Fire Control Activities in Thailand (S4-04)
5 Byungdoo Lee (Korea Forest Research Institute) Forest fire situation and main study activities in South Korea (S4-05)
6 Odbayar Mishigdorj (National Remote Sensing Center of Mongolia) Comparison MODIS data with NOAA data in case on spring time of 2008 of Mongolia (S4-06)
7 A. Alexander Held (Commonwealth Scientific and Industrial Research
Organization, Australia) Satellite-based wildfire monitoring and tracking in Australia (S4-07) 14:45 - 15:00 Break 15:00 - 16:00 Invited Papers 8-11: From Asian countries Part 2 8 Kustiyo (Indonesian National Institute of Aeronautics and Space (LAPAN))
LAPAN’s Activities in Supporting Wildfire Early Warning and Detection in Indonesia (S4-08)
9 Lim Kim Hwa (Centre for Remote Imaging, Sensing and Processing (CRISP)
National University of Singapore) Regional Vegetation Fire monitoring in CRISP (S4-09) 10 Vivarad Phonekeo (Asian Institute of Technology) AIT Near-Real Time Automatic MODIS Fire Information System for Active Fire
Monitoring in Southeast Asia (S4-10)
11 Bounmany Keosithong (Water Resources and Environment Administration, Lao PDR) Independence Forest Cover Monitoring and Wildlife information: Field survey of
Pathumphone Product Forest Area in Champasak Province, Lao PDR (S4-11)
16:00 - 16:15 Discussion 16:30 - Campus Tour

Poster presentations P-01 Scaling approach of ecosystem productivity over black spruce forests in Alaska: a synthesis of the eddy covariance data and satellite remote sensing data Masahito Ueyama 1,2), Yoshinobu Harazono 1,2), and Kazuhito Ichi 3) 1) Schools of Life and Environmental Sciences, Osaka Prefecture University 2) International Arctic Research Center, University of Alaska Fairbanks 3) Faculty of Symbiotic Systems Science, Fukushima University P-02 Decadal variability of carbon fluxes over black spruce forests in Alaska detected by application of NOAA-AVHRR and climate data Masahito Ueyama 1,2), Date 3), Yoshinobu Harazono 1,2), Tomoyuki Kitamoto 3), Yuji Ota 3), Toru Iwata 3), and Susumu Yamamoto 3) 1) Osaka Prefecture University 2) International Arctic Research Center, University of Alaska Fairbanks 3) Okayama University P-03 Applicability of visible bands of MODIS on CO2 budget over arctic tundra in Alaska Yoshinobu Harazono 1,2), Nana Nishida 1), Masahito Ueyama 1,2), W. C. Oechel 3) and Yoshiaki Kitaya 1) 1) Osaka Prefecture University 2) International Arctic Research Center, University of Alaska Fairbanks 3) Global Change Research Group, San Diego State University P-04 Introduction of APHRODITE: gauge-based high-resolution daily precipitation data for Asia Osamu ARAKAWA Meteorological Research Institute P-05 Recent Trend of Large-Scale Fires in Tropical and Boreal Forests Hiroshi Hayasaka, Murad Ahmed Farukh and Erianto Indra Putra Graduate School of Engineering, Hokkaido University P-06 Forest Fires in Mongolia - Analysis based on MODIS Hotspot and Weather Data Hiroshi Hayasaka and Murad Ahmed Farukh Graduate School of Engineering, Hokkaido University P-07 Recent Peat Fires Tendency in Mega Rice Project Area, Central Kalimantan, Indonesia Erianto Indra Putra and Hiroshi Hayasaka Graduate School of Engineering, Hokkaido University P-08 Comparison of CO2 balance among three disturbed ecosystems in tropical peatlands Takashi Hirano 1), Hendrik Segah 2), Suwido Limin 2), Hidenori Takahashi 3) and Mitsuru Osaki 1) 1) Hokkaido University, Sapporo, Japan 2) University of Palangkaraya, Palangkaraya, Indonesia 3) Hokkaido Institute of Hydro-Climate, Sapporo, Japan
P-09 Satellite monitoring of the recent Arctic environmental changes Masahiro HORI, Hideyuki FUJII, Keiji IMAOKA Earth Observation Research Center, Japan Aerospace Exploration Agency, Tsukuba, Japan P-10 Boreal forest fire detection algorithm development with fire observation by commercial flights Koji Nakau 1), Masami Fukuda 2) , Yumiko Nagamine 3) 1) JAXA/EORC, 2) UAF/IARC, 3) JAL
P-11 Rainfall and snowfall interceptions of the forests in Moshiri, Hokkaido Yuji KODAMA 1), Kazuyoshi SUZUKI 2) and Taro NAKAI 3) 1) Institute of Low Temperature Science, Hokkaido University, 2) Institute of Observational Research for Global Change, JAMSTEC, Yokosuka,, JAPAN 3) CREST/JST P-12 Identification of N2O-emitting soil bacteria from tropical peatland in Central Kalimantan and temperate zone in Hokkaido, and comparisons of their physiological characteristics Yasuyuki Hashidoko 1), Hisahaya Takeda 1), Fumiaki Takakai 1), Yo Toma 1), Darung Untung 2), Lulie Melling 3), and Ryusuke Hatano 1) 1) Hokkaido University, Sapporo, Japan 2) University of Palangka Raya, Palangka Raya, Indonesia 3) Agriculture Sarawak, Kuching, Malaysia P-13 Nitrous oxide emissions induced by fertilizer and soil organic matter from tropical peat soil in Central Kalimantan, Indonesia Yo Toma 1), Fumiaki Takakai 2), Untung Darung 3), Kanta Kuramochi 1), Ryusuke Hatano 1) 1) Hokkaido University, Sapporo, Japan <BR> 2) Akita Prefectural University, Akita, Japan <BR> 3) University of Palangkaraya, Palangkaraya, Indonesia P-14 Global average surface temperature anomalies with COBE-SST Koji Ishihara Meteorological Research Institute, JMA P-15 Repeated Peat Fire Increase Negative Growth of Acacia crassicarpa in the Forest Plantation Bambang Hero Saharjo 1), N.A.Eka Widyasari 2) and Basuki Wasis 1) 1) Forest Fire Laboratory, Forest Protection Division, Department of Silviculture, Faculty of Forestry, Bogor Agriculture University, West Java, Indonesia 2) Alumny, Department of Silviculture, Faculty of Forestry, Bogor Agriculture University, West Java, Indonesia P-16 Projection of the change in future extremes using a nonhydrostatic cloud-resolving regional model Akio Kitoh 1), Hiroki Kondo 2) and The project team from AESTO 1) Meteorological Research Institute, Japan 2) Japan Meteorological Agency
P-17 Global Projection of the Change in Weather Extremes Using Super-High-Resolution Atmospheric Models in the KAKUSHIN Program Akio Kitoh 1), Hiroki Kondo 2) and The project team from AESTO 1) Meteorological Research Institute, Japan 2) Japan Meteorological Agency P-18 Seasonal and interannual variability in phytoplankton biomass in the western Arctic Ocean: implications for biological response to ongoing climate change Atsushi Matsuoka 1) and Victoria Hill 2) 1) Graduate School of Fisheries Sciences, Hokkaido University, Japan 2) Earth and atmospheric sciences, the department of ocean, Old Dominion University, USA P-19 Characteristics of wildfires in Thailand observed from satellite imageries Kazufumi Kobayashi 1), Hiroshi Tani 1), Wang Xiufeng 1) and Masami Fukuda 2) 1) Graduate School of Agriculture, Hokkaido University, Sapporo, Japan 2) International Arctic Research Center, University of Alaska Fairbanks P-20 Larch taiga on permafrost is facing the risk of catastrophic degradation by immoderate increasing precipitation regimes Hideyuki Saito 1), Hidenari Iwasaki 1), Alexander P. Isaev 2), Kazunobu Kuwao 1), Alexander N. Fedorov 3), Trofim C. Maximov 2), Shuich Hasegawa 1) 1) Hokkaido University, Sapporo Japan 2) Institute for Biological Problems of Cryolithozone, Yakutsk Russia 3) Permafrost Institute, Yakutsk Russia P-21 Snow Cover Monitoring in Alaska by Satellite Observation Hiroyuki Enomoto 1), Shizuka Kimura 1), Kim Yongwon 2), Komei Sasaki 1), Kazutaka Tateyama 1), Tomonori Tanikawa 1) and Gaku Kadosaki 3) 1) Kitami Institute of Technology 2) International Arctic Research Center, University of Alaska Fairbanks 3) Remote Sensing Technology Center of Japan P-22 Recent variability of Coccolithophore blooms in eastern Bering Sea shelf Sei-Ichi Saitoh 1), Takahiro Iida 2), Kohei Mizobata 3), Toru Hirawake 1) and Mitsuhiro Toratani 4) 1) Graduate School of Fisheries Sciences, Hokkaido University 2) National Institute of Polar Research, Itabashi, Tokyo, Japan 3) Tokyo University of Marine Science and Technology, Shinagawa, Tokyo, Japan 4) School of High-Technology for Human Welfare, Tokai University, Numazu, Japan P-23 Seasonal and interannual variability of primary production of scallop forming area in the Okhotsk Sea in relation to climate changes Muzzneena Ahmad Mustapha 1,2) and Sei-Ichi Saitoh 1) 1) Graduate School of Fisheries Sciences, Hokkaido University 2) UNIVERSITI KEBANGSAAN MALAYSIA, Malaysia

P-24 Forest restoration technique of Shorea balangeran in degraded peatland of Central Kalimantan, Indonesia Hideyuki Saito 1), Masato Shibuya 1), Yutaka Tamai 1), Turjman Maman 2), Agung R. Susanto 3), Sampang Gaman 3), Kunihide Takahashi 1), and Suwido H. Limin 3) 1) Hokkaido University, Sapporo Japan 2) Forest and Nature Conservation Research and Development Center, Boror, Indonesia 3) University of Palangka Raya, Palangka Raya, Indonesia P-25 Sea Ice Shrinking and Melting in the Arctic Hiroyuki Enomoto and Kazutaka Tateyama Kitami Institute of Technology
TOWARD STANDARDIZATION OF METHODS FOR MEASUREMENT OF GREENHOUSE GASES: AN INTERMEDIATE STEP
BAMBANG SETIADI NATIONAL STANDARDIZATION AGENCY OF INDONESIA
Manggala Wanabakti Blok IV, 4th floor
Jl. Jend. Gatot Subroto, Senayan, Jakarta Pusat 10270, Indonesia
E-mail. : [email protected]
The carbon stored in the peat dome is potentially at risk from drainage and fire. In order
to maintain this carbon store the peat dome must be protected as a water reservoir
by maintaining the water table as high as possible. This will reduce the CO2
emission rate during the rainy season, and minimize CO2 release during the dry
season. Tropical peat swamp forest and the carbon contained in the peat dome
should be considered as a valuable ”asset”. As the decades passed, tropical peat
has contributed more and more problems for us and these are likely to continue
for many more decades. How to regulate the carbon inside the dome and at the
same time conserve it as a major global carbon store is very important actions to
take.. Identify deposit of peat dome on tropical peat by using satellite is one of
prospective technology in the future. There should be “at most one globally
applied standard and one globally accepted test, with conformity assessment
processes appropriate to the needs of the parties, for carbon accounting in the
peat dome. Also, common measure for greenhouse gas emissions be added.
The International Organization for Standardization (ISO) Technical Committee
207 established Working Group 5 to create a standard for the measurement,
reporting and verification of entity- and project-level greenhouse gas emissions.
The standard is intended to integrate greenhouse gas emissions into their
environmental management systems.
THE LOCAL AND GLOBAL IMPORTANCE OF TROPICAL PEATLANDS: CASE STUDY OF THE FORMER MEGA RICE PROJECT IN CENTRAL KALIMANTAN,
INDONESIA
S. H. Limin1, J. O. Rieley2, S. E. Page3 , H. Vasander4 and J. Jauhaianen4
1Centre for International Co-operation in Sustainable Management of Tropical Peatland, University of Palangka Raya, Central Kalimantan, Indonesia
2School of Geography, University of Nottingham, United Kingdom 3Department of Geography, University of Leicester, United Kingdom
4Department of Forest Ecology, University of Helsinki, Finland. Contact Email: [email protected]
ABSTRACT
Lowland tropical peat swamp forest is a valuable natural resource that performs ecological functions and supports basic needs of indigenous communities. Development of large areas of peatland, especially in Indonesia, has led to many environmental and socio-economic problems including loss of biodiversity, transfer of CO2 to the atmosphere, increased flooding, atmospheric pollution, danger to human health and increase in poverty of local people. The failed Mega Rice Project (MRP) has caused a series of new disasters because this large deforested and drained area has gone on fire every year since it commenced, releasing massive amounts of greenhouse gases to the atmosphere, creating the noxious ‘haze’ that blankets much of Southeast Asia every dry season and affecting the economies of several countries. Restoration and rehabilitation of the Ex-MRP as now a high priority for the Indonesian Government but the means to do this are untried and the likelihood of success is uncertain. Ideally, this area should be returned to forest but this will be a major long term challenge and other strategies will have to be adopted in the short term. In addition, it is essential to address the socio-economic condition of local people who lost a major part of their livelihood when the forest was removed. The only way to ensure the rehabilitation of the EMRP is to involve them in all aspects of the rehabilitation process, including planning, implementation and management. They must become the principal stakeholders and custodians of this land and derive direct financial and cultural benefit from doing so. Before anything can be achieved, however, it is essential to control the fires that destroy everything and make it impossible to move forward. There are a number of strategies that could be employed to achieve the future sustainability of the EMRP area and these will be presented and discussed. Keyword : Peatland, forest, human, rehabilitation
Peat fire, air pollution and hydrological process in a tropical
peatland, Central Kalimantan, Indonesia
Hidenori Takahashi Hokkaido-Kalimantan Exchange Association for Culture, Science and Technology,
Kita-ku, Sapporo 001-0014, Japan
Dense haze emitted from peat/forest fires in 1997/98 and 2002 damaged not only the peatland
and forest themselves but also the social activity and human health in many countries of South East
Asia. Several components of air quality, such as carbon monoxide, ozone and particulate matter less
than 10 μm in diameter (PM10) etc. were monitored since 2001 by the Environmental Impact Agency
of Palangka Raya at three sites in Palangka Raya, Central Kalimantan. The seasonal changes of
concentrations of carbon monoxide and PM10 were clearly coincided with the changes of peat
moisture of surface layer in a field. Peat moisture of surface layer, which is a very important factor
for surface peat to be ignited by sparking fire, was estimated with one dimensional bucket model of
hydrological process in peat layer from surface to one meter in depth. The drying process of the
estimated by the bucket model was coincided with high similarity to the process observed in the field.
Kyoto and Carbon Project - Kyoto and Carbon Initiative project - wall to wall monitoring of the global forest using the ALOS/PALSAR
Masanobu Shimada Japan Aerospace and Exploration Agency (JAXA), Earth Observation Research Center
(EORC), Sengen 2-1-1, Tsukuba, Ibaraki, Japan, 305-8505, Voice 81-29-868-2474, Fax: 81-29-868-2961, [email protected]
JAXA's forest monitoring project, "Kyoto and Carbon Initiatives," intends to observe the
forest cover and cover change using the Spaceborne Synthetic aperture radar globally,
densely, and high-temporally. JAXA started the project around the year 2000
collaborating with the world 20-forest research institutes with the mission goals of
understanding the forest distribution and its annual change, wetland distribution and its
annual change, desert and its change from the analysis of the L-band SAR.
In this project, we will use the L-band synthetic aperture radar (PALSAR) of the
Advanced Land Observing satellite (ALOS), which is a high resolution imaging radar
operating with L band frequency signal and which is now in operational from May 2006.
PALSAR is sensitive to the signal reflection from the forest and non-forest area. Signal
difference between two seasons and its annual will be utilized to detect the change of the
forest and the related target. The target area will be the three big rain forests in Amazon,
South East Asia, Central Africa, and the boreal forest of the North Canada, Alaska, and
Eurasian continent. The monitoring results will be open to the public.

Sustainable Peatland Management -Socio-economic and environmental aspect-
Noriyuki Kobayashi
NIHON UNIVERSITY Law School The tropical peatland is important for the global environment and socio-economical resources. Recently, interest for the tropical peatland is increasing due to their importance as carbon sinks and stores. In Indonesia, before the 1960s, most of the tropical peatland were remained as undeveloped due to their inferior nature as agriculture land and difficult access. Since the 1970s, the Peat Swamp Forest has been opened by logging operation in Central Kalimantan and Southern Sumatra. In Central Kalimantan, the Mega Rice Project (MRP) was enforced in 1990s for development of transmigration area by logging down Peat Swamp Forest and digging drainage. Also, numbers of development of the oil palm plantation were increased in peatland of Sumatra and Kalimantan. By those human activities, tropical peatland swamp forest resources and natural function are being damaged severely. In 1997 and 2002, during the prolonged dry season, fire was spread out peatland throughout Indonesia and caused huge amount of carbon emission. It is pointed out that there is a great dilemma in using tropical peatlands. On the one hand, tropical peatland provide water recourses, carbon storage and a wide biodiversity; on the other hand, the pertlands may provide a solution to the problems of population growth and the lack of farming land (Bambang Setiadi, 2007). Above mentioned opinion clearly pointed out the importance of sustainable management of tropical peatland, considering both environment and socio-economic aspect. In order to achieve sustainable management of tropical peatland, it is considered to tackle problems by the global lebel (international co-operation), the national and the regional level. In this report, I would like to describe the sustainable management of Indonesian peatland in focusing peatland fire from the view point of international co-operation and local governance.
Attribution of Recent Arctic Change
John E. Walsh International Arctic Research Center, University of Alaska
Fairbanks, Alaska USA It is well established that much of the Arctic has warmed during recent decades at rates faster than most of the rest of the world. Among the possible drivers of this warming are internal variability in the earth system as well as changes in external forcing, including the increase of greenhouse gas concentrations. Both types of drivers may be amplified by feedbacks. In this presentation, we will use the geographical and seasonal patterns of Arctic warming to identify the roles of three particular contributions to the recent Arctic warming: the snow/ice- albedo-temperature feedback, the lateral transport of heat into the Arctic from middle latitudes by the atmosphere and the oceans, and the radiative forcing by increased greenhouse gas concentrations,. Recently published work indicates that each of these factors has had a detectable impact on Arctic changes over the past few decades. The albedo-temperature feedback has been most apparent over the northern land areas during spring, and over the Pacific sector of the Arctic Ocean during the summer and autumn. The radiative impact of earlier snowmelt over North America and Siberia provides considerable leverage to warming by increasing the surface absorption of solar radiation. Across the pan-Arctic land areas, an overall reduction in the duration of snow-covered ground by ~2.5 days per decade during 1970-2000 has resulted in near-surface atmospheric heating of ~1.0 W m-2 per decade during spring, which is larger than the direct radiative effect of the the increase of CO2 during the same period. The lateral influx of warmer ocean waters is apparent in results obtained from cruises over the Chukchi and East Siberian Seas by Japanese scientists and from cruises in the Kara and Laptev Seas by U. S. and Russian scientists. Shimada et al. (2006, Geophys. Res. Lett.) propose a feedback mechanism whereby the early-winter delay in sea ice formation, which began in 1997/1998, reduced internal ice stresses and rigidity, allowing storm winds to more efficiently mix the upper ocean. The result is an increased in the flux of warm Pacific summer water into the basin. The U.S./Russian cruises and associated mooring measurements, part of the Nansen-Amundsen Basin Observing System, have detected increasingly warm pulses in the Atlantic Water layer north of Siberia, with signs of an upward heat loss as the water circulates eastward along the Siberian shelf break (Polyakov et al., 2008, submitted). Meanwhile, an increase of atmospheric energy transport into the Arctic from middle latitudes shows correlation with the warming of the Arctic atmosphere, particularly with respect to the vertical dependence and seasonality of the warming (Graversen et al., 2008, Nature). Global climate models run with prescribed increases of greenhouse gas concentrations provide a vehicle for identifying the greenhouse signal in climate change. Composite fields based on ensembles of model simulations eliminate much of the natural variability. The remaining changes have strong seasonal and spatial characteristics that can serve as a greenhouse signature for use in attribution studies. We compare this signature with recent observed changes, integrated spatially as much as possible to eliminate the regional-scale natural variations, and conclude that the greenhouse signature is present in the recent warming. Different models show different levels of skill in their ability to capture the seasonal and spatial patterns of Arctic climate. These differences have important implications for the use of the models to obtain projections of future greenhouse-driven changes in the Arctic. While model selection is an active area of research by the global climate community, we present here the results of an evaluation of models based on the Arctic simulations by the models used in the IPCC’s Fourth Assessment Report (2007). This evaluation forms the basis for the selection of a subset of models to narrow the range of projected future changes in the Arctic. The assessment is based on the simulated seasonal cycles of Arctic surface air temperature, precipitation and sea level pressure over several domains: the extratropical Northern Hemisphere (20-90°N), the Arctic (poleward of 60°N) and
particular Arctic subregions such as Alaska and Greenland. While no single model is the best in simulating all variables in all seasons, several models consistently outperform others. Included among the top-performing models are the German Max-Planck Institute model (ECHAM5), the U. S. Geophysical Fluid Dynamics Laboratory’s GFDL-CM2.0 model, and Japan’s MIROC3.2 (medres) model. When the skill of Arctic simulations is evaluated as a function of the number of models over which the results are composited, an optimum subset of models is found to consist of the best 5 or 6 models. When future greenhouse-driven changes in the Arctic are evaluated from such a subset of models, the projected changes are larger than obtained from the entire suite of IPCC-AR4 models. The results imply that “best estimates” of future Arctic change may be larger than one would deduce from averages based on all available models. Our conclusion is that the Arctic-wide temperature is very likely to continue its increase as greenhouse gas concentrations increase over the next several decades. However, local changes of temperature will be much more variable as they will be affected by feedbacks and by shorter-term excursions driven by natural variations in the atmospheric and oceanic circulations. The most credible projections will continue to be provided by global climate models, although projections can be optimized by model selection and by assessments of the models’ abilities to capture feedbacks and low-frequency variability.
Achieving climate predictability through understanding of the arctic system
Larry Hinzman
International Arctic Research Center, University, of Alaska Fairbanks Fairbanks, Alaska, U.S.A.
The research problems inherent to arctic regions are of critical importance and have global implications impacting many nations. Many nations must bear partial responsibility in addressing these problems and collaborate if we hope to address these issues on a short time frame. Some of these issues include climate change, contaminant transport, ecosystem dynamics and engineering analyses. There are processes, which have been studied intensively in one region, but remain little understood in other regions. Multi-national collaboration enables broader regional validation of algorithms, presenting more economical assessments of models. International collaboration enables more rapid, and perhaps, more technically correct, solutions to important research questions. The International Arctic Research Center at the University of Alaska Fairbanks is an international focal point for (1) synthesis of our understanding of the Arctic System and (2) the application of this understanding to prediction of the evolution of the Arctic system over the next century. Our over-arching goal is to reduce the uncertainty in predictions of Arctic change. Our studies are intended to provide a better understanding of how individual components and processes interact to form a complex and dynamic arctic system. Through collaborations with Arctic researchers throughout the world, we can achieve our goals of developing a quantitative understanding of the Arctic System. In order to do so, we must understand ongoing changes. Understanding, in turn, requires attribution in terms of characterizing and quantifying linkages among system components. IARC’s strategy for synthesizing our understanding and predictive capabilities is to entrain the international Arctic research community into activities that are essential for scientific progress and that are not amenable to support through conventional funding channels. We have strived to conduct process studies and collect field measurements that may provide the understanding needed to develop and validate models. Examples include quantifying the variability in distribution, age structure and thickness of perennial sea ice. This understanding is central to the development of coupled models of atmospheric dynamics, oceanic circulation and sea ice degradation and export. The physical and biological controls of carbon fluxes are at the core of global change, yet quantifying methane and CO2 fluxes in the Arctic and assessing their feedbacks are among the greatest challenges facing the Arctic research community. Documenting physical changes in the climate will contribute nothing to our understanding if we do not synthesize those observations into higher-level integrated analyses to address societal needs. To that end, we are developing better models of the forest dynamics and forest fires driven by satellite imagery so that we are better able to manage boreal forests for carbon flux and sequestration. All of these activities are key components of the Arctic System and will provide the tools and understanding needed to predict the system level responses to a changing climate. The complex interplay of physical, chemical, biological and social processes interact to such a degree that it is not possible to understand future trajectories without developing more fully holistic perspectives of the complete system. The components of the Arctic are inter-related through a complex network of linkages, feedbacks and multi-dependent interactions. Theoretically a change in one variable in a part of the system can initiate a cascade of effects throughout the system, and these connections need to be understood and quantified in order to achieve a level of predictability. A central objective of IARC research is to reduce uncertainty in predictions of future climate. This objective encompasses our understanding of change, attribution of change, and future rates of change. We feel that this is the only reasonable approach to predictability and will help society prepare for and adapt to ongoing environmental changes in the Arctic. This is a huge task, and we will need to work collectively and in collaboration with our international colleagues to succeed. There is no question that climatic change is currently underway. It is important that our society is prepared for the changes that are ongoing and the dramatic changes to come. Our society must prepare for the ongoing changes to our environment and the only way to adapt effectively is to know with some certainty what those changes will be. We must quantify not
only what the changes will be but also how rapidly these changes are coming. Prediction requires understanding, especially with regard to the relative importance of the different drivers of these changes. Our scientific community is in general agreement that there is a component of anthropogenic change overlying natural variations. Even these climatic changes that occur naturally (such as past ice ages) are affected by external drivers such as fluctuations in solar radiation. In order to accurately predict what climatic changes we will see in the next 10, 20 or 50 years, we must correctly understand how these natural and manmade drivers of change interact. With understanding, comes predictive capability and from that comes the ability to adapt and prepare. These challenges are of such magnitude that they cannot be resolved by any single nation. The International Arctic Research Center was created to facilitate international collaboration to address the problem of predictions of climate change in the Arctic. The mission of IARC is to reduce the uncertainty of climate change prediction by integrating field studies with rigorous modeling analyses and synthesis to create and cohesive understanding of the Arctic system. Focused activity such as those at IARC is an expedient and efficient way to address the challenges of climate change. Many impacts of climatic change in the Arctic require immediate attention and planning of responses. These include crumbling infrastructure with degradation of permafrost, migration or possible extinction of Arctic species, coastline erosion, and natural resource extraction. The products of these studies will enable policy changes and improved community planning for Arctic regions. These community planning decisions will serve as a prototype for planning the rest of our nation and the globe.

Comparative study on circumpolar forest ecosystems
Y. Matsuura
Soil Resources Laboratory, Department of Forest Site Environment, Forestry and Forest Products Research Institute (FFPRI),
Tsukuba, Ibaraki 305-8687 Japan
Ecological research in the circumpolar forest ecosystems has revealed new characteristics of those biomes in terms of carbon storage and ecosystem structure. Soil surveys were conducted in northeastern Eurasia (continuous permafrost), in Interior Alaska (discontinuous permafrost) and in Northwest Territories Canada (sporadic permafrost). Soils in eastern Siberia include larch forest soils of Yakutian Basin and forest tundra soils in lower Lena River, Kolyma lowland, and upper Indigirka River. Grassland soils in Yakutian Basin developed on the thermokarst landscape showed alkaline pH regime. Soils of central Siberia were derived from weathered basalt rock fragment. Soils of Interior Alaska were surveyed at black spruce, paper birch, and aspen forests. Fire affected soils showed drastic subsidence of permafrost table after fire disturbance. Soils in NWT Canada were derived from glacio- and/or lacustrine-deposit. Soils of pure jack pine, pine/aspen mixed, and aspen stands were surveyed. The SOC storage in those regions varied site to site. Large SOC storage occurred on waterlogged soils in Kolyma lowland, mountain forest tundra in upper Indigirka, and thermokarst grassland in Yakutian Basin. Soils of thermokarst grassland in Yakutian Basin showed strong alkaline pH above 8 in subsoil, with distinct carbonate-C accumulation. The average soil C/N ratios of eastern and central Siberia were 14.2 ± 5.8 and 19.8 ± 2.6, respectively. Soils in Interior Alaska and NWT showed lower regime of SOC storage than those of Siberia. Soil C/N ratios varied site to site, however, soils of Interior Alaska showed higher average C/N ratio than those of NWT soils (18.3 ± 4.2 in Interior Alaska and 13.3 ± 2.4 in NWT). The comparative soil study with the concept of “bedrock origin versus deposit origin” may explain the different C/N ratio regime. Though the SOC storage values varied much site to site in northeastern Eurasia, SOC regime is larger at one order of magnitude than those of North America. Much SOC accumulated under severe continental climate condition where larch forest dominates on continuous permafrost. A couple of factors that govern soil-forming process are critical even in northern regions, where soil development occurs at slower rate. The most critical factor that determined SOC storage regime of both regions is whether there had been glaciated or not in Pleistocene and Holocene. The Quaternary geological history and ice sheet distribution is also important factor, which affected the soil parent material and permafrost distribution at present. The comparative study with the concept of “glaciated versus non-glaciated” is also useful for better understanding of nutrient storage and cycling in circumpolar forest ecosystems. The unique patterns of carbon storage and carbon allocation in forest ecosystems are also discussed.
Remote sensing of wildfire influence on carbon budget in boreal forests Keiji Kushida Institute of Low Temperature Science, Hokkaido University Abstract Wildland fires release green house gases such as CO2, CO, CH4, NO2, and non-methane hydrocarbons (NMHC) as well as black carbon particles into the atmosphere. Intergovernmental Panel on Climate Change (IPCC) 4th report remarked that the world wildland-fire combustion release CO2 equivalent to 20 – 60% of the anthropogenic carbon release to the atmosphere. Along with regeneration after a fire, CO2 is absorbed in the recovered vegetation. However, an increase in fire frequency causes ignitions before full recovery, reducing the carbon storage in the vegetation and soil. This implies that the carbon is released from the ecosystem to the atmosphere. The global boreal forest has the accumulated carbon more than any other ecosystems in the world. Changes in climate and fire regimes have been occurring for decades in the boreal forest. In order to refine the wildfire influence on the carbon budget in the boreal forests, we evaluated the estimation of the area ratios of the land categories including the total-burn/wither and surface-burn areas following a wildfire in East Siberia from remotely sensed data. For evaluating the carbon budget before the fire, we estimated the geographical distributions of the carbon budget in East Siberian larch and Alaskan spruce forests. Throughout my presentation, I introduce up-to-date studies on remote sensing toward better understandings of the wildfire influence on the carbon budget in the boreal forests.
Detection of Global Change: Are we succeeding with this endeavour ? Atsumu Ohmura Institute for Atmospheric and Climate Science Swiss Federal Institute of Technology (E.T.H.) The capability to detect important changes in our environment has become more important as the surrounding condition for human being has become tougher and the human population is increasing in an accelerating rate. Dedicated monitoring projects are becoming more important. Human desire and capacity to detect such changes have by now a history of at least a century. Some changes are successfully detected before they got out of hand. Other changes managed to creep through without being detected. For the former the discovery of the eastward shift of a hot water body in the Equatorial West Pacific as an initial phase for the El Nino can be considered. For the latter we must count the climate warming which is to a great extent human induced. In many cases the key problem is not the human incapability of detecting important changes, but the human unwillingness to accept the changes as important issues. The speaker surveys the history of the 20th century monitoring activities, and draws the balance of success and failure. A certain organizational changes in our society to improve our response strategy for adverse global changes will be recommended.

Rapid decay of the Greenland and Antarctic ice sheets?
Ralf Greve Institute of Low Temperature Science
Hokkaido University Sapporo, Japan
In Chapter 10 (“Global Climate Projections”) of the Fourth Assessment Report (AR4) of the United Nations Intergovernmental Panel on Climate Change (IPCC), an increase of the mean global sea level by 18-59 cm for the 21st century (more precisely: 2090-2099 relative to 1980-1999) is projected for the six SRES marker scenarios B1, B2, A1B, A1T, A2 and A1FI (Meehl et al. 2007). The main causes for this sea level rise are thermal expansion of sea water and melt-ing of glaciers and small ice caps, and to a lesser extent changes of the surface mass balance of the Greenland and Antarctic ice sheets. However, recent observations suggest that ice flow dynamics could lead to additional sea level rise, and this problem is explicitly stated in the AR4: “Dynamical processes related to ice flow not included in current models but suggested by recent observations could increase the vulnerability of the ice sheets to warming, increasing future sea level rise. Understanding of these processes is limited and there is no consensus on their magnitude.” (IPCC 2007). These conjectured dynamical processes are (i) surface-melt-water-induced acceleration of basal sliding, and (ii) increased ice discharge due to reduced buttressing from surrounding ice shelves. The former process is probably more relevant for the Greenland ice sheet, whereas the latter may affect the stability of the West Antarctic ice sheet. On the observational side, recent results from satellite gravity measurements for the period 2002-2005 (Chen et al. 2006, Velicogna and Wahr 2006) indicate surprisingly large mass losses of 239 ± 23 km3/a (0.66 ± 0.06 mm/a sea level equivalent) for the Greenland ice sheet and of 152 ± 80 km3/a (0.42 ± 0.22 mm/a sea level equivalent) for the West Antarctic ice sheet, whereas the East Antarctic ice sheet seems to be almost in balance. Furthermore, major outlet glaciers of the Greenland ice sheet (Jacobshavn ice stream, Kangerdlugssuaq and Helheim gla-ciers) and the West Antarctic ice sheet (Pine Island glacier) have sped up drastically during the last 15 years, and a number of significant break-up events of Antarctic ice shelves have occurred. The above-mentioned processes and observations will be reviewed, and it will be attempted to quantify the range of uncertainty of future sea level rise due to ice-dynamical processes by numerical simulations.
References: Chen, J. L., C. R. Wilson and B. D. Tapley, 2006. Satellite gravity measurements confirm accelerated melting of Greenland ice sheet. Science 313 (5795), 1958–1960. doi: 10.1126/science.1129007.
IPCC, 2007. Summary for Policymakers. In: Solomon, S., and 7 others (eds.), Climate Change 2007: The Physical Science Basis. Contribution of Working Group I to the Fourth Assessment Report of the Intergovernmental Panel on Climate Change, pp. 1–18. Cambridge University Press, Cambridge, United Kingdom and New York, NY, USA. URL: http://ipcc-wg1.ucar.edu/wg1/wg1-report.html.
Meehl, G. A., and 13 others, 2007. Global Climate Projections. In: Solomon, S., and 7 others (eds.), Climate Change 2007: The Physical Science Basis. Contribution of Working Group I to the Fourth Assessment Report of the Intergo-vernmental Panel on Climate Change, pp. 747–845. Cambridge University Press, Cambridge, United Kingdom and New York, NY, USA. URL: http://ipcc-wg1.ucar.edu/wg1/wg1-report.html.
Velicogna, I. and J. Wahr. 2006. Measurements of time-variable gravity show mass loss in Antarctica. Science 311 (5768), 1754–1756. doi: 10.1126/science.1123785.
Comparative Marine Ecosystem Studies in Subarctic Regions
Kenneth F. Drinkwater
Institute of Marine Research and Bjerknes Center for Climate Research
Bergen, Norway
Recent changes in climate conditions in several regions of the globe raise concerns about ecosystem resilience and sustainability of ecosystem services. As well, the threat of future climate change has lead many nations to begin to develop ecosystem scenarios and plan adaptative manangement strategies in response to such changes.
Such ecosystem scenarios require a basic understanding of the important processes controlling marine ecosystem productivity. Obtaining such understanding has proved difficult because of the complexity of the ecosystems and their many components. One method that has provided significant insights has been the comparative approach. Comparisons allow the opportunity of taking a broad perspective and permit the ability to draw generalizations, determine what is fundamental to ecosystems and what is unique to particular ecosystems. This talk focuses upon the methods and results of a comparative approach adopted by the program entitled Ecosystem Studies of Sub-Arctic Seas (ESSAS), which is a regional Global Oceans Ecosystems Dynamics or GLOBEC program. ESSAS is an international body with national programs in Japan, the US (Bering Sea), Iceland and Norway, while Canada, Greenland (Denmark), Korea and Russia have also participated in several ESSAS activities. They cover subarctic regions from the Sea of Okhotsk, the Oyashio Current System, the Bering Sea, Hudson Bay, the Gulf of St. Lawrence, the Labrador Shelf and Sea, East and West Greenland, Iceland waters, the Norwegian Sea and the Barents Sea.
Following a brief description of some of the ongoing ESSAS activities, a few examples of recent oceanographic and ecosystem changes that have occurred in subarctic regions in both the Pacific and the Atlantic are presented. These are mainly taken from a project comparing marine ecosystems in Norway and the United States, known as the MENU program. The regions include two in the Pacific (Bering Sea and Gulf of Alaska) and two in the Atlantic (Georges Bank/Gulf of Maine and the Barents/Norwegian Seas). A general warming in these and most subarctic regions has taken place, in both surface and subsurface waters. As well sea-ice coverage has declined and ocean circulation patterns have changed. Annual net primary production generally increases with annual mean sea-surface temperature between systems and within the Eastern Bering Sea, the Barents Sea and Georges Bank and the Gulf of Maine. In areas where the ice has retreated, the increased area of open water has resulted in higher mean annual productivity largely due to increased light levels.

Seasonal SST changes from 1900 to the present for the 4 study regions.
Zooplankton are controlled by both top-down (predation) and bottom-up forcing (advection, primary production) in the Barents and Norwegian seas. In contrast, productivity of both zooplankton and fish in the Georges Bank region is controlled primarily by bottom-up forcing, but is independent of temperature variability. Recruitment of several fish stocks is significantly and positively correlated with temperature in the Eastern Bering Sea and the Barents Sea but cod and pollock recruitment in the EBS has been negatively correlated with temperature since the 1977 shift to generally warmer conditions. In each of the ecosystems, fish species showed a general poleward movement in response to warming with “warm water” species tending to expand their range, while “cold water” species tend to retreat northward.
In some cases proportionately more spawning has occurred in the north, e.g. Atlantic cod off Norway. In addition, the distribution of groundfish in the EBS has shown a more complex, non-linear response to warming resulting from species interactions within the community. Responses to recent warming differ across systems and may be more direct and more pronounced in the higher latitude systems where food webs and trophic interactions are simpler and where both zooplankton and fish species are often limited by cold temperatures.The changes in climate have generally occurred in conjunction with an intensification of fisheries. This has lead to increased stress on several subarctic marine ecosystems. The importance of understanding the interactions of climate and fishing on marine ecosystems will be emphasized.
Expansion of Snake pipe fish from the North Sea to the Arctic between 2003-2006.
Ocean Change Detected From Ocean Analysis/Reanalysis Datasets
MOVE/MRI.COM_RA
Masafumi Kamachi, Satoshi Matsumoto, and Toshiya Nakano
Meteorological Research Institute,
Tsukuba, Japan.
Recent developments of observing system, modeling and data assimilation method enable us to estimate and predict ocean state. As a result, seasonal to interannual forecasting, fisheries, marine safety, offshore industry, management of shelf/coastal areas, security applications, and improved information for related fields (e.g., marine biogeochemical process and numerical weather prediction) are among the expected beneficiaries of ocean data assimilation and prediction.
We discuss the current status of ocean data assimilation, prediction and its application to understanding of ocean variability in two categories, “Ocean Weather” (mesoscale to coastal ocean states) and “Ocean Climate” (ocean part in climate system), with examples mainly adopted from the project of Meteorological Research Institute (MRI) ocean data assimilation system MOVE/MRI.COM. We show that both of ocean observing systems and ocean modeling act as important roles for understanding ocean phenomena with climate change through data assimilation; various types of water mass are analyzed through data assimilation; long range variability is analyzed with ocean analysis/reanalysis datasets MOVE/MRI.COM_RA.
Figure 1 shows an example of the climate change in the ocean. Freshening at mid-depth in the
North Pacific subtropical gyre is detected from MOVE/MRI.COM_RA which period is from 1948 to 2006. Long-term variation of the potential temperature and salinity (θ-S) diagram is shown in Figure 1(a). Mean θ and S for early 1970s and early 2000s along 137°E section are plotted from 22°N to 25°N in the center of the latitude range of the salinity minimum core of the North Pacific Intermediate Water. Using the mean salinity field for early 1970s and the mean potential temperature field for early 2000s, we plotted the averaged σθ-S diagram from 22°N to 25°N in Figure 1(b). This holds the salinity constant from early 1970s to early 2000s. A contribution to the freshening of the global warming effect in the upper layer of the salinity minimum core is large (about 60% on 26.2σθ surface and about 45% on 26.4σθ surface). Below the 26.5σθ surface, a contribution to the freshening of the warming effect is very small. The depth of isopycnal surface is deepening by the warming effect above the salinity minimum layer (Figure 1c). One of the causes of freshening in the mid-depth layer is isopycnal surface deepening which is due to global warming in the subsurface layer.

(a) (b) (c)
Figure 1 Time variation of the averaged (a) θ-S curve, (b) σθ-S curve, and (c) the depth of isopycnal surface for 22°-25°N in the latitude range along the 137°E section. Open (closed) circle denotes the early 1970s (2000s). Cross in (b) and (c) indicates the potential density calculated from the mean salinity field for early 1970s and the mean potential temperature field for early 2000s.

Digital Typhoon: A Data-Centric Approach to Events on the Earth
Asanobu KITAMOTO
National Institute of Informatics
Tokyo, Japan
Typhoons are one of the most significant
atmospheric events on the earth. They give large
impacts to human society, hence early warning,
accurate forecast, and the sharing of information,
among others, is regarded as important research
challenges for mitigating typhoon impacts. Although
these challenges have been tackled by many researchers, our aim is to give a new perspective on
these issues from informatics point of view. We mainly focus on two issues. Firstly, we combine
real-time data with past data in the databases so that users can compare the present typhoon with past
typhoons. Secondly, we expand data sources from authorities to grassroots so that local and diverse
information can be aggregated and shared among people in many places.
Figure 1 Typhoon image collection.
A concept behind these approaches is “data-centric” science, in comparison to
“computation-centric” science, which is typical in the current researches of meteorology.
Data-centric science is claimed to be the fourth generation in the history of science, namely starting
from empirical science, theoretical science, computational science, to data-centric science. In the
context of meteorology, it begins with the observation of the sky, and theories of the atmosphere
were established later. After the invention of computers, research shifted to computational
meteorology, where the simulation of the atmosphere became the most important tool of research.
Now, a data-centric meteorology, which we call “meteoinformatics,” started to play an important
role, because the value of research is emerging in the analysis of huge amount of data produced from
observations and simulations. These analyses should be done through the integration of many kinds
of data, such as observation data, reanalysis data, simulation data, social data, and many other data.
Relationships between data can be defined theoretically, statistically or logically, and similarity or
significance of data is a useful measure in some cases to characterize the important aspects of data.
Digital Typhoon (http://www.digital-typhoon.org/) is our project on typhoons based on a
data-centric approach [1]. It is a database of typhoons, but it is significant in the amount of data
archived and the heterogeneity of data integrated. Table 1 summarizes the amount and variety of
archived data, while Figure 1 shows the typhoon image collection in Table 1. The table shows that
the data ranges from image data to text data, and to numerical data. Digital Typhoon archives not
only objective data such as simulation data, but also subjective data such as participatory reports. It

integrates those heterogeneous data and computes relationships between many kinds of data. The
advantage of dealing with typhoons is that they can be identified as events with unique names (in
fact, giving unique names is operationally done by Japan Meteorological Agency), which are used
throughout the system. We then formalize basic searching operations and allow users to combine
them sequentially, such as visualizing tracks of typhoons whose news articles contain the word X.
Other unique searching operations focus on similarity between data, such as searching past typhoons
that have similar cloud patterns with the present typhoon. These data-centric operations are useful
when rigorous theories are not known and/or people are familiar with analogy-based inferences.
In a data-centric approach, the visualization of data is also an important challenge. Typhoon Front
(http://front.eye.tc/) is an example of information visualization designed for participatory media. The
purpose of this interface is to visualize user generated content on local typhoon information as a
time-series animation so that people can easily see when, where and what local people are saying
about typhoons. Because many events on the earth are essentially local, people on the spot can tell
the situation in most detail. Participatory media is often blamed for its unreliability of information,
but we believe that this will play an important role in the detection of changes or events on the earth.
Our research achievements have been developed and opened on the Web with advanced
searching and visualization functionality introduced above. Our websites have been attracting many
people since the opening in summer 2003 -- the total number of page views exceeded 65 million,
with 850 thousand page views in a day at maximum (this is when a typhoon made landfall in Japan).
Our future work includes the integration of databases with simulators to construct an integrated
prediction system that can learn from the past and the present events.
Table 1. The amount and heterogeneity of data in Digital Typhoon (as of June 2008).
Data Type Year Since Number of Data (Records, Scenes)
Meteorological satellite imagery 1978- About 200,000 scenes
Typhoon best track data 1951- (1906-) 1520 typhoons (955 Australian cyclones)
Typhoon image collection 1978- About 150,000 images
AMeDAS observations 1976- About 350,000,000 records
News articles (text data) 2003- About 10,000 articles
Participatory reports (text + image
+ movie data)
2004- About 1,000 reports
Ground-based camera images 2004- About 2,000,000 scenes
Grid Point Value (GPV) data 2002- About 5,000 scenes (GSM) + 11,000
scenes (MSM)
[1] Asanobu KITAMOTO, "Digital Typhoon: Near Real-Time Aggregation, Recombination and
Delivery of Typhoon-Related Information", Proceedings of the 4th International Symposium on
Digital Earth, (CD-ROM), 2005.
Sentinel Asia
Kazuya Kaku Satellite Applications and Promotion Center, Japan Aerospace Exploration Agency
Tokyo, Japan
The APRSAF was established in 1993, in response to the declaration adopted by the Asia-Pacific International Space Year Conference (APIC) in 1992, to enhance the development of each country’s space program and to exchange views toward future cooperation in space activities in the Asia-Pacific region. APRSAF was originally designed to provide opportunities for regional space agencies and associated governmental bodies to exchange technical views, opinions and information on national space programs and space resources.
According to UN statistics, the Asia and Oceania region has the largest proportion of natural disasters in the world. Even before the recent Indian Ocean Tsunami and earthquakes in India and Pakistan, compounded by its high levels of population (close to 3 Billion), the region has more than 50% of the global fatalities associated with such disasters.
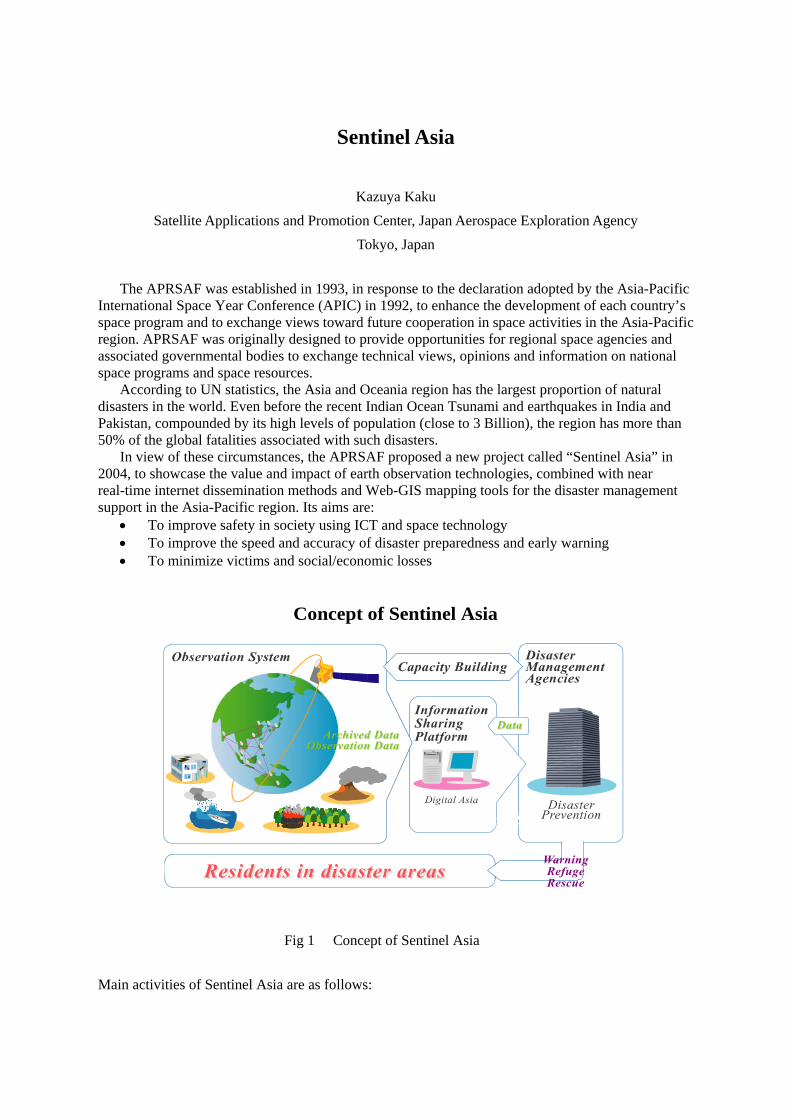
In view of these circumstances, the APRSAF proposed a new project called “Sentinel Asia” in 2004, to showcase the value and impact of earth observation technologies, combined with near real-time internet dissemination methods and Web-GIS mapping tools for the disaster management support in the Asia-Pacific region. Its aims are:
• To improve safety in society using ICT and space technology • To improve the speed and accuracy of disaster preparedness and early warning • To minimize victims and social/economic losses
Concept of Sentinel Asia
Fig 1 Concept of Sentinel Asia
Main activities of Sentinel Asia are as follows:
• Emergency observation by earth observation satellites in case of major disasters • Acceptance of observation requests • Wildfire monitoring and Flood monitoring • Capacity building for utilization of satellite images for disaster managemen
Operations of Sentinel Asia have been commenced since October 2006 by opening its Web site. (http://dmss.tksc.jaxa.jp/sentinel)
Approach of Sentinel Asia is as follows: (1) Contribution to Disaster Management:
Sentinel-Asia is “voluntary initiative” led by the APRSAF to share the disaster information in the Asia-Pacific region to make the best use of earth observation satellites data for disaster management in the Asia-Pacific region by applying remote sensing technology, GIS technology, and ICT. The concept of Sentinel Asia is shown in Fig 1.
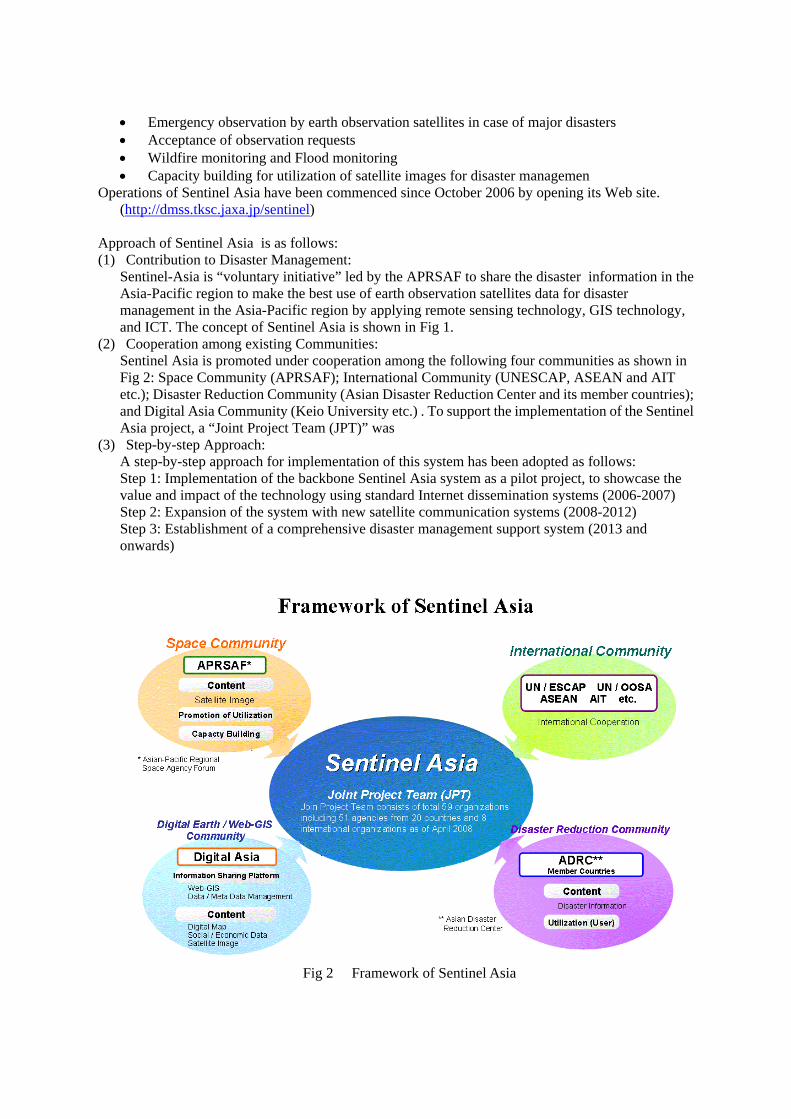
(2) Cooperation among existing Communities: Sentinel Asia is promoted under cooperation among the following four communities as shown in Fig 2: Space Community (APRSAF); International Community (UNESCAP, ASEAN and AIT etc.); Disaster Reduction Community (Asian Disaster Reduction Center and its member countries); and Digital Asia Community (Keio University etc.) . To support the implementation of the Sentinel Asia project, a “Joint Project Team (JPT)” was
(3) Step-by-step Approach: A step-by-step approach for implementation of this system has been adopted as follows: Step 1: Implementation of the backbone Sentinel Asia system as a pilot project, to showcase the value and impact of the technology using standard Internet dissemination systems (2006-2007) Step 2: Expansion of the system with new satellite communication systems (2008-2012) Step 3: Establishment of a comprehensive disaster management support system (2013 and onwards)
Fig 2 Framework of Sentinel Asia
Overview of Sentinel Asia Wild Fire Initiative
Masami FUKUDA International Arctic Research Center, University of Alaska Fairbanks
Fairbanks, Alaska USA
Introduction In 2005, Sentinel Asia activity was authorized at the APRSAF Meeting in Japan as to
mitigate natural disasters in Asian Countries. Before the establishment of Sentinel Asia, JAXA conducted
the survey among Asian counties about the required disasters to be mitigated by means of satellite
technology. Large scale earthquake, volcanic eruption and Tsunami are excluded out from target disasters
because of unpredictability of these natural hazards. Countermeasures to these disasters are difficult its
unpredictable nature. Two disasters, those are wild fire and flood, were selected to be major objectives for
mitigation programs. Then two working groups were set up in Sentinel Asia Program. One of these
working groups, wild fire working group is functioned as Sentinel Asia Wild Fire Initiative. During initial
period of activity called Step1 for two years, wild fire Initiative members conducted substantially important
activity as to initiate the full operation in next Step2. In this paper, author reports the main activity of this
working group and perspective to next Step2.
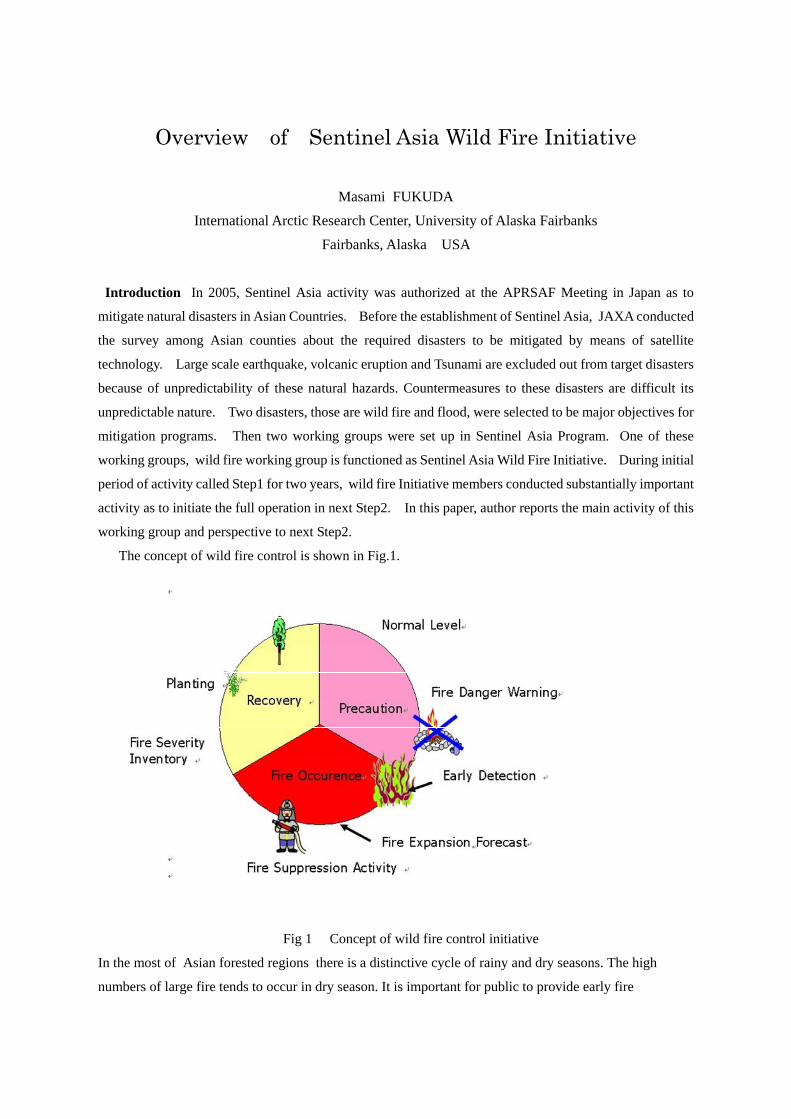
The concept of wild fire control is shown in Fig.1.
Fig 1 Concept of wild fire control initiative
In the most of Asian forested regions there is a distinctive cycle of rainy and dry seasons. The high
numbers of large fire tends to occur in dry season. It is important for public to provide early fire
danger warning. Our activity may develop the fire danger index based upon current weather condition
and fuel condition in the forest. However once fire occurs in some location, the earliest detection of fire
occurrence by Satellite is also important. The initiative will develop the hot spot detection algorithm.
Once fire site is detected , the fire expansion forecast will be done in real time. The most effective fire site
information will be directly sent to the local fire fighting agency. The post fire remediation is also
planned based on appropriate burnt information obtained by Satellite data. From the normal stage to fire
occurrence and post fire treatment, tactical information for fire suppression is generated in real time
manner using Satellite data.
Validation Campaign in 2206 and 2007 One of the key technology is the earliest fire detection by
MODIS data. The conventional detection algorithm was developed by NASA termed as MOD14. In some
case of fire occurrence in Asian forest, false alarms are frequently picked up. These false alarms mainly
arouse due to in appropriate threshold temperature in the algorithm. Our team conducted validation field
campaign in Kalimantan Indonesia, northern Thailand and Mongolia. Local fire fighting team made the
field record reports of fire occurrence with GIS data. At the same time, several MODIS receiving stations
such as AIT, Lapan and CRISP generated hot spot mapping. The ground truth data were compared with hot
spot distribution map. Based on these analyses, our Initiative has developed improved hot spot detection
algorithm.
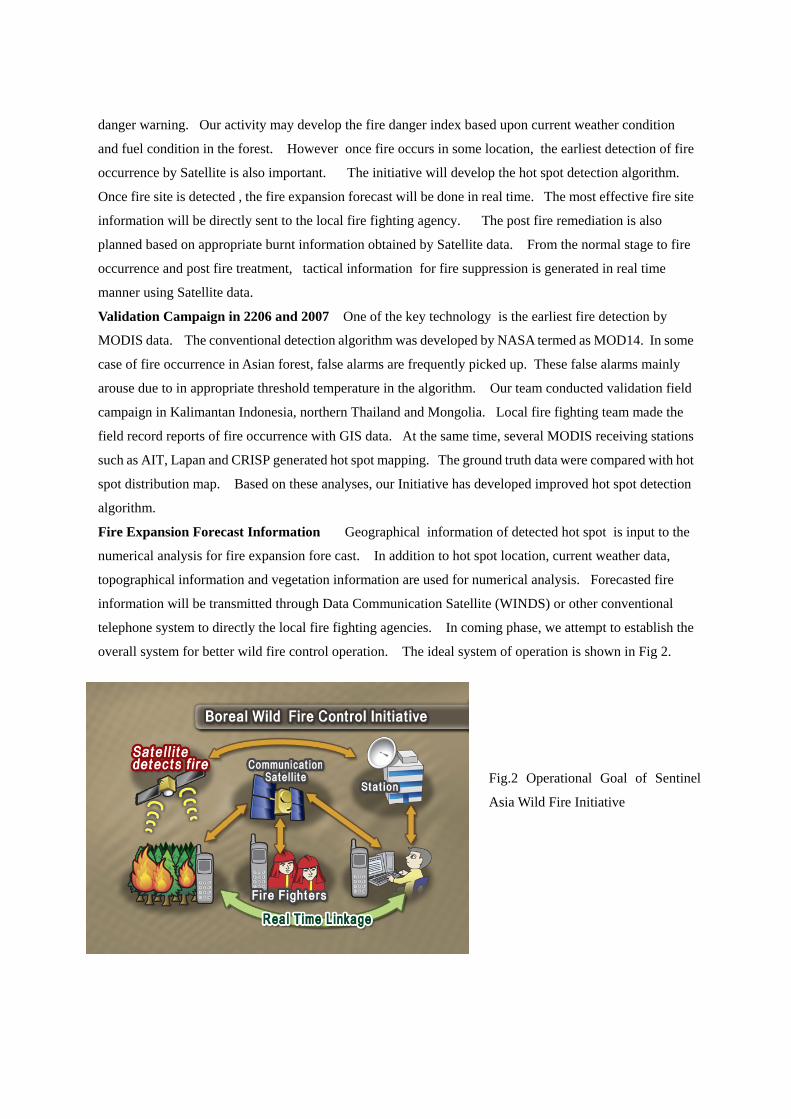
Fire Expansion Forecast Information Geographical information of detected hot spot is input to the
numerical analysis for fire expansion fore cast. In addition to hot spot location, current weather data,
topographical information and vegetation information are used for numerical analysis. Forecasted fire
information will be transmitted through Data Communication Satellite (WINDS) or other conventional
telephone system to directly the local fire fighting agencies. In coming phase, we attempt to establish the
overall system for better wild fire control operation. The ideal system of operation is shown in Fig 2.
Fig.2 Operational Goal of Sentinel
Asia Wild Fire Initiative

Space Applications of JAXA contribute to Earth
Futoshi Takiguchi Satellite Applications and Promotion Center, Japan Aerospace Exploration Agency
Tokyo, Japan
Japan Aerospace Exploration Agency (JAXA) has started new 5-years term since this year, and Space Application Mission Directorate has been reorganized on April 1. It means JAXA seeks to focus on mission oriented activities rather than technology driven activities.
Space Application Mission Directorate of JAXA has three mission programs as follows. Environment monitoring program Disaster monitoring and satellite communication program Positioning application program
Particularly, earth observation activities have been enhanced as environment-monitoring and
disaster-monitoring, and so promoted contribution to climate changes including water cycle variation, global warming and carbon cycle change, and mitigation and prevention of disasters.
Fig.1 shows these activities as for earth observation.
Fig.1 JAXA’s long term plan as for earth observation
The Global Change Observation Mission, specifically GCOM-W and GCOM-C, will investigate
climate changes including water cycle variation. Water characteristics measurement has been
conducted primarily by AMSR-E on AQUA, and will be continued by GCOM-W. In addition, cloud cover will be measured by optical sensor on GCOM-C. And, this optical sensor will have characteristics comparable to MODIS on TERRA/AQUA, so will be expected to contribute to monitoring wild fire.
The Global Precipitation Measurement mission, so called GPM, will observe the three-dimensional structure of precipitation as TRMM follow-on. This measurement mission is a joint cooperative between JAXA and NASA, JAXA will provide a high-performance dual-frequency precipitation radar, and NASA will provide a spacecraft-bus, likely as TRMM mission.
EarthCARE, which is also investigating climate change including water cycle variation and cloud dynamics, is a joint project with European Space Agency (ESA). JAXA provide a Cloud Profiling Radar.
GOSAT, greenhouse gas observation satellite, is now under integration test, and will be launched by H-IIA launch vehicle in this winter, and contribute to understanding global warming and carbon cycle mechanism.
Besides above constructing mission, JAXA has operated Advanced Land Observation Satellite : ALOS (Daichi) successfully since 2006. ALOS collects precise land data not only for 1/25,000 scale global map cartography, but also for regional observation, disaster monitoring, and resource surveying. Especially, JAXA recently highlights disaster monitoring and forest monitoring. As for disaster monitoring activities, providing observation data to Sentinel Asia regional disaster monitoring system, and to international Charter global disaster monitoring system. For forest monitoring, L-band synthetic aperture radar of ALOS playing an important roll, because of its unique wave-length.
Otherwise, data transmission and communication technology must be advanced and robust as
mission data increasingly, so, JAXA has developed mobile communication satellite and wideband communication satellite.
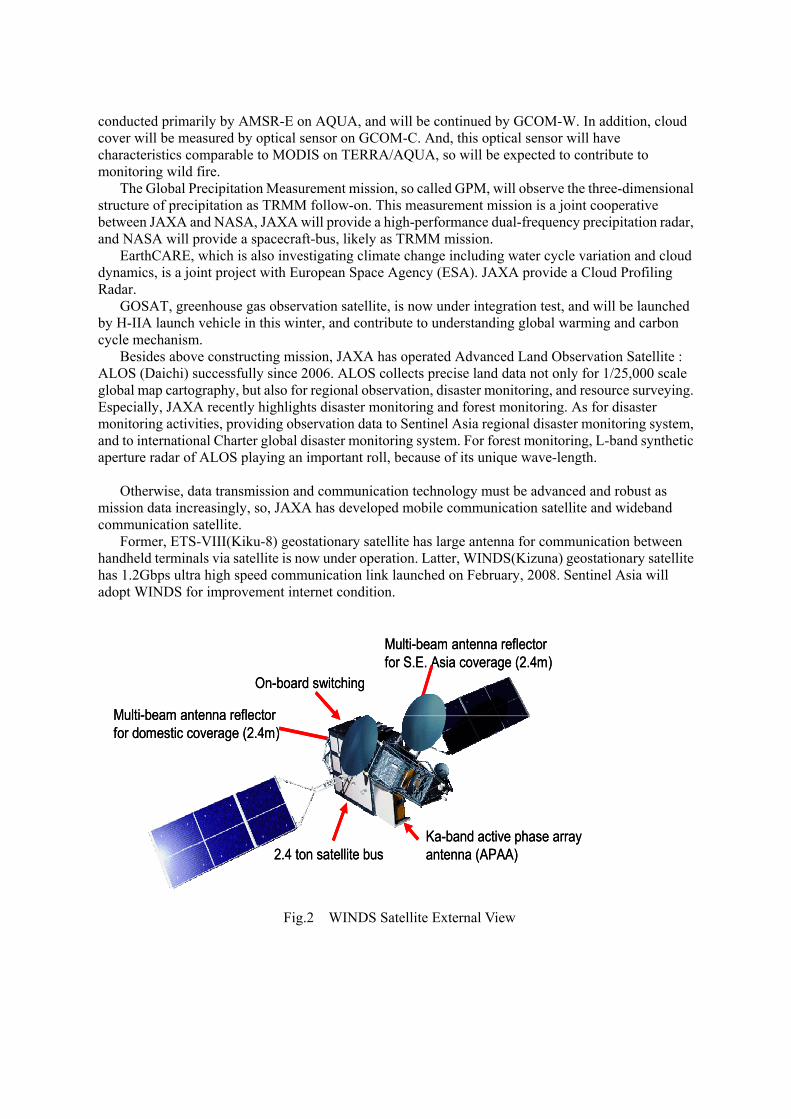
Former, ETS-VIII(Kiku-8) geostationary satellite has large antenna for communication between handheld terminals via satellite is now under operation. Latter, WINDS(Kizuna) geostationary satellite has 1.2Gbps ultra high speed communication link launched on February, 2008. Sentinel Asia will adopt WINDS for improvement internet condition.
Multi-beam antenna reflectorfor S.E. Asia coverage (2.4m)
Multi-beam antenna reflectorfor domestic coverage (2.4m)
On-board switching
2.4 ton satellite busKa-band active phase array antenna (APAA)
Multi-beam antenna reflectorfor S.E. Asia coverage (2.4m)
Multi-beam antenna reflectorfor domestic coverage (2.4m)
On-board switching
2.4 ton satellite busKa-band active phase array antenna (APAA)
Fig.2 WINDS Satellite External View
Forest Fire Control Activities in Thailand
SIRI AKAAKARA Director: Forest Fire Control Division,
National Park Wildlife and Plant Conservation Department, THAILAND
Second only to deforestation, fire plays the most destructive role in the forest ecosystem in Thailand which results in not only drastic deterioration of the environment but also jeopardy to life, health and properties of people Forest fires in Thailand are mainly classified as surface fires, mostly taking place in Mixed Deciduous Forest, Dry Dipterocarp Forest, Secondary Growth and Forest Plantations, and to some extent into Peat Swamp Forest, Dry Evergreen Forest, Hill Evergreen Forest or event in some parts of the Tropical Rain Forest. All fires are caused by human activities such as gathering of forest non-timber products, agricultural debris burning, incendiary fire, hunting and carelessness. Statistically, about 19,000 ha of forests is affected by fire annually.
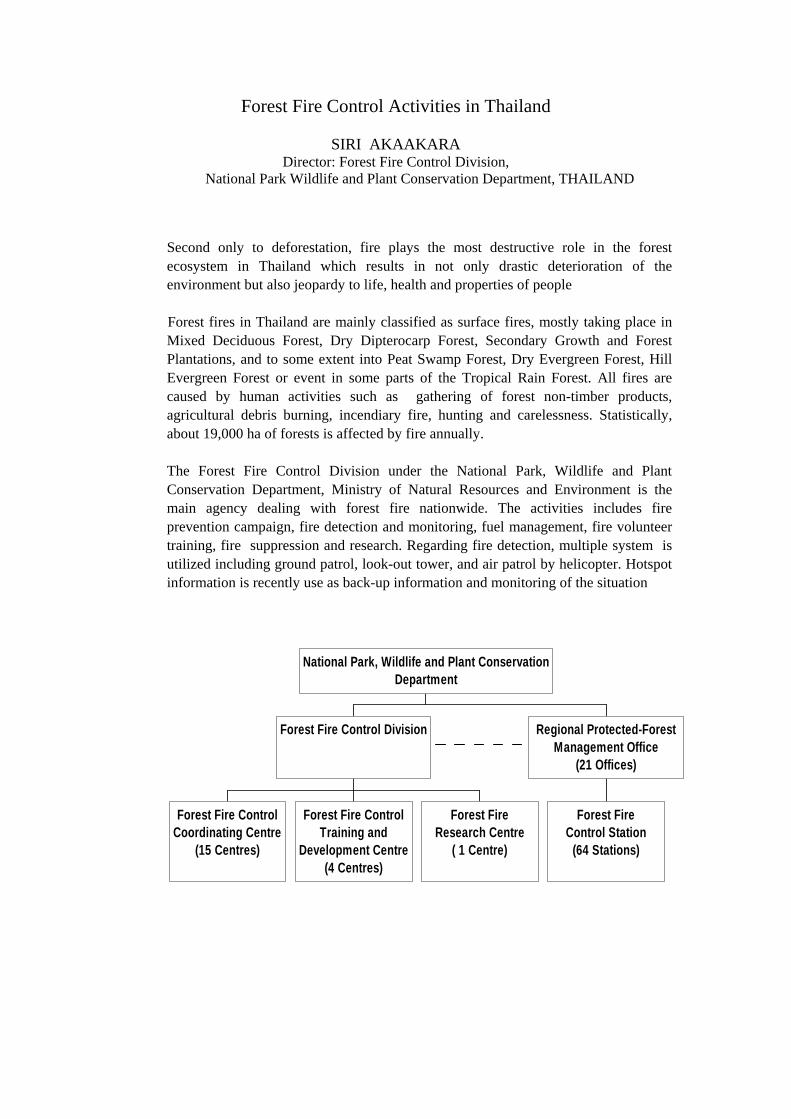
The Forest Fire Control Division under the National Park, Wildlife and Plant Conservation Department, Ministry of Natural Resources and Environment is the main agency dealing with forest fire nationwide. The activities includes fire prevention campaign, fire detection and monitoring, fuel management, fire volunteer training, fire suppression and research. Regarding fire detection, multiple system is utilized including ground patrol, look-out tower, and air patrol by helicopter. Hotspot information is recently use as back-up information and monitoring of the situation
Forest Fire ControlCoordinating Centre
(15 Centres)
Forest Fire ControlTraining and
Development Centre(4 Centres)
Forest FireResearch Centre
( 1 Centre)
Forest Fire Control Division
Forest FireControl Station
(64 Stations)
Regional Protected-ForestManagement Office
(21 Offices)
National Park, Wildlife and Plant ConservationDepartment
Forest fire situation and main study activities in South Korea
Byungdoo Lee
Korea Forest Research Institute
Seoul, Korea
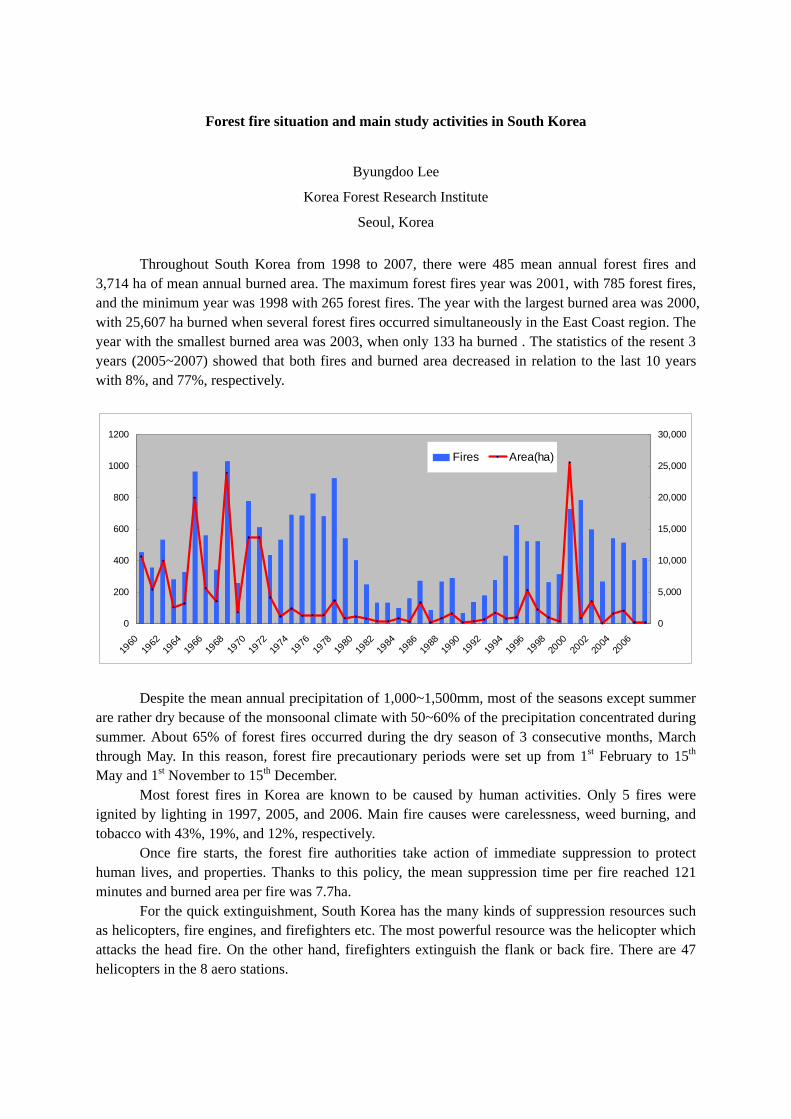
Throughout South Korea from 1998 to 2007, there were 485 mean annual forest fires and
3,714 ha of mean annual burned area. The maximum forest fires year was 2001, with 785 forest fires, and the minimum year was 1998 with 265 forest fires. The year with the largest burned area was 2000, with 25,607 ha burned when several forest fires occurred simultaneously in the East Coast region. The year with the smallest burned area was 2003, when only 133 ha burned . The statistics of the resent 3 years (2005~2007) showed that both fires and burned area decreased in relation to the last 10 years with 8%, and 77%, respectively.
0
200
400
600
800
1000
1200
1960
1962
1964
1966
1968
1970
1972
1974
1976
1978
1980
1982
1984
1986
1988
1990
1992
1994
1996
1998
2000
2002
2004
2006
0
5,000
10,000
15,000
20,000
25,000
30,000
Fires Area(ha)
Despite the mean annual precipitation of 1,000~1,500mm, most of the seasons except summer are rather dry because of the monsoonal climate with 50~60% of the precipitation concentrated during summer. About 65% of forest fires occurred during the dry season of 3 consecutive months, March through May. In this reason, forest fire precautionary periods were set up from 1st February to 15th May and 1st November to 15th December.
Most forest fires in Korea are known to be caused by human activities. Only 5 fires were ignited by lighting in 1997, 2005, and 2006. Main fire causes were carelessness, weed burning, and tobacco with 43%, 19%, and 12%, respectively.
Once fire starts, the forest fire authorities take action of immediate suppression to protect human lives, and properties. Thanks to this policy, the mean suppression time per fire reached 121 minutes and burned area per fire was 7.7ha.
For the quick extinguishment, South Korea has the many kinds of suppression resources such as helicopters, fire engines, and firefighters etc. The most powerful resource was the helicopter which attacks the head fire. On the other hand, firefighters extinguish the flank or back fire. There are 47 helicopters in the 8 aero stations.
For the prevention of forest fires and rehabilitation of burned forests, the following researches are carrying out in the department of forest fire, Korea Forest Research Institute. • Development of the forest fire management system with the aim of detecting and suppressing
forest fires in an early stage • Understanding of forest fire behavior and prediction of how a forest fire spreads • Development of effective and safe fire suppression technologies • Design of a forest fire response system to make the best use of fire fighting resources • Ecological rehabilitation of the fire-damaged forests
For the effective allocation of resources and prevention of fire occurrences, Korean forest fire
danger rating systems (NFFDRS, http://forestfire.kfri.go.kr) has developed and is running in the fire precautionary periods. The NFFDRS is consisted of daily weather index (DWI), fuel model index (FMI) and topography model index (TMI). Also, the scale for each index ranges from 1 to 10. The DWI was induced using meteorological characteristics such as humidity, temperature, and wind speed of 8 local regions.
Forest fire behavior prediction program simulates the fire and determines spread velocity, fire intensity and burnt area over time associated with terrain slope, wind speed and direction, effective humidity and such fuel condition factors as fuel depth, fuel loading and moisture content for fire extinction.
A variety of suppression techniques based on information-communication system were developing for the firefighter’s safety and effective acquisition field information. First, Mobile GIS system for firefighters has some functions notifying the current situation and location of forest fire, mobilizing fire fighters in fire engines, approaching fire site on foot after arrival in fire engines, notifying current situations on fire site, sending information on fire line location, and sending field image, etc.
Second, Forest Fire Occurrence Point Recognition System using Wireless Network composed of wireless telegraph, GPS, and digital compass has developed for the acquisition of quick and accurate ignition point from the watching tower. Ignition point transfers automatically to the forest fire center.
Finally, litter layer smoldering fire detection system was aimed for the finding of remained heat and fire that can cause re-fireing after entire containment of main fire. This system is composed of infra-red sensor, and display monitor.

Comparison MODIS data with NOAA data in case on spring time of 2008 of Mongolia
Odbayar Mishigdorj
Head of RS and GIS division of NRSC of Mongolia
Abstract
We are just few months ago setup new receive station from MODIS. For us very new and very interesting work with MODIS data. We want to compare wild fire detecting by NOAA with by MODIS in this spring by our country. For this reason we want also to compare statistical data from ground observation. Before installation a receive station from MODIS we are detecting wild fire just once for day for daytime by NOAA. Today we are detecting wild fire 5 times for day for daytime. We hope it will decrease the difference between data from ground observation and data from space.
2008_05_30
Satellite-based wildfire monitoring and tracking in Australia A. Alexander Helda aCommonwealth Scientific and Industrial Research Organization, GPO Box 3023, Canberra ACT 2601, AUSTRALIA; [email protected] Abstract – Several natural disasters, including fires, floods and droughts are observable in real-time by earth observing systems. When efficiently combined with modern information-distribution methods, including future data-relay satellites, such data can be processed and sent rapidly to affected communities and local emergency agencies. For instance, satellite-based detection and tracking of wildfires (‘bushfires’) across the Australian continent is regularly performed by CSIRO, Geoscience Australia and Western Australia Landgate agency through the use of several polar orbiting and geostationary satellites. This information is rapidly processed (less that 1-hour after overpass) and delivered via public webGIS systems such as Sentinel Hotspots and ‘Firewatch’ to local emergency agencies, farmers and the Australian public. In addition, research programs by the Bushfire Cooperative Research Centre, a partner with CSIRO and the Bureau of Meteorology, is leading to a widely applicable “grassland curing index’ derived from satellite imagery to identify climatic and vegetation dryness conditions of high bushfire risk. This paper provides a summary of these various ongoing operational and research programs.
LAPAN’s Activities in Supporting Wildfire Early Warning and Detection in Indonesia
Kustiyo and Orbita Roswintiarti
Remote Sensing Applications and Technology Development Center Indonesian National Institute of Aeronautics and Space (LAPAN)
Jalan LAPAN no. 70, Pekayon – Pasar Rebo, Jakarta 13710, Indonesia
ABSTRACT
Wildfire is an increasingly important issue in Indonesia because it has many social, economic and environmental impacts. Wildfire represents a natural hazard which, in many cases, can be predicted, controlled and prevented. In order to support forest/land fire management in Indonesia, LAPAN provides information related with wildfire early warning and detection. The main data used for this purpose are the satellite remote sensing of NOAA/AVHRR and Terra/Aqua MODIS.
Including in the wildfire early warning is the monthly rainfall prediction and daily Fire Danger Rating monitoring. Indirect and influencing factors such as climate variation caused by El Nino/Southern Oscillation (ENSO) often play a significant role in the setting off of wildfire and associated haze. Therefore, prediction of climatological conditions, particularly rainfall, that is likely to result in fires and haze is very important. Moreover, the Fire Danger Rating presents information on the ability or potential of a fire to start, spread and do damage. In the case when the fires occurred, the fire hotspots are monitored to get their positions and locations. In addition, mapping the burnt scars was done when the fire has serious impacts.
In order to improve the quality of the above information along with the near-real time information dissemination, cooperation with related institutions/organizations has been conducted nationally and internationally. JAXA-Japan (Sentinel Asia) and Landgate-Australia (FireWatch Indonesia) are amongst the international institutions that have long-term cooperation with LAPAN in fire activities in Indonesia.
Regional Vegetation Fire monitoring in CRISP
Lim Kim Hwa Centre for Remote Imaging, Sensing and Processing (CRISP)
National University of Singapore
The regional vegetation fire monitoring in CRISP dated back in 1997/98 when large scale vegetation fire broke out in Indonesia. The haze produced had affected many countries in the region, such as Singapore, Malaysia and Brunei. Since then, CRISP has engaged in daily fire monitoring with SPOT satellite imagery. The daily fire monitoring is carried out by first determine the possible fire area from the “hot-spots” of previous day Terra/Aqua MODIS. SPOT images are then acquired over the “hot-spots” area. Full resolution SPOT passes are visually inspected to locate individual fires and to determine the nature of the fire. The locations of each detected fire are annotated in the image. The geographical locations and the nature of the fire (whether it is forest or plantation fire) are recorded as well. A report of the fire observations and the annotated images is sent to the National Environmental Agency of Singapore on the same day. The most recent outbreak of large scale vegetation fire is in year 2006. It coincided with the El Nino Southern Oscillation (ENSO) effect in which the monthly rainfall during the second part of the year is significantly lower than non-El Nino year. The monthly average number of fires detected in Sumatra during the months of August to October exceeded 100. However, the total number of fires detected in the entire year of 2007 is only 91. This is because from 2007 onward the effects of El Nino faded and gave way to La Nina. The monthly rainfall during the later part of the year picks up momentum and return back to the normal non-El Nino year. According to NOAA, a moderate La Nina is developing in mid-2007 and is likely to continue into 2008. Therefore, we believe that it is quite unlikely that a large scale vegetation fire will break out in this year.
AIT Near-Real Time Automatic MODIS Fire Information System for Active Fire Monitoring in Southeast Asia
Vivarad Phonekeo
Geoinformatics Center, School of Engineering and Technology, Asian Institute of Technology, Khlong Luang, Pathumthani 12120, Thailand
Lal Samarakoon
Office of Space Applications, Japan Aerospace Exploration Agency Shin-Otemachi Bldg.7F, 2-2-1 Otemachi, Chiyoda-ku, Tokyo 100-0004, Japan
Nowadays, the global environment has been changed. The change is related to one of the world-hot issue of the global warming. Many disasters have been occurred such as flood, typhoon and wild fire, cause damage the natural resources, the environment as well as to the human life. In this research, we are focusing to the forest fire disaster. The lost due to the fire occurrence in the forest area affect the stability of the environment and could cause other serious natural disaster such as drought, flood and landslide. In order to protect the forest from such disaster, the application of MODIS data is considered to be one of the solutions to this issue. As MODIS data is receiving daily in AIT, it is used to generate the fire pixels for the region. However, only generating MODIS fire pixels based on the MODIS Active Fire Product (MOD14) Production Code version 4.3.2 which was developed by NASA is not enough for efficient monitoring of forest fire. Therefore, the AIT MODIS Fire system has been developed based on the algorithm as mentioned and upgraded to Fire Information System, which includes the generation, data statistical analysis, database archiving, visualization, and validation modules to serve the research activities on forest fire disaster as well as for forest fire protection activities in the countries of the region.
Independence Forest Cover Monitoring and Wildlife information: Field survey of Pathumphone Product Forest Area
in Champasak Province, Lao PDR
Virany SENGTIANTHR and Bounmany KEOSITHONG
The Environment Data Center-EDC, Environment Research Institute-ERI of the Water Resources and Environment Administration-WREA has the responsibility to conduct independent monitoring for the Sustainable Forest and Rural Development- SUFORD project. The Independence Forest Cover Monitoring-IFCM is one of the technical working groups within the SUFORD project. The IFCM technical working group responsible for monitoring forest cover, spatial analysis and field verification. The main objective of the IFCM technical working groups: To independently monitor and assess the changes in the forest cover in the product forest area of SUFORD project province, Lao PDR. The Methodology based on change detection done by using satellite images and field survey to monitor and asses the forest cover on site. Phathumphone PFA has a total area of 31.744 Hectare and consists of 4 sub Forest Management Area-Sub FMAs: Keng nang ang, Thongpha, Kele and Nong bung. The Phathumphone PFA of 36 the villages. In May 2008, survey work was accessed of the 10 villages (Km 40, Thong xay, Phapho, Sanod, Namom, Kheat gnong, Km 37, Km 36, Km 35 and Km 34) in Pathumphone PFA. The field survey was done by using satellite image (SPOT), topographic maps and GPS with described detail coordinate of location and the photos to described the field verification. The detection of general changes in the area such as new roads, constructions, shifting cultivation, plantations etc. The report from the field work are as follows:
1. General description of the area • Area name and location (e.g. PFA) • Area size (total in hectares)
2. Recording of activities in the area related to forest
• Logging (also selective) • Second landings • New infrastructure
3. Recording the impact of the activities in the area • Slash and burn, plantations, shifting cultivation , etc. to the villages)
4. Verify the results from change detection using satellite images
• Checking some of the areas where changes were detected • Major cause of the change e.g. slash and burn for plantations
5. Record the impact from the natural disaster • Lightning
• Forest fire ( Forest fire found in the Thong xay village, Pathumphone, Champasak province . They are mostly observed during the dry season (February to April)
The Water Resources and Environment Administration targets to do independent forest cover monitoring in macro level as a part of overall environment. Need to consideration of the following activities in the near future: 1./ Training in the provinces on Remote Sensing and Geographic Information System and GPS application. 2./ Development of the remote sensing methods to monitor and assess the forest cover and wildfire information. 3./ Promote and development of the use of RS&GIS in to the natural resources management, environment quality monitoring and disaster mitigation;
Scaling approach of ecosystem productivity over black spruce forests in Alaska: a synthesis of the eddy covariance data, and
satellite remote sensing data
Masahito Ueyama (1,2), Yoshinobu Harazono (1,2), Kazuhito Ichi (3)
1) Schools of Life and Environmental Sciences, Osaka Prefecture University 2) International Arctic Research Center, University of Alaska Fairbanks
3) Faculty of Symbiotic Systems Science, Fukushima University Field observations have been conduced to reveal the terrestrial carbon cycle; however, lack of
sufficient continuous observation in high latitude ecosystems makes difficult in estimating their spatial and temporal variability. Therefore, scaling up of observed data to regional carbon fluxes is an important issue in the context of the carbon cycle in the Arctic. In this study, we proposed a new model to scale up the eddy covariance data to estimate regional carbon fluxes, by using satellite-derived data. The eddy covariance measurements were conducted at a black spruce forest in Fairbanks, interior Alaska (64o52’N, 147o51’W). The study period was from 2003 to 2006, when the flux data for model validation were available.
Gross primary productivity (GPP) and ecosystem respiration (RE) were empirically calculated by using normalized difference vegetation index (NDVI) and land surface temperature (LST) from moderate resolution imaging spectroradiometer (MODIS) with a spatial resolution of 250 m. Net ecosystem exchange (NEE) was determined by the difference between GPP and RE. At point scale, the satellite-based model could reproduce the seasonal and interannual variations in the carbon exchange in the black spruce forest in Alaska. The parameterized model also reproduced the carbon fluxes at a black spruce forest in Canada. These results suggested that seasonality of NDVI and the temperature played an important role on the carbon fluxes, and that the model is robust within black spruce forests in North America.
We used the model to estimate regional carbon fluxes over black spruce forests in Alaska. The integrated GPP, and RE between 2003 and 2006 were 1.76, and 1.86 kg CO2 m-2 y-1, resulting in that black spruce forests in Alaska acted as a small carbon source of 0.10 kg CO2 m-2 y-1. According to our model results, the black spruce forests increased the sink strength in spring warming, and decreased it in summer or autumn warming. These results were also consistent with simulation results from a BIOME-BGC model calibrated at the black spruce forest in Alaska.
The methodology of this study is applicable to scale up the observed fluxes to estimate the regional scale, by applying satellite-derived parameters related to observed carbon fluxes. Our future progress in satellite-based empirical modeling to estimate regional carbon fluxes will be realized by their application to other ecosystems.
Decadal variability of carbon fluxes over black spruce forests in Alaska detected by application of NOAA-AVHRR and climate
data
Masahito Ueyama (1,2), Takafumi Date (3), Yoshinobu Harazono (1,2), Tomoyuki Kitamoto (3), Yuji Ota (3), Toru Iwata (3), and Susumu Yamamoto (3)
1) Schools of Life and Environmental Sciences, Osaka Prefecture University
2) International Arctic Research Center, University of Alaska Fairbanks 3) Graduate School of Environmental Science, Okayama University
Satellite remote sensing is a promising tool to monitor the changes in the Arctic. We developed a satellite-based empirical model to detect decadal variability of regional carbon fluxes over black spruce forests in Alaska. The model parameters were derived from the eddy covariance data between 2003 and 2006, including sensitivity of carbon fluxes to air temperature, vapor pressure deficit, shortwave radiation, and normalized difference vegetation index (NDVI). In the stand scale validation, the model successfully reproduced observed gross primary productivity (GPP), ecosystem respiration (RE), and net ecosystem exchange (NEE). The 10-day average of model output was highly correlated with observed GPP (r2=0.9), RE (r2=0.9), and NEE (r2=0.7).
We applied the model to estimate the regional carbon fluxes from 1982 to 2003 by using NDVI from NOAA-AVHRR and climate data. The regional analysis showed that the integrated GPP and RE were 2172, and 2008 g CO2 m-2 y-1 over black spruce forests in Alaska, indicating that these forests acted as a small carbon sink of 164 g CO2 m-2 y-1 during the past 22 years. Our model analysis showed that the GPP was mainly affected by spring air temperature, whereas RE was affected by summer air temperature, indicating that the sink strength of the black spruce forests was controlled by the seasonality in air temperature between spring and summer. Path analysis provided an insight that spring warming increased the carbon sink, but summer warming decreased the sink.
Applicability of visible bands of MODIS to CO2 budget over arctic tundra in Alaska
Yoshinobu Harazono 1,2), Nana Nishida 1), Masahito Ueyama 1,2),
Yoshiaki Kitaya1) and W. C. Oechel3) 1) Osaka Prefecture University, Sakai, Japan
2) International Arctic Research Center, University of Alaska Fairbanks, Fairbanks, USA 3) Global Change Research Group, San Diego State University, San Diego, USA
Many studies have been conducted to improve carbon budget estimations by applying NDVI (Normalized Difference of Vegetation Index), however, MODIS-NDVI provided unclear seasonality in the tundra region, which is mainly caused by dead above ground biomass. In order to accurately estimate tundra GPP (Gross Primary Production), another index instead of NDVI must be applied. We introduced a new index, greenery ratio GR =G/(R+G+B), where R, G and B are spectrum-strengths of red, green and blue, respectively. We examined the applicability of GR to wet tundra by comparing observed tower-based carbon fluxes and GR-estimations, then we applied the GR to MODIS data to scale-up the regional CO2 budget over wet tundra in North Slope, Alaska.
GPP and ecosystem respiration Re were derived from observed NEE (Net Ecosystem Exchange), and the GPP was parameterized as linear function of MODIS-GR. The Re was parameterized as an exponential function of soil temperature Ts measured at the flux observation site, in which Ts was related to LST derived from MODIS (MOD11). The regression functions were GPP=173.2×GR-55.0 (2005, siteA), GPP=180.7×GR-58.5 (2006, siteB), and Re=0.99×Ex(0.16×Ts), respectively.
Seasonal variation of CO2 budget at the observation site was well reproduced by the GR application, and CO2 flux levels by the GR application consistently agreed with observed results from two observation sites in 2005 and 2006. The empirical relations of GR-GPP and Re-Ts-LST for observation sites were regionally applied to all pixels of MODIS data (2005 and 2006) for wet tundra over North Slope, Alaska (220 x 180 km). Spatial distributions of GPP, Re and NEE, and their seasonal variations were examined.
Within the study region, the high productive area was distributed around elevation over 30 m above sea level. Earlier spring thaw occurs at this higher elevation area in this region where the temperature tends to be higher than the lowland during earlier half of the season. Pixel of MODIS data was classified as three groups by their elevation as less than 20m, between 20-40m, and over 40m. GPP, Re and NEE of each classified pixels were averaged for each data periods (10 days interval) in 2005 and 2006, respectively.
GPP distribution of high productive areas seasonally moved from southern highlands to northern lowlands as time passed in 2005. While a drought year of 2006, GPP at lowlands remained low in late season (DOY 220-280, 2006), resulted in providing same GPP distribution patterns throughout the season. Re during late season was high throughout the region by high temperature (1 oC higher) with low precipitation (69 mm in 2005, 41 mm in 2006). Difference in regional GPP and NEE between 2005 and 2006 was caused by the different weather, namely, dry and warm resulted in high ecosystem respiration with low productivity (by low precipitation).
The weather dependence of regional GPP distributions examined in this study agreed well with the result of temperature and soil moisture effects on CO2 budget by chamber manipulation experiment at Barrow (Kinoshita, 2007). Thus, wet tundra may act as CO2 sink when the weather becomes warmer with wet condition, while it may also act as CO2 source with predicted warm and dry climate.
Introduction of APHRODITE: gauge-based high-resolution daily precipitation data for Asia
Osamu Arakawa1, Akiyo Yatagai2, Haruko Kawamoto2, Masato I. Nodzu2,Kenji Kamiguchi1 and Akio Kitoh1
1 Meteorological Research Institute, Tsukuba, Japan2 Research Institute for Humanity and Nature, Kyoto, Japan
APHRODITE (Asian Precipitation – Highly-Resolved Observational Data Integration Towards Evaluation of the Water Resources) is the project to develop state-of-the-art daily precipitation datasets with high-resolution grid over Asia, which is made by sophisticated interpolation algorithm and numerous rain gauge observations. A lot of successes of TRMM have contributed to widen our knowledge for global water circulation or precipitation systems and so on. Next GPM project is expected to be further achievement. However, satellite based precipitation data requires validation over wide area, so that, absence of data for that purpose is a very big problem. We consider that APHRODITE is useful for evaluation. We emphasize that 1) the grid data will be developed from analysis of the long-term, rain-gauge-based observations, and 2) orographic precipitation will be explicitly reproduced. The grid data product to be developed will be used to evaluate the impact of climate change on the water resources, to force land surface models (such as hydrological and ecosystem models), and to provide meteorological and hydrological inputs to the decision-making processes for water resource management and disaster prevention. The grid data products will be available to all researchers for the scientific purposes. We welcome a wide spectrum of collaborations, particularly for collection of rain gauge data.
Recent Trend of Large-Scale Fires
in Tropical and Boreal Forests
Hiroshi Hayasaka, Murad Ahmed Farukh and Erianto Indra Putra
Graduate School of Engineering, Hokkaido University, Sapporo, Japan
Large-scale fires occurring increasingly frequently since the 1990s in boreal forests in Alaska,
North America, and Sakha, Far Eastern Siberia, are supposedly due to so-called climate change or
global warming, and potential causes are discussed from a climatic and vegetative perspective. Mean
air temperature has increased about 3oC since 1830 in Yakutsk, Sakha, and in Yakutsk and in the
interior of Alaska, the rate of warming increased notably in the 1970s. A gradual decreasing trend in
precipitation occurred simultaneously, and forest-fire records from the mid-1950s in Alaska and Sakha
show that mean annual area burn increased notably in the 1990s. A warmer, drier climate greatly
increases boreal forest flammability. Under such climatic conditions, large forest fires occurred near
Yakutsk, Sakha, in 2002, and wildfires in 2004 burned 26,700km2 in Alaska. Nine individual fires
exceeded 1,000km2 during a summer characterized by record-high temperatures and extreme drought.
Part of the fire grew substantially in just a few days when winds due to strong pressure gradient
occurred. Total burn in 2004 was the largest since record-keeping began in Alaska in 1956. Combined
with an additional 19,000km2 burned in 2005, the area accounted for 10% of Alaska's boreal forests in
just two years. The correlation between fire activity and climate trends suggests that global warming
may bring more frequent large-scale fire events to the boreal forest.
In tropical forests in Kalimantan and Sumatra, peat fires have become very widespread, especially
since 2002, and are no longer “El Niño events.” This recent increase in peat fires is also related to
human activities such as cultivation and logging. In 2002, 2004, and 2006, severe haze from peat fires
occurred under weak El Niño conditions in Kalimantan and Sumatra. To clarify this recent incendiary
trend, we summarized and analyzed forest and peat fire histories in detail based on burnt area data
(Ministry of Forestry, Indonesia) and hot-spot satellite data from NOAA (JICA: Japan International
Cooperation Agency), and Terra and Aqua (NASA: MODIS Rapid Response System).
Forest Fires in Mongolia – Analysis based on MODIS Hotspot and Weather Data
Hiroshi Hayasaka and Murad Ahmed Farukh
Graduate School of Engineering, Hokkaido University, Sapporo, Japan
In Mongolia, fires have the most serious impact on forest and steppe (pasture) vegetation as it damaged
severely year after year. Permafrost is now thawing due to not only global warming but also effect of large-
scale fires. An active layer could become deep by increased heat flow after a large fire. Abrupt climate
change increases the fire phenomena that destroying the southern edge of boreal forest. Fires have become
dominant since the 1990s owing to opening of highly restricted markets, human carelessness while clearing
land and ongoing global warming conditions. The worst forest and steppe fire in 1996, damages account for
damage per GDP was 192% (1.7 billion US$), and about 6% of pasture is affected by fires. Thus, recent
fires in Mongolia should be recognized as one of human-made disasters like flood with 130 mean annual
numbers of fires. In this study, characteristics of forest fires and their relation with weather in Mongolia is
cleared by analyzing dataset of forest fire (hotspot) and weather. For this purpose, NASA-MODIS hotspot
data, NOAA weather data and weather maps made by NACSIS, from 2001 to 2007 were used to investigate
interaction between fire and weather. Analytical results of large fire occurrence tendency using hotspots
clearly indicate that pasture fire occurred mainly in spring and forest fire occurred under drought condition
or low summertime precipitation. Wildland fire in Mongolia is mainly caused by humans and starts from
relatively low altitude (800 m) pasture area in April or just after snow melting and gradually move to
relatively high altitude (1500 m) forest and pasture area in May. Analytical results of weather data clearly
showed that under global warming condition, temperature in central Mongolia has increased 0.52ºC since
last 35 years. Summertime temperature increment is noticeable as it increases 3.4ºC in July while in
wintertime temperature decreased -2.2ºC in January. Spring fires occur from April to June, summer fires in
July-August are tended to be suppressed under average amount of precipitation (around 150 mm), and
severe summer and autumn fire occurred under 10 days drought condition (<10 mm). Effective humidity
less than 35% can be regarded as one of the good indicators for big fires. Wildland fires start under
conditions of high air pressure (average 1030 hPa), northerly wind with 2 m/s average speed and under less
than 45% relative humidity. On the contrary, average 1015 hPa air pressure, westerly hot and dry wind of 3
m/s average speed and relative humidity less than 35% produces fire peaks. Among recent years,
devastating fires occurred in 2002 with 7,295 annual numbers of hotspots under long term (40 days)
drought condition in August-September with daily highest peak of 665 hotspots on 22 September.
Key Words: Global warming, Boreal forest, Permafrost, MODIS, Large-scale fire, Effective humidity
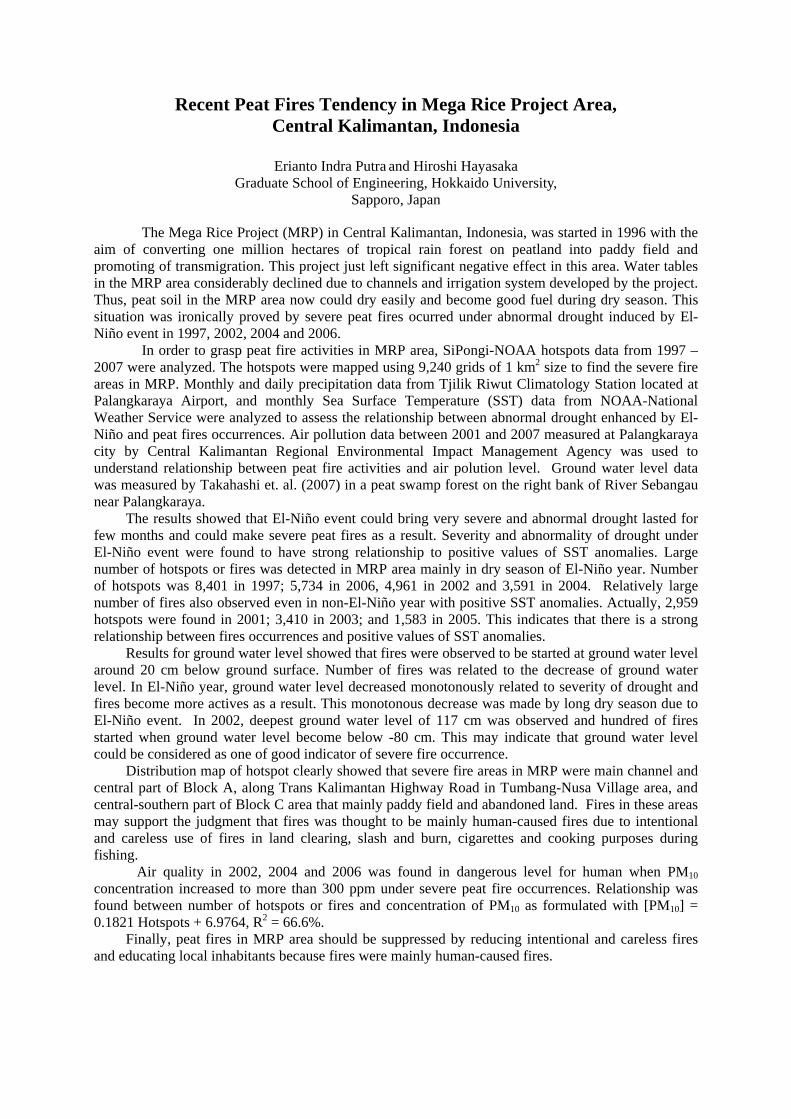
Recent Peat Fires Tendency in Mega Rice Project Area, Central Kalimantan, Indonesia
Erianto Indra Putra and Hiroshi Hayasaka
Graduate School of Engineering, Hokkaido University, Sapporo, Japan
The Mega Rice Project (MRP) in Central Kalimantan, Indonesia, was started in 1996 with the
aim of converting one million hectares of tropical rain forest on peatland into paddy field and promoting of transmigration. This project just left significant negative effect in this area. Water tables in the MRP area considerably declined due to channels and irrigation system developed by the project. Thus, peat soil in the MRP area now could dry easily and become good fuel during dry season. This situation was ironically proved by severe peat fires ocurred under abnormal drought induced by El- Niño event in 1997, 2002, 2004 and 2006.
In order to grasp peat fire activities in MRP area, SiPongi-NOAA hotspots data from 1997 – 2007 were analyzed. The hotspots were mapped using 9,240 grids of 1 km2 size to find the severe fire areas in MRP. Monthly and daily precipitation data from Tjilik Riwut Climatology Station located at Palangkaraya Airport, and monthly Sea Surface Temperature (SST) data from NOAA-National Weather Service were analyzed to assess the relationship between abnormal drought enhanced by El- Niño and peat fires occurrences. Air pollution data between 2001 and 2007 measured at Palangkaraya city by Central Kalimantan Regional Environmental Impact Management Agency was used to understand relationship between peat fire activities and air polution level. Ground water level data was measured by Takahashi et. al. (2007) in a peat swamp forest on the right bank of River Sebangau near Palangkaraya.
The results showed that El-Niño event could bring very severe and abnormal drought lasted for few months and could make severe peat fires as a result. Severity and abnormality of drought under El-Niño event were found to have strong relationship to positive values of SST anomalies. Large number of hotspots or fires was detected in MRP area mainly in dry season of El-Niño year. Number of hotspots was 8,401 in 1997; 5,734 in 2006, 4,961 in 2002 and 3,591 in 2004. Relatively large number of fires also observed even in non-El-Niño year with positive SST anomalies. Actually, 2,959 hotspots were found in 2001; 3,410 in 2003; and 1,583 in 2005. This indicates that there is a strong relationship between fires occurrences and positive values of SST anomalies.
Results for ground water level showed that fires were observed to be started at ground water level around 20 cm below ground surface. Number of fires was related to the decrease of ground water level. In El-Niño year, ground water level decreased monotonously related to severity of drought and fires become more actives as a result. This monotonous decrease was made by long dry season due to El-Niño event. In 2002, deepest ground water level of 117 cm was observed and hundred of fires started when ground water level become below -80 cm. This may indicate that ground water level could be considered as one of good indicator of severe fire occurrence.
Distribution map of hotspot clearly showed that severe fire areas in MRP were main channel and central part of Block A, along Trans Kalimantan Highway Road in Tumbang-Nusa Village area, and central-southern part of Block C area that mainly paddy field and abandoned land. Fires in these areas may support the judgment that fires was thought to be mainly human-caused fires due to intentional and careless use of fires in land clearing, slash and burn, cigarettes and cooking purposes during fishing.
Air quality in 2002, 2004 and 2006 was found in dangerous level for human when PM10 concentration increased to more than 300 ppm under severe peat fire occurrences. Relationship was found between number of hotspots or fires and concentration of PM10 as formulated with [PM10] = 0.1821 Hotspots + 6.9764, R2 = 66.6%.
Finally, peat fires in MRP area should be suppressed by reducing intentional and careless fires and educating local inhabitants because fires were mainly human-caused fires.
Comparison of CO2 balance among three disturbed ecosystems in tropical peatlands
Takashi Hirano1, Hendrik Segah2, Suwido Limin2, Hidenori Takahashi3 and Mitsuru Osaki1
1 Hokkaido University, Sapporo, Japan
2 University of Palangkaraya, Palangkaraya, Indonesia 3Hokkaido Institute of Hydro-Climate, Sapporo, Japan
Tropical peatlands have accumulated a huge amount of carbon as organic matter in soil, and are naturally covered with swamp forests. Recently, however, the tropical peatlands are disturbed on a large scale by deforestation and drainage to produce timber and create farmlands. Such disturbance changes petland environment and should enhance the decomposition of organic carbon into CO2. In addition, drought caused by El Niño and Southern Oscillation (ENSO) and its consequent large-scale fires accelerate CO2 release to the atmosphere from peatland soil through decomposition and burning. These facts suggest that tropical peatlands keep vulnerable carbon stock and will be a major CO2 source in the near future. Therefore it is important to evaluate the effects of disturbance on CO2 balance of tropical-peatland ecosystems to globally predict the trend of atmospheric CO2 concentration.
We have measured CO2 flux using the eddy covariance technique above three peatland ecosystems differing in disturbance conditions near Palangkaraya, Central Kalimantan, Indonesia in 2004 and 2005, non-ENSO years. Three ecosystems are as follows: a swamp forest growing on undrained peatland in Setia Alam area (SF), a swamp forest in drained peatland on Kalangpangan area (KF) and a cutover in drained peatland in Kalangpangan area (KB). Large channels were excavated in Kalangpangan area in the 1990’s. In Kalangpangan area the large portion of forest was clear-cut after the channel construction, and KB site was burned twice in the ENSO years, 1997 and 2002.
Annual sums of net ecosystem CO2 exchange (NEE) between May 2004 and May 2005 were positive even for the undrained forest (SF) (Fig. 1), which shows that all peatland ecosystems functioned as CO2 source for the atmosphere. The annual NEE was between 100 and 800 gC m-2 y-1 and was the largest for the cutover (KB) and the smallest for SF.
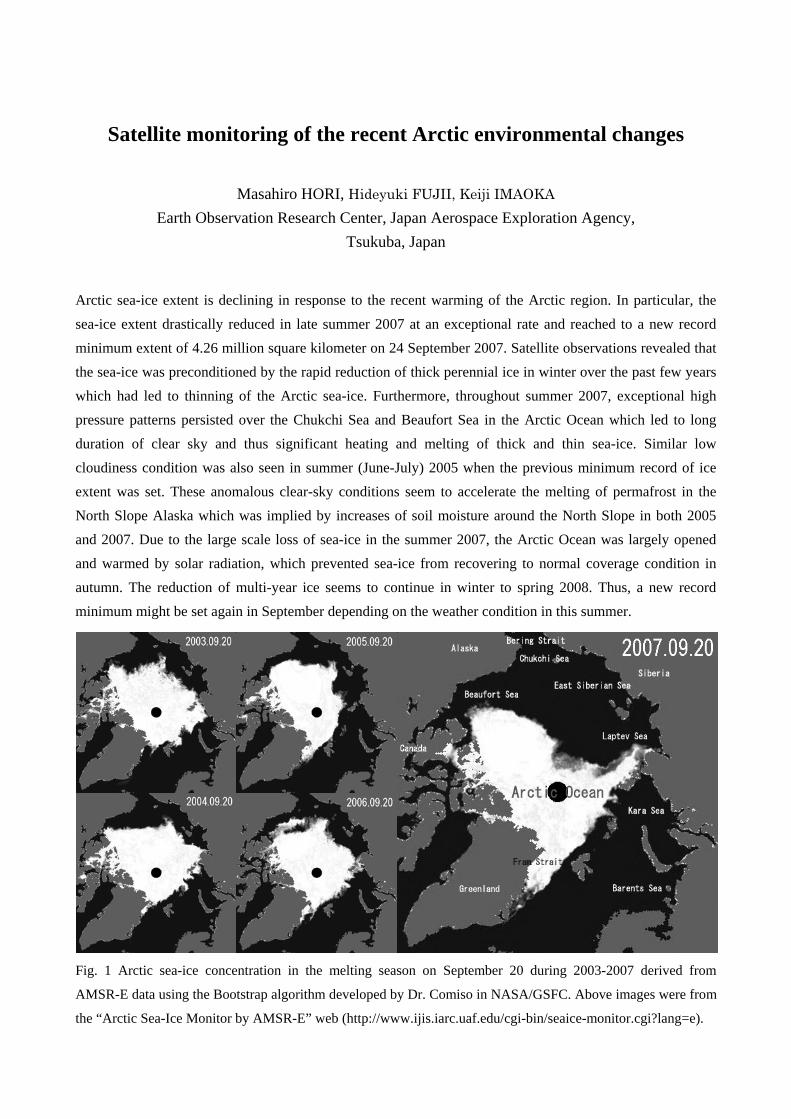
Satellite monitoring of the recent Arctic environmental changes
Masahiro HORI, Hideyuki FUJII, Keiji IMAOKA Earth Observation Research Center, Japan Aerospace Exploration Agency,
Tsukuba, Japan
Arctic sea-ice extent is declining in response to the recent warming of the Arctic region. In particular, the sea-ice extent drastically reduced in late summer 2007 at an exceptional rate and reached to a new record minimum extent of 4.26 million square kilometer on 24 September 2007. Satellite observations revealed that the sea-ice was preconditioned by the rapid reduction of thick perennial ice in winter over the past few years which had led to thinning of the Arctic sea-ice. Furthermore, throughout summer 2007, exceptional high pressure patterns persisted over the Chukchi Sea and Beaufort Sea in the Arctic Ocean which led to long duration of clear sky and thus significant heating and melting of thick and thin sea-ice. Similar low cloudiness condition was also seen in summer (June-July) 2005 when the previous minimum record of ice extent was set. These anomalous clear-sky conditions seem to accelerate the melting of permafrost in the North Slope Alaska which was implied by increases of soil moisture around the North Slope in both 2005 and 2007. Due to the large scale loss of sea-ice in the summer 2007, the Arctic Ocean was largely opened and warmed by solar radiation, which prevented sea-ice from recovering to normal coverage condition in autumn. The reduction of multi-year ice seems to continue in winter to spring 2008. Thus, a new record minimum might be set again in September depending on the weather condition in this summer. Fig. 1 Arctic sea-ice concentration in the melting season on September 20 during 2003-2007 derived from
AMSR-E data using the Bootstrap algorithm developed by Dr. Comiso in NASA/GSFC. Above images were from
the “Arctic Sea-Ice Monitor by AMSR-E” web (http://www.ijis.iarc.uaf.edu/cgi-bin/seaice-monitor.cgi?lang=e).
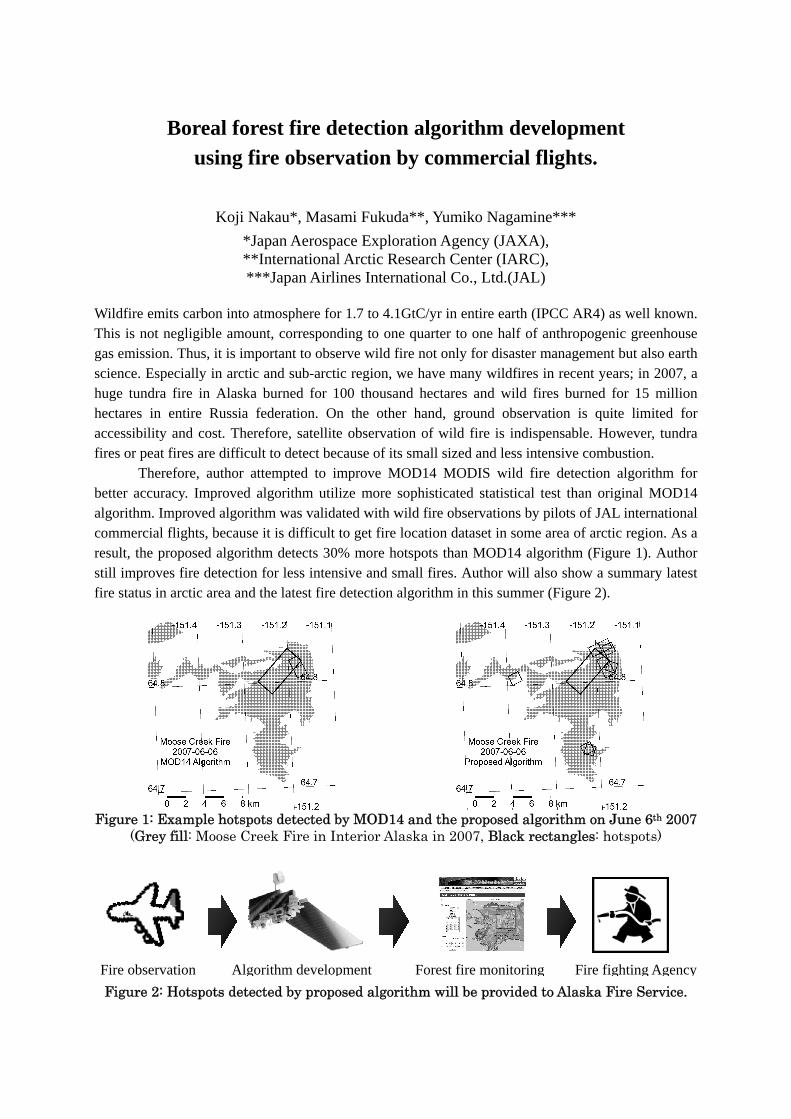
Boreal forest fire detection algorithm development using fire observation by commercial flights.
Koji Nakau*, Masami Fukuda**, Yumiko Nagamine***
*Japan Aerospace Exploration Agency (JAXA), **International Arctic Research Center (IARC), ***Japan Airlines International Co., Ltd.(JAL)
Wildfire emits carbon into atmosphere for 1.7 to 4.1GtC/yr in entire earth (IPCC AR4) as well known. This is not negligible amount, corresponding to one quarter to one half of anthropogenic greenhouse gas emission. Thus, it is important to observe wild fire not only for disaster management but also earth science. Especially in arctic and sub-arctic region, we have many wildfires in recent years; in 2007, a huge tundra fire in Alaska burned for 100 thousand hectares and wild fires burned for 15 million hectares in entire Russia federation. On the other hand, ground observation is quite limited for accessibility and cost. Therefore, satellite observation of wild fire is indispensable. However, tundra fires or peat fires are difficult to detect because of its small sized and less intensive combustion.
Therefore, author attempted to improve MOD14 MODIS wild fire detection algorithm for better accuracy. Improved algorithm utilize more sophisticated statistical test than original MOD14 algorithm. Improved algorithm was validated with wild fire observations by pilots of JAL international commercial flights, because it is difficult to get fire location dataset in some area of arctic region. As a result, the proposed algorithm detects 30% more hotspots than MOD14 algorithm (Figure 1). Author still improves fire detection for less intensive and small fires. Author will also show a summary latest fire status in arctic area and the latest fire detection algorithm in this summer (Figure 2).
Figure 1: Example hotspots detected by MOD14 and the proposed algorithm on June 6th 2007
(Grey fill: Moose Creek Fire in Interior Alaska in 2007, Black rectangles: hotspots)
Figure 2: Hotspots detected by proposed algorithm will be provided to Alaska Fire Service.
Fire fighting AgencyFire observation Algorithm development Forest fire monitoring
Rainfall and snowfall interceptions of the forests in Moshiri, Hokkaido
Yuji KODAMA1, Kazuyoshi SUZUKI2 and Taro NAKAI3
1 Institute of Low Temperature Science, Hokkaido University, Sapporo 060-0819, JAPAN
2 Institute of Observational Research for Global Change, JAMSTEC, Yokosuka, 273-0061, JAPAN 3 CREST/JST
Interception of forest is one of most important factor in the hydrologic cycle for a watershed
with forests. Precipitation measured at a meteorological station cannot be simply inter(extra) polated to forest, due to its non-linear nature of forest’s interception. Interception of forest is a part of rain or snow, which temporally stays on leaves and stems, and is eventually evaporated back to atmosphere. Another reaches to ground through canopy, stems and trunks. Interception evaporation fraction is the ratio of interception to precipitation over forest. Snow Interception, I, is different from rain interception and more complex, and can be determined as a difference of snow accumulation in open area and forests (Lundberg et al., 2004).
The observation sites are in the research forest of Hokkaido University in Moshiri, northern Hokkaido. Two sites are set up: one in birch forest and another in ever-green coniferous and broad-leaf deciduous mixed forest (Nakai et al., 2006). For rain interception, throughfall and stemflow were measured using a funnel of 30 cm in diameter and a 20 litter tank, connecting those with a tube. The 8 funnels were set above dwarf bamboo to catch rain through main stands and the 8 funnels under dwarf bamboo to catch rain through the dwarf bamboo. Every 2 weeks the amount of rain water in the tank was measured and dumped, and the funnel was moved a few meters and reset. Stem flow was measured collecting the rain water flowing down the stem surface by surrounding a half-cut tube and putting it to the 20 litter tank. The amount of water in the tank was measured like as the throughfall. For snow interception, snow water equivalents (SWE) at open area and forest were calculated by multiplying the mean snowpack density of more than 10 measurements with the snow depth of about 50 to 100 measurements. Since the variation of snow depth inside forest is larger than that of open area, more snow depth measurement points are necessary. The interception was calculated as the difference of the two. The observation period is from the year 2004 to 2006.
For snow interception. The variability of snow water equivalent (SWE) inside forest is larger than that of open area. The mean interception fraction is from 20 to 30% for the three years. Since there is no snow on canopy on March 13, 2005, the interception evaporation fraction (IRF) is 26%. Snow interception at the grid point of 5m interval in the plot of 40m x 100m inside the forest had a good relationship with the sky view factor (SVF). The mean interception fraction of the birch forest is from 7 to 10% for the three years, which is quite small when compared with that of mixed forest. This is due to that birch is leafless. For rain interception. Since the rain is temporally stays on leaves, stems and trunks and the storage capacity is limited, the interception is dependent of precipitation. For precipitation above canopy of more than 40 mm in the mixed forest, the interception is independent of precipitation and the mean value of interception is 20% above sasa and 30-40% at ground. For precipitation less than 40 mm, the interception almost linearly depends on precipitation. For precipitation larger than 20 mm, the interception above sasa is about 20%, and 40-50% at ground. When compared with the snow interception, rain interception of birch forest is extremely large. It indicates that the stemflow would be very large for the birch tree. Sasa plays a important role on interception. Weak dependency of interception on LAI was found except for ‘above sasa’ in the mixed forest.
In this study, many drawbacks are existed. They are as follows. Stemflow was not counted; the measurement interval was about 2 weeks and it was not analyzed for each precipitation event, and the number of measurement points was not justified. References Lundberg, A., Nakai, Y., Thunehed, H., Halldin, S., 2004. Snow accumulation in forests from ground and
remote-sensing data. Hydrol. Process. 18, 1941-1955. Nakai, T., van der Molen, M.K., Gash, J.H.C., Kodama, Y., 2006. Correction of sonic anemometer angle of
attack errors. Agric. For. Meteorol., 136, 19-30.
Identification of N2O-emitting soil bacteria from tropical peatland in Central Kalimantan and temperate zone in Hokkaido, and
comparisons of their physiological characteristics
Yasuyuki Hashidoko1, Hisahaya Takeda1, Fumiaki Takakai1, Yo Toma1, Darung Untung2, Lulie Melling3, and Ryusuke Hatano1
1 Hokkaido University, Sapporo, Japan
2 University of Palangka Raya, Palangka Raya, Indonesia 3 Agriculture Sarawak, Kuching, Malaysia
Both open peatland utilized for agricultural farmland in Central Kalimantan, Indonesia, and Andisol farmland in Hokkaido, Japan, are highly active in N2O emissions from the soils. We have investigated N2O-emitting microorganisms in butylene rubber-sealed glass vials using a gellan gum-base pseudo-soil medium that contained 500 ppm-N NO3
-. Subsequently, we have isolated three N2O-emitters, two Burkholderia spp. and one Janthinobacterium sp. from tropical peat farm and a Gram-positive bacillus, Paenibacillus sp. and a β-proteobacteria of Burkholderiales from Hokkaido Andisol. No active fungi were isolated from both of the soil. Repeatedly, N2O producing activity of these N2O-emitters were tested individually, under the pure culture conditions.
The bacterium that most actively produced N2O into headspace of the culture vial was Janthinobacterium sp., in which it released 1,200-3,500 ppm of N2O (v/v, 7-day-incubation) at a narrow acidic region around pH 3.8, without any supplemented C-sources in the medium. When we added 10 mg/ml D-glucose as supplemental C-source, the N2O emission level increased up to nearly 100,000 ppm1). On the other hand, active bacteria isolated from Andisol in Hokkaido farmland produced 30-70 ppm (v/v, 7-day-incubation) of N2O under the same soilless assay conditions. These bacterial isolates also showed a sharp response to medium pH. Both showed the most active N2O emission at pH 4.7 (7-day-incubation). Unlike Janthinobacterium sp., however, these N2O emitters from the Andisol did not show any positive responses to additional D-glucose. N2O flux experiments in open-ended stainless steel cylinder-embedded forest bed was done in natural peat swamp forest near Mukah, Sarawak, Malaysian side of Borneo Island. The N2O flux measurements from the peat soil in native forest, with or without an embedding open-ended stainless steel cylinder (200 mm i.d.) of 50 cm long was carried out in a rainy season in Sarawak, 2004-2005. Using a chamber method, the gas sampling was done as 3 replications in the forest sites. The soils with and without an embedding open-ended stainless steel cylinder depicting as simple models of deforested open land and native forest, respectively. The result of this experiment supported our hypothesis that trees in the native forest ecosystem positively regulate soil microflora and N2O emission. This deforestation led to biological disturbance and imbalance in the underground ecosystem.
Despite current recognition of an active N2O emission from farming area in open peatland, our studies more clearly indicated than before that tropical peat swamp forest ecosystem largely contributed to the maintenance of global environment, especially on suppression of N2O production. After all, primitive but the most effective way to prevent GHG production from tropical peat soil is to conserve and rehabilitate the peat swamp forest ecosystem.
1) Y. Hashidoko, F. Takakai, Y. Toma, U. Darung, L. Melling, S. Tahara, and R. Hatano. Emergence and behaviors of acid-tolerant Janthinobacterium sp. that evolves N2O from deforested tropical peatland. Soil Biology and Biochemistry, 40, 116-125 (2008).
Nitrous oxide emissions induced by fertilizer and soil organic matter from tropical peat soil in Central Kalimantan, Indonesia
Yo Toma1, Fumiaki Takakai2, Untung Darung3, Kanta Kuramochi1, Ryusuke Hatano1
1 Hokkaido University, Sapporo, Japan
2 Akita Prefectural University, Akita, Japan 3 University of Palangkaraya, Palangkaraya, Indonesia
Takakai et al. reported that the amount of nitrous oxide (N2O) emissions ranged from 7.1 to 259 kg N
ha-1 yr-1 and that from 1.8 to 36% of the applied nitrogen (N) was emitted as N2O from agricultural fields
that were reclaimed from peatland in central Kalimantan, Indonesia. IPCC (2006) reported that 16 kg N
ha-1 yr-1 of N2O would be emitted by the cultivation of tropical peat soil. In this study, we set up cultivated
and bare plots and measured N2O emissions induced by fertilizer N and soil organic matter in central
Kalimantan, Indonesia. We measured N2O fluxes using a chamber method and also measured soil temperature (4cm), water
filled pore space (WFPS, 0-10cm), and soil ammonium and nitrate concentrations at three agricultural
fields (A, B, and C) and grassland from March 2005 to February 2007. Cultivated and bare plots were set
up for agricultural fields. In bare plots, N fertilizer was not applied and plants were not cultivated. The
amounts of applied N (kg N ha-1 yr-1) in plots A, B, and C were 1625, 644, and 1065 in the first year and
1635, 0, and 1065 in the second year, respectively. Nitrogen fertilizer was not applied in grassland.
N2O fluxes increased in rainy season and decreased in dry season in each plot. There was no significant difference between N2O fluxes in cultivated and bare plots in each site. In cultivated plots, N2O flux increased with an increase in soil nitrate concentration when the WFPS exceeded 60%. These results revealed that N2O could have been produced by the denitrification process. The ratio of N2O flux and soil nitrate concentration significantly correlated with the WFPS, suggesting that the activity of nitrous oxide reductase had been low, because of an increase in the N2O production rate in a wet condition. The average amount of annual N2O emissions from cultivated plots in A, B, and C were 620, 11, 113 kg N ha-1 yr-1, respectively. Similarly, the average amount of annual N2O emissions from bare plots in A, B, and C and in grassland were 669, 6.5, 113, and 48.6 kg N ha-1 yr-1, respectively. There were significant differences between N2O emissions from cultivated and bare plots only in B and C in the first year. From -7.06 to 3.59 % of the applied N were emitted as N2O, and from 48 to 124 % of the N2O emissions were induced from soil organic matter. Our results showed that the decomposition of soil organic matter could enhance N2O emissions from agricultural fields in tropical peatland. Therefore, further study on the mechanism of soil organic matter decomposition and N2O production in denitrification process in tropical peatlands is required.

Global average surface temperature anomalies with COBE-SST
Koji Ishihara Climate Research Department, Meteorological Research Institute
Tsukuba, Japan
For the diagnosis of global warming, monitoring the long-term change of the global average surface temperature anomalies is essential. In the Intergovernmental Panel on Climate Change (IPCC) Fourth Assessment Report (IPCC, 2007), it is shown that the 100-year linear trend (1906 to 2005) of global surface temperature is 0.74°C.
Japan Meteorological Agency (JMA) also monitors those changes monthly and annually, and shows the results through not only publications such as Climate Change Monitoring Report but also the Internet (http://ds.data.jma.go.jp/tcc/tcc/products/gwp/temp/ann_wld.html).
Global average surface temperature anomalies are calculated since 1891 with monthly mean temperature data observed at meteorological stations over land and COBE-SST, which is short for “Centennial in-situ Observation Based Estimates of variability of SST and marine meteorological variables” and is one of the historical marine meteorological databases (Ishii et al, 2005). For land data, sources are mostly GHCN (Global Historical Climatology Network) till 2000 and CLIMAT reports which are internationally exchanged over the WMO official international climate monitoring network are mainly used since then.
The calculation of the global average surface temperature anomalies is based on the climate anomaly method (Jones et al., 2003). Moreover, the uncertainty ranges from sampling error were estimated following Jones et al.(1997), recently (Ishihara, 2008).
Figure 1 shows the long-term change of global annual combined land-surface air temperature and SST anomalies relative to the 1971 to 2000 mean, along with 10 to 90% error bar ranges. Annual anomaly of global average surface temperature in 2007 was +0.28±0.14℃ above normal (1971-2000 average), and was the 6th highest value since 1891. In a longer time scale, the global average surface temperature has been rising at a rate of about 0.67℃ per 100 years.
-1.0
-0.5
0.0
0.5
1.0
1890 1900 1910 1920 1930 1940 1950 1960 1970 1980 1990 2000 2010
Year
Anom
aly
(℃)
Figure 1. Long-term change of global annual combined land-surface air temperature and SST anomalies relative to the 1971 to 2000 mean, along with 10 to 90% error bar ranges. Bars indicate anomalies of surface temperature for each year, and thick solid line indicates 11-year running means. Thin lines on bars indicates error bar ranges (10 to 90%).
Repeated Peat Fire Increase Negative Growth of Acacia crassicarpa in the Forest Plantation
Bambang Hero Saharjo
Forest Fire Laboratory, Forest Protection Division, Department of Silviculture, Faculty of Forestry, Bogor Agriculture University, West Java, Indonesia
N.A.Eka Widyasari
Alumny, Department of Silviculture, Faculty of Forestry, Bogor Agriculture University, West Java, Indonesia
Basuki Wasis
Forest Influence, Ecology Division, Department of Silviculture, Faculty of Forestry, Bogor Agriculture University, West Java, Indonesia
Industrial forest plantation (Hutan Tanaman Industri) in Indonesia is one of the best solutions in solving the lack of raw materials for forest industries problems. The existence of forest plantation is hopefully could reduce the high speed of deforestation and minimize environmental destruction. The success of forest plantation activity is affected by the ability of land to grow up the trees and other factor such as fire. The result of research in the two year Acacia crassicarpa planted at burned peat in 2006 shown negative growth performance compared to unburned peat at the same year. Average height of two year planted Acacia crassicarpa was 10.2 m at unburned peat while it was 8.2 m at burned peat. The same result found also at diameter where at unburned peat it was 5.05 cm while at burned peat it was 4.41 cm.

Projection of the change in future extremes using a nonhydrostatic cloud-resolving regional model
Akio Kitoh, Hiroki Kondo
and The project team from Advanced Earth Science & Technology Organization (AESTO),
Meteorological Research Institute (MRI) and Japan Meteorological Agency (JMA), Japan
Under the Innovative Program of Climate Change Projection for the 21st Century (KAKUSHIN
Program) starting from April 2007, we conduct the projection of climate changes in extremes due to global
warming, especially precipitation extremes, in Japan by using a nonhydrostatic regional model (NHM) with
the horizontal resolution of 5km (5km-NHM) and 1km (1km-NHM) on the Earth Simulator (ES). This
presentation gives an overall plan for regional climate projection in five years of the program, and main
part of works done so far.
To evaluate changes in precipitation extremes due to global warming, the 5km-NHM is run during
warm season (from June to October) in the near future (2015-2039) and the end of 21st century (2075-2099)
based on the A1B scenario with initial and boundary conditions extracted from results of a 20-km
resolution AGCM. Although the horizontal resolution of 5 km is the highest possibly even on the ES to be
used in climate simulations, it is still not enough to represent cumulonimbi which often cause extremely
heavy precipitation in Japan. So the 1km-NHM is run for many selected events (about top 10 %) of heavy
precipitation, detected from the 5km-NHM simulation to statistically modify the results of 5km-NHM.
During the first two years of the program, we make a verification of the model, preliminary
projections and model development and improvement for full projection experiments that will be executed
in the last three years of the program. We performed perfect model experiments in warm season in 2002 to
2006,by using initial and boundary conditions extracted from operational regional objective analysis data of
the Japan Meteorological Agency. The verification of the results totally shows good performance of the
5km-NHM in reproducing climatic characteristics of not only the amount and distribution of mean
precipitation but also the number and distribution of extremes. However, the precipitation amount is
somewhat overestimated along shorelines and mountain slopes facing a south-west direction, into which a
humid air often flows from the south. On the other hand, the 1km-NHM does not make such overestimation
and gives more realistic distribution of heavy precipitation.
Preliminary projections in the near future (2026-2035) and the end of 21st century (2086-2095) are underway. Moreover, an impact assessment group is examining the impact of climate change on disaster risk due to flood, inundation, strong wind associated with typhoons and storm serge from the 5-km and 1-km NHM results.

Global Projection of the Change in Weather Extremes Using a Super-High-Resolution Atmospheric Model
in the KAKUSHIN Program
Akio Kitoh, Hiroki Kondo
and
The project team from Advanced Earth Science & Technology Organization (AESTO),
Meteorological Research Institute (MRI) and Japan Meteorological Agency (JMA),
Japan
The future change in weather extremes is projected with high resolution and reliability using a 20km
super-high resolution global atmospheric model in order to provide policy and/or decision-makers for the
disaster prevention under the global warming environment in the future. The projection for the near-term future
of the next 30 years has been executed in addition to the end of 21st century as done so far. The model has been
developed based on the current JMA operational global model for daily weather and typhoon forecasts.
Observed sea surface temperature (SST) is specified as a boundary condition for the present climatology. An
ensemble-averaged SST change of the IPCC-AR4-model projections is applied for future projections as
supposedly the most reliable SST change in the future.
Model output is used for the downscaling approach to the future projection of local severe rainfall over
Japan using 1km and 5km cloud-resolving regional models and is also used for various collaborative studies on
disaster prevention. It is made sure that simulated amount of precipitation during summertime is comparable to
the observed ones over each region of Japan.
The most distinctive benefit from the use of the 20km global model is obtained in the simulation of tropical
cyclones and monsoon heavy rainfall, which are called as typhoons and the Baiu (a Japanese rainy season) in
Japan. It is shown that the 20km global model is able to simulate typhoons and the Baiu much more
realistically in views of their strengths, structures and geophysical distribution as compared with lower
resolution models. This fact indicates that the 20km global model would give us more reliable future projection
of the change of the related extreme weathers.
The projections have indicated that the total number of tropical cyclones decreases, but the number of
strong tropical cyclones increases in the future. The mean structures of tropical cyclones are changed as to have
stronger winds and stronger warm cores within about 100km from the cyclone centers. It is also shown that
rainfall amount during the Baiu increases over the Yangtze River, East China Sea and western Japan, and
decreases in Korean Peninsula and northern China in future.
Information about the uncertainty of future projection is important for any decision-making processes.
Various uncertainties of projection will be estimated quantitatively by ensemble techniques with use of the
same model but a lower resolution of 60km. First of all, the uncertainty of future SST changes is examined in
the SST-ensemble experiments where single-model SST changes with different global warming strength and
different regional distribution are applied.
Seasonal and interannual variability in phytoplankton
biomass in the western Arctic Ocean: implications for
biological response to ongoing climate change
Atsushi Matsuoka1 and Victoria Hill2
1Graduate School of Fisheries Sciences, Hokkaido University, Japan 2Earth and atmospheric sciences, the department of ocean, Old Dominion University, USA
Recent declines in sea ice cover have made possible longer seasonal and interannual ocean color
observations of the western Arctic. Since biological activity is sensitive to ongoing climate change, the
biological response can be obtained continuously using satellite remote sensing. We investigated
chlorophyll a (chl a) as a proxy of phytoplankton biomass that is the base of marine food web, and the
related optical, the light absorption coefficients of phytoplankton [aφ(λ)] through ice-free periods in the
western Arctic Ocean. The aφ(440) covaried strongly with phytoplankton biomass although the chl a
specific aφ(440) [aφ(440)*] declined significantly from spring to autumn. The lower aφ(440)* can be
explained by the seasonal succession from smaller to larger sized phytoplankton species. Large
interannual variability in phytoplankton was also shown. While there is a limited archive of ocean
color, further work of the trend for phytoplankton biomass will allow us to reveal change in Arctic
climate in terms of biological response.
Characteristics of wildfires in Thailand observed from satellite imageries
Kazufumi Kobayashi*, Hiroshi Tani*, Wang Xiufeng* and Masami Fukuda**
*Graduate School of Agriculture, Hokkaido University, Sapporo, Japan
**International Arctic Research Center, University of Alaska Fairbanks 1. Introduction
Fires are one of the main elements of the deforestation in the tropical and the sub-tropical region. Occurrence of an excessive fires caused by human activity exerts various influences on both a global and a local scale. Therefore, it is expected to find fires at the early stage, and to extinguish them promptly.
The satellite remote sensing is thought to be an effective method in detecting a forest fire because of its features such as periodicity and ability to measure the thermal infrared spectral region. Although AVHRR data has long been used for fire detection activities, more efficient sensor like MODIS is developed, and the accuracy improvement of the fire detection is expected. However, since the many detection errors are generated in Southeast Asia when applying a present MODIS fire detection algorithm, it’s difficult to use the results in fire control. It’s important to improve the accuracy of the fire detection using the satellite data in this research. As a preliminary study, we analyzed the feature of fires using MODIS datasets and ALOS/AVNIR-2 imageries. 2. Data and methods The study area is whole Thailand, and the area of 78×96 km in the west of Chiang Mai, Thailand was selected as a focused observation area. Imageries of AVINIR-2 instruments onboard the ALOS were used for the dates of March 7 and 27, 2007. The MODIS Thermal Anomalies products (MOD14/MYD14) were used for the dates from January 1 to April 30, 2007 and 2008. The MODIS Land Cover products (MOD12) were also used. Fire information around Chiang Mai which includes fire location, dates, and burning area, provided by local fire service were used for validation data. We made true- and false-color imageries of AVNIR-2 and detected the smoke plumes by visual check. We made time series of hotspots and real fires obtained from MOD14/MYD14 and fire information. Then we analyzed the land cover classes in which hotspots and real fires were included. At last, we validated the daytime MODIS/Terra hotspots using fire data and AVNIR-2 imageries and counted the number of commission and omission errors. We also compared which land covers had the most errors by computing the performance indexes (Cuomo et al. 2001). 3. Results and discussion In order to detect the smoke plume by the ALOS/AVNIR-2 imageries, channel 1 (0.42 - 0.50μm) proved to be effective, because true-color imageries were much easier to find smoke plumes visually than false-color imageries.
The numbers of hotspots reached peak at the beginning of March 2007, and at the end of March 2008. Similar tendency was observed in fires around Chiang Mai. Hotspots and real fires were most occurred in the forest class in the six major land cover classes in this area.
Many fires were undetected by MODIS because these fires are small and do not emit sufficient radiation to penetrate the canopies, so it’s difficult to distinguish fire pixels from non-fire background pixels by current algorithms.
By comparing the performance indexes for “Evergreen Broadleaf Forest” class and “Woody Savannas” class which occupy the most land covers in study area, the latter result was worse than the former, because the latter global index showed negative value of -0.23 which indicates that the number of false alarms exceeds the detected fires. On the other hand, the former global index showed positive value of 0.29, yet it’s still not a good result. To improve the accuracy of the fire detection using MODIS, it’s important to take the difference of land covers into account and choose the optimal threshold correspond to small fires.
Larch taiga on permafrost is facing the risk of catastrophic degradation by immoderate increasing precipitation regimes
Hideyuki Saito1, Hidenari Iwasaki1, Alexander P. Isaev2, Kazunobu Kuwao1,
Alexander N. Fedorov3, Trofim C. Maximov2, Shuich Hasegawa1
1, Hokkaido University, Sapporo Japan
2, Institute for Biological Problems of Cryolithozone, Yakutsk Russia 3, Permafrost Institute, Yakutsk Russia (H.S.: [email protected])
To understand the influence of changing precipitation regimes on larch taiga in cryolithozone is important
for global climate research, because the taiga ecosystem storages massive carbon and the carbon cycle is
sensible to water conditions. The taiga in cryolithozone is established on seasonally freeze-thaw soils with
shallow depth (around 1-2m). The annual precipitation is approximately 200-300 mm corresponding to
continental climate, however at the past 3 years; significantly greater precipitation has continuously
occurred. In 2007’s summer, we found yellowing and browning larch forest almost everywhere the taiga
around Yakutsk. Here we show that larch taiga is facing the risk of catastrophic degradation by immoderate
increasing precipitation regimes in Eastern Siberia. The annual precipitation between August to the next
July was 243 mm in 2004-05, 366 mm in 2005-06 and 353 mm in 2006-07 in Yakutsk. Especially, the
increasing precipitation in autumn resulted in saturated soil water conditions in the beginning growing
season. The coloring larch tree was due to the senescence leaves in the whole tree crown despite of the
summer. The coloring tree appeared in not only 95% area of wet habitat larch-forest around the front but
also 20% area of dry habitat. The location of the coloring trees was consistent with micro-site with
saturated soil water in the top soil or scar of long-term flooding on ground vegetation. Furthermore, almost
of larch forest disturbed by ground-fire at the past one decade changed to wet soil condition, and in this
forest, almost emerged trees suddenly represented the coloring in 2007. These results indicated that the
forest decline attributed to saturated soil water conditions. The wind-throw of mature larch tree also
significantly increased in this growing season within green larch forest, probably due to frost lifting of wet
soils. In conclusion, we estimated that over 40% area of larch-taiga could be facing potential degradation if
the increasing precipitation regime continues. After the decline of forest trees, the forest ecosystem would
start thermoculst transiting to wet-land, called alas, and increasing global warming gas emission. We
challenge a serious scenario of larch taiga degradation on permafrost by immoderate increasing
precipitation regimes under climate change, leading to massive carbon source.
Snow Cover Monitoring in Alaska by Satellite Observation
Hiroyuki Enomoto1, Shizuka Kimura1, Kim Yongwon2, Komei Sasaki1 , Kazutaka Tateyama1, Tomonori Tanikawa1 and Gaku Kadosaki3
1 Kitami Institute of Technology
2 International Arctic Research Center, University of Alaska Fairbanks 3 Remote Sensing Technology Center of Japan
Satellite based snow-hydrologic information can be used to solve the problems; water resources, environmental concerns, and climate changes. Since polar region is sensitive to climate changes, we monitored the snow cover and the melting of snow in Alaska using satellite passive microwave data and snow algorithms, and compared these results with ground-truth data. The snow cover and the melting of snow were estimated using Aqua/AMSR-E brightness temperatures. The satellite data were used from July 2004 to March 2008.
For Tundra and Boreal forest sites, we measured the snow parameters (snow depth, density, grain size, snow characteristics) along the Dalton Highway every approximately 20 miles in four winters 2005- 2008. Snow depth showed decreased from 2005 to 2007, but increased in 2008. In 2008 Snow properties were very different. Although depth hoar type snow is usual in Alaska, this type was decreased and appeared more packed ice type in 2008, in boreal forest and tundra area. Winter temperature record shows sporadic warm temperature in February 2008, and reached 0C in February. Spatial distribution of the snow cover and the timing of snow melting in Alaska were monitored using the Aqua/AMSR-E data. The seasonal change of the snow cover and the snow melting are visible. The detection of the melt using DAV was consistent with ground-truth data very well at Tundra site.
Recent variability of Coccolithophore blooms in eastern Bering Sea shelf
Sei-Ichi Saitoh1, Takahiro Iida2, Kohei Mizobata3, Toru Hirawake1 and Mitsuhiro Toratani4 1 Laboratory of Marine Bioresource and Environment Sensing, Graduate School of Fisheries Sciences,
Hokkaido University, 3-1-1 Minato-cho, Hakodate, Hokkaido 041-8611, Japan E-mail:[email protected]
2 National Institute of Polar Research, Itabashi, Tokyo, Japan 3 Tokyo University of Marine Science and Technology, Shinagawa, Tokyo, Japan 4 School of High-Technology for Human Welfare, Tokai University, Numazu, 410-0395 Japan During the late-summer of 1997, for the first time ever recorded, most of the continental shelf of the
eastern Bering Sea was covered by aquamarine waters, resulting from massive bloom of coccolithophores
Emiliania huxleyi. Since then, coccolithophores bloom is not unusual but common in the eastern Bering
Sea. Objectives of this study are, to examine recent temporal and spatial variability of coccolithophore
bloom in eastern Bering Sea, and to evaluate the cause of maintaining of the blooms. Since 1997,
coccolithophore bloom has been monitored using satellite ocean color SeaWiFS and MODIS data and
recently peak of bloom tend to occur in September.
Seasonal and interannual variability of primary production of scallop forming area in the Okhotsk Sea in relation to climate changes
Muzzneena Ahmad Mustapha1,2 and Sei-Ichi Saitoh1
1 Laboratory of Marine Bioresource and Environment Sensing, Graduate School of Fisheries Sciences,
Hokkaido University, 3-1-1, Minato-cho, Hakodate, Hokkaido, 041-8611, Japan. E-mail: [email protected]
2PPSSSA, FST, UNIVERSITI KEBANGSAAN MALAYSIA, 43600 UKM BANGI, Selangor, Malaysia
The Okhotsk Sea is one of the most biologically productive regions in the world, and it supports high fisheries production. It is well known as one of the southern most seasonal sea ice zones in the Northern Hemisphere. Seasonal change of sea ice in this area has large interannual variations and has been considered to play an important role in the high production at the ice edge. The coastal region of the Sea of Okhotsk, Hokkaido, is an ideal habitat for the Japanese scallop Mizuhopecten yessoensis, and has supported important fisheries for this species since the early 1900'. Understanding dynamics of ice formation and phytoplankton bloom development is important in management of this benthic community. The objectives of this study are to clarify the interannual variability of primary production at the scallop farming area in the Okhotsk Sea using satellite remote sensing and GIS. Prolong high primary production at the scallop farming area after termination of spring bloom is supported by the development of the frontal area along Soya Warm Current in summer and enforcement of East Sakhalin Current in autumn. Even at the weakening of one process, this area is sustained by enforcement of the other processes. Clarifying the effects of these physical processes is important to understand effects of future climate change and formulation of rational management plans at the scallop farming area.
Forest restoration technique of Shorea balangeran in degraded peatland of Central Kalimantan, Indonesia
Hideyuki Saito1, Masato Shibuya1, Yutaka Tamai1, Turjman Maman2, Agung R. Susanto3,
Sampang Gaman3, Kunihide Takahashi1, Suwido H. Limin 3
1, Hokkaido University, Sapporo Japan 2, Forest and Nature Conservation Research and Development Center, Boror, Indonesia
3, University of Palangka Raya, Palangka Raya, Indonesia
To development technique for forest restoration in drained and burnt peatland, we examined seedling
planting and direct sowing methods for Shorea balangeran in Central Kalimantan, Indonesia. S.
balangeran is native tree of peat swamp forest in Central Kalimantan. It was possible to collect seeds
of S. balangeran from mother tree in the field every year from 2000 to 2008, and it was easy to make
the seedlings on potted peat soil. Height growth of 1-year-old seedling was approximately 60 - 100 cm
in shade condition in nursery. Planting experiment resulted in approximately 90% survival rate of the
seedlings planted in an open site, Kapuas border where had been drained, developed for agriculture
and burnt by wildfire. The light saturated net CO2 assimilation rate (Asat) of S. balangeran seedlings
nursed under shade was 9.3 ± 1.7 μmol m-2 s-1, which was the greatest among 6 native and 2 exotic
tree seedlings (Shorea balangeran, Palaquium leiocarpum, Combretocarpus rotundatus, Mezzettia sp.,
Dyera lowii, Gonystylus bancanus, S. pinanga and S. selanica), suggesting the S. balangeran
seedlings prepared for planting was vigor. After 2 years from transplanting from shade in nursery to
open site when the age of the seedling was one year old, the Asat was 21.9 ± 0.2 μmol m-2 s-1, indicating
S. balangeran seedling could adapt to intensive light condition. To our knowledge, the value of Asat
was the second greatest in tropical forest tree seedlings following Accaia mangium, suggesting that S.
balangeran is the light demanding and fast growing tree. Therefore S. balangeran is a useful tree for
seedling-planting method in the degraded peatland. Furthermore, a direct sowing experiment for S.
balangeran resulted in 11.4 ± 2.5% of survival for one year, suggesting that the direct sowing for S.
balangeran is promising and cost-saving method. We conclude that the planting and direct sowing of S.
balangeran are promising method for forest restoration in the degraded peatland in Central
Kalimantan.
Sea Ice Shrinking and Melting in the Arctic
Hiroyuki Enomoto1 and Kazutaka Tateyama1
1 Kitami Institute of Technology
Arctic sea ice extent showed the minimum in September 2007 since the satellite observation starts. We investigated interannual melt pond extent and duration change since 2003 using AMSR-E satellite passive microwave radiometer in order to reveal the effect of melting on the Arctic Sea ice shrinking.
Melt pond becomes the surface heat source on ice due to its low albedo and breaks ice into small pieces. Therefore long term existence of melt pond gives significant damage on ice including thick multi-year ice.