on a p-type semiconducting NiO electrode a Ru(II)-Re(I ... · 1 Photoelectrochemical CO2 reduction...
8
1 Photoelectrochemical CO 2 reduction using a Ru(II)-Re(I) multinuclear metal complex on a p-type semiconducting NiO electrode Go Sahara, a Ryu Abe, b Masanobu Higashi, b Takeshi Morikawa, c Kazuhiko Maeda, a Yutaro Ueda, a Osamu Ishitani *a,d a Department of Chemistry, Graduate School of Science and Engineering, Tokyo Institute of Technology, O-okayama 2-12-1-NE-1, Meguro-ku, Tokyo 152-8550, Japan. Fax: +81 3 2759 2284; Tel: +81 3 2759 2240; E-mail: [email protected] b Department of Energy and Hydrocarbon Chemistry, Graduate School of Engineering, Kyoto University, Katsura Nishikyo-ku, Kyoto 615-8510, Japan. c Toyota Central Research and Development Laboratories, Inc., Nagakute, Aichi 480-1192, Japan d CREST, Japan Science and Technology Agency, 4-1-8 Honcho, Kawaguchi-shi, Saitama 322-0012, Japan Supporting Information •Materials Acetonitrile was distilled three times over P 2 O 5 and once over CaH 2 immediately before use. DMF and triethanolamine were distilled under reduced pressure and were placed under an Ar atmosphere prior to use. Pluronic F-88 was kindly supplied by BASF. 13 CO 2 ( 13 C = 99%) was purchased from CIL. Other reagents and solvents were commercial grade quality and used without further purification. •General procedure UV–vis absorption spectra were measured using a spectrophotometer (JASCO V-565), which was equipped with an integral sphere unit for diffuse reflectance measurements, and BaSO 4 was used as a standard. Emission spectra were recorded with a fluorescence spectrometer (JASCO FP6500) at 25 °C. Emission quantum yields were recorded using a time-correlated single-photon counting system (Horiba Jobin Yvon FluoroCube) equipped with a NanoLED-460 ( max = 456 nm) as an excitation light-source. XRD patterns were recorded using an X-ray diffractometer (RIGAKU MiniFlex600) Electronic Supplementary Material (ESI) for ChemComm. This journal is © The Royal Society of Chemistry 2015
Transcript of on a p-type semiconducting NiO electrode a Ru(II)-Re(I ... · 1 Photoelectrochemical CO2 reduction...

1
Photoelectrochemical CO2 reduction using a Ru(II)-Re(I) multinuclear metal complex on a p-type semiconducting NiO electrodeGo Sahara,a Ryu Abe,b Masanobu Higashi,b Takeshi Morikawa,c Kazuhiko Maeda,a Yutaro Ueda,a Osamu Ishitani*a,d
a Department of Chemistry, Graduate School of Science and Engineering, Tokyo Institute of Technology, O-okayama 2-12-1-NE-1, Meguro-ku, Tokyo 152-8550, Japan. Fax: +81 3 2759 2284; Tel: +81 3 2759 2240; E-mail: [email protected] Department of Energy and Hydrocarbon Chemistry, Graduate School of Engineering, Kyoto University, Katsura Nishikyo-ku, Kyoto 615-8510, Japan. c Toyota Central Research and Development Laboratories, Inc., Nagakute, Aichi 480-1192, Japand CREST, Japan Science and Technology Agency, 4-1-8 Honcho, Kawaguchi-shi, Saitama 322-0012, Japan
Supporting Information
•MaterialsAcetonitrile was distilled three times over P2O5 and once over CaH2 immediately before use. DMF and triethanolamine were distilled under reduced pressure and were placed under an Ar atmosphere prior to use. Pluronic F-88 was kindly supplied by BASF. 13CO2 (13C = 99%) was purchased from CIL. Other reagents and solvents were commercial grade quality and used without further purification.
•General procedureUV–vis absorption spectra were measured using a spectrophotometer (JASCO V-565), which was equipped with an integral sphere unit for diffuse reflectance measurements, and BaSO4 was used as a standard. Emission spectra were recorded with a fluorescence spectrometer (JASCO FP6500) at 25 °C. Emission quantum yields were recorded using a time-correlated single-photon counting system (Horiba Jobin Yvon FluoroCube) equipped with a NanoLED-460 (max = 456 nm) as an excitation light-source. XRD patterns were recorded using an X-ray diffractometer (RIGAKU MiniFlex600)
Electronic Supplementary Material (ESI) for ChemComm.This journal is © The Royal Society of Chemistry 2015
2
equipped with monochromatic Cu-K radiation operated at 15 mA and 40 kV. Field emission scanning electron microscope images were acquired using a scanning electron microscope (JEOL JSM-7500F). Cyclic voltammograms of the complex were measured using a potentiostat (ALS/CHI CHI-620). GC-MS analysis of the gas phase of the reaction chamber was conducted using a gas chromatograph equipped with a mass spectrometer (Shimadzu, QP-2010-Ultra, Molsieve5A capillary column (30 m) ).
•Preparation of the NiO-metal complex hybrid electrodes1
FTO glass (AGC fabritech, 15 50 mm, 12 /sq) was sonicated in acetone for 10 min and isopropanol for 10 min before use. Ni(NO3)2·6H2O (1.0 g, 99.95% KANTO chemicals) and Pluronic F-88 (0.5 g) were dissolved in water/ethanol (4.5 g, 1:2, w/w). The green solution was aged overnight and centrifuged at 8000 rpm for 3 min. The resulting supernatant solution was used as a precursor. The precursor solution was deposited on FTO by the squeegee method with a glass rod using Scotch mending tape as a spacer. The obtained sample was calcined at 773 K for 30 min in air. This deposition-calcination cycle was repeated four times. The NiO sample for XRD measurement was obtained by a similar method. The precursor solution was deposited on a Pyrex microscope glass slide and calcined under the same conditions. The NiO powder was collected from the surface of the glass slide. The electrode was cut in half before use and immersed in a solution of acetonitrile and metal complex (4 mL, 5 M) overnight. The electrode was washed with acetonitrile after hybridization. The adsorption amount of the metal complex was estimated by the difference in the absorbance of the metal to ligand charge transfer (MLCT) absorption band of the solution (at 461 nm) between before and after hybridization.
•Photoelectrochemical CO2 reductionPhotoelectrochemical CO2 reduction was performed in DMF-triethanolamine (5:1, v/v, 75 mL) containing Et4NBF4 (0.1 M) using an O-ring-sealed Pyrex cell and a stirring tip. The total volume of the cell without the stirring tip and electrodes was ca. 120 mL; therefore, the estimated gas phase was ca. 45 mL. The modified NiO electrode, Pt wire, and Ag/AgNO3 (0.01 M) were used as the working, counter, and reference electrodes, respectively. Note that the counter electrode was separated from the reaction solution by Vycor glass to prevent the influence of oxidization products on the Pt. The working electrode (ca. 2.5 cm2) was irradiated at > 460 nm using a 300-W Xe lamp (Asahi Spectrum MAX-302) with a cutoff filter (HOYA Y48) and an IR-cut mirror module after purging with CO2 for 40 min. The potential of the working electrode was kept constant during irradiation with a potentiostat (ALS/CHI CHI-620). Product analysis of the gas phase was performed by gas chromatography (INFICON 3000 Micro-GC).
3
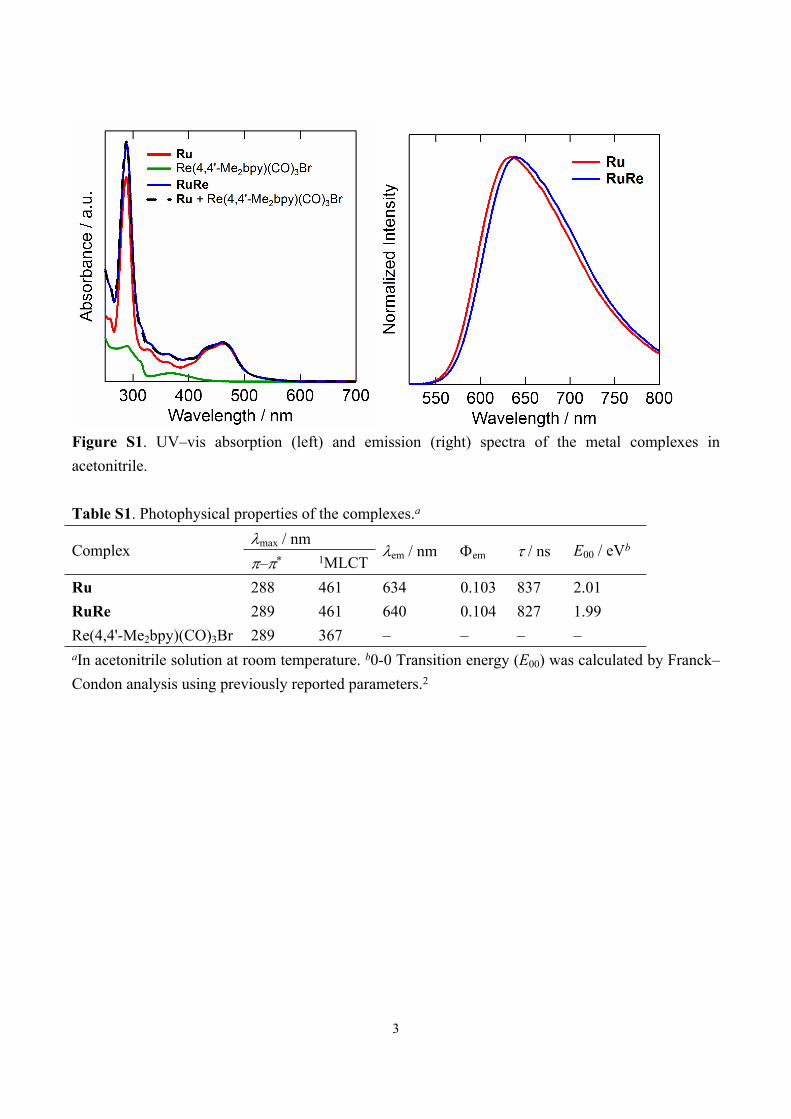
Figure S1. UV–vis absorption (left) and emission (right) spectra of the metal complexes in acetonitrile.
Table S1. Photophysical properties of the complexes.a
max / nmComplex
–* 1MLCTem / nm em / ns E00 / eVb
Ru 288 461 634 0.103 837 2.01RuRe 289 461 640 0.104 827 1.99Re(4,4'-Me2bpy)(CO)3Br 289 367 ‒ ‒ ‒ ‒aIn acetonitrile solution at room temperature. b0-0 Transition energy (E00) was calculated by Franck–Condon analysis using previously reported parameters.2
4
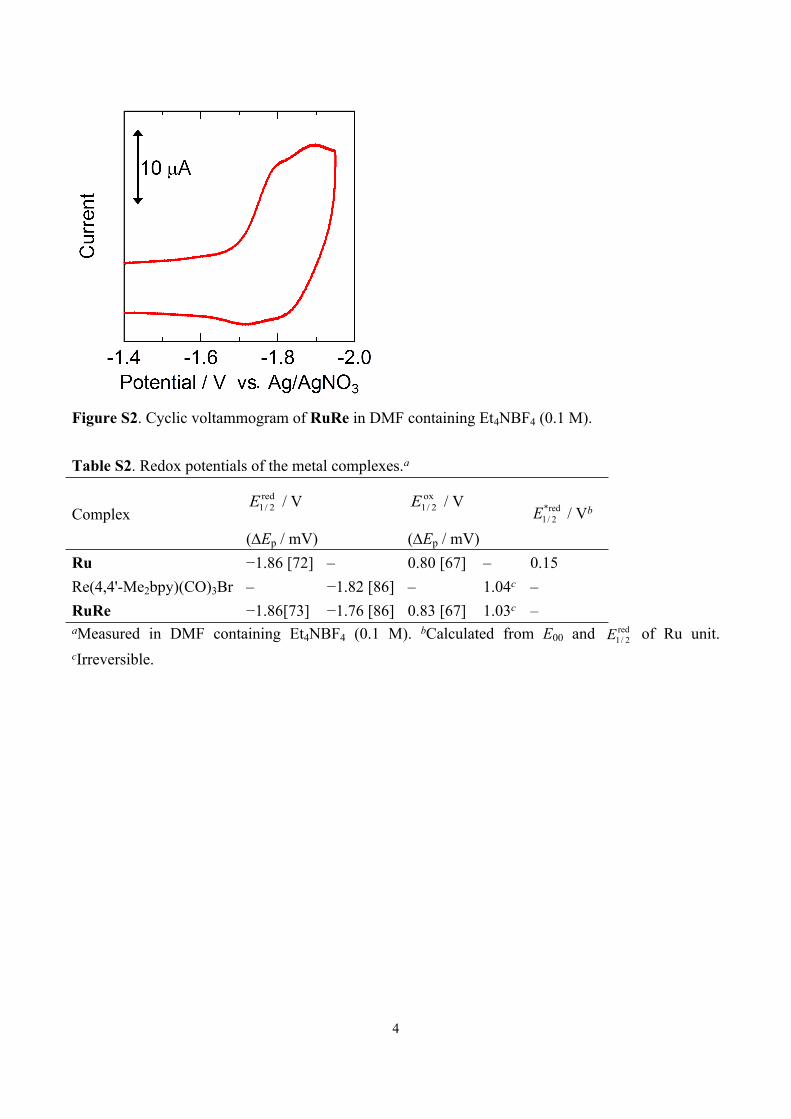
Figure S2. Cyclic voltammogram of RuRe in DMF containing Et4NBF4 (0.1 M).
Table S2. Redox potentials of the metal complexes.a
Complex / Vred
2/1E
(Ep / mV)
/ Vox2/1E
(Ep / mV) / Vbred*
2/1E
Ru −1.86 [72] ‒ 0.80 [67] ‒ 0.15Re(4,4'-Me2bpy)(CO)3Br ‒ −1.82 [86] ‒ 1.04c ‒RuRe −1.86[73] −1.76 [86] 0.83 [67] 1.03c ‒aMeasured in DMF containing Et4NBF4 (0.1 M). bCalculated from E00 and of Ru unit. red
2/1EcIrreversible.

5
Figure S3. XRD pattern of NiO powder.
Figure S4. SEM image of a NiO electrode
6
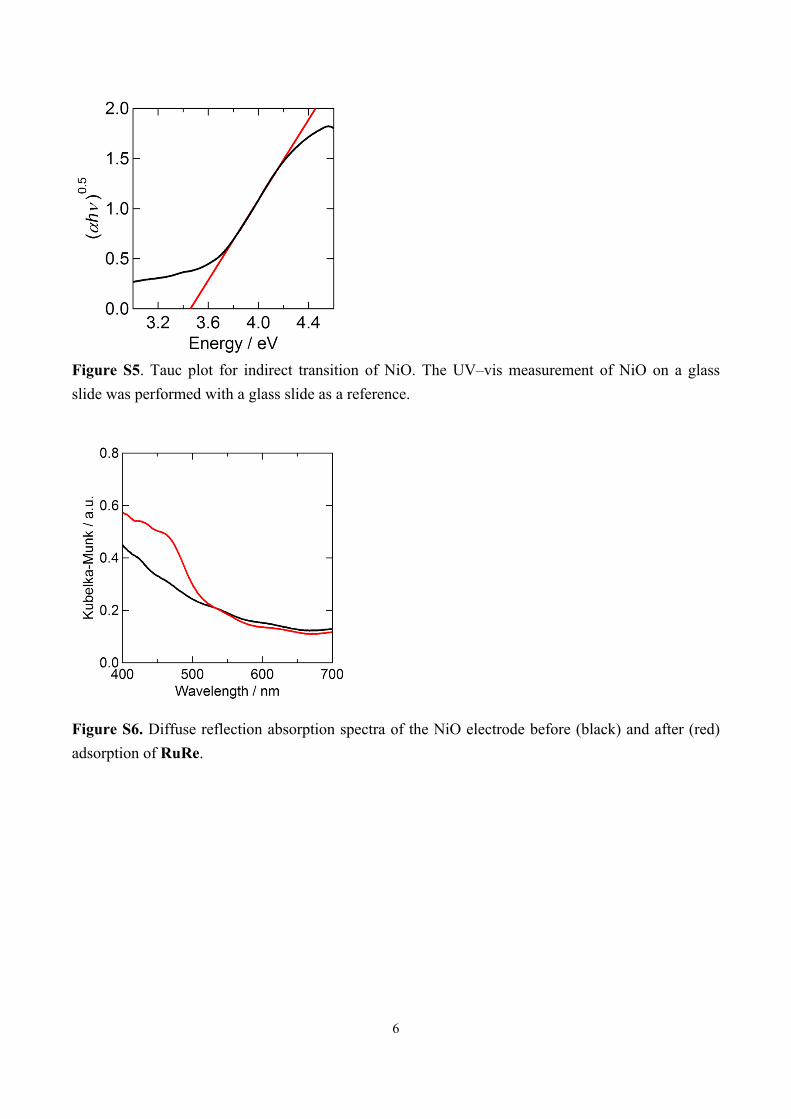
Figure S5. Tauc plot for indirect transition of NiO. The UV–vis measurement of NiO on a glass slide was performed with a glass slide as a reference.
Figure S6. Diffuse reflection absorption spectra of the NiO electrode before (black) and after (red) adsorption of RuRe.
7
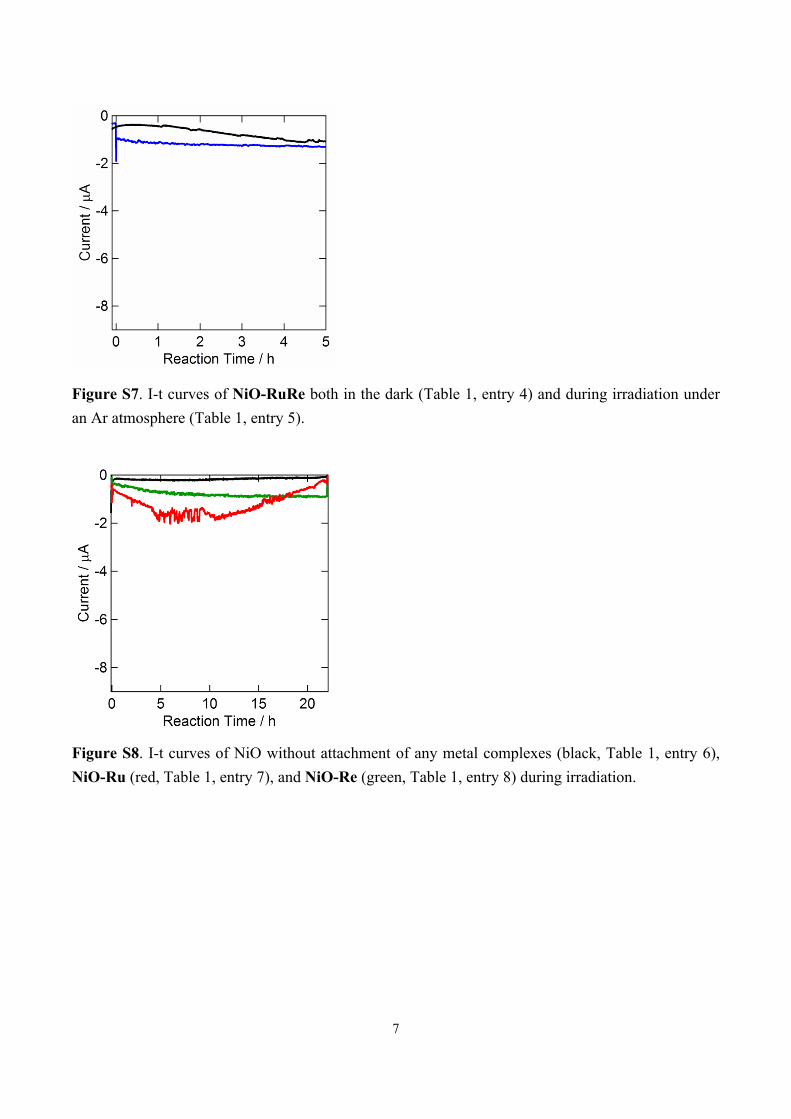
Figure S7. I-t curves of NiO-RuRe both in the dark (Table 1, entry 4) and during irradiation under an Ar atmosphere (Table 1, entry 5).
Figure S8. I-t curves of NiO without attachment of any metal complexes (black, Table 1, entry 6), NiO-Ru (red, Table 1, entry 7), and NiO-Re (green, Table 1, entry 8) during irradiation.
8
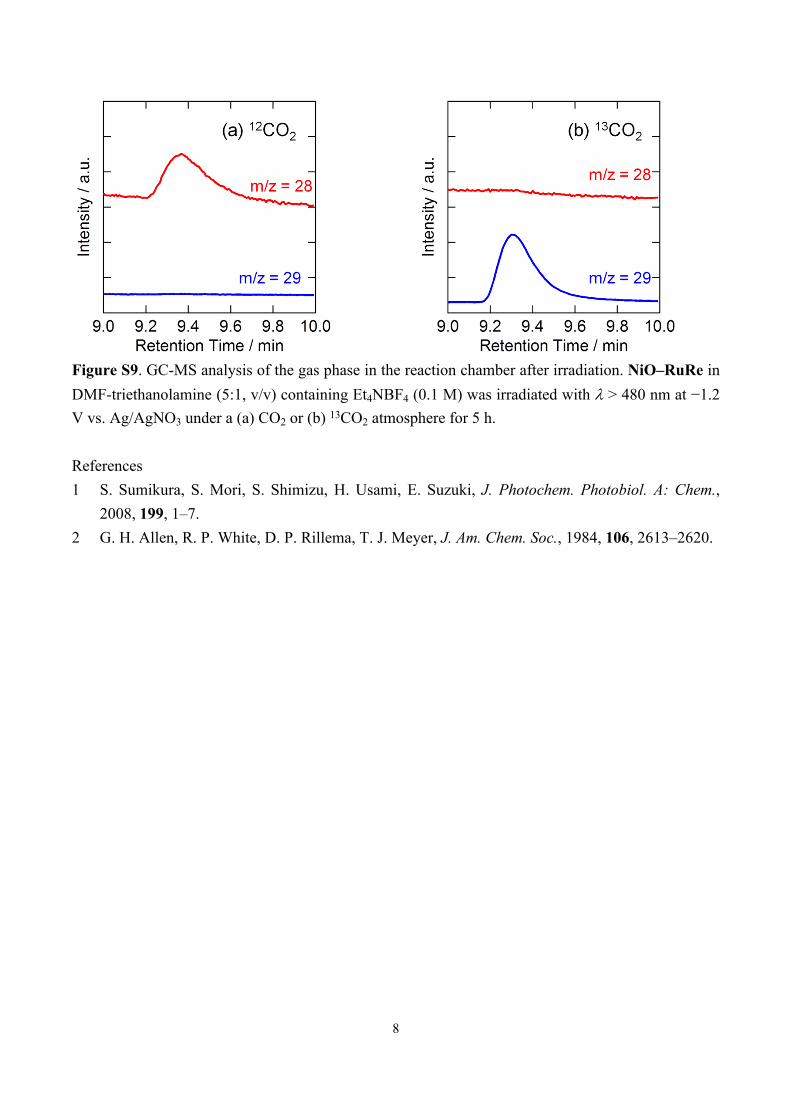
Figure S9. GC-MS analysis of the gas phase in the reaction chamber after irradiation. NiO–RuRe in DMF-triethanolamine (5:1, v/v) containing Et4NBF4 (0.1 M) was irradiated with > 480 nm at −1.2 V vs. Ag/AgNO3 under a (a) CO2 or (b) 13CO2 atmosphere for 5 h.
References1 S. Sumikura, S. Mori, S. Shimizu, H. Usami, E. Suzuki, J. Photochem. Photobiol. A: Chem.,
2008, 199, 1–7.2 G. H. Allen, R. P. White, D. P. Rillema, T. J. Meyer, J. Am. Chem. Soc., 1984, 106, 2613‒2620.