OLYMPUS Automated Filter Analysis System - 显微镜门 · PDF file ·...
24
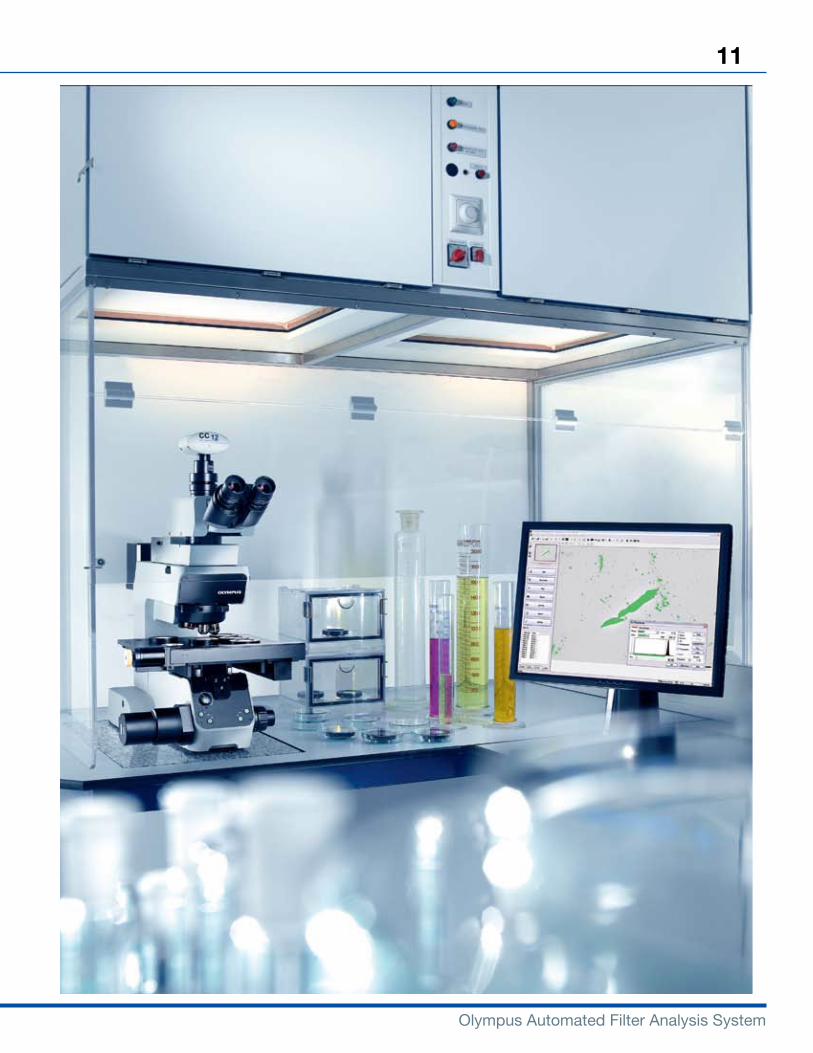
Olympus Automated Filter Analysis System OLYMPUS Automated Filter Analysis System for the accurate detection, counting, classification, and measurement of residue/particulates according to ISO and USP standards
Transcript of OLYMPUS Automated Filter Analysis System - 显微镜门 · PDF file ·...
Olympus Automated Filter Analysis System
OLYMPUS Automated Filter Analysis System for the accurate detection, counting, classification, and measurement of residue/particulates according to ISO and USP standards
Olympus Automated Filter Analysis System
OLYMPUS Automated Filter Analysis System for the accurate detection, counting, classification, and measurement of residue/particulates according to ISO and USP standards
Olympus Automated Filter Analysis System
1. IntrOdUctIOn
2. HArdwAre cOMPOnentS And AvAILAbLe AcceSSOrIeS Introduction 2.1 the frames 2.2 Objectives 2.3 Illumination 2.4 digital cameras 2.5 High-power control 2.6 Motorized stage and stage controller 2.7 Filter insert 2.8 Particle normal
3. cOntrOL center: tHe SYSteM SOFtwAre Introduction 3.1 Adapted to Filter Inspection workflows 3.2 Overall system settings 3.2.1 Scan geometry and scan area 3.2.2 Scan diameter 3.2.3 diameter of flow-through area 3.2.4 batch mode 3.2.5 Assort frames 3.2.6 Minimal particle area 3.2.7 Preview 3.2.8 report template 3.2.9 Scan area options 3.3 Flexible focus solutions 3.4 Frame independent detection 3.5 Particle detection and analysis 3.6 Advanced particle analysis 3.7 Metal and non-metal particles 3.8 Particle analysis output documents 3.9 classification 3.10 Approval features 3.11 revision of particle analysis 3.12 Archiving 3.13 reporting 3.14 User rights and security issues
4. eStAbLISHed StAndArdS, FUnctIOn LIStS And SPecIFIcAtIOnS Introduction 4.1 established standards 4.1.1 established standards 4.1.2 details in ISO 16232 4.1.2 company and industrial standards 4.2 Specifications 4.2.1 XM10 4.2.2 Xc10 4.3 Function list Olympus Automated Filter Analysis System
3tAbLe OF cOntentS
Olympus Automated Filter Analysis System
1. IntrOdUctIOn
Olympus Automated Filter Analysis System
1. IntrOdUctIOn
cLeAnLIneSS - A SIgn OF qUALItY Material contamination by the tiniest particles has become a focus of modern quality assurance. Initially it was the pharmaceuticals and semiconductor industries that have been occupied with material contamination in the thousandth millimeter range. However, as functional density of parts/components has increased and the expectations on production sequences and quality have grown, this topic has also caught the eye of the automobile, aircraft, and clean energy industries along with their supplier industries. tough global competition has made identifying contamination sources and subsequent elimination a decisive competitive advantage. the extremely rigorous demands of national, international or company-specific standards clearly demonstrate just how critically important the cleanliness level has become - one tremendously important step in the whole value-creating production process.
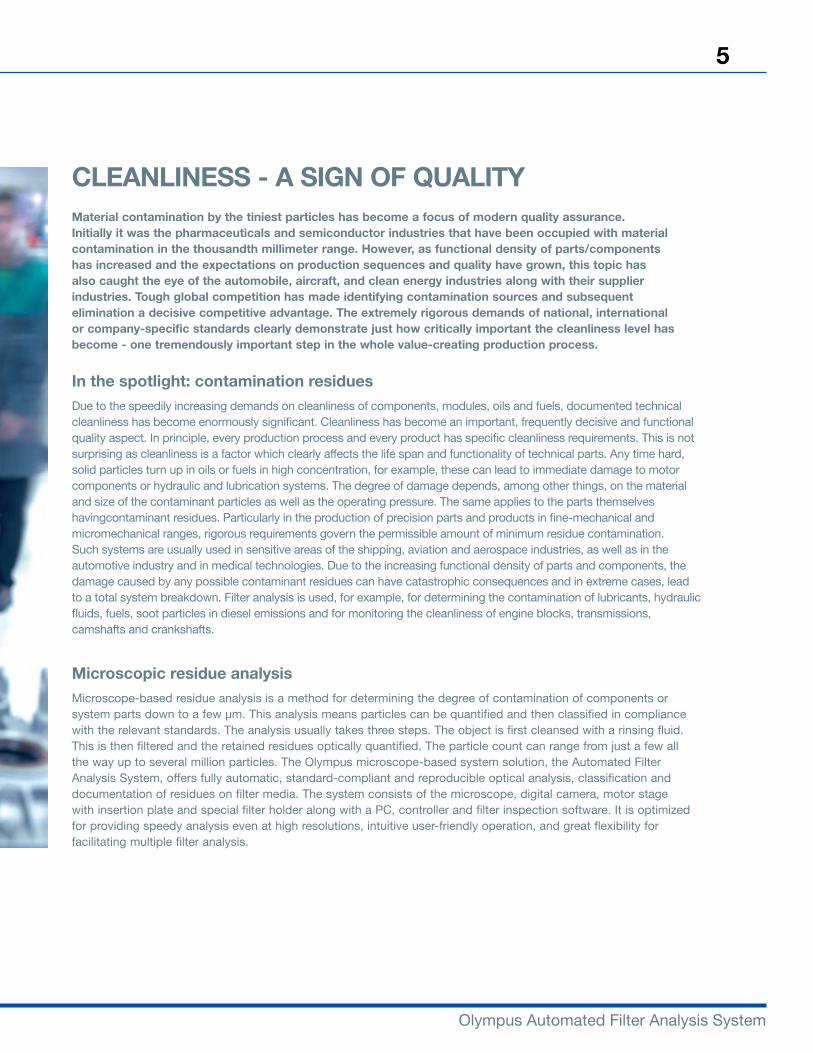
In the spotlight: contamination residuesDue to the speedily increasing demands on cleanliness of components, modules, oils and fuels, documented technical cleanliness has become enormously significant. Cleanliness has become an important, frequently decisive and functional quality aspect. In principle, every production process and every product has specific cleanliness requirements. This is not surprising as cleanliness is a factor which clearly affects the life span and functionality of technical parts. Any time hard, solid particles turn up in oils or fuels in high concentration, for example, these can lead to immediate damage to motor components or hydraulic and lubrication systems. The degree of damage depends, among other things, on the material and size of the contaminant particles as well as the operating pressure. The same applies to the parts themselves havingcontaminant residues. Particularly in the production of precision parts and products in fine-mechanical and micromechanical ranges, rigorous requirements govern the permissible amount of minimum residue contamination. Such systems are usually used in sensitive areas of the shipping, aviation and aerospace industries, as well as in the automotive industry and in medical technologies. Due to the increasing functional density of parts and components, the damage caused by any possible contaminant residues can have catastrophic consequences and in extreme cases, lead to a total system breakdown. Filter analysis is used, for example, for determining the contamination of lubricants, hydraulic fluids, fuels, soot particles in diesel emissions and for monitoring the cleanliness of engine blocks, transmissions, camshafts and crankshafts.
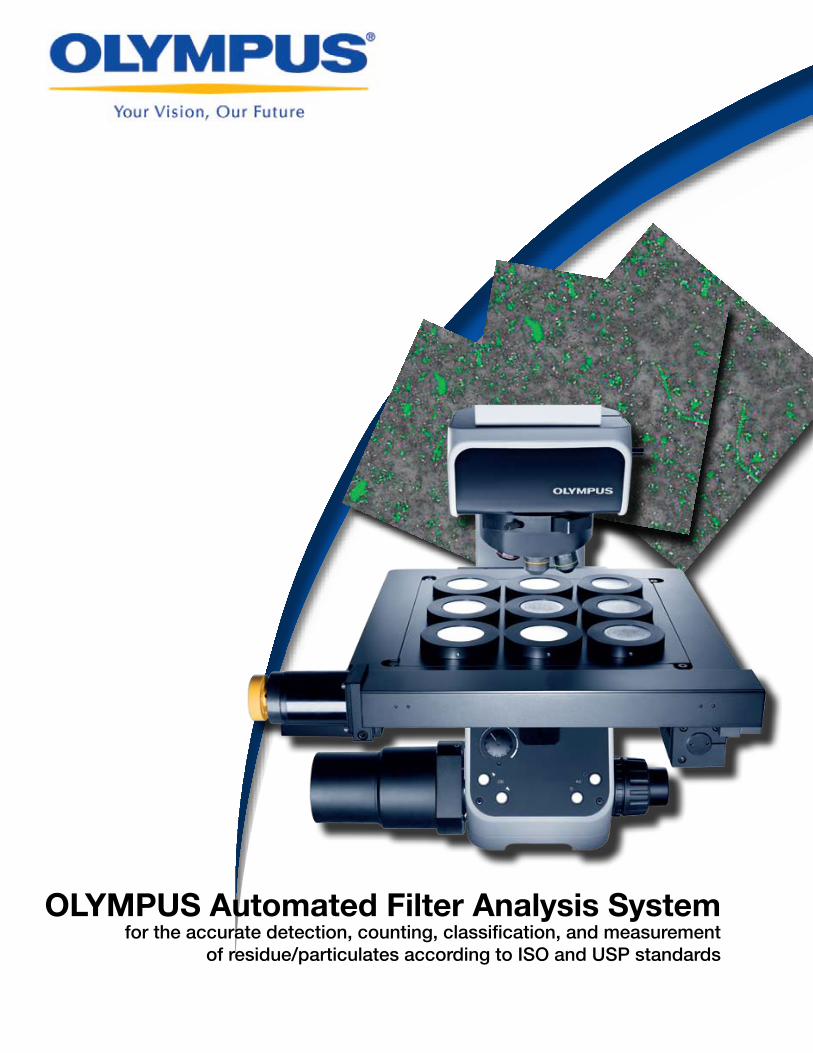
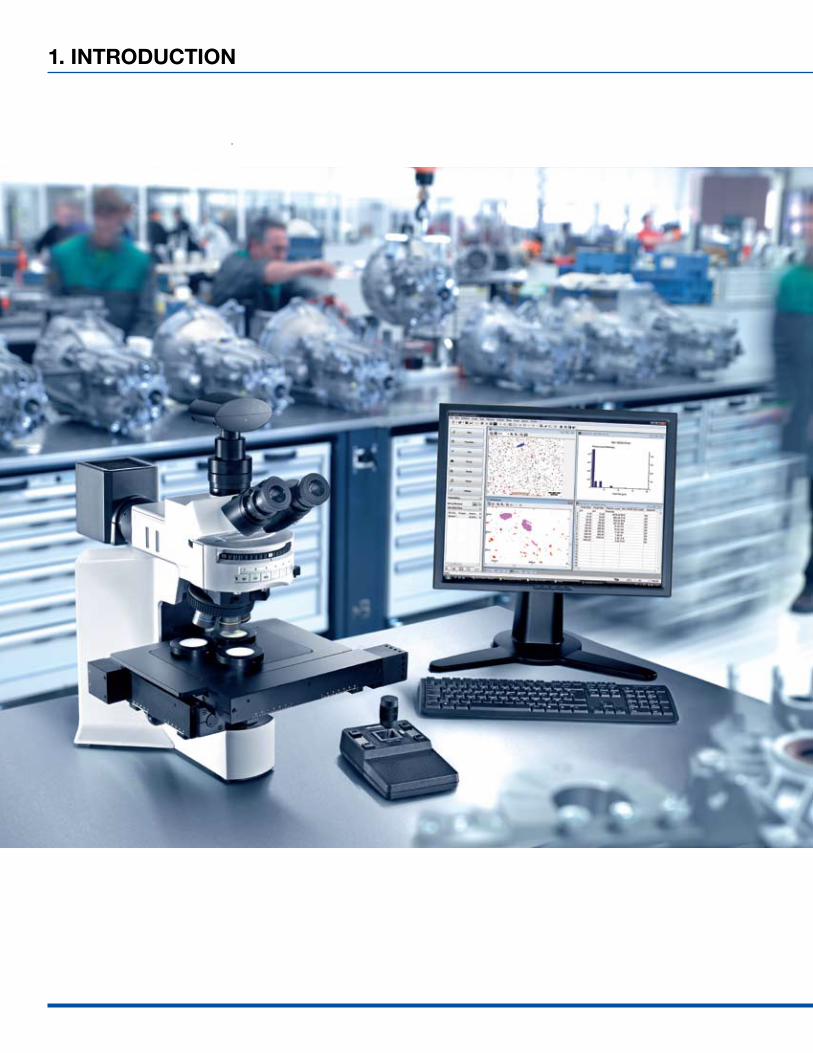
Microscopic residue analysisMicroscope-based residue analysis is a method for determining the degree of contamination of components or system parts down to a few µm. This analysis means particles can be quantified and then classified in compliance with the relevant standards. The analysis usually takes three steps. The object is first cleansed with a rinsing fluid. This is then filtered and the retained residues optically quantified. The particle count can range from just a few all the way up to several million particles. The Olympus microscope-based system solution, the Automated Filter Analysis System, offers fully automatic, standard-compliant and reproducible optical analysis, classification and documentation of residues on filter media. The system consists of the microscope, digital camera, motor stage with insertion plate and special filter holder along with a PC, controller and filter inspection software. It is optimized for providing speedy analysis even at high resolutions, intuitive user-friendly operation, and great flexibility for facilitating multiple filter analysis.
5

Olympus Automated Filter Analysis System
1. IntrOdUctIOn
Olympus Automated Filter Analysis System
1. IntrOdUctIOn
A SOLUtIOn FOr MeetIng tOdAY’S tecHnIcAL cLeAnLIneSS deMAndSAn automated system for development, manufacturing and productionexact information on the nature of the contamination such as number of particles, particle size distribution and particle composition are all of decisive significance for the life span of parts and components. counting, analysis and classification of the often microscopically tiny contaminant and foreign particles has grown enormously important for all processes: development, manufacturing and production as well as quality control of the final product. without a doubt, demand is high for comparable, reproducible and reliable data and measurements on technical cleanliness.
Hardware components and 6–13available accessoriesThe effective standards concerning technical cleanliness are for a fully automated system. A system of this kind consists of components such as a microscope, digital camera, motorized stage and filter holder and each of these must fulfill the dedicated requirements and specifications.
established standards, function lists 20–23and specificationsThe standard version of the Automated Filter Analysis System includes numerous national and international standards and measurement specifications for particle evaluation. Olympus Automated Filter Analysis System software also offers a formula editor whose operation is convenient and intuitive. This makes it easy for users and companies to define their own standards and integrate them with the evaluation. Furthermore these pages give an overview of the specifications and function lists of the system components used in the systems.
control center: the system software 14–19A central part of the system are the internationally valid standards. These make dedicated system software specifications essential. The data must be evaluated in compliance with standards using automated data collection and residual particle counting with operator influence kept to a minimum.
7
Olympus Automated Filter Analysis System
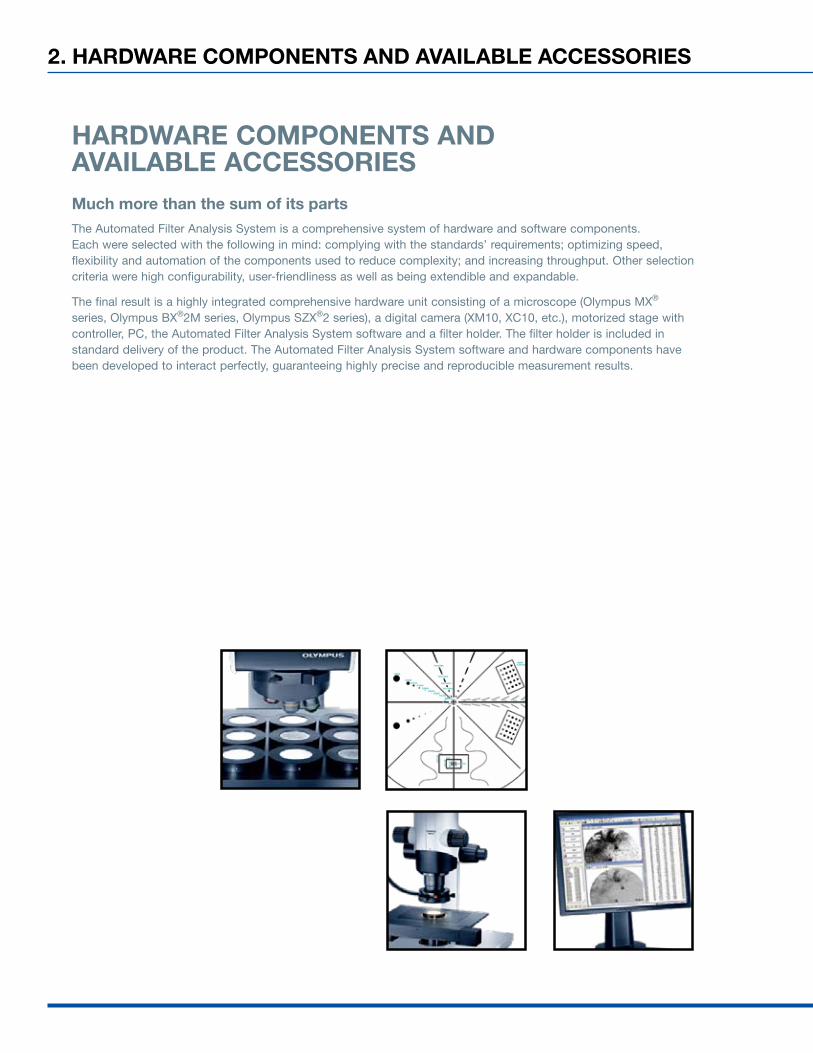
HArdwAre cOMPOnentS And AvAILAbLe AcceSSOrIeSMuch more than the sum of its partsThe Automated Filter Analysis System is a comprehensive system of hardware and software components. Each were selected with the following in mind: complying with the standards’ requirements; optimizing speed, flexibility and automation of the components used to reduce complexity; and increasing throughput. Other selection criteria were high configurability, user-friendliness as well as being extendible and expandable.
The final result is a highly integrated comprehensive hardware unit consisting of a microscope (Olympus MX® series, Olympus BX®2M series, Olympus SZX®2 series), a digital camera (XM10, XC10, etc.), motorized stage with controller, PC, the Automated Filter Analysis System software and a filter holder. The filter holder is included in standard delivery of the product. The Automated Filter Analysis System software and hardware components have been developed to interact perfectly, guaranteeing highly precise and reproducible measurement results.
2. HArdwAre cOMPOnentS And AvAILAbLe AcceSSOrIeS
Olympus Automated Filter Analysis System
2. HArdwAre cOMPOnentS And AvAILAbLe AcceSSOrIeS 9
the Automated Filter Analysis System is built on the highly flexible Olympus ‘optical bench’ microscopy concept, enabling each system to be exactly right for every requirement. every component is made to the highest standards and ready for use in any task.
2.1 the framesb.1 Microscopes of the Olympus MX, BX2M and SZX2 series are the
microscopes of choice for the Automated Filter Analysis System. This includes the extraordinary optical performance and their logical structure. They all offer properties which meet the standard requirements for automated residue analysis: eg, these standards require a resolution equal to 1/10 of the size of the smallest particles.
In addition, numerous motorized components and the unique modular, ergonomic design ensure maximum efficiency. Furthermore, the microscopes of the Olympus MX, BX2M and SZX2 series can be expanded according to the customers’ needs and requirements via our many optimal components. Each motorized component can be directly controlled, monitored and automated using the software.
2.2 Objectivesb.2 The objectives used with the Automated Filter Analysis System are
from the advanced Olympus UIS2 series, offering excellent transmission across the entire spectrum. All objectives are plan-corrected and offer optimized contrast. The Olympus UIS2 aims to be the world’s premium quality objective lens with a broad selection of magnifications and numerous features for a wide range of applications. The unique wavefront aberration control and neutral color reproduction provide even greater optimization of key image performance - for direct eye viewing and digital imaging. The UIS2 objective lens series provides the optimal image for every kind of imaging.
2.3 Illuminationb.3 Standards require homogeneous illumination for all magnifications. The
microscopes used in the Automated Filter Analysis System come with the 100 Watt halogen light source. This light source provides high-fidelity bright light observation and can be polarized using the correct filters. The stability and quality of the light provided by these illumination systems coupled with the imaging camera produce unmatched image reproduction. This makes the image quality of high-end microscope optics conveniently available on users’ computer monitors.
2.4 digital camerab.4 / b.5 The Peltier-cooled XC10 digital camera or the Peltier-cooled XM10 monochrome camera are the cameras of choice for the Automated Filter Analysis System. Both offer the features a system for automated residue analysis needs: high resolution, fast frame rates, high sensitivity, an excellent signal-to-noise ratio, broad dynamic range and superior image quality. According to the relevant standards, the smallest particle must equal 10 pixels. With a 1376 x 1032 pixel CCD chip and 14-bit analog-digital conversion for each channel, both cameras meet this requirement. In combination with the Peltier-cooling, the superior properties of the CCD chip ensure images that are rich in detail and contrast and that have extraordinarily low noise.
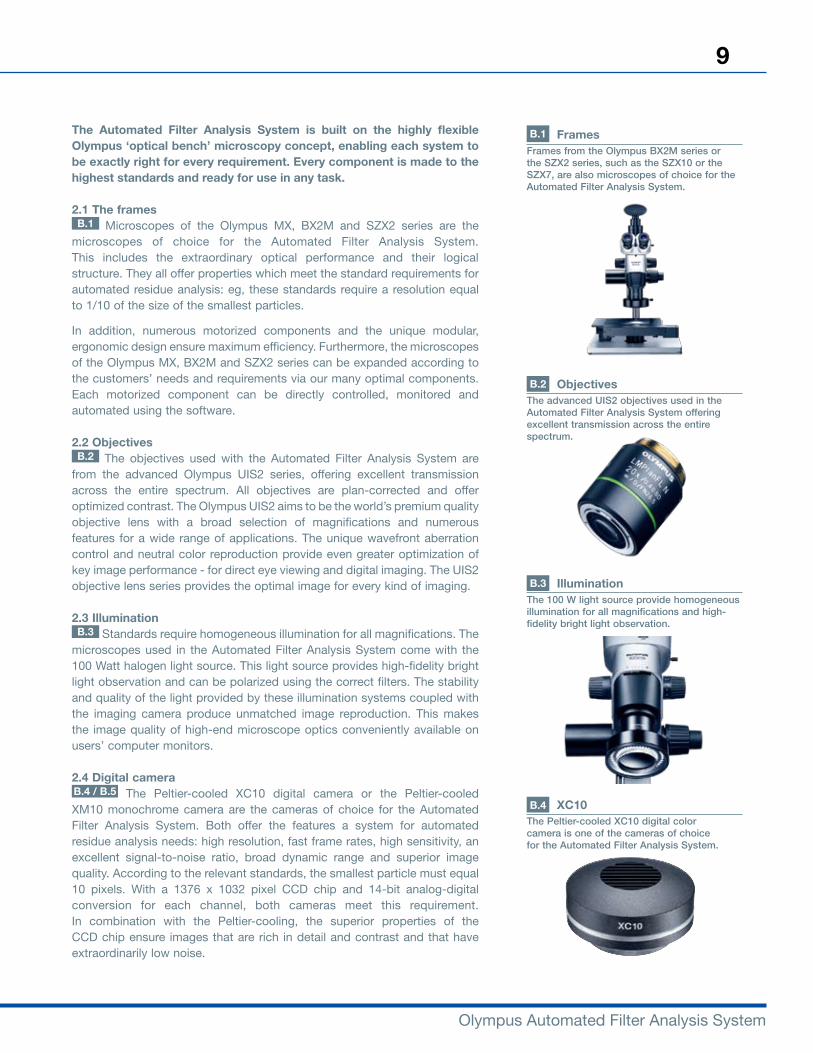
b.1 FramesFrames from the Olympus BX2M series or the SZX2 series, such as the SZX10 or the SZX7, are also microscopes of choice for the Automated Filter Analysis System.
b.2 ObjectivesThe advanced UIS2 objectives used in the Automated Filter Analysis System offering excellent transmission across the entire spectrum.
b.3 IlluminationThe 100 W light source provide homogeneous illumination for all magnifications and high-fidelity bright light observation.
b.4 Xc10The Peltier-cooled XC10 digital color camera is one of the cameras of choice for the Automated Filter Analysis System.
Olympus Automated Filter Analysis System
2. HArdwAre cOMPOnentS And AvAILAbLe AcceSSOrIeS
High-power controlIn order to meet the high demands on the Automated Filter Analysis System, the workstation has been equipped to provide optimal speed, reliability and performance. A premium specification PC-based workstation provides all the power required for complex control and processing of both microscope and analysis functions. The large, high-resolution monitor is driven by a dedicated graphic board and a multiformat DVD burner provides easy-to-use optical storage.
2.5 Motorized stage and stage controllerb.6 To fulfill the rigorous accuracy that standards require, the Automated
Filter Analysis System comes with a highly precise motorized XYZ stage. The stage provides the system with superb accuracy and reproducibility within the range of even the smallest particles. A dedicated stage controller board ensures optimal performance. The stage scans the complete filter and assures reliable relocation of positions. The complete integration of the motorized stage with the software offers flexible focus solutions. On the one hand, there‘s a semi-automatic solution using the motorized focus drive in conjunction with the focus map with a nearly unlimited number of focus points – if necessary. On the other hand, there’s the fully automatic approach using hardware autofocus: ie, for BX61, MX61 as a high-end solution. Camera and stage must be aligned parallel to the direction the stage moves. If this is not the case, individual images in the overview image will appear twisted with respect to one another.
2.6 Filter insertb.6 The Automated Filter Analysis System comes with a dedicated
stage insert. This facilitates fast and precise filter positioning. The round component stretches the filter with 3 screws and clips itself into the rectangular stage insert. The Automated Filter Analysis System also offers a special multi-filter holder. With this device, sample mountings of several filters can be applied for doing serial inspections. Olympus offers an insert which can have up to 9 filters mounted on it simultaneously. The analysis is then conducted and evaluated automatically providing considerable time savings compared with filter analysis using just one filter holder.
2.7 Particle standardb.7 The Automated Filter Analysis System offers a Particle standard, an
integrated validation tool for checking the following: calibration, particle parameter evaluation algorithms, and measurement precision. This tool is divided up into octants. Each individual octant is for monitoring a specific particle parameter. These include shapes such as the circles and ellipses of varying size, varied object shapes and angles, along with distended and spiral particles. Using bar codes (with varied line thicknesses and distances from one another) the camera, stage rotation, precision of stage movement, and individual image overlap for panorama images can all be monitored – and calibrated if necessary.
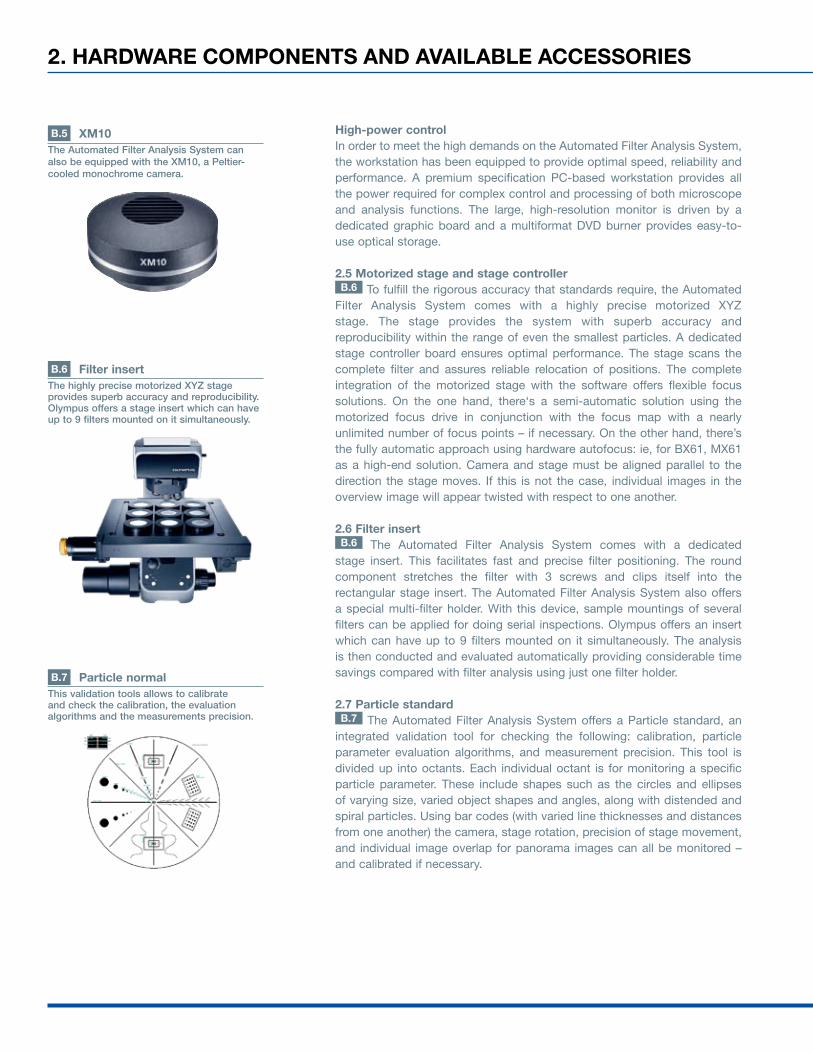
The Automated Filter Analysis System can also be equipped with the XM10, a Peltier-cooled monochrome camera.
b.6 Filter insertThe highly precise motorized XYZ stage provides superb accuracy and reproducibility. Olympus offers a stage insert which can have up to 9 filters mounted on it simultaneously.
b.7 Particle normalThis validation tools allows to calibrate and check the calibration, the evaluation algorithms and the measurements precision.
b.5 XM10
Olympus Automated Filter Analysis System
2. HArdwAre cOMPOnentS And AvAILAbLe AcceSSOrIeS 11
Olympus Automated Filter Analysis System
3. cOntrOL center: tHe SYSteM SOFtwAre
cOntrOL center - tHe SYSteM SOFtwAreMake it fit: scan the sample, revise the scan, and make a report The user-friendly software of the Automated Filter Analysis System guides users through the entire analysis process. As with all products of the Olympus Automated Filter Analysis System, the software of the System is renowned for its intuitive operation with a large-button concept and extensive flexibility. This is why even inexperienced users can carry out complex analyses successfully in just a few steps. And it takes no time at all to learn how to do so. All basic settings are defined just once when the system is configured. These settings include tilt compensation, determination of analysis parameters, selection of the relevant standard, determination of the report template, etc. The settings can be managed by an administrator who sets up the corresponding user profiles for the employees. These parameters, which cannot be modified by the users themselves, are loaded at the click of a button. Just a simple click of the mouse after positioning the filter starts the entire process. Results can be revised, documentation of inspection results is automatically generated and then archived – all integrated.
The Automated Filter Analysis System software is user-friendly and guides the user step-by-step through the entire analysis procedure. As do all products of the Automated Filter Analysis System, the Automated Filter Analysis System software offers intuitive usability with its large-button concept and enormous flexibility. The Automated Filter Analysis System’s user interface is also intuitive. After system setup, a complete filter scan can be done in just three clicks of the mouse: 1) define a new scan, 2) define the thresholds of the particles to be detected, and 3) start the process. The entire filter will be scanned in just a few minutes and documented with a mouse click according to your templates. Then the particle scan can be revised using extensive tools. Earlier scans can be re-classified using new standards.
The Olympus Automated Filter Analysis System is a powerful scan engine for detecting all kinds of particles. The Automated Filter Analysis System is the solution for handling residue analysis and cleanliness measurements. The Inclusion Inspector Module is for rating non-metallic inclusions in steel. The Cast iron Inspector Module is for graphite analysis in cast iron.The Inspector series has a workflow-oriented GUI (Graphical User Interface) for all series products. Large buttons with self-explaining captions, located on the left-hand side guide the user through the whole process. This guarantees that routine work can be done with a few mouse clicks on those buttons without any tedious setup required. Although it is easy-to-use for everybody, the concept of the Olympus Inspector Series is also flexible enough for executing complex tasks as well.
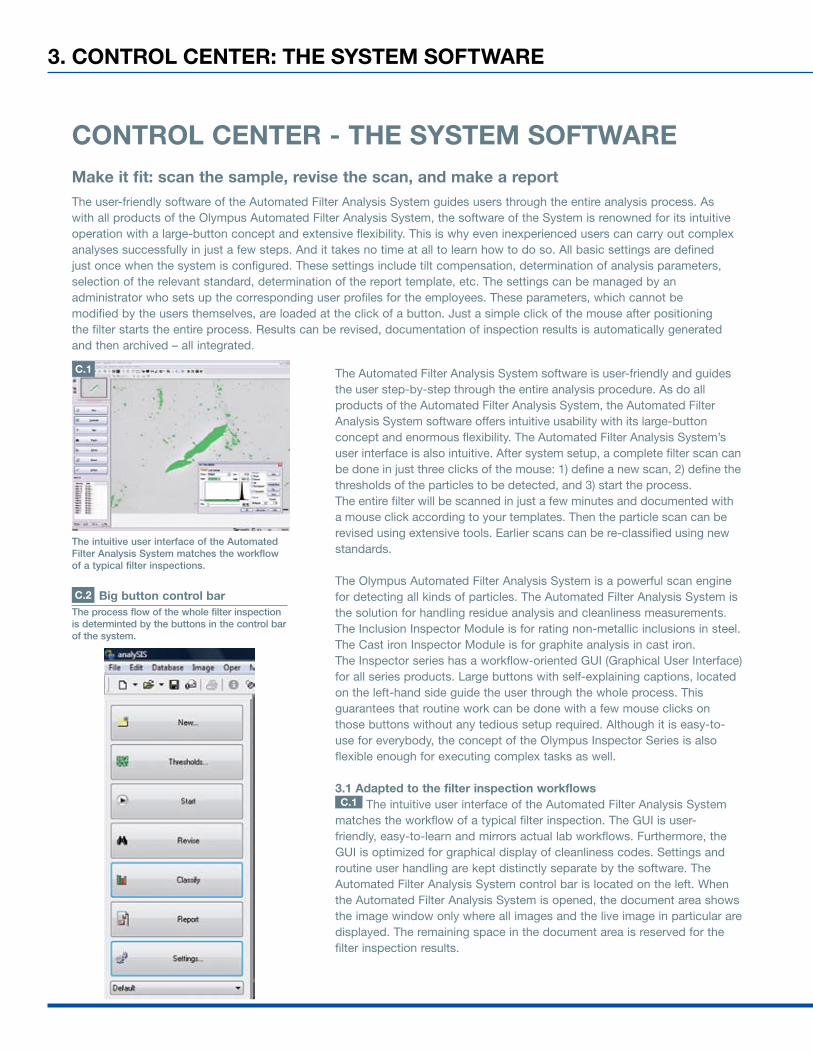
3.1 Adapted to the filter inspection workflows c.1 The intuitive user interface of the Automated Filter Analysis System
matches the workflow of a typical filter inspection. The GUI is user-friendly, easy-to-learn and mirrors actual lab workflows. Furthermore, the GUI is optimized for graphical display of cleanliness codes. Settings and routine user handling are kept distinctly separate by the software. The Automated Filter Analysis System control bar is located on the left. When the Automated Filter Analysis System is opened, the document area shows the image window only where all images and the live image in particular are displayed. The remaining space in the document area is reserved for the filter inspection results.
The intuitive user interface of the Automated Filter Analysis System matches the workflow of a typical filter inspections.
big button control barThe process flow of the whole filter inspection is determinted by the buttons in the control bar of the system.
c.1
c.2
Olympus Automated Filter Analysis System
3. cOntrOL center: tHe SYSteM SOFtwAre 13
c.2 The process flow of a filter inspection is determined by the buttons in the Filter Inspector control bar. When the system is correctly configured, a filter is investigated in three steps. The Automated Filter Analysis System comes with two sets of large buttons: one set for the scan, and the other for scan revision. Both go from top to bottom. The Scan button bar offers everything needed for the scan. Just a few clicks of the mouse are thennecessary to complete full filter evaluation. The Revision button bar offers all functions for revising scan results.
3.2 Over all system settingsAll base settings of sub tasks are wizard-controlled: scan path, scan area, definition of tilt compensation or focus map, standard selection, analysis, evaluation, archiving, selection of a report template, etc. These settings can be saved to a profile and password-protected if so desired. Only the administrator is able to reconfigure the setup. Users can then only work according to their user-profile. The Automated Filter Analysis System software allows fine tuning via a general settings dialog. Further modification is not needed once the setup has been defined. The settings offer adjustment of the following:
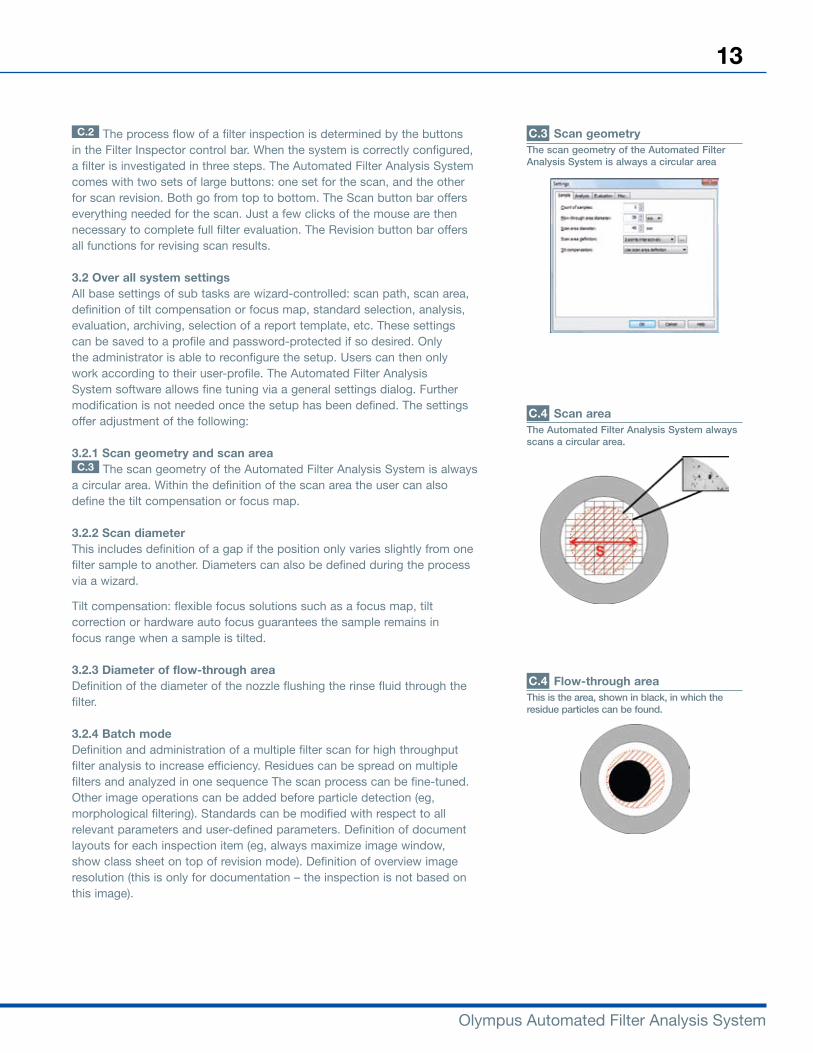
3.2.1 Scan geometry and scan area c.3 The scan geometry of the Automated Filter Analysis System is always
a circular area. Within the definition of the scan area the user can also define the tilt compensation or focus map.
3.2.2 Scan diameter This includes definition of a gap if the position only varies slightly from one filter sample to another. Diameters can also be defined during the process via a wizard.
Tilt compensation: flexible focus solutions such as a focus map, tilt correction or hardware auto focus guarantees the sample remains in focus range when a sample is tilted.
3.2.3 diameter of flow-through area Definition of the diameter of the nozzle flushing the rinse fluid through the filter.
3.2.4 batch modeDefinition and administration of a multiple filter scan for high throughput filter analysis to increase efficiency. Residues can be spread on multiple filters and analyzed in one sequence The scan process can be fine-tuned. Other image operations can be added before particle detection (eg, morphological filtering). Standards can be modified with respect to all relevant parameters and user-defined parameters. Definition of document layouts for each inspection item (eg, always maximize image window, show class sheet on top of revision mode). Definition of overview image resolution (this is only for documentation – the inspection is not based on this image).
c.3 Scan geometryThe scan geometry of the Automated Filter Analysis System is always a circular area
c.4 Scan areaThe Automated Filter Analysis System always scans a circular area.
c.4 Flow-through areaThis is the area, shown in black, in which the residue particles can be found.
Olympus Automated Filter Analysis System
3. cOntrOL center: tHe SYSteM SOFtwAre
3.2.5 Assort framesThe number of images to review after scanning in order to acquire images of the largest particles. The frames can be acquired automatically or after prompting.
3.2.6 Minimal particle areaThis saves memory. Particles smaller than considered in the standard are to be ignored during detection.
3.2.7 Preview This function enables actually viewing the threshold settings while scanning. This is an ideal monitoring tool. Disabling this function may increase the acquisition rate for low performance systems.
3.2.8 report templatesReport templates can be combined with standards. Enabling a combination will generate the respective report when “Report” is pressed on the main button bar.
3.2.9 Scan area optionsThe Automated Filter Analysis System always scans a circular area.
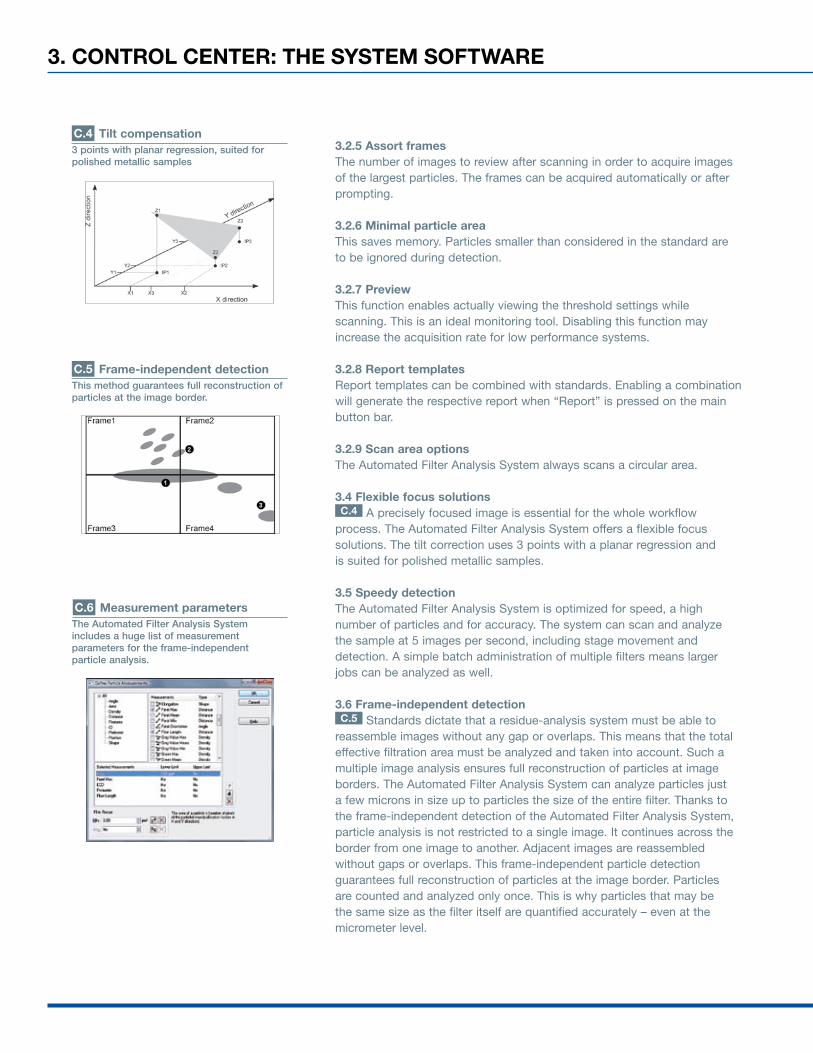
3.4 Flexible focus solutionsc.4 A precisely focused image is essential for the whole workflow
process. The Automated Filter Analysis System offers a flexible focus solutions. The tilt correction uses 3 points with a planar regression and is suited for polished metallic samples.
3.5 Speedy detectionThe Automated Filter Analysis System is optimized for speed, a high number of particles and for accuracy. The system can scan and analyze the sample at 5 images per second, including stage movement and detection. A simple batch administration of multiple filters means larger jobs can be analyzed as well.
3.6 Frame-independent detectionc.5 Standards dictate that a residue-analysis system must be able to
reassemble images without any gap or overlaps. This means that the total effective filtration area must be analyzed and taken into account. Such a multiple image analysis ensures full reconstruction of particles at image borders. The Automated Filter Analysis System can analyze particles just a few microns in size up to particles the size of the entire filter. Thanks to the frame-independent detection of the Automated Filter Analysis System, particle analysis is not restricted to a single image. It continues across the border from one image to another. Adjacent images are reassembled without gaps or overlaps. This frame-independent particle detection guarantees full reconstruction of particles at the image border. Particles are counted and analyzed only once. This is why particles that may be the same size as the filter itself are quantified accurately – even at the micrometer level.
c.4 tilt compensation3 points with planar regression, suited for polished metallic samples
c.5 Frame-independent detectionThis method guarantees full reconstruction of particles at the image border.
c.6 Measurement parametersThe Automated Filter Analysis System includes a huge list of measurement parameters for the frame-independent particle analysis.
Olympus Automated Filter Analysis System
3. cOntrOL center: tHe SYSteM SOFtwAre 15
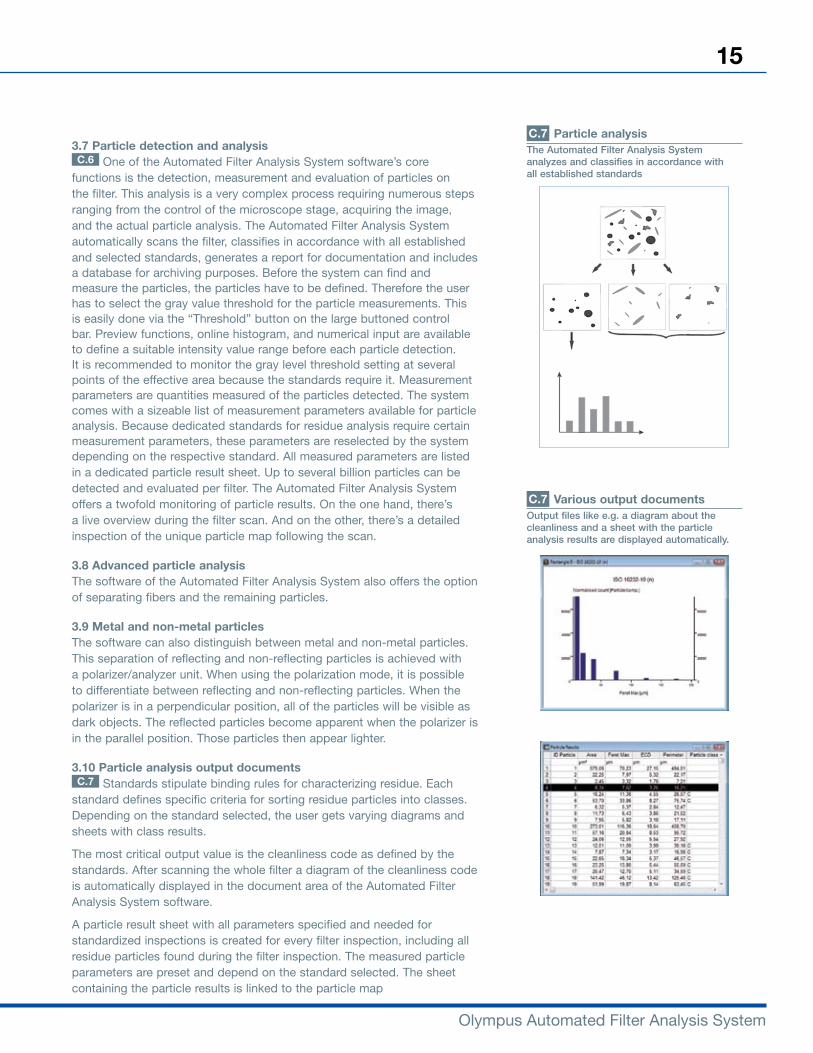
3.7 Particle detection and analysisc.6 One of the Automated Filter Analysis System software’s core
functions is the detection, measurement and evaluation of particles on the filter. This analysis is a very complex process requiring numerous steps ranging from the control of the microscope stage, acquiring the image, and the actual particle analysis. The Automated Filter Analysis System automatically scans the filter, classifies in accordance with all established and selected standards, generates a report for documentation and includes a database for archiving purposes. Before the system can find and measure the particles, the particles have to be defined. Therefore the user has to select the gray value threshold for the particle measurements. This is easily done via the “Threshold” button on the large buttoned control bar. Preview functions, online histogram, and numerical input are available to define a suitable intensity value range before each particle detection. It is recommended to monitor the gray level threshold setting at several points of the effective area because the standards require it. Measurement parameters are quantities measured of the particles detected. The system comes with a sizeable list of measurement parameters available for particle analysis. Because dedicated standards for residue analysis require certain measurement parameters, these parameters are reselected by the system depending on the respective standard. All measured parameters are listed in a dedicated particle result sheet. Up to several billion particles can be detected and evaluated per filter. The Automated Filter Analysis System offers a twofold monitoring of particle results. On the one hand, there’s a live overview during the filter scan. And on the other, there’s a detailed inspection of the unique particle map following the scan.
3.8 Advanced particle analysisThe software of the Automated Filter Analysis System also offers the option of separating fibers and the remaining particles.
3.9 Metal and non-metal particlesThe software can also distinguish between metal and non-metal particles. This separation of reflecting and non-reflecting particles is achieved with a polarizer/analyzer unit. When using the polarization mode, it is possible to differentiate between reflecting and non-reflecting particles. When the polarizer is in a perpendicular position, all of the particles will be visible as dark objects. The reflected particles become apparent when the polarizer is in the parallel position. Those particles then appear lighter.
3.10 Particle analysis output documents c.7 Standards stipulate binding rules for characterizing residue. Each
standard defines specific criteria for sorting residue particles into classes. Depending on the standard selected, the user gets varying diagrams and sheets with class results.
The most critical output value is the cleanliness code as defined by the standards. After scanning the whole filter a diagram of the cleanliness code is automatically displayed in the document area of the Automated Filter Analysis System software.
A particle result sheet with all parameters specified and needed for standardized inspections is created for every filter inspection, including all residue particles found during the filter inspection. The measured particle parameters are preset and depend on the standard selected. The sheet containing the particle results is linked to the particle map
c.7 Particle analysisThe Automated Filter Analysis System analyzes and classifies in accordance with all established standards
c.7 various output documentsOutput files like e.g. a diagram about the cleanliness and a sheet with the particle analysis results are displayed automatically.
Olympus Automated Filter Analysis System
3. cOntrOL center: tHe SYSteM SOFtwAre
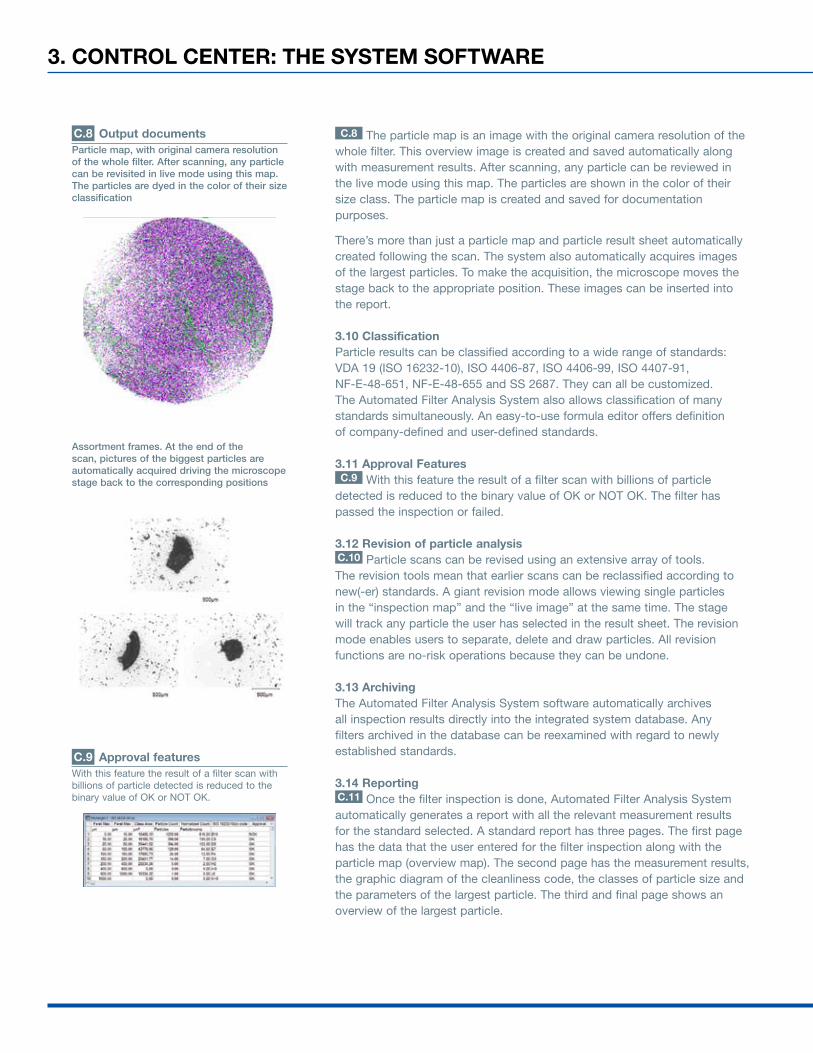
c.8 The particle map is an image with the original camera resolution of the whole filter. This overview image is created and saved automatically along with measurement results. After scanning, any particle can be reviewed in the live mode using this map. The particles are shown in the color of their size class. The particle map is created and saved for documentation purposes.
There’s more than just a particle map and particle result sheet automatically created following the scan. The system also automatically acquires images of the largest particles. To make the acquisition, the microscope moves the stage back to the appropriate position. These images can be inserted into the report.
3.10 classificationParticle results can be classified according to a wide range of standards: VDA 19 (ISO 16232-10), ISO 4406-87, ISO 4406-99, ISO 4407-91, NF-E-48-651, NF-E-48-655 and SS 2687. They can all be customized. The Automated Filter Analysis System also allows classification of many standards simultaneously. An easy-to-use formula editor offers definition of company-defined and user-defined standards.
3.11 Approval Featuresc.9 With this feature the result of a filter scan with billions of particle
detected is reduced to the binary value of OK or NOT OK. The filter has passed the inspection or failed.
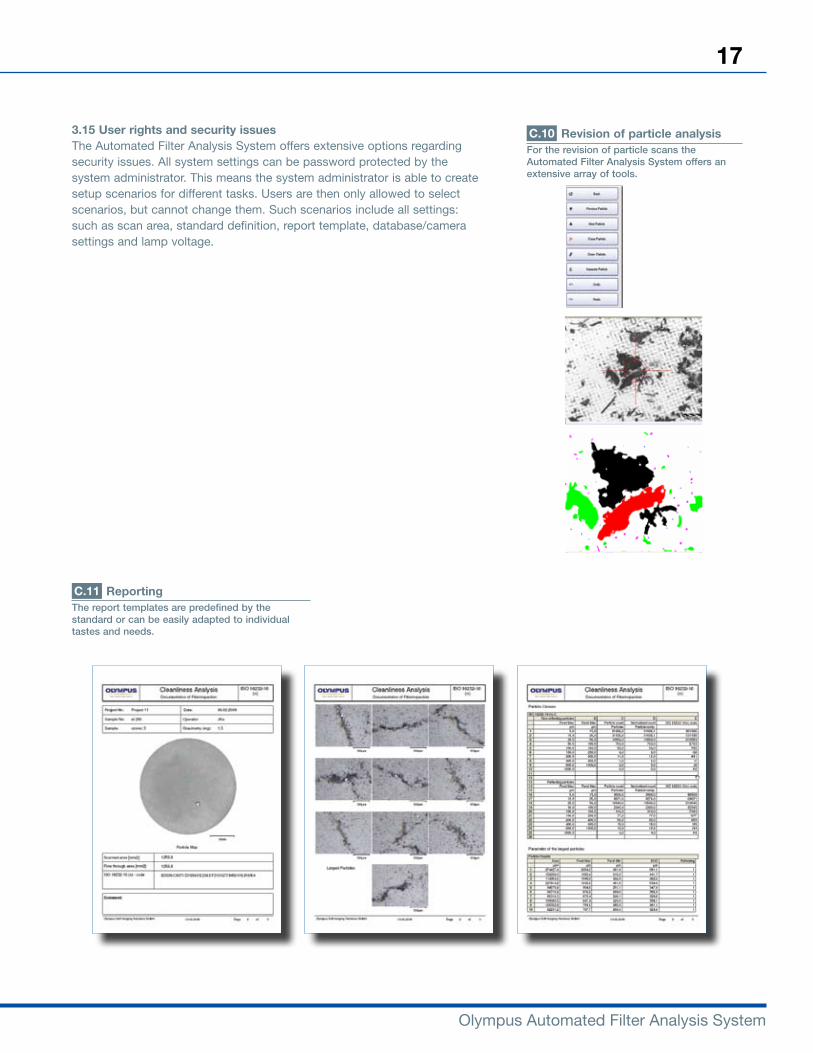
3.12 revision of particle analysisc.10 Particle scans can be revised using an extensive array of tools. The revision tools mean that earlier scans can be reclassified according to new(-er) standards. A giant revision mode allows viewing single particles in the “inspection map” and the “live image” at the same time. The stage will track any particle the user has selected in the result sheet. The revision mode enables users to separate, delete and draw particles. All revision functions are no-risk operations because they can be undone.
3.13 ArchivingThe Automated Filter Analysis System software automatically archives all inspection results directly into the integrated system database. Any filters archived in the database can be reexamined with regard to newly established standards.
3.14 reportingc.11 Once the filter inspection is done, Automated Filter Analysis System automatically generates a report with all the relevant measurement results for the standard selected. A standard report has three pages. The first page has the data that the user entered for the filter inspection along with the particle map (overview map). The second page has the measurement results, the graphic diagram of the cleanliness code, the classes of particle size and the parameters of the largest particle. The third and final page shows an overview of the largest particle.
c.9 Approval featuresWith this feature the result of a filter scan with billions of particle detected is reduced to the binary value of OK or NOT OK.
c.8 Output documentsParticle map, with original camera resolution of the whole filter. After scanning, any particle can be revisited in live mode using this map. The particles are dyed in the color of their size classification
Assortment frames. At the end of the scan, pictures of the biggest particles are automatically acquired driving the microscope stage back to the corresponding positions
Olympus Automated Filter Analysis System
3. cOntrOL center: tHe SYSteM SOFtwAre 17
3.15 User rights and security issuesThe Automated Filter Analysis System offers extensive options regarding security issues. All system settings can be password protected by the system administrator. This means the system administrator is able to create setup scenarios for different tasks. Users are then only allowed to select scenarios, but cannot change them. Such scenarios include all settings: such as scan area, standard definition, report template, database/camera settings and lamp voltage.
c.10 revision of particle analysisFor the revision of particle scans the Automated Filter Analysis System offers an extensive array of tools.
c.11 reportingThe report templates are predefined by the standard or can be easily adapted to individual tastes and needs.
Olympus Automated Filter Analysis System
4. StAndArdS, FUnctIOn LIStS, And SPecIFIcAtIOnS
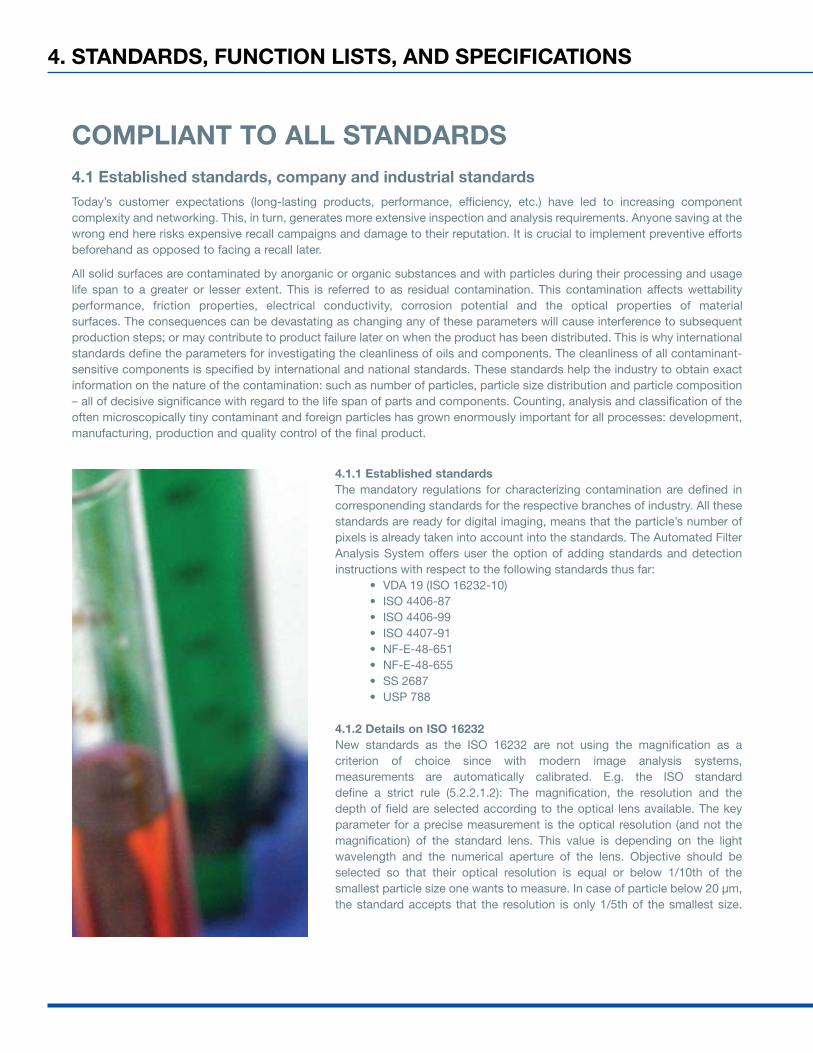
cOMPLIAnt tO ALL StAndArdS4.1 established standards, company and industrial standardsToday’s customer expectations (long-lasting products, performance, efficiency, etc.) have led to increasing component complexity and networking. This, in turn, generates more extensive inspection and analysis requirements. Anyone saving at the wrong end here risks expensive recall campaigns and damage to their reputation. It is crucial to implement preventive efforts beforehand as opposed to facing a recall later.
All solid surfaces are contaminated by anorganic or organic substances and with particles during their processing and usage life span to a greater or lesser extent. This is referred to as residual contamination. This contamination affects wettability performance, friction properties, electrical conductivity, corrosion potential and the optical properties of material surfaces. The consequences can be devastating as changing any of these parameters will cause interference to subsequent production steps; or may contribute to product failure later on when the product has been distributed. This is why international standards define the parameters for investigating the cleanliness of oils and components. The cleanliness of all contaminant-sensitive components is specified by international and national standards. These standards help the industry to obtain exact information on the nature of the contamination: such as number of particles, particle size distribution and particle composition – all of decisive significance with regard to the life span of parts and components. Counting, analysis and classification of the often microscopically tiny contaminant and foreign particles has grown enormously important for all processes: development, manufacturing, production and quality control of the final product.
4.1.1 established standardsThe mandatory regulations for characterizing contamination are defined in corresponending standards for the respective branches of industry. All these standards are ready for digital imaging, means that the particle’s number of pixels is already taken into account into the standards. The Automated Filter Analysis System offers user the option of adding standards and detection instructions with respect to the following standards thus far:
VDA 19 (ISO 16232-10)•ISO 4406-87•ISO 4406-99•ISO 4407-91•NF-E-48-651•NF-E-48-655 •SS 2687•USP 788•
4.1.2 details on ISO 16232New standards as the ISO 16232 are not using the magnification as a criterion of choice since with modern image analysis systems, measurements are automatically calibrated. E.g. the ISO standard define a strict rule (5.2.2.1.2): The magnification, the resolution and the depth of field are selected according to the optical lens available. The key parameter for a precise measurement is the optical resolution (and not the magnification) of the standard lens. This value is depending on the light wavelength and the numerical aperture of the lens. Objective should be selected so that their optical resolution is equal or below 1/10th of the smallest particle size one wants to measure. In case of particle below 20 µm, the standard accepts that the resolution is only 1/5th of the smallest size.
Olympus Automated Filter Analysis System
4. StAndArdS, FUnctIOn LIStS, And SPecIFIcAtIOnS 19
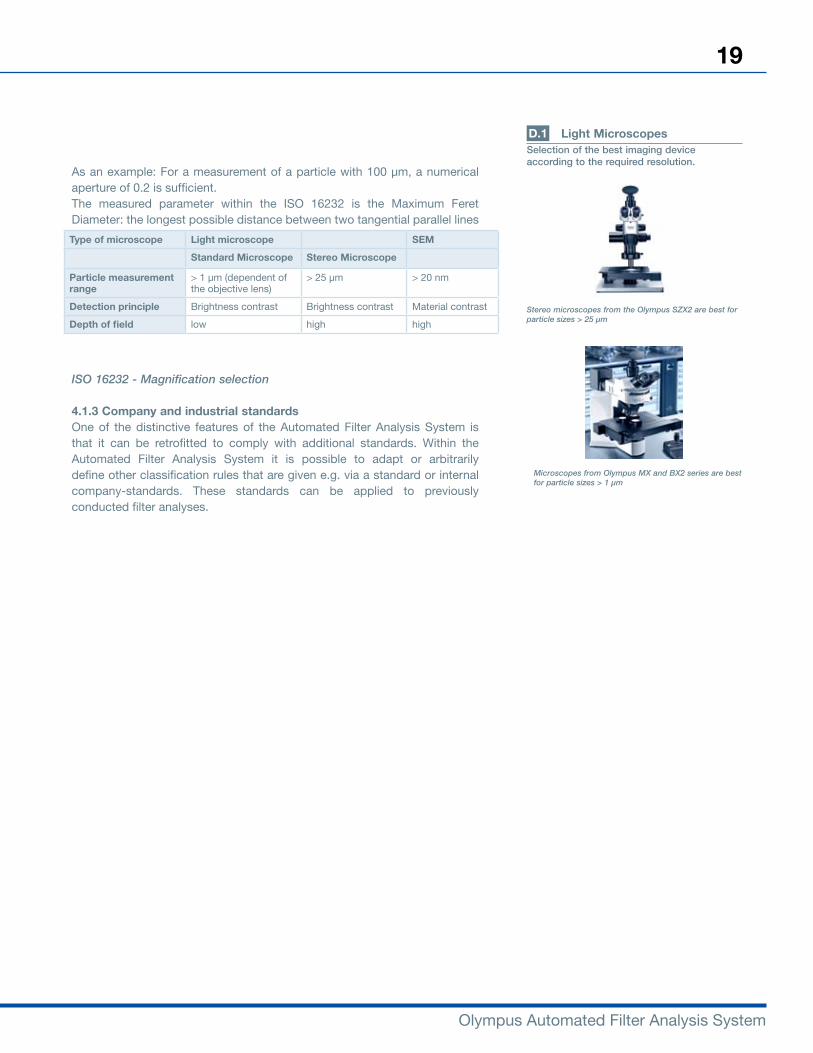
As an example: For a measurement of a particle with 100 µm, a numerical aperture of 0.2 is sufficient.The measured parameter within the ISO 16232 is the Maximum Feret Diameter: the longest possible distance between two tangential parallel lines to the particle.
ISO 16232 - Magnification selection
4.1.3 company and industrial standardsOne of the distinctive features of the Automated Filter Analysis System is that it can be retrofitted to comply with additional standards. Within the Automated Filter Analysis System it is possible to adapt or arbitrarily define other classification rules that are given e.g. via a standard or internal company-standards. These standards can be applied to previously conducted filter analyses.
d.1 Light MicroscopesSelection of the best imaging device according to the required resolution.
Stereo microscopes from the Olympus SZX2 are best for particle sizes > 25 µm
Microscopes from Olympus MX and BX2 series are best for particle sizes > 1 µm
type of microscope Light microscope SeM
Standard Microscope Stereo Microscope
Particle measurement range
> 1 µm (dependent of the objective lens)
> 25 µm > 20 nm
detection principle Brightness contrast Brightness contrast Material contrast
depth of field low high high
Olympus Automated Filter Analysis System
4. StAndArdS, FUnctIOn LIStS, And SPecIFIcAtIOnS
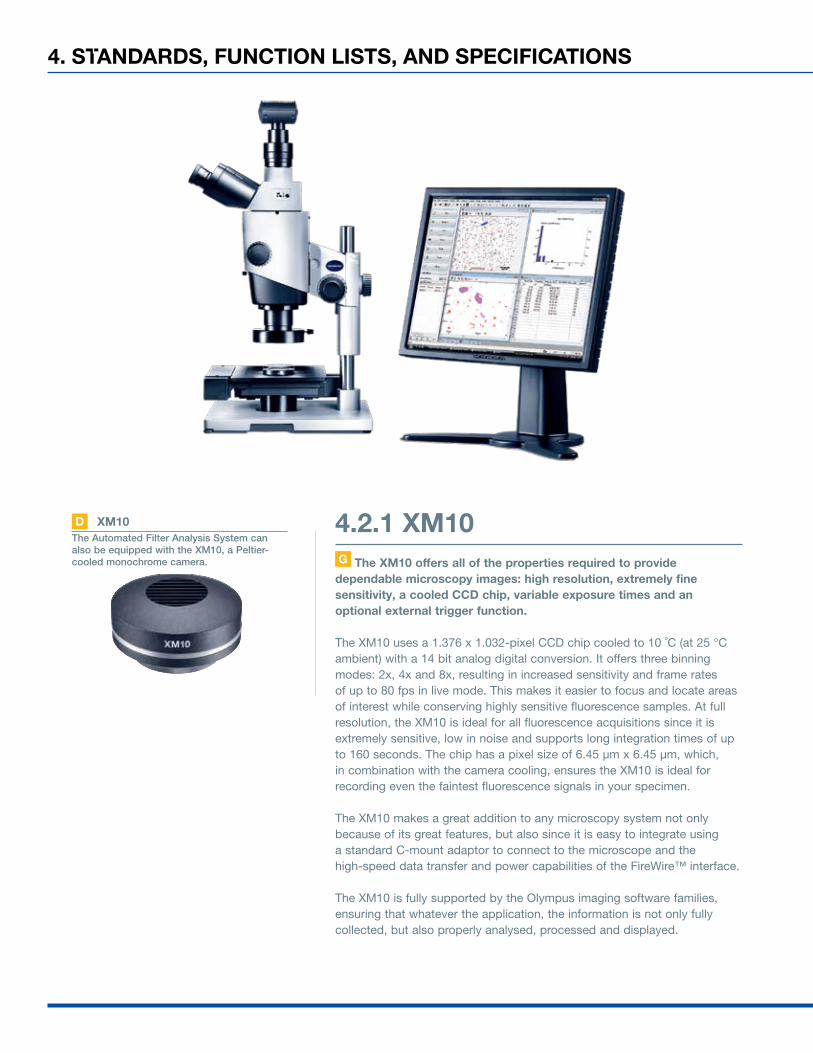
4.2.1 XM10g the XM10 offers all of the properties required to provide
dependable microscopy images: high resolution, extremely fine sensitivity, a cooled ccd chip, variable exposure times and an optional external trigger function.
The XM10 uses a 1.376 x 1.032-pixel CCD chip cooled to 10 ˚C (at 25 °C ambient) with a 14 bit analog digital conversion. It offers three binning modes: 2x, 4x and 8x, resulting in increased sensitivity and frame rates of up to 80 fps in live mode. This makes it easier to focus and locate areas of interest while conserving highly sensitive fluorescence samples. At full resolution, the XM10 is ideal for all fluorescence acquisitions since it is extremely sensitive, low in noise and supports long integration times of up to 160 seconds. The chip has a pixel size of 6.45 µm x 6.45 µm, which, in combination with the camera cooling, ensures the XM10 is ideal for recording even the faintest fluorescence signals in your specimen.
The XM10 makes a great addition to any microscopy system not only because of its great features, but also since it is easy to integrate using a standard C-mount adaptor to connect to the microscope and the high-speed data transfer and power capabilities of the FireWire™ interface.
The XM10 is fully supported by the Olympus imaging software families, ensuring that whatever the application, the information is not only fully collected, but also properly analysed, processed and displayed.
d XM10The Automated Filter Analysis System can also be equipped with the XM10, a Peltier-cooled monochrome camera.
Olympus Automated Filter Analysis System
XM10
Image sensor Monochrome CCD
Sensor type Sony ICX 285 AL
Sensor size 2/3 inches
resolution (max.) 1,376 x 1,032 pixels
Pixel size 6.45 µm x 6.45 µm
binning 2x, 4x, 8x
readout speed 24.5 MHz
Adc*1 14 bit
exposure time 0.1 ms–160 s
Live frame rates*2 25 fps at 688 x 516
50 fps at 344 x 258
25 fps at 172 x 129
80 fps at 172 x 129 pixels
cooling system Peltier 10 °C at 25 °C ambient
readout noise <10 e¯
external trigger Optional
data transfer FireWire™ IEEE 1394a
Otc support*3 Yes
Partial readout Yes
remarks –
remarks –
Operating system Windows XP/Vista
XC10
Image sensor Color CCD
Sensor type Sony ICX 285 AQ
Sensor size 2/3 inches
resolution (max.) 1,376 x 1,032 pixels
Pixel size 6.45 µm x 6.45 µm
binning 2x, 4x
readout speed 20 MHz
Adc*1 3 x 12 bit
exposure time 0.1 ms–160 s
Live frame rates*2 12.4 fps at full resolution
22.9 fps at 2x binning
39.3 fps at 3x binning
cooling system Peltier 10 °C at 25 °C ambient
readout noise <10 e¯
external trigger Optional
data transfer FireWire™ IEEE 1394a
Otc support*3 Yes
Partial readout Yes
remarks –
Operating system Windows XP/Vista
black-and-white cameras Universal cameras
4. StAndArdS, FUnctIOn LIStS, And SPecIFIcAtIOnS 21
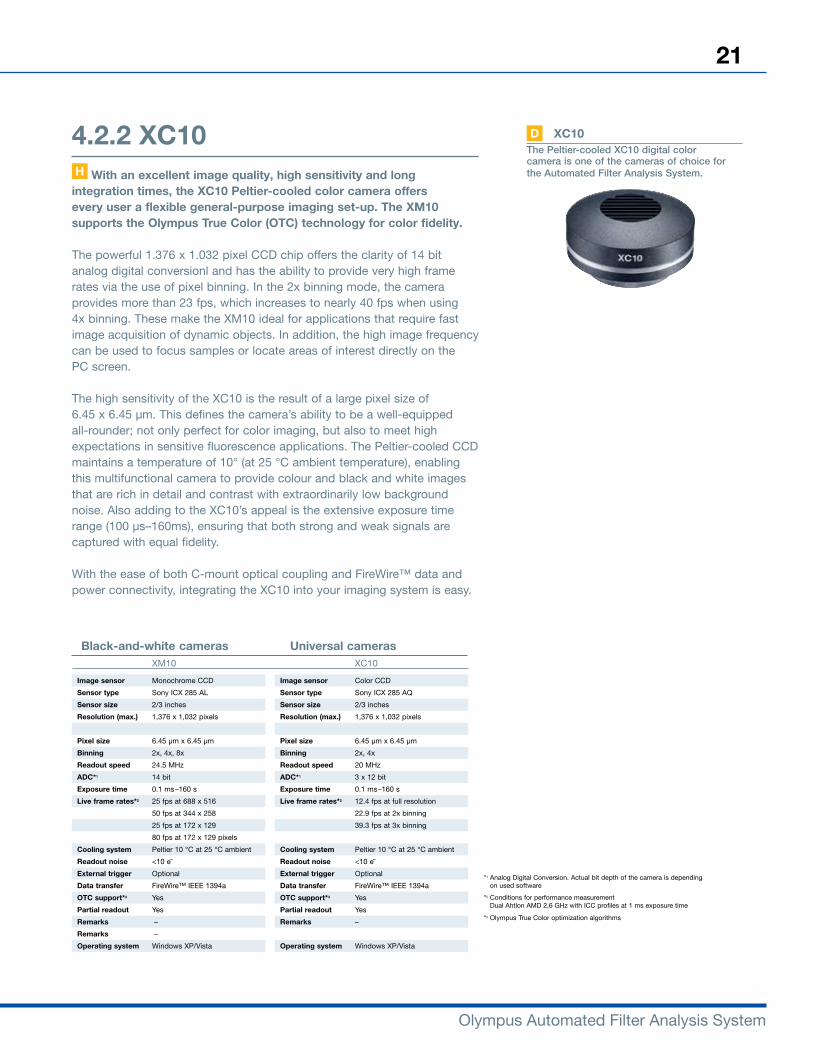
4.2.2 Xc10H with an excellent image quality, high sensitivity and long
integration times, the Xc10 Peltier-cooled color camera offers every user a flexible general-purpose imaging set-up. the XM10 supports the Olympus true color (Otc) technology for color fidelity.
The powerful 1.376 x 1.032 pixel CCD chip offers the clarity of 14 bit analog digital conversionl and has the ability to provide very high frame rates via the use of pixel binning. In the 2x binning mode, the camera provides more than 23 fps, which increases to nearly 40 fps when using 4x binning. These make the XM10 ideal for applications that require fast image acquisition of dynamic objects. In addition, the high image frequency can be used to focus samples or locate areas of interest directly on the PC screen.
The high sensitivity of the XC10 is the result of a large pixel size of 6.45 x 6.45 µm. This defines the camera’s ability to be a well-equipped all-rounder; not only perfect for color imaging, but also to meet high expectations in sensitive fluorescence applications. The Peltier-cooled CCD maintains a temperature of 10° (at 25 °C ambient temperature), enabling this multifunctional camera to provide colour and black and white images that are rich in detail and contrast with extraordinarily low background noise. Also adding to the XC10’s appeal is the extensive exposure time range (100 µs–160ms), ensuring that both strong and weak signals are captured with equal fidelity.
With the ease of both C-mount optical coupling and FireWire™ data and power connectivity, integrating the XC10 into your imaging system is easy.
*1 Analog Digital Conversion. Actual bit depth of the camera is depending on used software
*2 Conditions for performance measurement Dual Ahtlon AMD 2,6 GHz with ICC profiles at 1 ms exposure time
*3 Olympus True Color optimization algorithms
d Xc10The Peltier-cooled XC10 digital color camera is one of the cameras of choice for the Automated Filter Analysis System.
Olympus Automated Filter Analysis System
4. StAndArdS, FUnctIOn LIStS, And SPecIFIcAtIOnS
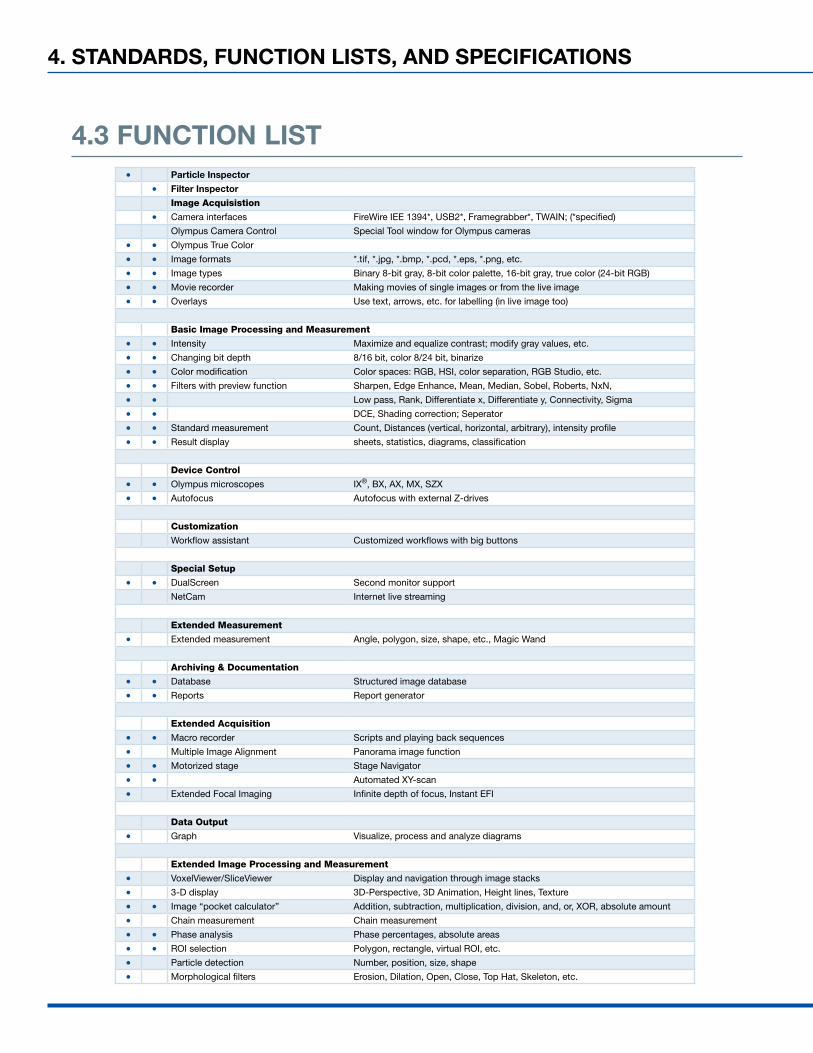
4.3 FUnctIOn LISt• Particle Inspector
• Filter Inspector
Image Acquisistion
• Camera interfaces FireWire IEE 1394*, USB2*, Framegrabber*, TWAIN; (*specified)
Olympus Camera Control Special Tool window for Olympus cameras
• • Olympus True Color
• • Image formats *.tif, *.jpg, *.bmp, *.pcd, *.eps, *.png, etc.
• • Image types Binary 8-bit gray, 8-bit color palette, 16-bit gray, true color (24-bit RGB)
• • Movie recorder Making movies of single images or from the live image
• • Overlays Use text, arrows, etc. for labelling (in live image too)
Basic Image Processing and Measurement
• • Intensity Maximize and equalize contrast; modify gray values, etc.
• • Changing bit depth 8/16 bit, color 8/24 bit, binarize
• • Color modification Color spaces: RGB, HSI, color separation, RGB Studio, etc.
• • Filters with preview function Sharpen, Edge Enhance, Mean, Median, Sobel, Roberts, NxN,
• • Low pass, Rank, Differentiate x, Differentiate y, Connectivity, Sigma
• • DCE, Shading correction; Seperator
• • Standard measurement Count, Distances (vertical, horizontal, arbitrary), intensity profile
• • Result display sheets, statistics, diagrams, classification
Device Control
• • Olympus microscopes IX®, BX, AX, MX, SZX
• • Autofocus Autofocus with external Z-drives
Customization
Workflow assistant Customized workflows with big buttons
Special Setup
• • DualScreen Second monitor support
NetCam Internet live streaming
Extended Measurement
• Extended measurement Angle, polygon, size, shape, etc., Magic Wand
Archiving & Documentation
• • Database Structured image database
• • Reports Report generator
Extended Acquisition
• • Macro recorder Scripts and playing back sequences
• Multiple Image Alignment Panorama image function
• • Motorized stage Stage Navigator
• • Automated XY-scan
• Extended Focal Imaging Infinite depth of focus, Instant EFI
Data Output
• Graph Visualize, process and analyze diagrams
Extended Image Processing and Measurement
• VoxelViewer/SliceViewer Display and navigation through image stacks
• 3-D display 3D-Perspective, 3D Animation, Height lines, Texture
• • Image “pocket calculator” Addition, subtraction, multiplication, division, and, or, XOR, absolute amount
• Chain measurement Chain measurement
• • Phase analysis Phase percentages, absolute areas
• • ROI selection Polygon, rectangle, virtual ROI, etc.
• Particle detection Number, position, size, shape
• Morphological filters Erosion, Dilation, Open, Close, Top Hat, Skeleton, etc.
Olympus Automated Filter Analysis System
4. StAndArdS, FUnctIOn LIStS, And SPecIFIcAtIOnS 23
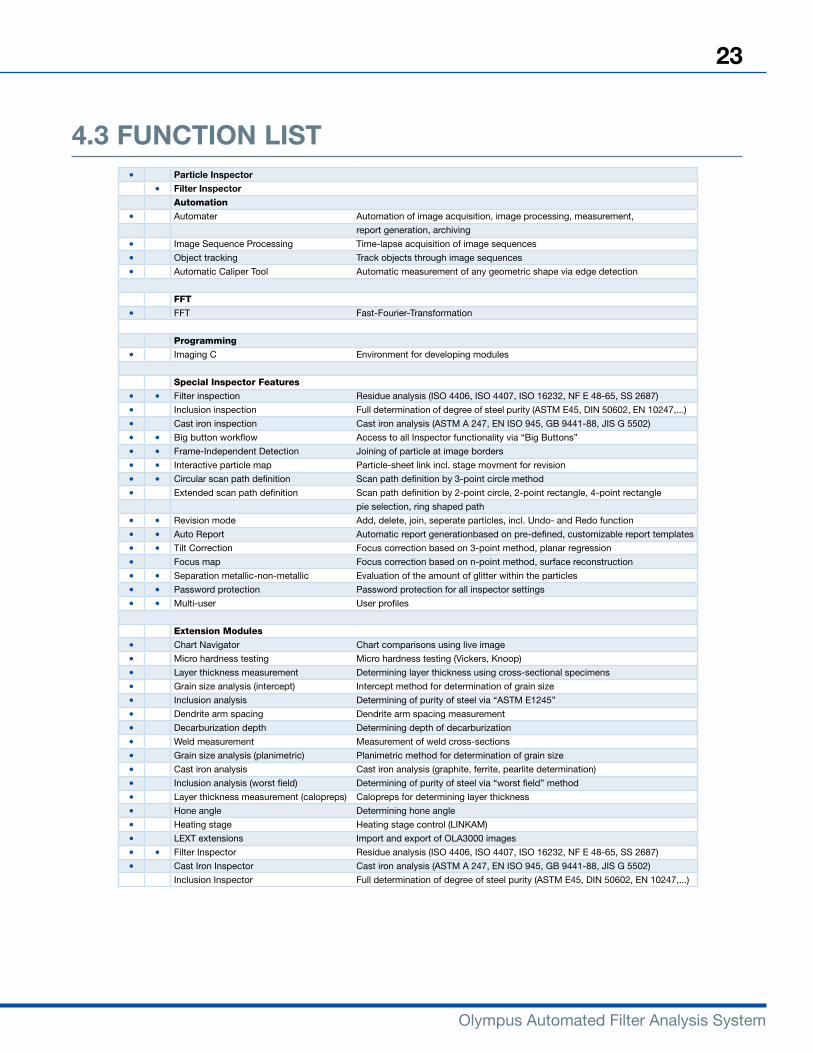
• Particle Inspector
• Filter InspectorAutomation
• Automater Automation of image acquisition, image processing, measurement,
report generation, archiving
• Image Sequence Processing Time-lapse acquisition of image sequences
• Object tracking Track objects through image sequences
• Automatic Caliper Tool Automatic measurement of any geometric shape via edge detection
FFT
• FFT Fast-Fourier-Transformation
Programming
• Imaging C Environment for developing modules
Special Inspector Features
• • Filter inspection Residue analysis (ISO 4406, ISO 4407, ISO 16232, NF E 48-65, SS 2687)
• Inclusion inspection Full determination of degree of steel purity (ASTM E45, DIN 50602, EN 10247,...)
• Cast iron inspection Cast iron analysis (ASTM A 247, EN ISO 945, GB 9441-88, JIS G 5502)
• • Big button workflow Access to all Inspector functionality via “Big Buttons”
• • Frame-Independent Detection Joining of particle at image borders
• • Interactive particle map Particle-sheet link incl. stage movment for revision
• • Circular scan path definition Scan path definition by 3-point circle method
• Extended scan path definition Scan path definition by 2-point circle, 2-point rectangle, 4-point rectangle
pie selection, ring shaped path
• • Revision mode Add, delete, join, seperate particles, incl. Undo- and Redo function
• • Auto Report Automatic report generationbased on pre-defined, customizable report templates
• • Tilt Correction Focus correction based on 3-point method, planar regression
• Focus map Focus correction based on n-point method, surface reconstruction
• • Separation metallic-non-metallic Evaluation of the amount of glitter within the particles
• • Password protection Password protection for all inspector settings
• • Multi-user User profiles
Extension Modules
• Chart Navigator Chart comparisons using live image
• Micro hardness testing Micro hardness testing (Vickers, Knoop)
• Layer thickness measurement Determining layer thickness using cross-sectional specimens
• Grain size analysis (intercept) Intercept method for determination of grain size
• Inclusion analysis Determining of purity of steel via “ASTM E1245”
• Dendrite arm spacing Dendrite arm spacing measurement
• Decarburization depth Determining depth of decarburization
• Weld measurement Measurement of weld cross-sections
• Grain size analysis (planimetric) Planimetric method for determination of grain size
• Cast iron analysis Cast iron analysis (graphite, ferrite, pearlite determination)
• Inclusion analysis (worst field) Determining of purity of steel via “worst field” method
• Layer thickness measurement (calopreps) Calopreps for determining layer thickness
• Hone angle Determining hone angle
• Heating stage Heating stage control (LINKAM)
• LEXT extensions Import and export of OLA3000 images
• • Filter Inspector Residue analysis (ISO 4406, ISO 4407, ISO 16232, NF E 48-65, SS 2687)
• Cast Iron Inspector Cast iron analysis (ASTM A 247, EN ISO 945, GB 9441-88, JIS G 5502)
Inclusion Inspector Full determination of degree of steel purity (ASTM E45, DIN 50602, EN 10247,...)
4.3 FUnctIOn LISt

©2009 Olympus America Inc. All rights reserved. All trademarks are the property of their respective owners.Olympus America Inc. 3500 Corporate ParkwayCenter Valley, PA 18034Phone: 1-800-446-5967 E-mail: [email protected]
FLTR
SY
SB
RO
_09
04
www.olympusamerica.com