Oglesby r 20150708_1730_upmc_jussieu_-_amphi_durand
22
Climate Model Simulation of Present and Future Extreme Events in Latin America and the Caribbean: What Spatial Resolution is Required? R. Oglesby 1,2,3 , C. Rowe 1,3 , and R. Mawalagedara 1,3 1 Department of Earth and Atmospheric Sciences, University of Nebraska, Lincoln 2 School of Natural Resources, University of Nebraska, Lincoln 3 Daugherty Water for Food Institute, University of Nebraska
-
Upload
ingrid-le-ru -
Category
Science
-
view
204 -
download
0
Transcript of Oglesby r 20150708_1730_upmc_jussieu_-_amphi_durand

Climate Model Simulation of Present and Future Extreme Events in Latin America and the Caribbean: What Spatial Resolution is
Required?
R. Oglesby1,2,3, C. Rowe1,3, and R. Mawalagedara1,3
1Department of Earth and Atmospheric Sciences, University of Nebraska, Lincoln
2School of Natural Resources, University of Nebraska, Lincoln 3Daugherty Water for Food Institute, University of Nebraska
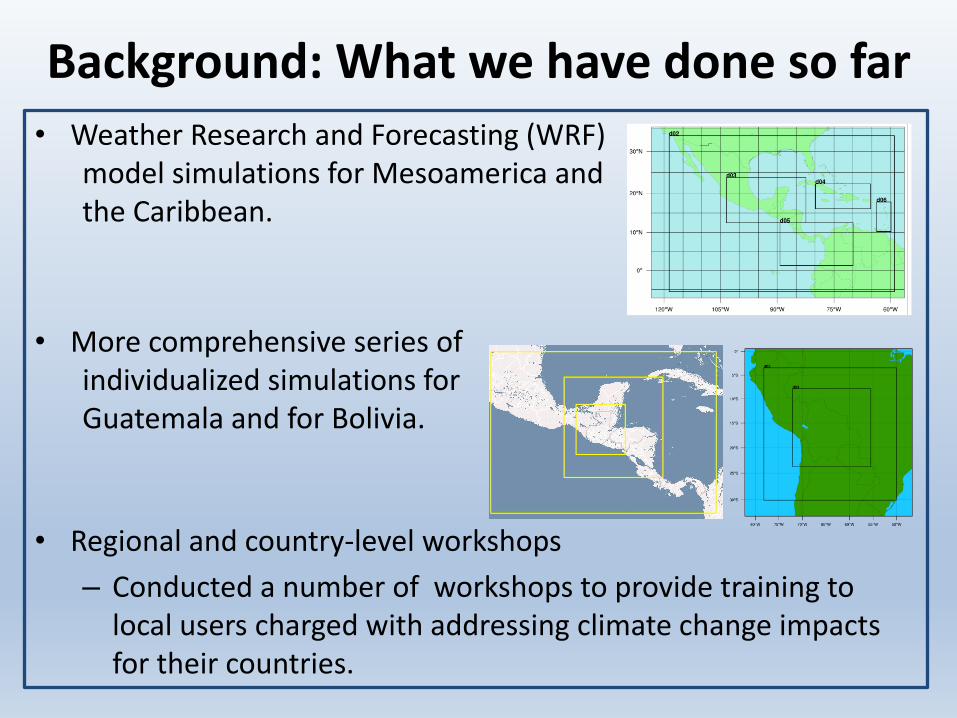
Background: What we have done so far
• Weather Research and Forecasting (WRF) model simulations for Mesoamerica and the Caribbean.
• More comprehensive series of individualized simulations for Guatemala and for Bolivia.
• Regional and country-level workshops
– Conducted a number of workshops to provide training to local users charged with addressing climate change impacts for their countries.

Why Latin America and the Caribbean?
Potential Risks
• Regions potentially at severe risk due to future climate change
• Need for properly resolved
surface climate in the region, due to its complex topography and nearness to oceans
• Existing knowledge gaps in dynamical downscaling
Extreme Events
• Latin America and the Caribbean are regions presently at grave risk to a variety of extreme climate events.
• These include flooding rains, damaging winds, drought, heat waves, and in high elevation mountainous regions, excessive snowfalls.
• Such extreme events are likely to become even worse under projections of future climate changes

Why use a Regional Climate Model?
Our results suggest that for proper simulation of both mean climate and extreme events,
• A spatial resolution of 4 km is required in regions of complex mountainous topography.
• A somewhat coarser resolution of 12 km is adequate in regions without much topographic relief and where differing land cover accounts for most of the spatial heterogeneity.
Leung et al., 2012
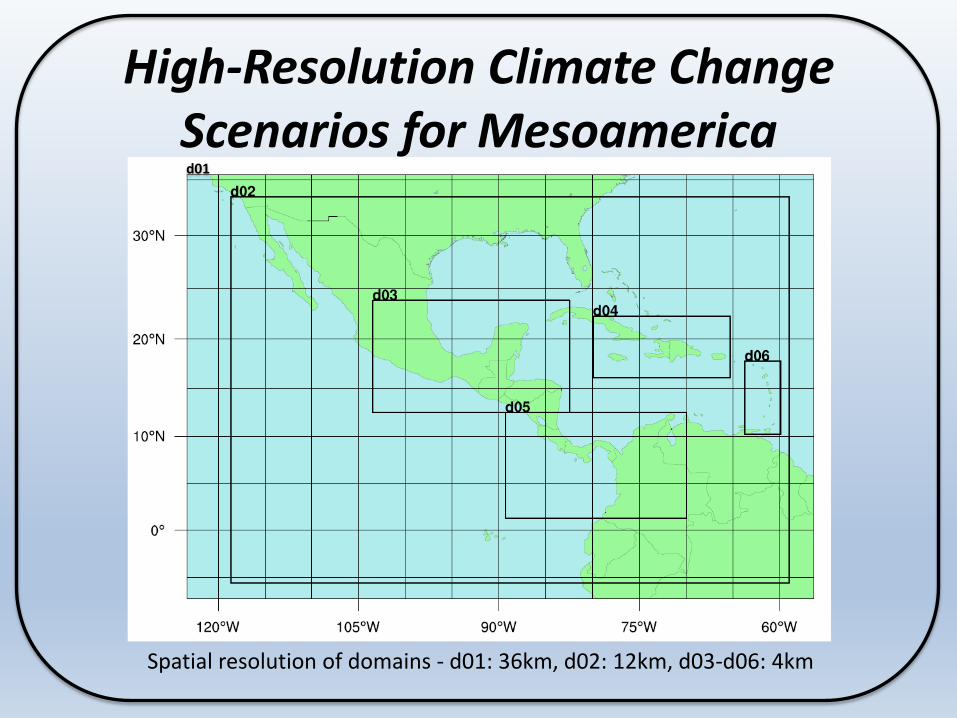
High-Resolution Climate Change Scenarios for Mesoamerica
Spatial resolution of domains - d01: 36km, d02: 12km, d03-d06: 4km
d01
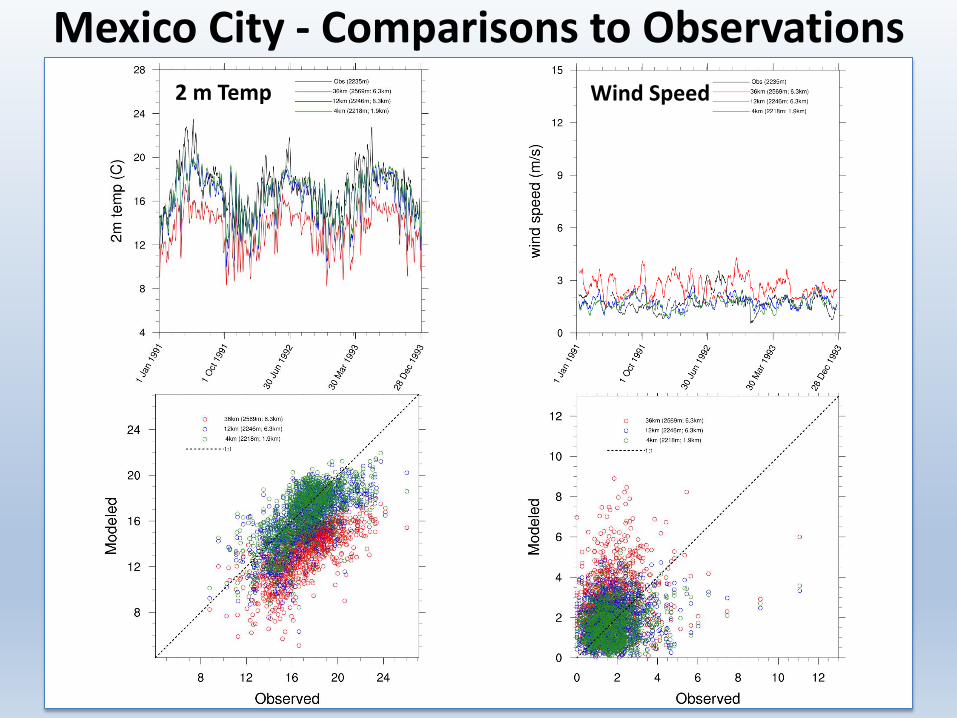
Mexico City - Comparisons to Observations 2 m Temp Wind Speed 2 m Temp
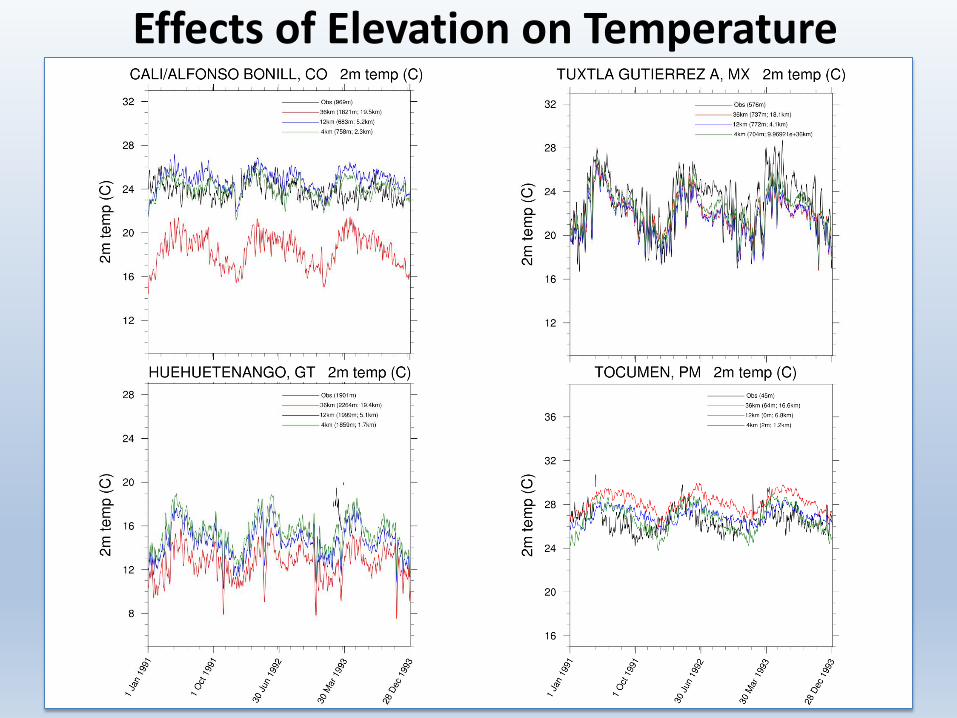
Effects of Elevation on Temperature
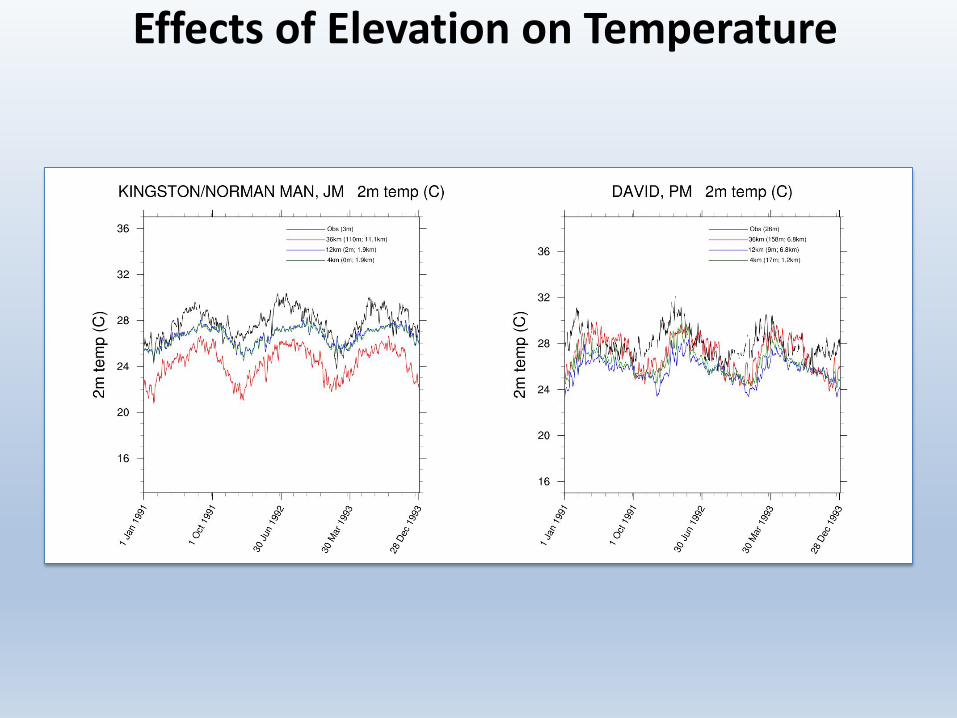
Effects of Elevation on Temperature

GUATEMALA
Spatial resolution of domains - d01: 36km, d02: 12km, d03: 4km
d01
d02
d03
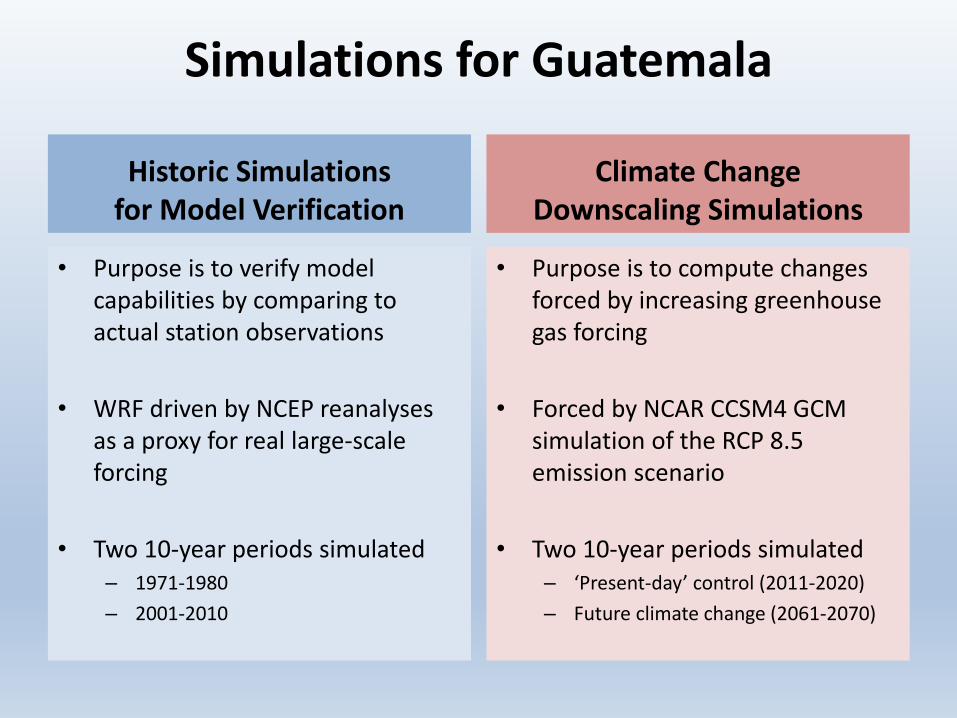
Historic Simulations for Model Verification
• Purpose is to verify model capabilities by comparing to actual station observations
• WRF driven by NCEP reanalyses as a proxy for real large-scale forcing
• Two 10-year periods simulated – 1971-1980
– 2001-2010
Climate Change Downscaling Simulations
• Purpose is to compute changes forced by increasing greenhouse gas forcing
• Forced by NCAR CCSM4 GCM simulation of the RCP 8.5 emission scenario
• Two 10-year periods simulated – ‘Present-day’ control (2011-2020)
– Future climate change (2061-2070)
Simulations for Guatemala

January Temperature
GCM
WRF
Mean Temperature (PD)
Temperature Difference (FT – PD)
PD: 2011-2020 FT: 2061-2070

July Temperature
GCM
WRF
Mean Temperature (PD)
Temperature Difference (FT – PD)
PD: 2011-2020 FT: 2061-2070

January Precipitation
GCM
WRF
Mean Precipitation (PD)
Precipitation Difference (FT – PD)
PD: 2011-2020 FT: 2061-2070
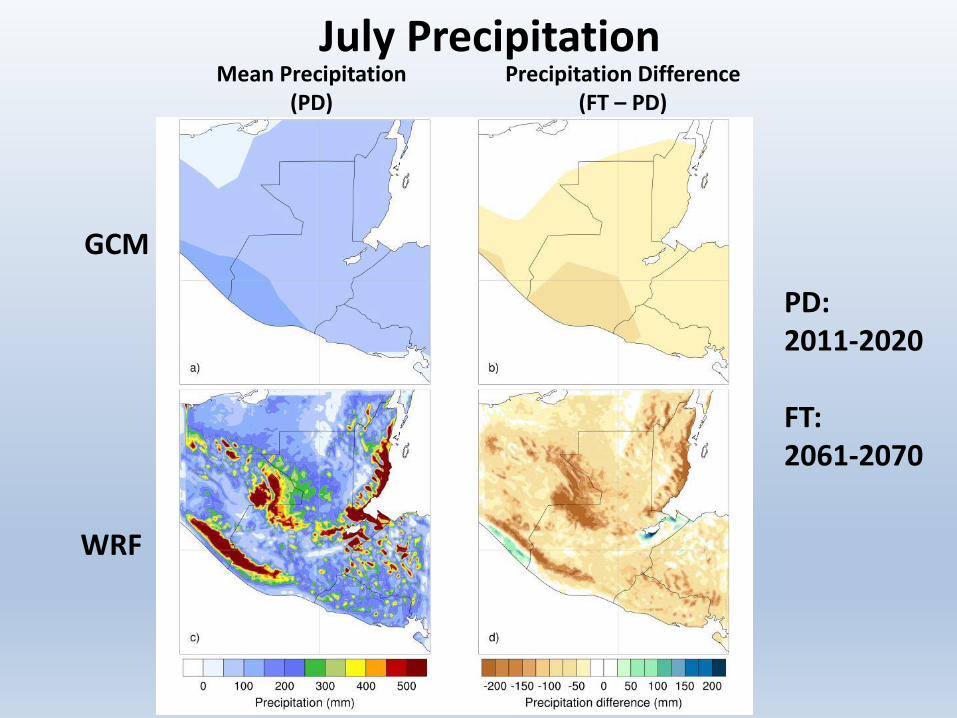
July Precipitation
GCM
WRF
Mean Precipitation (PD)
Precipitation Difference (FT – PD)
PD: 2011-2020 FT: 2061-2070
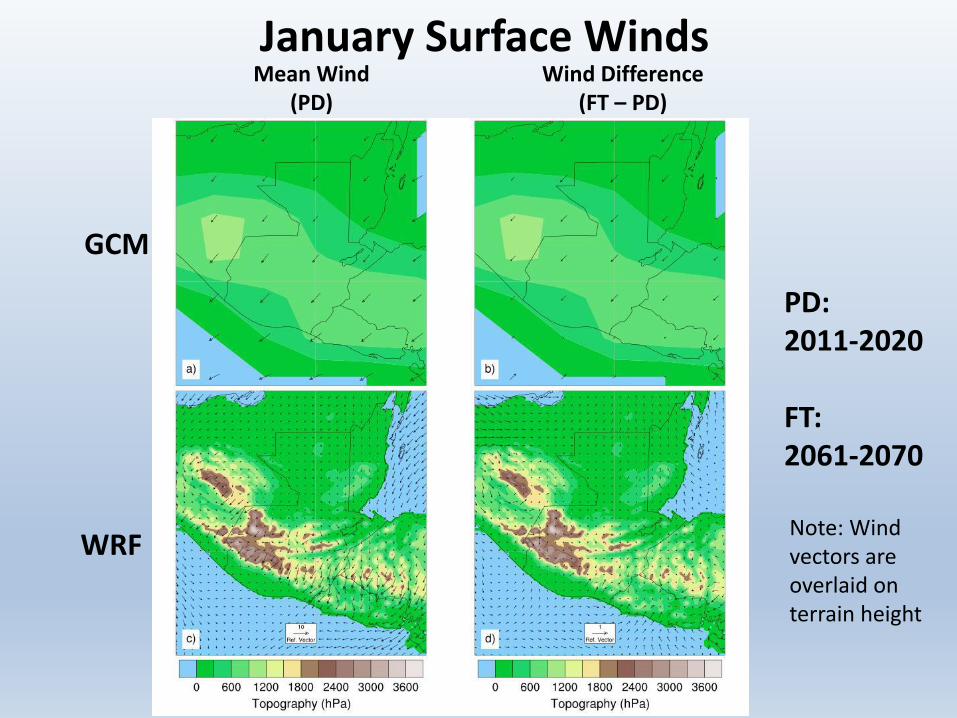
January Surface Winds
GCM
WRF
Mean Wind (PD)
Wind Difference (FT – PD)
PD: 2011-2020 FT: 2061-2070
Note: Wind vectors are overlaid on terrain height
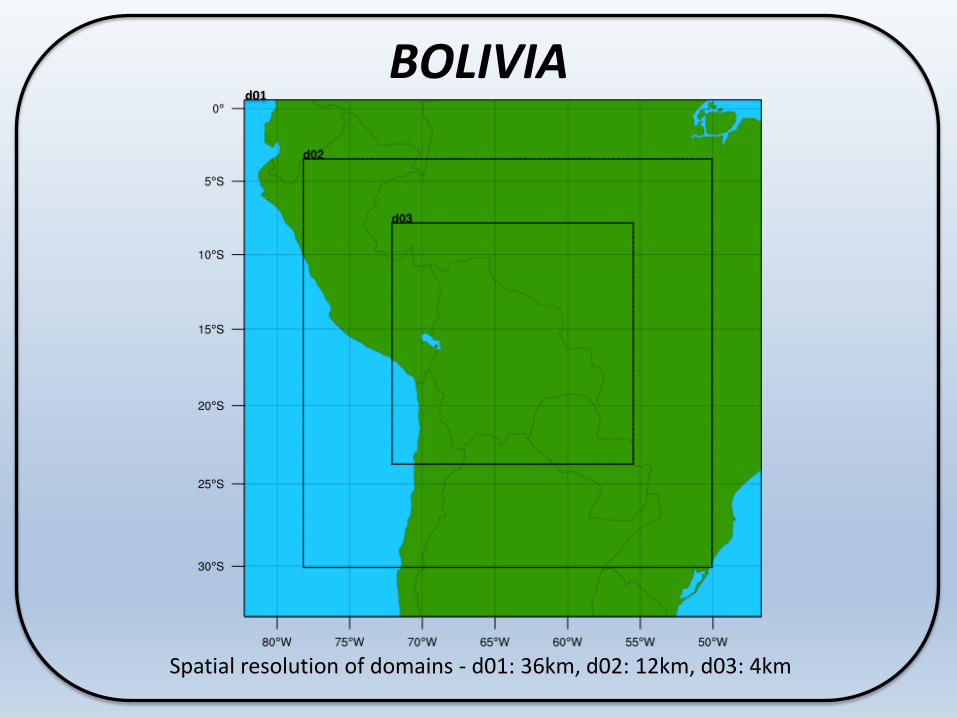
BOLIVIA d01
Spatial resolution of domains - d01: 36km, d02: 12km, d03: 4km
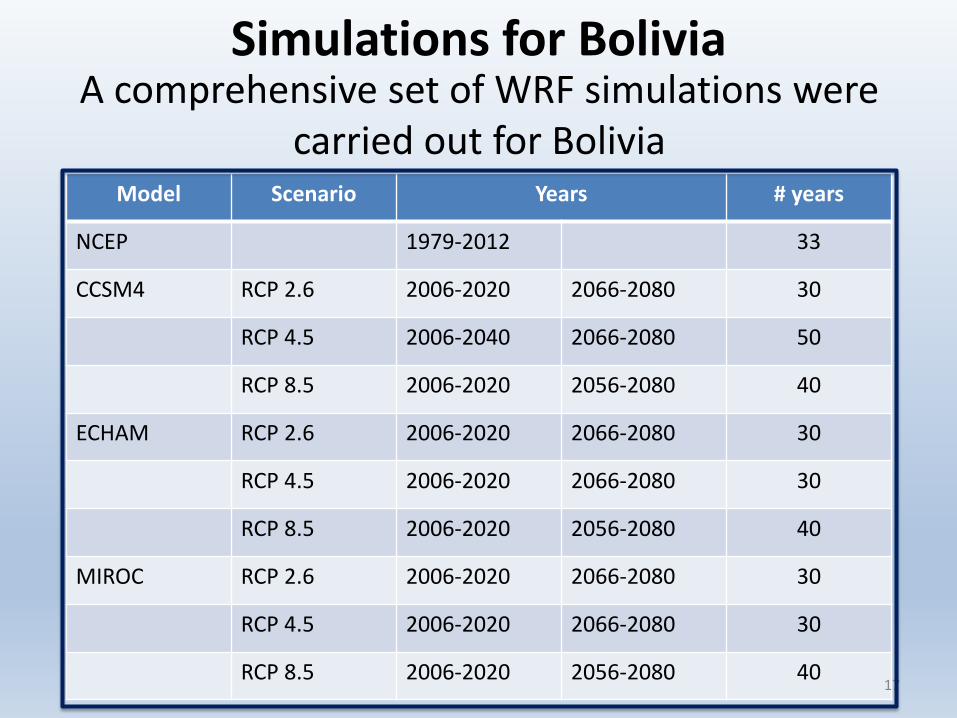
Simulations for Bolivia
Model Scenario Years # years
NCEP 1979-2012 33
CCSM4 RCP 2.6 2006-2020 2066-2080 30
RCP 4.5 2006-2040 2066-2080 50
RCP 8.5 2006-2020 2056-2080 40
ECHAM RCP 2.6 2006-2020 2066-2080 30
RCP 4.5 2006-2020 2066-2080 30
RCP 8.5 2006-2020 2056-2080 40
MIROC RCP 2.6 2006-2020 2066-2080 30
RCP 4.5 2006-2020 2066-2080 30
RCP 8.5 2006-2020 2056-2080 40 17
A comprehensive set of WRF simulations were carried out for Bolivia

Temperature Differences for July Scenario: RCP8.5
Domain Resolution: 4 km Difference = (2066-2075) – (2006-2015)
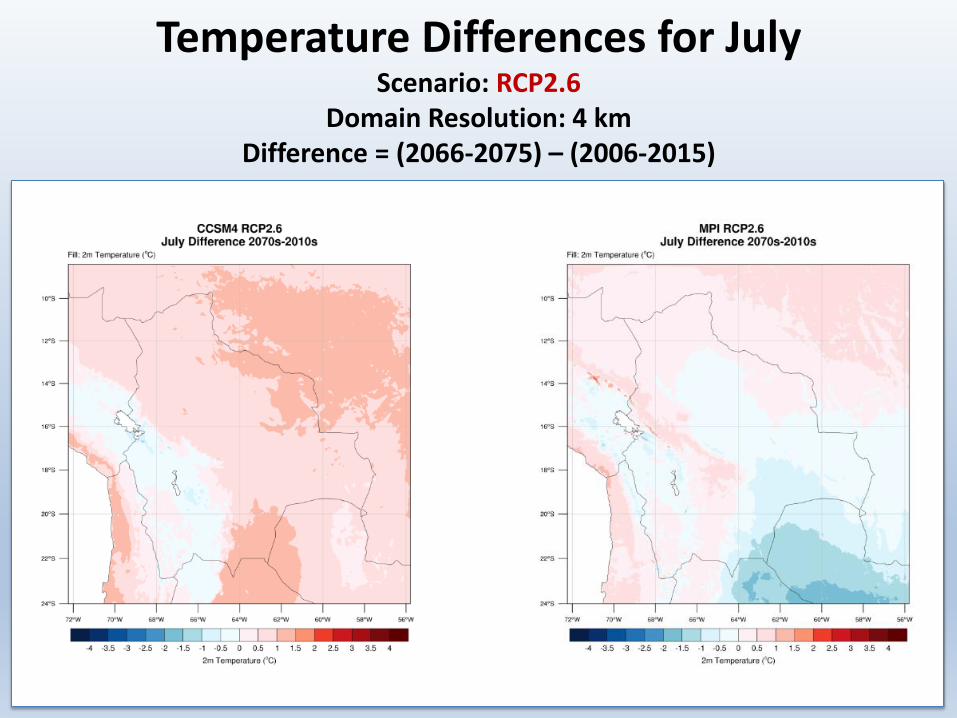
Temperature Differences for July Scenario: RCP2.6
Domain Resolution: 4 km Difference = (2066-2075) – (2006-2015)
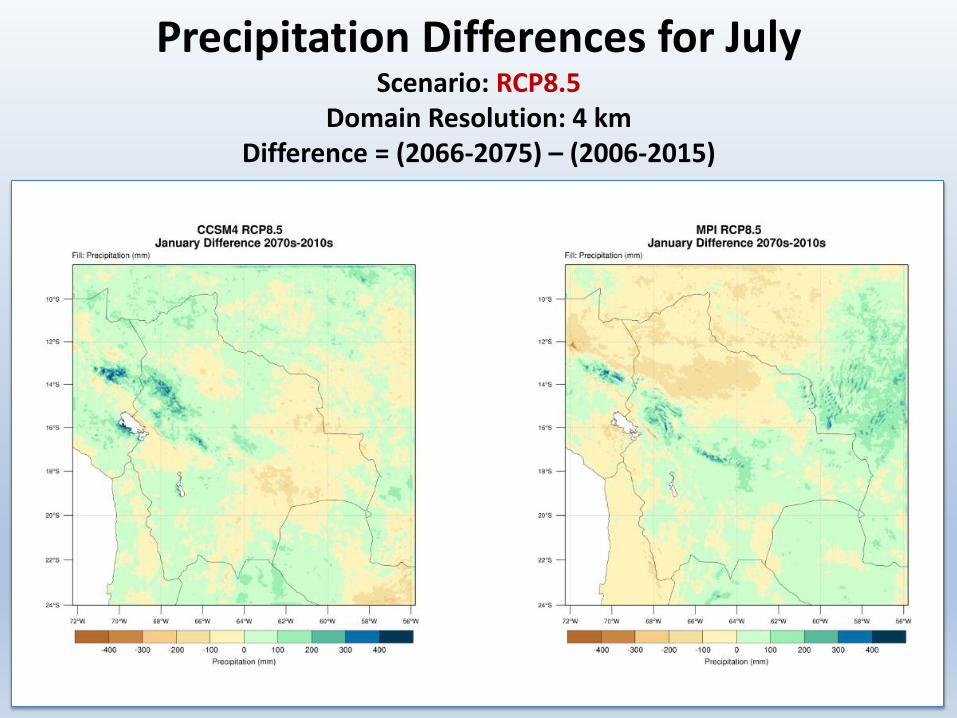
Precipitation Differences for July Scenario: RCP8.5
Domain Resolution: 4 km Difference = (2066-2075) – (2006-2015)
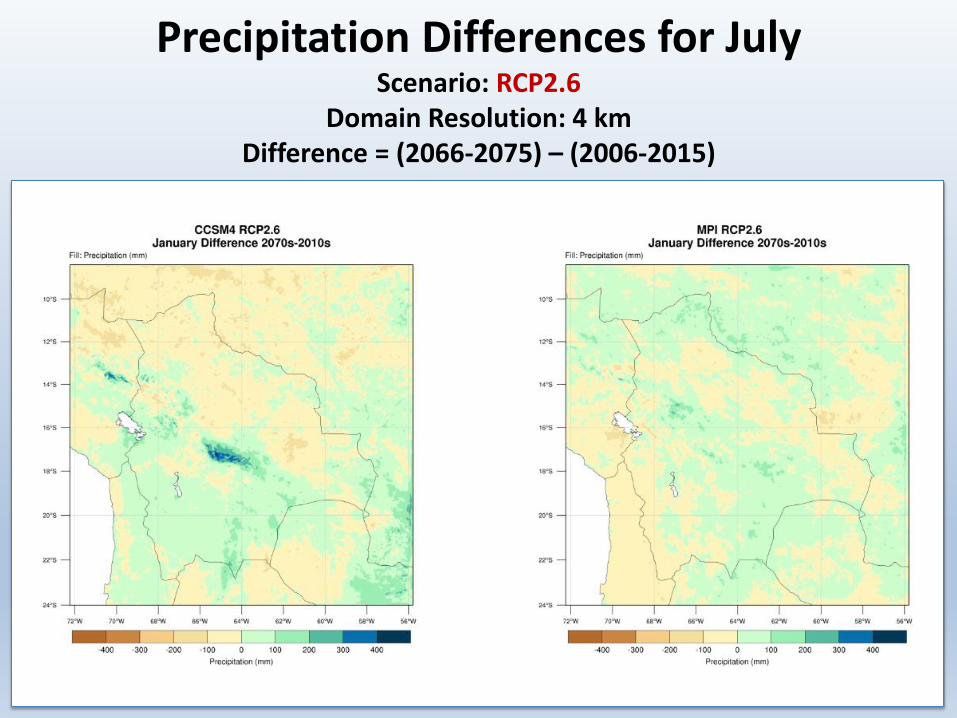
Precipitation Differences for July Scenario: RCP2.6
Domain Resolution: 4 km Difference = (2066-2075) – (2006-2015)
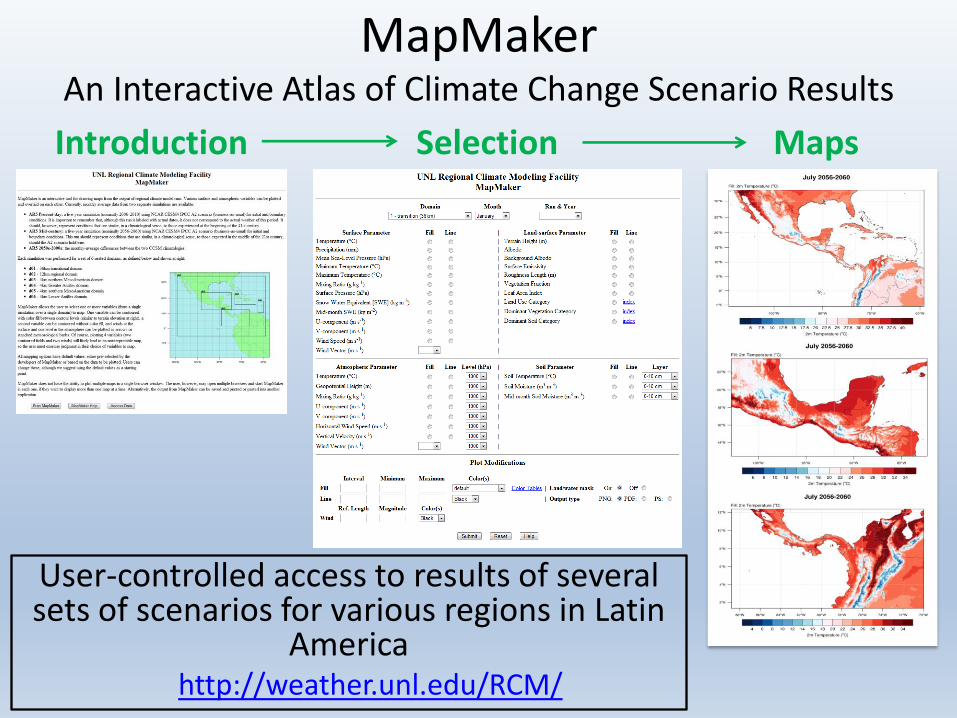
MapMaker An Interactive Atlas of Climate Change Scenario Results
User-controlled access to results of several sets of scenarios for various regions in Latin
America http://weather.unl.edu/RCM/
Introduction Selection Maps