
OFFICE OF THE AUDITOR GENERAL ANNUAL …€¦ · 2.0 PROCUREMENT AND STORAGE OF DRUGS ... UNDAC...
251
THE REPUBLIC OF UGANDA OFFICE OF THE AUDITOR GENERAL ANNUAL REPORT OF THE AUDITOR GENERAL FOR THE YEAR ENDED 30 TH JUNE 2009 VOLUME 5 VALUE FOR MONEY AUDIT
Transcript of OFFICE OF THE AUDITOR GENERAL ANNUAL …€¦ · 2.0 PROCUREMENT AND STORAGE OF DRUGS ... UNDAC...

i
THE REPUBLIC OF UGANDA
OFFICE OF THE AUDITOR GENERAL
ANNUAL REPORT OF THE
AUDITOR GENERAL
FOR THE YEAR ENDED 30TH JUNE 2009
VOLUME 5
VALUE FOR MONEY AUDIT

i ii
TABLE OF CONTENTS Page
LIST OF ABBREVIATIONS …….….……….……………………………………..............……iii
1.0 OVERVIEW ………………….….….……………………………………….….…...............1
1.1 Mandate ………………………………….…………………………………………………………..................1
1.2 Vision …………………………….………….…………………………………………………………...............2
1.3 Scope of Auditor Generals Work in Relation to VFM Audits …………….……….…...............2
1.4 Key issues in this volume ..........………….……………………………………….…………...............3
1.5 VFM audits under progress......................................................................................19
2.0 PROCUREMENT AND STORAGE OF DRUGS BY NATIONAL MEDICAL
STORES ……………….………………………………………………….……...................20
2.1 Introduction ….….……………………………………………………………………………….…..............20
2.2 Findings ……………………………………………………………………………………………..................23
2.3 Conclusions ………………………………………………………………………………………..................45
2.4 Recommendations …………………………………………………………………….……….…...............48
3.0 INSPECTION OF PRIMARY SCHOOLS BY MINISTRY OF EDUCATION
AND SPORTS ……………………………………………………………..………..............54
3.1 Introduction …………………………….…………………………………………………………….............54
3.2 Findings …………………………………….……………………………………………….………...............57
3.3 Conclusions ……………………………….……………………………………………….………................64
3.4 Recommendations ………………………………………………………………………………................66
4.0 PENSION PROCESSING BY THE DEPARTMENT OF COMPENSATION
- MINISTRY OF PUBLIC SERVICE.…………………………………………….............68
4.1 Introduction …………………………………………………………………………………………..............68
4.2 Findings and Conclusions.…………………………………………………………………………............71
4.3 Recommendations ……………………………………………………………………….………….............85
5.0 PROVISION OF BASIC NECESSITIES TO PRISONERS BY UGANDA
PRISONS SERVICE.…………………………………………………………................... 88
5.1 Introduction ………………….………………………………………………………………….…….............88
5.2 Findings ….………………………………………………………………………………………………............92
5.3 Conclusions .……………………………………………………………………………………………......... 114
5.4 Recommendations ……….………………………………………………………………….………..........116
6.0 PROJECT MANAGEMENT: A CASE STUDY ON 8 DEBT FUNDED
PROJECTS ..…………………………………………………………………………..........121
6.1 Introduction ………………………………………………………………………………………...…..........121
ii iii
6.2 Findings .……………………………………………………………………………………………...….........123
6.3 Conclusions ………………………………………………………………………………………….…..........134
6.4 Recommendations ………………………………………………………………..……………..…...........134
7.0 SOLID WASTE MANAGEMENT IN KAMPALA ………………….………...…...........137
7.1 Introduction ….……………………………………………………………………….………………...........137
7.2 Findings ………….……………………………………………………………………….……………............141
7.3 Conclusions ……………………………………………………………………………….……………..........155
7.4 Recommendations ……………………………………………………………………….……….…..........157
8.0 REGULATION AND ENFORCEMENT OF STANDARDS BY UGANDA
NATIONAL BUREAU OF STANDARDS ………………………………………............165
8.1 Introduction ………………………………………………………………………………….…….…..........165
8.2 Findings ………………………………………………………………………………………….….…...........169
8.3 Conclusions ……………………………………………………………………………………………...........178
8.4 Recommendations ……………………………………………………………………………….…...........179
9.0 PASSPORT PROCESSING BY THE PASSPORT CONTROL
DEPARTMENT – MINISTRY OF INTERNAL AFFAIRS …………………….........182
9.1 Introduction …………………………………………………………………………………….…..….........182
9.2 Findings and Conclusions…………………………………………………………………….……..........186
9.3 Recommendations ………………………………………………………………………………..….........198
10.0 NOTHERN UGANDA SOCIAL ACTION FUND – OFFICE OF THE PRIME
MINISTER ……………………………………………………………………..….............200
10.1 Introduction ……………………………………………………………………………………….…............200
10.2 Findings …………………..……………………………………………………………………………...........205
10.3 Conclusions ……………………………………………………..……………………………………...........219
10.4 Recommendations ……………………………………………………………………………….…..........221
11.0 PROCUREMENT AND DISTRIBUTION OF RELIEF ITEMS IN THE
OFFICE OF THE PRIME MINISTER ….…………………………………..……........224
11.1 Introduction ………………………………………………………………………………………..…..........224
11.2 Findings …………………..………………………………………………………………………….…..........228
11.3 Conclusions ……………………………………………………..………………………………….............234
11.4 Recommendations ……………………………………………………………………………….…..........235

iii iiii
LIST OF ABBREVIATIONS
AG Accountant General
AO Accounting Officer
AIDS Acquired Immune Deficiency Syndrome
ADF African Development Fund
AFROSAI–E African Organization of Supreme Audit Institutions (English Speaking)
ALD Aid Liaison Department
AWPBs Annual Work Plan and Budgets
AIA Appropriation in Aid
ASC Assessment Criteria
AU Assessment Unit
AAG Assistant Auditor General
ACI Assistant Chief inspector
AC Assistant Commissioner
ACDMR Assistant Commissioner Disaster Management and Refugees
ACP Assistant Commissioner of Prisons
APCO Assistant Passport Control officer
APO Assistant Programme Officer
AQN Audit Question
AG Auditor General
AMC Average Monthly Consumption
BOU Bank of Uganda
BPAFs Bank Payment Advice Forms
BAT British American Tobacco
BPED Budget Policy and Evaluation Department
BTVET Business Technical Vocational Education Training
CMS Central Medical Stores
CCT Centre Coordinating Tutors
CDC Centre for Disease Control
CAO Chief Administrative Officer
CIA Chief Internal Auditor
CSO Civil Society Organization
C/Comp Commissioner Compensations
CDMR Commissioner Disaster Management and Refugees
CGP Commissioner General of Prisons
C/HRM Commissioner Human Resource Management
CP Commissioner of Prisons
CCS Commitment Control System
CD Committee Draft
CBO Community Based Organization
CD Community Development Initiative
CF Community Facilitator
CPC Community Procurement Committee
CPMC Community Project Management Committee
CRCM Community Reconciliation and Conflict Management
CPG Commuted Pension Gratuity

iv ivi
CP Confidential Personal
CS Corporation Secretary
COSMA Cost and Stock management Accountant
CPIA Country Policy and Institutional Assessment
DMFAS Debt Management and Financial Analysis Management System
DSA Debt Sustainability Analysis
DDMR Department of Disaster Management and Refugees
DCGP Deputy Commissioner General of Prisons
DC Development Communication
DFA Director Finance and Administration
DOP Director of Programme
DOS Director of Systems
DB Directorate of Budget
DCIC Directorate of Citizenship and Immigration Control
DEA Directorate of Economic Affairs
DES Directorate of Education Standards
DPP Directorate of Public Prosecution
DMO Disaster Management Officer
DCO District Commercial Officer
DDHS District Director of Health Services
DDMC District Disaster Management Committee
DED District Education Directorates
DEO District Education Officer
DEC District Executive Committee
DIS District Inspector of Schools
DISO District Internal Security Officer
DPU District Planning Unit
DSC District Sectoral Committee
DTPC District Technical Planning Committee
DHI Division Health Inspector
DMO Division Medical Officer
DUS Draft Uganda Standard
ESA Education Standards Agency
EFT Electronic Funds Transfer
EMHS Essential Medicines and Health supplies
EMLU Essential Medicines list for Uganda
EIB European Investment Bank
ED Executive Director
EDS External Debt Strategy
FDUS Final Draft Uganda Standard
F&A Finance and Administration
FMR Financial Management Report
FMSD Financial Management Services Department
FY Financial Year
GM General Manager
GTZ Germany Technical Cooperation
GF Global Fund
GRN Goods Received Note

v vi
GOU Government of Uganda
Gms Grams
GDP Gross Domestic Product
HFA Head of Finance and Accounts
HOP Head of Procurement
HOSAM Head of sales and Marketing
HOSAO Head of stores and operations
HPS Head of the Public Service
HQs Headquarters
HoDs Heads of Departments
HC Health Centre
HMIS Health Management Information System
HIPC Heavily Indebted Poor Country
H Hospitals
HIV Human Immunodeficiency Virus
HR Human Resource
HRM Human Resource Management
ICT Information and Communication Technology
IT Information Technology
I&IA Inspectorate and Internal Audit Department
ID Institutional Development
IFMS Integrated Financial Management System
IPPS Integrated Personnel and Payroll System
IAA Internal Audit Assistant
ICD Internal Container Depot
IDPs Internally Displaced Persons
ICRC International Committee for the Red Cross
IDA International Development Association
IFAD International Fund for Agricultural Development
IMF International Monitory Fund
INTOSAI International Organisation of Supreme Audit Institutions
ISO International Organization for Standardization
JMS Joint Medical stores
JLOS Justice Law and Order Sector
KCC Kampala City Council
KIIDP Kampala Institutional and Infrastructure Development project
Kgs Kilograms
LEP& TB Leprosy and Tuberculosis
LO Liaison Officer
LA Local Authorities
LCs Local Councils
LPO’s Local Purchase Orders
LIC Low Income Country
MIS Management Information System.
MO Medical Officer
MPs Members of Parliament
MOU Memorandum of Understanding
MOSRDP&R Minister of State for Relief, Disaster Preparedness and Refugees

vi vii
MoES Ministry of Education and Sports
MOFPED Ministry of Finance Planning and Economic Development
MoH Ministry of Housing
MIA Ministry of Internal Affairs
MOLG Ministry of Local Government
MoPS Ministry of Public Service
MoTTI Ministry of Tourism, trade and Industry.
MoW Ministry of works
MCPC Monetary and Credit Policy Committee
M&E Monitoring and Evaluation
MDRI Multi-lateral Debt Relief Initiative
MLIS Multiple Layer Infilling System
MC Municipal Council
NDA National Drug Authority
NDP National Drug Policy
NEMA National Environmental Management Authority
NIMES National Integrated Monitoring & Evaluation System
NMS National Medical Stores
NPA National Planning Authority
NSC National Standards Council
NSC National Steering Committee
NS Native Service
NPV Net Present Value
NWIP New Work Item Proposal
NGO Non-Governmental Organisations
NURP Northern Uganda Reconstruction Program
NUSAF Northern Uganda Social Action Fund
NDTO NUSAF District Technical Officer
NUMU NUSAF Management Unit.
OAG Office of the Auditor General
OPM Office of the Prime Minister
O/C or OC Officer in Charge
PRA Participatory Rural Appraisal
PCO Passport Control Officer
PIMS Pensions Information Management System
PVU Pensions Verification Unit
PS Permanent Secretary
PAF Poverty Action Fund
PEAP Poverty Eradication Action Plan
PIVOC Pre-Inspection Verification Of Conformity
P&PE Primary and Pre primary Education
PHC Primary Health Care
PA/Comp Principal Accountant Compensation
PAS Principal Assistant Secretary
PATCs Principal Assistant Town Clerks
PDMO Principal Disaster Management Officer
PPO Principal Personnel Officer
PProcO Principal Procurement Officer

vii viii
PDU Procurement and Disposal Unit
PO Procurement Officer
PO Programme Officer
PIUs Project Implementation Units
PFAA Public Finance and Accountability Act
PO Public Officer
PPPs Public Private Partnerships
PPDA Public Procurement and Disposal of Public Assets Authority
PSRP Public Service Reform Program
QAO Quality Assurance Officer
RIM Records and Information management
RPC Regional Prisons Commander
RFP Request for Proposals
RDCs Resident District Commissioners
RO Retiring Officer
RSISTAP Road Sector Institutional Support and Technical Assistance
SMC School Management Committee
SEC Secondary Education
ST Secretary to the Treasury
SWG Sector Working Group
SAS Senior Assistant Secretary
SATC Senior Assistant Town Clerk
SI Senior Inspector
SPATC Senior Principal Assistant own Clerk
SSP Senior Superintendent of Prisons
SSO Senior Supplies Officer
STI sexually transmitted diseases
SMS Short Messages
SWM Solid Waste Management
SWMS Solid Waste Management Strategy
SANAS South African National Accreditation Scheme
SNE Special Needs Education
SA Stores Assistant
SMO Stores management Officer
SIP-II Strategic Investment Plan II 2006/07 – 2010/11
SC Sub Committee
SCDMC Sub-County Disaster Management Committee
STPC Sub-county Technical Planning Committee
TBT Technical Barriers to Trade
TC Technical Committee
TE Technical Education
TC Town Clerk
TAIs Treasury Accounting Instructions
TSD Treasury Services Department
TB Tuberculosis
AIDSCO Uganda Aids Commission
UHRC Uganda Human Rights Commission
UNBS Uganda National Bureau of Standards

viii viiii
UPS Uganda Prisons Service
URA Uganda Revenue Authority
Ug. Shs Uganda Shillings
Shs Uganda Shillings
US Uganda Standard
UGX Ugandan Shilling Currency
UN United Nations
UNCTAD United Nations Conference on Trade and Development
UNDAC United Nations Disaster Assessment and Coordination
UNFPA United Nations Fund for Population activities
UNHCR United Nations High Commission for Refugees
UNOCHA United Nations Office of the Commissioner for Humanitarian Assistance
USAID United States Aid
US$ United States Dollars
VFM Value for Money
VDMC Village Disaster Management Committee
VGS Vulnerable Group Support.
WAM Weighted Average Maturity
WD Working Draft
WG Working Group
WHO World Health Organization
WTO World Trade Organization

1
1 OVERVIEW
This Volume contains summarized reports of 10 Value for Money (VFM) audit detailing
findings, conclusions and recommendations made for each of the VFM studies. The detailed
reports have been separately issued and copies are on the website (www.oag.go.ug) and can
also be availed upon request, from the Office of the Auditor General.
1.1 MANDATE
The 1995 Constitution of the Republic of Uganda and the National Audit Act, 2008 require the
Auditor General to undertake Financial and Value for Money Audits and report to Parliament as
set below:
The Constitutional provisions are as follows: -
1.1.1 Article 163 (3) of the Constitution requires the Auditor General to:
(a) Audit and report on the public accounts of Uganda and of all public offices including the
courts, the central and local government administrations, universities and public
institutions of like nature, and any public corporation or other bodies or organizations
established by an Act of Parliament; and
(b) Conduct Financial and Value for Money audits in respect of any project involving public
funds.
1.1.2 Under Article 163 (4) the Auditor General is required to submit to Parliament annually a report
of the accounts audited by him or her or under clause (3) of this article.
1.1.3 The National Audit Act, 2008 (NAA)
The NAA under section 21 gives powers to the Auditor General to carry out Value for Money
audits for purposes of establishing economy, efficiency and effectiveness of the operations of
any department or Ministry, Local Government Councils, and any Public organization.

2
1.2 VISION, MISSION AND CORE VALUES:
1.2.1 Vision
The vision of the office of the Auditor General is “To be an Effective and Efficient
Supreme Audit Institution (SAI) in promoting public Accountability in the use of
Resources in the enhancement of good governance”.
1.2.2 Mission
The mission of the office of the Auditor General is “To audit and report to the Public and
there be make an effective contribution in improving public accountability”.
1.2.3 Core Values
The office of the Auditor General is run on three (3) specific core values which motivate and
guide staff in their endeavours to achieve the vision and mission of the office. These core
values are:-
Integrity
Objectivity and
Professional Competence
1.3 SCOPE OF AUDITOR GENERAL‟S WORK IN RELATION TO VFM AUDITS
1.3.1 The Audit
A VFM audit is an examination which provides an objective and constructive assessment of the
extent to which the audited body has used its resources in carrying out its responsibilities with
due regard to economy, efficiency and effectiveness. VFM audits endeavour to evaluate if
activities, programmes or projects involving public funds in Ministries, departments, local
government councils and any public organizations have been managed with respect to
economy, efficiency and effectiveness and the extent to which they might have not been met.
Economy, efficiency and effectiveness can be defined as follows:-
Economy – Minimizing the cost of resources used for an activity, having regard to
appropriate quality.

3
Efficiency – The relationship between the outputs, in terms of goods, services and
results, and the resources used to produce them.
Effectiveness – The extent to which objectives are achieved and the relationship
between the intended impact and the actual impact of an activity.
Value for Money audits are conducted in accordance with International Organization of
Supreme Audit Institutions (INTOSAI) standards. Those standards require that a performance
audit should be planned, conducted and reported on in a manner, which ensures that an audit
of high quality is carried out in an economic, efficient and effective way and in a timely
manner.
In carrying out such an audit, the Auditor takes an in-depth look at the way a particular
Ministry, Project or Public Institution has planned the task undertaken and whether good
management practices and sound judgment were applied.
A VFM audit attempts to determine if the initial objectives set at the beginning of an
undertaking were achieved. As a consequence of that, it is deduced as to whether due regard
for efficiency, effectiveness and economy is present and recommendations for improvement
are made in those areas where it is felt that deficiencies have occurred.
1.4 KEY ISSUES IN THIS VOLUME:
1.4.1 Procurement and storage of Drugs by National Medical Stores:
The main findings of the study are:
i. NMS stocks drugs without regard to buffer stock levels resulting in certain drugs being in
excess of the one year’s requirement while others are under-stocked. There were huge
stocks of expired drugs within the stores of NMS. This was due to NMS’ inability to use
the appropriate data to plan and procure the right types and quantities of drugs to meet
customer requirements.
ii. Despite the requirement to destroy expired drugs within six months after write off, there
were expired drugs at both NMS premises and Health centres countrywide which
remained undestroyed for an average period of six (6) years. Drugs which expired in the

4
NMS premises’, were a result of excess stocking of slow moving drugs procured by NMS
and third parties. The causes of non prompt destruction of expired drugs in public health
units were due to: lack of capacity of health units to individually dispose expired drugs
because of strict environmental compliance requirements, lack of clarity on the
responsible Authority for destruction of expiries in health facilities country wide, logistical
difficulty in accessing the only facility in the country which was located in Nakasongola
and the high cost of destruction per ton of drugs. There are also no clear guidelines and
criteria designed to ensure drugs that expired in the up country health centres were
retrieved for destruction.
iii. Although NMS is mandated to supply drugs and medical supplies to all public heath
services,it was noted that, in a number of cases, NMS did not supply drugs and medical
supplies to meet Public health units’ needs as per their orders. This was because of NMS’
inability to use the appropriate data to plan and procure the right types and quantities of
drugs to meet customer requirements.
iv. NMS did not maintain proper procurement plans in accordance with the stock
replenishment policy, and used unreliable Average Monthly Consumption (AMC) data.
v. NMS carries out needs assessments but uses data based on actual AMC sales for the
previous six months’ which excludes customer orders that are not honored resulting in
improper projections of drugs to procure.
vi. NMS received stores and distributed drugs procured by third parties but the MOUs
signed by both parties lacked clear terms of coordination related to joint procurement
planning leading to duplicated procurement of the drugs.
vii. NMS did not have a clearly spelt out policy on the standard time it should take to process
a customer order from receipt to delivery at customers’ District or self pick at NMS
premises. As a result of this it took 31 days to deliver the customer orders.

5
1.4.2 Inspection of Primary Schools by Ministry of Education and Sports:
i. Legal Mandate of ESA:
ESA did not have an enabling legal framework approved by an Act of Parliament but
operated under a cabinet directive. In the absence of a strong legal framework ESA
could not perform as an independent arm of Government.
However, the Education Act, 2008 transformed ESA into a Directorate of Education
Standards in MOES; with this Act in place, the legal status of DES was now defined and
clear.
ii. Staffing levels:
The Directorate had a staffing level of only 46% of the approved establishment. The
problem of understaffing was caused by the inability of ESA to motivate and retain its
staff. The resultant high “inspector – school” ratio at the national and regional levels
made it practically impossible for ESA inspectors to regularly inspect all the schools,
monitor and coordinate the district inspections.
iii. Inspections:
It was noted that schools were not regularly inspected. This was attributed to low
staffing levels of inspectors, inadequate supervision and monitoring of inspectors and
inadequate provision of logistics to carry out inspections. This resulted into laxity in
attendance by both teachers and pupils which resulted in high absenteeism among the
teachers and pupils, conflicts in schools, teachers’ underperformance and low syllabus
coverage hence poor performance in schools.
iv. Dissemination of Inspection findings and reporting frequency:
Districts and municipalities did not adequately prepare annual and quarterly reports on
inspections carried out. This was attributed to Inspectors’ failure to carry out any
inspections thus making it impossible to prepare reports and lack of awareness on the
requirement to prepare these reports. In the absence of these reports, MOES formulated
policies on schools without adequate information from the majority of them.

6
v. School Improvement Plan
None of the schools visited had prepared a School Improvement Plan. It is the
responsibility of the CAO, DEO, CCT, in liaison with DIS and Head teachers to assist
schools in developing and implementing improvement plans aimed at addressing issues
raised in the inspection report. This was because head teachers lacked skills to prepare
them and additionally, they had not been guided by the inspectors. In the absence of a
SIP, follow up of recommendations becomes difficult.
vi. Monitoring and Evaluation of inspectors
There was no evidence to confirm that inspectors were monitored and evaluated. This
was caused by lack of awareness on what was required of DEOs and CAOs to enable
enforcement of such procedures. In the absence of proper monitoring and evaluation,
weaknesses in the inspection process remained undetected.
vii. Inspection work plans:
Inspection Work plans were not consistently prepared by the district inspectors. 64% of
Districts and Municipal Councils visited had prepared annual work plans while 36% had
not. 29% of those with annual work plans had not broken down their work plans into
quarters. The failure to prepare workplans was attributed to inspectors being laxed.
Inspections could therefore not be carried out in a planned manner in the absence of
such approved work plans.
viii. Monitoring quality of service provided by district inspectors
There was limited supervision or monitoring by ESA in the Local Governments during the
period under review. Evidence availed showed that there was very limited formal
interaction between the ESA and the district inspectors in the form of workshops, joint
inspections or meetings during the period. This was attributed to lack of monitoring
capacity by ESA in terms of personnel, funding and logistics. Limited partnership and
collaboration between ESA and district Inspectors affected the quality of service in
inspections. The benefits that could have been derived from the joint efforts could not
be realized.

7
1.4.3 Pension processing by the Department of Compensation – Ministry of Public
Service:
i. Overall Pension Processing
The audit revealed long pension processing time. It takes on average 23 months for
the traditional civil servants and 30 months for the teachers to access the pension
payroll instead of the expected 6 months. The delay was attributed to, among other
things: the lack of a communication strategy; the failure by the MoPS to use the
existing records of retired officers to commence timely pension processing; the
unreliable Pension Information Management System (PIMS); and interruption of the
serving officers by pensioners.The delays lead to distress at the various stages of
pension processing as described below:-
ii. Receiving and Approving Pension Application Forms
MoPS took an average of 13 months and 16 months to acknowledge receipt of
pension applications for the traditional civil servants and the teachers respectively
instead of the required 14 days. It was noted that officers take long to file
application letters and documents before compiling a list for submission to the PS or
delegated officer. The delay was caused by lack of time limits allocated the to sub
activities carried out before the submission of application forms to the PS or
delegated officer. The absence of time limits affects effective monitoring and
supervision of these activities.
iii. Verification and Assessment of Pension Claims
There were also delays in verifying and assessing pension files. It took on average
14 months to verify and assess the pension files of traditional civil servants and
teachers instead of 1 month as required. The delay in the HRM department was
attributed to the lengthy verification time caused by the slow response by the retired
officers in ensuring the questions raised on pension applications and failure to give
appropriate attention to pension verification by the HRM Department.
8
iv. Payment of Pension
It took an average of 8 months for both the traditional civil servants and the
teachers to access the pension’s payroll from the date of approval of the pension
payment as opposed to 3 months. This was caused by inadequate funds released to
the MoPS by the Ministry of Finance Planning and Economic Development (MoFPED)
thereby affecting the livelihoods of retired officers. It was also noted that the delay
in payment of teachers pension in the years 2006/07, 2007/08 and 2008/2009 was
aggravated by the diversion of the teachers’ funds to cater for payment of other
pension categories.
1.4.4 Provision of Basic Necessities to Prisoners: Uganda Prisons Service:
The audit revealed deficiencies in Provision of Basic Necessities. These are:
Food and Water provision:
i. The quantity and quality of food served to inmates compared to the recommended
dietary scale was inadequate. Only posho and beans were served and even then, some
prisons were not serving all the three meals in a day. There was laxity in supervision and
accountability of food grown by prison farms to supplement government resources. The
quality of food served did not meet all the inmates basic food nutrients necessary for a
healthy balanced diet. These conditions violate the basic right of a prisoner’s entitlement
to a balanced diet;
ii. There was inadequate provision of clean drinking water in some prisons which poised
the danger of prisoner being victims of water-borne diseases;
Health Care:
iii. Prisoners were not medically examined and vaccinated on admission. This can lead to
spread of disease and determining ones fitness to work cannot be assessed;
iv. Medical facilities were limited and some are non-functional. Supply of drugs and sundries
was inadequate and support supervision was also irregular. The condition is worsened by
the policy of treating non-prisoners (over 50%) who could otherwise access treatment

9
outside prison hospitals. This denied prisoners basic treatment and management of their
diseases;
v. The prison service had limited medical staff to cope with the inmate population. While
medical staff levels are expected to increase to 53% by the end of 2009/10 financial
year, the prisoner population is currently at 212%;
vi. There was poor management of communicable diseases as evidenced by lack of
adequate rooms to separate the sick prisoners from others in the wards which are
already congested. This exposed inmates to contracting contagious diseases during
confinement;
vii. Measures to control insects, rodents and vermin in prison premises were inadequate.
There was no fumigation carried out to control mosquitoes, lice and bedbugs which
could otherwise reduce preventable diseases like malaria;
Clothing/beddings:
viii. Uniforms supplied to prisoners by UPS management were insufficient in numbers to
cover all the prisoners as required. Whilst prisoners were entitled to 2 uniforms a year,
some were not even getting a uniform, even though UPS had adequate capacity to
produce all the required uniforms. Maintaining proper hygiene and proper identification
became difficult;
ix. UPS did not provide sufficient beddings and separate beds as required by local and
international standards. A few beds were only provided by organisations like ICRC.
1.4.5 Project Management: A case Study of 8 Debt Funded Projects:
The study revealed the following as the main causes of the failure by implementing agencies
to absorb the allocated funds/loans leading to payment of commitment fees/penalty:-

10
i. Counterpart Funding:
Government did not honor its obligation of approving and releasing in full all the
counterpart funds budgeted for by the PIUs/Line Ministries. The MOFPED failure to remit
the budgeted counterpart funds was attributed to Government budget constraints and
prioritisation of government programmes. The failure of government to honour its
obligation of providing the budgeted counterpart funding led to failure of the projects to
attain their intended objectives.
ii. Diversion of Project Funds:
We noted that 4 out of the 8 projects had their counterpart funds contribution
amounting to Ug Shs 3,174,454,821 diverted by the Ministries during the period under
review. The diversion of funds is attributed to lack of direct control of counterpart
component by the project coordination unit and the mixing of project releases on the
same account with line Ministry releases. It was also attributed to financial indiscipline by
government officials. Diversion of project funds deprived the project resources needed to
achieve the timely implementation of its activities.
iii. Operational Conditionalities:
Some of the projects were delayed for a period ranging from 2 to 7 years because of the
difficulties the projects were experiencing in fulfilling the conditionalities. This was
attributed to lack of technical persons on the project implementation team to provide
technical guidance on the tasks which were not easy to implement and also lack of
commitment by some stakeholders. Some of the conditionalities/milestones were not
easy to achieve and delayed the start, and also contributed to the slow rate of
implementing the project’s activities.
iv. Procurement:
We noted that the Procurement units within the line ministries did not execute the
procurement plans on schedule. This was attributed to the slow pace at which the line
ministries processed procurement documents. The delays were also attributed to some
of the accounting officers and officers involved in procurement not being very conversant
with the PPDA Act. Delays in procurement denied the projects the inputs necessary for
timely project implementation.

11
v. Monitoring and Evaluation:
According to the World Bank Independent Evaluation Group (WBIEG) report of 2007
which centered on how to build M&E systems to support better Government, it was
reported that Uganda had a large number of uncoordinated and unharmonized
monitoring systems at the sector and sub sector levels. This was attributed to poor
coordination among key players in M&E.
In the absence of a well coordinated M&E system, project stakeholders could easily
identify and understand the project implementation hurdles and address them in a timely
manner.
vi. Project Designs:
The study revealed that 4 projects out of the 8 were subject to modifications during
implementation as a result of omissions at the design stage leading to delays in project
implementation. This was attributed to inadequate consultations by the line ministries at
the design stage.
Inappropriate design derails the project objectives and is costly in terms of time lost and
the financial resources which would be required to rectify the anomalies.
1.4.6 Solid Waste Management in Kampala:
i. Planning and Budgeting
The divisions lack data for example on the estimated tonnage of garbage expected to be
generated and collected, number of households, number and capacity of private
collectors, and the composition of solid waste stream. Lack of such a data base leads to
the preparation of work plans and budgets that do not adequately address the
challenges in garbage collection, transportation and disposal. The provisions like fuel,
wages, vehicle maintenance and repairs and procurement of goods and services in the
budget are not realistically supported. Lack of such a data base also contributes to
wrong strategies being developed to address the garbage collection, transportation and
disposal challenges at KCC and the divisions.

12
ii. Solid Waste Management Awareness
The Solid Waste Management Strategy (SWMS) requires members of the public to be
educated in matters of modern waste management best practices. It was noted that
solid waste awareness campaigns are not conducted by KCC and the divisions. This was
attributed to lack of specific solid waste management work plans in the divisions and
also the failure of the divisions to properly provide for such campaigns in their budget
estimates.
Lack of solid waste management awareness campaigns has led to unacceptable waste
management practices such as indiscriminate littering and burning of garbage in the city.
iii. Enforcement of the Solid Waste Management By-Laws
Under the Solid Waste Management Ordinance, 2000, it is illegal and punishable to
dump garbage in places where it may be or become a public health nuisance. These
places include water bodies, public streets and the roadside. The responsibility to
enforce these rules and regulations rests with KCC and the divisions.
Cases of illegal dumping of garbage were noted at market places and despite the
existence of a fully fledged enforcement department, KCC and the divisions were not
enforcing the laws. This has caused unnecessary suffering to the neighborhood through
air pollution and blockage of the drainage system leading to floods.
iv. Working Conditions of Personnel in Garbage Collection:
The SWM ordinance provides that staff involved in collection, transportation and disposal
of garbage should be provided with protective clothing which includes gumboots,
industrial gloves, masks, overalls and head covers.
Management at the divisions has failed to procure protective clothing for the staff
involved in garbage collection, transportation and disposal despite the presence of the
budgetary provision under the supply of goods and services. The lack of conducive
working conditions affects staff morale which may in turn affect their performance at
work.
13
v. Wage Payment:
Although the refuse collection workers are supposed to be paid by the 28th day of every
month, it was noted that the division authorities paid wages late. Delayed payment of
wages affects the staff morale which in turn affect their performance at work.
i. Transportation of Garbage:
KCC and the divisions required on average 86-five tonnage lorries to be able to collect
and transport garbage from the city on the assumption that each vehicle makes 3 trips
per day. However, KCC and the divisions operated on average 35-five tonnage lorries
which was 40% of the fleet required to enable prompt waste collections and disposal in
the city. In the absence of the required number of vehicles to transport garbage, KCC
and the divisions could not attain the 80% required garbage collection performance
level.
Out of the required 85 refuse vehicles in the city, only 35 (40%) were operational at the
time of audit. Constant vehicle break down has led to accumulation of un-collected
garbage to undesirable levels and this is evidenced by the presence of refuse which has
taken more than one day without being collected.
ii. Engagement of Private Garbage Collectors:
It is an offence under the SWM Ordinance, 2000 to collect, transport, remove or dispose
refuse for a fee or other consideration without a valid permit from the Council. The
SWMS also recommends providing legal recognition of the private garbage collectors so
that they become more organized. A number of private garbage collectors were
operating without permits from KCC. KCC has also failed to establish a proper
mechanism for regulating the operations of private collectors. Some of the private
collectors have no capacity to collect and transport refuse to the landfill.
iii. Supervision, Monitoring and Control of Solid Waste Management Activities:
According to the SWM ordinance, 2000, KCC or its agents, servants or licensed collectors
are required to ensure that solid waste in the district is collected and conveyed to
treatment installations or approved disposal sites. The SWM ordinance, 2000, also
requires that the various refuse generators should be correctly identified, categorized
and mapped to enable determination of the revenue potential.

14
KCC and the divisions were not supervising and monitoring the activities of private collectors
due to an absence of signed agreements and data on the numbers and capacity of private
collectors. There are no records to indicate any form of supervision being undertaken.
The refuse gangs were also not supervised daily due to lack of fuel and the overwhelming
number of garbage sites, some of which are illegally operated by garbage generators. It was
further noted that the garbage sites are not mapped making it difficult to plan and monitor the
progress of garbage collection.
Failure by KCC and the divisions to adhere to SWM ordinance provisions governing the
supervision of refuse collection, transportation and disposal procedures led to the absence of
adequate supervision, monitoring and control mechanisms which aggravated the problem of
uncollected garbage.
1.4.7 Regulation and Enforcement of Standards by Uganda National Bureau of
Standards (UNBS):
The audit revealed insufficient inspection of goods on the Ugandan market. Only 68% of
planned import inspections were carried out in 2005/06 and 80% in 2007/08 giving an overall
performance of 74%. Only 62% of planned local factory inspection were carried out in
2006/07 while only 56% in 2007/08 reflecting an overall performance of 59%. In 2005/06,
only 425,125 scales were verified out of the planned 510,000 leaving 84,875 un verified.
Although the Bureau surpassed its targets in 2006/07 and 2007/08, its planning figures were
declining i.e (510,000 for 2005/06, 250,000 for 2006/07 and 235,000 for 2007/08). UNBS
was also found to be under staffed to a tune of 46%. It was also revealed that the URA Green
Channel Clearance system was difficult for UNBS to cope with. Other pertinent issues were:
inspection of goods at owner’s premises which is difficult to monitor or follow up; and
inadequate/ineffective enforcement of standards arising from inherent gaps in the law.
1.4.8 Passport Processing by the Passport Control Department – Ministry of
Internal Affairs:
The processing of a passport is expected to take ten (10) working days or fourteen (14)
calendar days. However, processing passports by the Passport Control Office (PCO) takes

15
longer periods, with average delays of nine (9) to thirty two (32) days at the Ministry
headquarters and in the regions/districts, respectively. The processing of passports at the
head office had improved with an average delay of only 2 days in 2008/09. The processing of
passports on average delayed for 24 days in FY 2006/2007, 25 days in FY 2007/08 and 13
days in FY 2008/09. At the regional offices/districts on average delays were 34 days in
2006/07, 39 days in 2007/08 and 34 days in 2008/09.
This has resulted into public dissatisfaction with the service rendered by the government in
this regard. The audit sought to ascertain the magnitude of the delays in the processing
passports and to examine the underlying causes of the delays and make suggestions to
management on steps that could be undertaken to curtail the processing time and measures
to improve service delivery.
The delays were attributed to the unconventional citizenship verification procedures, manual
processing of passports, inadequate communication strategy, poor records management and
unfavourable staff working conditions.
1.4.9 Northern Uganda Social Action Fund (NUSAF):
The audit revealed the following deficiencies in the implementation of NUSAF Project;
i. Sub-Project Funding
20% of the 2,650 CDI Sub-projects audited received funds above the requested
amount. It further established that 10% of the 5,306 VGS Sub-projects received
funds above their budgets. Over funding of Subprojects was attributed to lack of
an effective internal audit function. 1,061 sub projects received funds above the
requested amounts totaling to Shs.1,444,827,644 of which Shs.190,731,484 were
recovered and a balance of Shs.1,254,096,160 had no proper justification
rendering the expenditure wasteful.
ii. Maintenance of Financial Records by Subprojects
70% of the subprojects in a sample of 642 CDI sub projects did not maintain Cash
books and failed to make use of the standard accounting forms. The poor record
keeping was caused by inadequate training of subproject members and lack of

16
follow up training regarding financial matters. In the absence of proper financial
records at the CDIs, it was difficult to verify, reconcile and update the financial
information of the sub projects by NUMU and NDTO which led to over funding of
sub projects.
iii. Procurement Procedures
Out of the 642 CDI Subprojects visited, 60% did not have Community Procurement
committees while only 40% had constituted Community Procurement committees.
The audit further revealed that 50% out of the 257 CDI’s which had constituted
procurement committees 50% did not follow procurement guidelines. This was due
to inadequate training of the members of the Subprojects at the pre-launch.
Failure to follow the Community Based Procurement Guidelines led to escalation of
the cost of the sub projects.
iv. Civil Works
The audit revealed that 33% of the 642 CDIs of the Subprojects were monitored
by the NDTO on a monthly basis. 5% of the 642 CDIs Subprojects were supervised
and monitored by the District Sector Specialist/District Engineer. The audit further
established that 80% out of the 642 CDIs Subprojects did not have payment
certificates attached to the payment vouchers. Documentation review and
interviews revealed that staffing gaps and laxity of the sector specialists (District
Engineers) and NDTO’s, was the cause of inadequate supervision of civil works.
The verification of civil work revealed that lack of proper supervision resulted into
poor quality works of the sub projects.
v. Completion of Subprojects
The average completion time for the construction of CDI sub projects during the
NUSAF project lifespan was found to be 27 months as compared to 12 months
provided for in the guidelines. The delays in completion of sub projects was
attributed to delays in disbursement of funds to sub projects, non adherence to
procurement guidelines and lack of proper monitoring and supervision by
technical experts. The delay led to the extension of NUSAF project lifespan,
additional administrative costs and cost escalation.

17
vi. Disbursement of Funds to Subprojects
The audit revealed that the transfer of funds to some subprojects was not done at
the launch whereas through document review, it was noted that, in the year
2004/05, disbursements to subprojects was done on average 10 months after the
launch (2005/06; 6 months, in 2006/07; 5 months, and in 2007/08; 7 months). As
a result of delays in the disbursement of funds, the subprojects could not complete
their activities on schedule and according to their work plans.
vii. Submission of Accountabilities
40% of the 642 CDIS sub projects received more than one tranche prior to
submission of previous accountabilities. The study revealed that accountabilities for
funds received by subprojects were not submitted in accordance with project
guidelines. According to the Auditor General’s report of NUSAF for the year ended
30th June 2008, the age analysis of the advances revealed that an amount of
Shs.262,506,090 had been outstanding for more than twelve months. Out of the
total of 2,322 CDIs sub projects, 20% had not submitted accountabilities
amounting to Shs.2,607,315,491 at the close of the project in September 2009.
This was attributed to inadequate training and mentoring of the members of the
Subprojects on financial matters and high illiteracy rate among members.
viii. Commissioning of Completed Subprojects
The audit noted that out of the 449 completed sub projects, 30% were not
commissioned and were not functional because they lacked basic facilities. 50% of
these were Health centers which lacked medical equipment and staff houses, 30%
were classroom blocks which lacked furniture and 20% were teachers’ houses
which did not have toilets and bathrooms. Failure to complete CDI Subprojects in
time was attributed to delays in disbursement of Subproject funds, non adherence
to Procurement Guidelines regarding civil works and lack of effective supervision
and monitoring.

18
ix. Performance of VGS Subprojects
The audit revealed that out of the 1,048 VGS Subprojects, 64% operated for an
average of (8) eight months and later closed. Poor Performance of Vulnerable
Group Support Subprojects was attributed to inadequate Monitoring and
Supervision, inadequate Field Appraisals, poor Community participatory Appraisal &
Training, ineligible Subproject group composition, projects not launched and
inadequacies in the approval process of Subprojects.
As a result of short lifespan and existence of incomplete sub projects, the
community did not benefit from the services they were expected to receive from
the shs.16,608,021,628 incurred on these sub projects.
1.4.10 Procurement and Distribution of Relief Items in the Office of the Prime
Minister:
i. Disaster response time
The audit revealed that in some cases response time to districts or areas that were
affected by disasters far exceeded the international standard of 48 hours (i.e. 2 days).
It took OPM an average of 1,176 hours (i.e. 49 days) to respond to some disasters.
ii. Disaster needs assessment
Although some districts attempted to prepare preliminary disaster reports, the reports
did not show information on key issues such as; number of persons affected, damage
suffered, the quantified financial and other resources required.
iii. Coordination of disaster activities
There was no evidence to show whether OPM convened monthly national platform
meetings for disaster preparedness and management.
iv. Allocation of food relief items to disaster victims
The audit revealed that the food relief items delivered by OPM/DDMR in seven out of
the 21 districts could not meet the minimum daily ration recommended by WFP.

19
1.5 VFM AUDITS UNDER PROGRESS
A total of a further eight audits have been initiated by the VFM unit and are at different stages
of execution. They are planned to be completed and a report submitted to Parliament in the
following year. They are:-
i. National Drug Authority - NDA (Inspections);
ii. Ministry of Education and Sports - MoES (UPE Capitation Grant);
iii. Ministry of Energy and Mineral Development – MoED (Rural Electrification Programme);
iv. Uganda National Road Agency – UNRA (State Roads);
v. Ministry of Local Government – MoLG (Procurement);
vi. Ministry of Judiciary – (Management of Cases);
vii. Ministry of Lands , Housing urban and Development - MoLHUD (Land Registration);
viii. Ministry of Agriculture Animal Industry and Fisheries – MoAAIF (Farm Income
Enhancement) FIEFOC.

20
2 PROCUREMENT AND STORAGE OF DRUGS BY NATIONAL
MEDICAL STORES
2.1 INTRODUCTION
2.1.1 MOTIVATION
There has been a general countrywide concern about people dying of treatable diseases such
as malaria arising from patients’ failure to access drugs in public health facilities, and yet drugs
worth billions of shillings were reported having expired in NMS facilities, stores of Referral
Hospitals, District Health Offices and health units. Drugs worth Ushs. 6.7 billion expired
between July 2005 and June 2008 in the NMS storage facility alone1. At the same time NMS
could not supply all the drugs ordered by health units.
A monthly storage cost of shs 36 million was wasted on these expired drugs2 and their
subsequent destruction cost of about shs 700 million3 could have been channeled to other
priority activities badly needed by the citizens, such as the recruitment of additional medical
personnel in health facilities like health centers II and III.
All the above scenario may compromise the NMS’ vision of being “the leading national supplier
of medicine and other medical supplies to meet the needs of the Ugandan population”.
The Auditor General, therefore, carried out an independent assessment of NMS’ core
operations of Procurement and Storage of drugs with a view of recommending improvements
where problems exist.
2.1.2 DESCRIPTION OF THE AUDIT OBJECT
2.1.2.1 Legal Framework
National Medical Stores (NMS) derives its mandate from the National Medical Stores Act
chapter 207 of the Laws of Uganda.
1 NMS stores write off records of April 2008 and February 2007
2 The New Vision of Thursday September 11, 2008 3 NMS financial record

21
NMS is an autonomous Government Corporation established by the National Medical Stores Act
of 1993, which came into effect on 3rd December, 1993. MOH through the 1993 NMS Act
delegated the drug supply, storage and distribution function to NMS, hence the formation of
an autonomous institution, NMS, to replace the Central Medical stores (CMS), which was
formally a department of MOH.
NMS is responsible for ensuring the continuous distribution of pharmaceutical products in a
financially viable and sustainable manner. In addition, NMS distributes various drugs which
currently include Uganda Essential Drug Kits, Sexually Transmitted Infections (STI) drugs and
family planning products. MOH is responsible for the allocation of the above categories of
drugs while NMS stores and distributes to the various districts and health facilities.
2.1.2.2 Vision of NMS
“To be the leading national supplier of medicine and other medical supplies to meet the needs
of the Ugandan population”
2.1.2.3 Mission of NMS
“To equitably provide affordable, quality medicines and other medical supplies to health
facilities in Uganda”
2.1.2.4 Core Values of the Corporation
The core values of the corporation are: Integrity, Transparency, Accountability, Operational
excellence, corporate social responsibility, strong leadership, team work and customer focus.
2.1.2.5 National Medical Stores Objectives
The strategic objective of NMS is to procure, store and distribute medicines and medical
supplies for use in Ugandan medical facilities.
The principal objectives of the corporation as derived by the Act are as follows:-
i. To procure, economically and efficiently, medicines and other medical supplies of good
quality primarily for the public health services.
ii. To secure, safe and efficient storage, administer, distribute and supply the goods in
question in accordance with the National Drug Policy (NDP) and National Drug Authority
(NDA)

22
iii. To establish and maintain systems to ensure the quality of goods supplied.
iv. To estimate the current and future needs as a basis for procurement, planning and
budgeting by the corporation itself and the Ministries concerned.
v. To perform as appropriate, additional tasks entrusted to the corporation by regulation, or
as may be accepted by the board as complementary or necessary for the performance of
its primary functions.
2.1.2.6 Funding
NMS gets operational funds from the sale of medicines and medical supplies and handling
fees. The table below shows the actual income as extracted from the Audited Accounts for the
years 2005/06-2007/08
Table 1 NMS Source of funds
YEARS 2005/06 2006/07 2007/08 TOTAL
Sales income 16,277,628,000 15,876,170,000 17,117,050,000 49,270,848,000
Others 3,826,200,000 6,561,448,000 7,558,412,000 17,946,060,000
Shs 20,103,828,000 22,437,618,000 24,675,462,000 67,216,908,000
Source: Audited Accounts for 2005/6, 2006/7 and 2007/8
2.1.2.7 Audit Objectives
The audit objective was to assess the operations of National Medical Stores in the areas of
procurement and storage. The view was to establish the extent to which customers’
requirements for drugs were met, whether drugs were procured according to plan; to
ascertain the efforts made to ensure that drugs do not overstay and the procedures put in
place for retrieval and destruction of expired drugs. Finally, the audit would recommend
improvements where problems exist.
2.1.2.8 Audit Scope
The audit focused on the aspects of whether customer requirements are met, procurement
planning, needs assessment, coordination of procurements, storage and disposal of expired
drugs by National Medical Stores (NMS,) and covered ten out of eighty districts. Three or two
districts were sampled from each of the four regions of the country. Stratified random
sampling method was used to select the District with the highest, medium and /or smallest
number of health units. The sampled districts were: Nebbi and Arua in the Northern region;
Soroti, Moroto and Iganga in the Eastern; Mbarara and Kabarole in the west and Wakiso,
23
Masaka, and Kayunga in the central region. The study covered 4 years from July 2005/06 to
June 2008/09.
2.2 FINDINGS
The findings of the study are as follows:
2.2.1 MEETING CUSTOMERS‟ REQUIREMENTS
2.2.1.1 Capacity to supply ordered quantities
NMS is required to supply drugs in the quantities ordered by the Health Centres in compliance
with the Act.4 Public Health centres can only procure drugs from NMS except when NMS
provides them with a certificate of non-availability.
However, the audit observed that in a number of cases, NMS could not supply drugs and
medical supplies to meet the orders placed by the public health units. The information
analyzed from NMS sales performance in respect of key anti-malarial drugs that are expected
to be available at all times in NMS stores5 revealed that less than half the orders were honored
by NMS as reflected in the bar chart in figure 2.
4 The National Medical Stores Act, 1993 (cap. 207).
5 Essential Medicines List for Uganda EMLU 2007,page 2

24
Figure 1 Anti-Malarial drug supply against customer orders
Anti-Malarial Drug supply against Customer
orders from 2005 to 2008
0%
10%
20%
30%
40%
50%
60%
70%
80%
90%
100%
1 2 3 4 5 6 7 8 9
Malarial Drug types
Ord
er a
nd D
eliv
ery
perc
enta
ge
% Not Supplied
% Delivered
Key
Chloroquine 50mg base/5ml6 1
Quinine 100mg/5ml 2
Chloroquine 200mg base/5ml 3
Quinine di-HCl 600mg/2ml 4
Artemether 50mg 5
Chloroquine 150mg base 6
Chloroquine 150mg base tab 7
Quinine sulphate 300mg, film coated7 8
Quinine sulfate 300 mg tab 9
On average, NMS’ capacity to supply anti-malarial drugs from their own stocks during the
period was 40% while third parties supplies were at 77%. The average for both categories
was 60%. Out of the 20 different types and forms of anti-malarial drugs supplied both by NMS
and 3rd Parties in the same period, only homapack green was supplied 100% to meet the
orders( that is, all the 21,000 packs ordered were supplied). It is worth noting that malaria is
the most common sickness reported on daily basis at all levels of health centres in Uganda.
6 Effective 2008, there was policy change, removing this drug from 1st line treatment of malaria as per
EMLU,2007 7 Effective 2008, there was policy change, removing this drug from 1st line treatment of malaria as per
EMLU,2007

25
We noted further that NMS supplies a range of other drugs to health centres that are not
ordered by them to compensate for the value of the drugs that could not be supplied. 18% of
the 1,281 drug items supplied between 2005 and 2008 fall in this category. This action only
served NMS’ financial management concerns but did not address the needs of the health
centres.
Because of those shortcomings on the part of NMS, the management of a number of health
centres have a tendency of giving an excuse for purchasing Primary Health Care (PHC) drugs
for which money is availed in cash from competing suppliers.
This was because of NMS’ inability to use the appropriate data to plan and procure the right
types and quantities of drugs to meet customer requirements.
The result of this situation was perpetual stock deficiency at health centres resulting from
NMS’ failure to meet the customers’ orders. This significantly affects the rural poor people who
depend on Government health units. As a result they do not obtain appropriate treatment for
life threatening common diseases. On a site visit to Bukuku Health centre in Kabarole on 19th
September 2008, we witnessed cases where patients had to go home without treatment for
malaria.
The team did not have the means of tracking the health conditions of those who returned
home untreated. However, a proportion could have died as a result of non treatment if they
had no alternatives or could have opted for traditional treatment out of desperation.
This is likely to have contributed to the increasing numbers of private drug shops that have
sprung up to fill the gap created. The health centres are also at the risk of purchasing cheap
sub standard drugs from private Pharmacies.
2.2.1.2 Certificate of drug non-availability
NMS is legally the sole primary supplier of drugs to Public Health units. The Public Health units
are only allowed to procure drugs from other recommended private pharmacies after their
orders with NMS have not been honored due to insufficient stocks and after they have been
issued with certificate of non-availability by NMS.

26
The audit did not see any case of issued certificate of non-availability in all the 14 health units
visited during beneficiary survey. Moreover, the NMS management operates a system that
automatically generates the certificates for PHC. The certificates are separately dispatched by
post if not collected personally, together with a pro-forma invoice from the management.
These certificates, however, either do not reach the health centres or are withheld by DHOs.
NMS’ evidence of the health centre acknowledgment of the certificates or dispatch record were
not availed for audit. The 6 copies out of the 14 non-availability certificate requested and
availed by NMS were printed fresh from the system and not the required file copies of those
dispatched.
The cause of this undesirable situation is the failure by the management to appreciate the
implication of certificate of non-availability to health units; the reluctance by the management
to provide evidence (in form of the certificate) that in the end may indicate that they are
inefficient and; lack of clarity on the procedure and the drug supply situation (Credit line or
PHC) that requires issuance of certificate of non-availability. While NMS issues the certificates
for PHC only, health units expect certificates for both Credit line and PHC drugs. There is also
inefficiency in the movement of the certificate between NMS, DHO and health centres.
The inefficiency in the handling of certificates of non availability created opportunity for many
health centres to disregard the requirements for the certificate and procure drugs from
elsewhere. As a result, additional avoidable costs are incurred in form of transport from health
units to alternative private pharmacies since private pharmacies such JMS do not provide drug
delivery services to beneficiary Districts. It additionally leads to re-channeling of funds meant
for drug purchase to meet those additional operational costs. Consequently, funds available for
drug purchase are reduced, which escalate drug shortages in health centres further.
As seen in table 2, the total expenditure on purchases of drugs by health centres from the two
major recommended suppliers for EMHS of PHC grants (NMS and JMS) for FY 2006/07 and FY
2007/08 reflects that 45.9% in FY 2006/07 and 45.5% in FY 2007/08 amounting to shs.17
billion was spent either on purchase from other sources or diverted to non drug expenditures.

27
Table 2 Expenditure for EMHS of PHC grants at NMS, JMS and others compared for FY
2006/07 and 2007/08
Level EMHS
Allocation „000
%
Expenditure at NMS
%
Expenditure at JMS
% of
Expenditure at
NMS+JMS
% of
Expenditure at Others
FY 2006/2007
Regional Ref
Hospital
2,903,260 6.7% 31.6% 38.3% 61.7%
General Hosp 4,245,000 14.3% 40.2% 54.5% 45.5%
District Hosp 11,057,915 20.7% 37.3% 58.0% 42.0%
Total FY
2006/07
18,206,178 17.0% 37.1% 54.1% 45.9%
FY 2007/2008
Regional Ref
Hospital
3,927,815 8.5% 40.0% 48.6% 51.4%
General Hosp 4,245,000 13.6% 43.5% 57.1% 42.9%
District Hosp 11,029,252 18.8% 35.5% 54.3% 45.7%
Total FY
2007/08
19,202,068 15.5% 38.2% 54.5% 45.5%
Source: Annual Health Sector Performance report, Financial Year 2007/2008
2.2.1.3 Response to Customers‟ orders
Best practice in the industry, especially competitors like Joint Medical Stores, is that the time
taken to process a customer order ranges between few hours to two days.
However, it was observed that NMS did not have a clearly spelt out policy on the standard
time it should take to process a customer order from receipt to delivery at customers’ District
or personal collection from NMS premises. Table 3 shows this fact:

28
Table 3 Average delivery time on Customers‟ orders
YEAR No. of orders
processed
Average time taken (in
days) to deliver
Number of Orders not
delivered by audit time
2005 No data availed
2006 No data availed
2007 14,723 13 0
2008 7,050 22 110
2009 1,065 59 26
Average for
period
7,613 31 68
Source: NMS executed orders report
Table 3 shows that it takes on average 31 days to deliver an order from the time of receipt.
There were 110 orders dispatched from NMS in 2008 but evidence of the drugs reaching the
destined health centres was not availed indicating that those orders may not have reached
intended destinations. The Management explained that they subject such open orders to
investigations. There are cases when orders took one day while others three months,
regardless of the distance from NMS premises. The Management position is that they
accumulate and make deliveries when it is economical to do so after every 30 working days
disregarding the consequences of the delay.
The absence of guidelines in the Sales Policy document regarding the maximum time it should
take to process and deliver a customer order created no obligation for the prompt processing
of customer orders. This also denied customers a standard reference time as basis for genuine
complaints. Additionally, lack of focus on individual orders in favour of delivery only when it is
economical made customers’ feel ignored.
The effect was the loss of key customers who, except for the credit line items, resort to
procuring drugs and medical supplies from JMS and other private pharmacies. This was
confirmed by interviews held with the District Health Officers, Medical Superintendents of
Referral Hospitals and other customers. It led to the loss of the sales revenue opportunity
amounting to shs. 40.1 billion (Shs. 8.5 billion recorded in 2006 alone8 and other two financial
years as illustrated in table 4).
8 Minutes of 29th NMS/MOH technical Review meeting, 16th Jan 2007.

29
Table 4 Expenditure for EMHS of PHC grants at NMS and others compared for FY
2006/07 and FY 2007/08
Level EMHS Allocation „000
Expenditure % at NMS
Expenditure % to Competitors
FY 2006/07
Regional Ref Hospital 2,903,260 6.7% 93.3%
General Hosp 4,245,000 14.3% 85.7%
District Hosp 11,057,915 20.7% 79.3%
Total FY 2006/07 18,206,178 17.0% 83%
FY 2007/08
Regional Ref Hospital 3,927,815 8.5% 91.5%
General Hosp 4,245,000 13.6% 86.4%
District Hosp 11,029,252 18.8% 81.2%
Total FY 2007/08 19,202,068 15.5% 84.5%
Source: Annual Health Sector Performance report, Financial Year 2007/2008
As seen from table 4, 83% of PHC funds in FY 2006/07 and 83.5% in FY 2007/08 of the PHC
allocations amounting to 31.6 billion was used by the health centres to purchase drugs from
competitors.
Additionally, drugs which were procured on account of high monthly consumption pattern
subsequently turned out to become excess as a result of the reduced AMC.
The sales opportunity lost denied NMS the needed sales income required to improve service
delivery. This increases the funding burden on government by NMS. It also leads to failure to
raise adequate revenue to finance the procurement of more drugs. Besides, NMS have
persistent stock outs. This hinders the opportunity to increase the supply of drugs for the
treatment of citizens, thus compromising government’s efforts to provide affordable treatment
to citizens.

30
2.2.2 PLANNING, NEEDS ASSESSMENT AND COORDINATION
2.2.2.1 Procurement Planning
The procurement plan is expected to enable NMS to maintain a service level of 100% under
credit-line and 70% under PHC9. This would ensure that all orders from customers are met
and the buffer stock maintained at a minimum level to ensure that no stock outs occur.
The Audit team established from the procurement performance data availed for the three
financial years that NMS prepared procurement plans based on unreliable AMC which they did
not even comply with. They hope to place reliance on aggregation of procurement plans from
health units which are not forth coming. Drugs delivered by 3rd parties are not even based on
planned procurements. An extract of drugs procurement report for three Financial Years is
reflected in table 5:
Table 5 Drug procurement report Credit line extract
Description of drugs Quantity awarded &
ordered
Quantity Delivered
Under delivery
2007/2008
Acyclovir Tab 200mg 16,800 6,400 10,400
Acyclovir skin cream 5%, 10g 24,000 9,600 14,400
Doxycycline 100mg tab 48,000 16,442 31,558
Phenorbabitol tab 30mg 14,400 6,400 8,000
2006/2007
Penicillin, procaine 3MU+ benzyl 1MU 1,680,000 376,000 1,304,000
Penicillin. benzyl 1MU/600mg 13,007,500 4,607,500 8,400,000
Cotrimoxazole 400+80mg scored 160,800 146,996 13,804
Chloroquine 200mg base/5ml 1,808,700 1,808,500 200
Quinine sulfate 300mg 15,190 7,069 8,121
Chloroquine 150mg base 15,000 14,800 200
2005/2006
Amoxycillin capsule 250mg 43,200 34,992 8,208
Paracetamol tablet 500mg 93,600 85,176 8,424
Glucose Inj 5%, 500ml 432,000 71,665 360,335
Sodium Chloride (normal saline) injection solution, 0.9% 500ml
432,000 95,993 336,007
Source: NMS procurement department annual report 2006, 07 and 08
9 NMS sales policy guidelines; Procurement department specific objective 2.1(i), July 7,2008

31
The above problem is caused by non-generation of estimates of national drug needs arising
from a conflict in assignment of this role to both NMS and the National Drug Authority
Commission10. The estimates could provide a guide to NMS in procuring sufficient quantities to
hold in stock11. This problem is also attributed to the failure by NMS to maintain its own
accurate trend data for decision-making; lack of capacity by NMS staff to collect alternative
accurate data for drug quantification; lack of procurement plans from health facilities,
unpredictable prescriptions pattern by medical practitioners; and use of inappropriate data for
drug quantification during needs assessments.
The effect of these performance gaps is the perennial stock-out of some drugs; excess
stocking of certain categories of stock, which are slow moving. It also locked in funds which
could have been used to purchase more needed drugs to sufficient quantities, as well as led to
the expiry of excess stocks.
2.2.2.2 Buffer stock
NMS is required to maintain a buffer stock to last at least four months of sales demand to
avoid stock outs12. Additionally, all items of medicine listed for health centre levels up to and
including H (Hospitals) level are expected to be available at all times from NMS13.
The stock status for the period November 2008 to February 2009 in table 6 shows stock
inadequacies:
10 National Drug Policy and Authority Act, Chapter 206, section 10(1),(2) 11 Essential Medicines list for Uganda, EMLU, 2007, page 2 12
NMS stock replenishment policy as spelt out in Stores Management Operations Manual, 13 Essential Medicines list for Uganda, EMLU, 2007, page 2

32
Table 6: Analysis of percentage (%) of drug items with less than 4 months‟ stock cover
(by Category)
Category of
stock
2008 2009
No. of
items
Nov Dec Jan Feb Mar Apr May June Average
Core credit line drugs14
17 47% 53% 44% 50% 56% 59% 56% 53% 52%
Non core credit line drugs15
41 54% 51% 48% 53% 36% 35% 35% 40% 44%
Other priority
list drugs16 38 73% 73% 77% 71% 67% 67% 72% 70% 71%
Average 32 58% 59% 56% 59% 54% 54% 54% 53% 56%
Sub-total
No data availed for 2007
No data availed for 200617
No data availed for 2005
Source: Raw data from weekly stores management Reports.
In table 6, it is clear that drugs were not replenished to ensure that stock levels did not drop
below the four months buffer stock policy. Although the management explained that they
were using Just in Time policy for items locally manufactured for efficient utilization of storage
space and limited capital, this was not supported by the Stores Operational and Management
Manual in use at the time of audit.
Stock status reports for 2005, 2006 and 2007 were not available to show the status during
that period.
Generally, an average of 56% of all the stock categories fell below the four (4) months’ buffer
stock during the eight months period between 2008 and 2009. Analytically, the shortages
14
See glossary
15 See glossary
16
See glossary
17 Stock out rate for 109 credit line items was 30%, Minutes of the 29th NMS/MOH Technical review meeting,
2007

33
were: 71% from other priority list, 52% of core credit line drugs items and 44% from non core
items list. 164 stock items are in the categorization.
These shortages were as a result of failure by the management to comply with the Stores
Operational and Management Manual which required them to use spelt out scientific methods
of ordering drugs and medical supplies. This problem stems from the high staff turnover which
is not accompanied with speedy review of management tools in line with the current
management thinking and practice; as well as inadequate planning.
The effect of this state of affairs is that the country is left vulnerable and unprepared to handle
emergency drug requirement situations such as accidents, outbreaks of diseases etc. This
could cost lives unnecessarily. Some of the drugs occasionally out of stock are malarial drugs
which treat one of the diseases with leading causes of morbidity in the country at 38%, 33.6%
and 26.1% in the years 2006, 2007 and 2008 respectively. This disease pattern accounts for
27 of the total 83 million diagnoses for the three years, representing 33% of total diagnosis18.
2.2.2.3 Stock level of drugs
(i) Stock at National Medical Stores
NMS stock replenishment policy requires that the “stocking of trading stocks shall, as much as
possible, be in such a manner that maximum stock held at any one time should not exceed
1 year‟s quantity”. This is to minimize stock-outs, total stock holding costs as well as
overstay of drugs in the store. The inference is that, the maximum length of time a drug
should be kept in the store is one year.
However, the team observed that NMS has been stocking drugs in excess of the one year’s
requirement as illustrated in table 7:
18
MoH-Health Management Information System(HMIS)

34
Table 7 Drugs and sundries stored in excess
Item Available pick
quantity at date
AMC Date of
stock
position
Approximate
cover by stock
on hand
Core items.
AD Syringes 5ml+ Needle
DISP. Detached.
4,058 200 28 Nov 2008 1.7 yrs
AD Syringes 2ml +Needle
Disp.Detached
35,315 1,400 22 Dec 2008 2.1 yrs
AD Syringes 5ml+Needle
Disp. Detached
42,375 1,000 22 Dec 2008 3.6 yrs
Non Core items
Bendrofluazide 5mg tablets 5,293 100 28 Nov 2008 4.4 yrs
Erythromycin stearate
250mg
27,344 1,600 28 Nov
2008
3.6 yrs
Blades scalpel size 22 9,835 320 22 Dec
2008
2.5 yrs
Aminophyline 143,180 7,500 15 Jan 2009 1.6 yrs
Chloromphenicol 250mg 23,399 800 15 Jan 2009 2.4 yrs
Ranitidine 150mg 32,895 100 22 Dec
2008
27.4 yrs
Other Priority List items
Sheeting McIntosh red
rubber 20m roll, 90 cm
wide
69,504 10 22 Dec
2008
22.3 yrs
Albendazole 400mg scored 50,343 4,015 01 Aug2007 1.1 yrs
Gentian violet BP 80,
methylrosanililium 25G
20,511 600 01 Aug2007 2.8 yrs
Catgut chr. 2/0
(M3.5),75cm, N:30mm
10,671 800 01Aug2007 1.1 yrs
Mebendazole 100mg 51,501 3,500 20 Jan 2006 1.2 yrs
Needle infusion butterfly 227,188 16,000 20 Jan 2006 1.18 yrs
Quinine di-Hcl 600mg/2ml 1,526,865 100,000 20 Jan 2006 1.2 yrs
Salbutamol 7,657 600 15 April
2005
1.1 yrs
Plaster adhesive zinc oxide
50m
59,875 3,000 15 April
2005
1.6 yrs
Nystatin pessary 100 000
i.u
9,413 400 15 April
2005
1.9 yrs
Source: Weekly Stores Management Reports
As evidenced in table 7, the most striking examples are Ranitidine 150mg (used in the
treatment of ulcers) stocked to meet consumption for 27.4 years; Sheeting McIntosh red

35
rubber (used by mothers during birth) for 22 years; Bendrofluazide 5mg tablets for 4.4 years
and Erythromycin stearate 250mg for 3.6 years.
According to the Ministry of Health, the national delivery pattern of mothers in public health
units is as in table 8:
Table 8 Deliveries in health centres for the years 2002 to 2009
Months Average Monthly deliveries
Annual total
deliveries
2002 17,840 214,083
2003 21,886 262,633
2004 25,317 303,799
2005 29,567 354,799
2006 24,374 310,721
2007 33,481 425,014
2008 34,237 379,149
Total 2,250,198
Overall monthly average for 7 years 27,368
Overall Annual average for 7 years 321,457
Source: MoH-Health Management Information System (HMIS)
Each role of Sheeting McIntosh red rubber (of 20m roll, 90 cm wide) could facilitate in the
delivery of 10 mothers. The whole stock could facilitate 695,040 deliveries which is equivalent
to 2 years consumption. Yet based on NMS’ AMC the same stock can be enough to satisfy 22
years’ demand. The sales performance pattern of this sheeting rubber shows that only 22 roles
were ordered between 2005 and 2008 and were fully supplied.
The cause of this, according to management, is policy change by MOH without due regard to
its effect on NMS drug supply commitments, leaving the stock of certain drugs redundant in
NMS; medical practitioners who prescribe alternative drugs to patients to consume, leading to
a drop in demand for certain stock (see the case for Sheeting McIntosh red rubber above).
There is also the problem of the procurement of drugs by NMS without due regard to the
stocking policy; and the inability of NMS to use actual field data available with MOH for their
drug estimates.
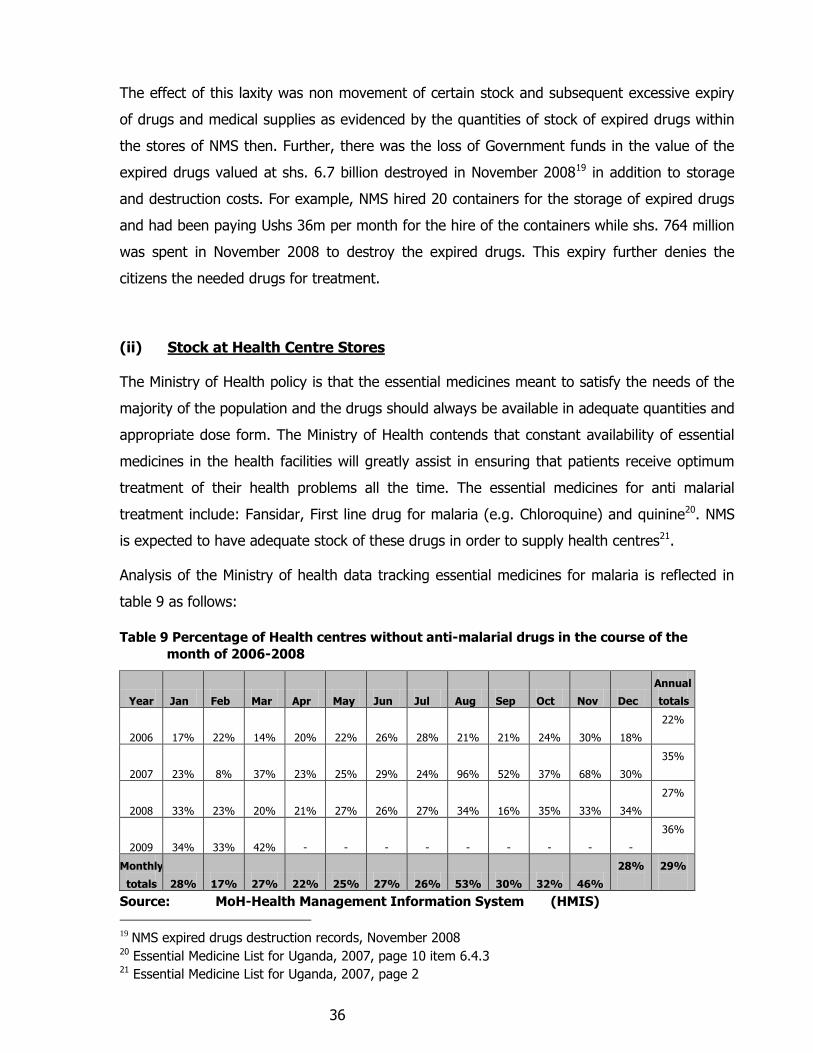
36
The effect of this laxity was non movement of certain stock and subsequent excessive expiry
of drugs and medical supplies as evidenced by the quantities of stock of expired drugs within
the stores of NMS then. Further, there was the loss of Government funds in the value of the
expired drugs valued at shs. 6.7 billion destroyed in November 200819 in addition to storage
and destruction costs. For example, NMS hired 20 containers for the storage of expired drugs
and had been paying Ushs 36m per month for the hire of the containers while shs. 764 million
was spent in November 2008 to destroy the expired drugs. This expiry further denies the
citizens the needed drugs for treatment.
(ii) Stock at Health Centre Stores
The Ministry of Health policy is that the essential medicines meant to satisfy the needs of the
majority of the population and the drugs should always be available in adequate quantities and
appropriate dose form. The Ministry of Health contends that constant availability of essential
medicines in the health facilities will greatly assist in ensuring that patients receive optimum
treatment of their health problems all the time. The essential medicines for anti malarial
treatment include: Fansidar, First line drug for malaria (e.g. Chloroquine) and quinine20. NMS
is expected to have adequate stock of these drugs in order to supply health centres21.
Analysis of the Ministry of health data tracking essential medicines for malaria is reflected in
table 9 as follows:
Table 9 Percentage of Health centres without anti-malarial drugs in the course of the
month of 2006-2008
Year Jan Feb Mar Apr May Jun Jul Aug Sep Oct Nov Dec
Annual
totals
2006 17% 22% 14% 20% 22% 26% 28% 21% 21% 24% 30% 18%
22%
2007 23% 8% 37% 23% 25% 29% 24% 96% 52% 37% 68% 30%
35%
2008 33% 23% 20% 21% 27% 26% 27% 34% 16% 35% 33% 34%
27%
2009 34% 33% 42% - - - - - - - - -
36%
Monthly
totals 28% 17% 27% 22% 25% 27% 26% 53% 30% 32% 46%
28%
29%
Source: MoH-Health Management Information System (HMIS)
19
NMS expired drugs destruction records, November 2008 20 Essential Medicine List for Uganda, 2007, page 10 item 6.4.3 21 Essential Medicine List for Uganda, 2007, page 2

37
Health units which reported stock outs of anti-malarial drugs were 35% in 2007 up from 22%
in 2006 and 27% in 2008. The highest stock out month was August 2007 in which 96% of the
health centres reported stock out of anti-malarial medicine. This represents 2,613 out of 2,719
health centres which reported their stock status in that month.
Comparatively, the Malarial death rose from 4,252 in 2006 to 7,003 in 2007 and dropped to
4,211 in 2008, implying that there were 2,750 more malarial deaths during the year 2007, that
is, 68% above usual. The month of August recorded the highest number with 1,286 deaths
from an average monthly death rate of 430 in the three years22.
The diagrammatical representation is as per graph in figure 2:
Figure 2 Malarial Death compared to anti-malarial drug stock-outs
Source: MoH-Health Management Information System (HMIS)
The stock outs were caused by the irregular supply of essential drugs by NMS; not supplying
all drugs ordered by health units; and pilferage of drugs during drug distribution reflected in
the Forensic audit commissioned by the Auditor General23. Ineffective information sharing
22 MOH-Health Management information system (HMIS) 23
Report of the forensic audit commissioned by the Auditor General in 2007
-
2,000
4,000
6,000
8,000
10,000
12,000
14,000
2006 2007 2008 Years
Nu
mb
er
of
Hea
lth
un
its/D
eath
s
Malarial Death
Death
Stock out

38
mechanisms between health centres, NMS and the Ministry of Health on Health Management
Information such as drug usage and stocking positions.
Stock outs in health units make patients desperate and can resort to any available drugs in the
market, regardless of the quality.
2.2.2.4 Needs assessment in planning
The estimation of drugs quantities for the trading stocks to procure during a procurement
cycle should be done in a scientific and objective manner in order to avoid stock-outs, under
stocking and minimize expiries24. This requires that by the time a delivery from the supplier is
made; available stock should be enough to meet demands.
On the contrary, NMS did periodic projections based on only actual six months’ Average
Monthly Consumption (AMC) as shown in table 10:
Table 10 Average monthly drug projections
Item Available pick quantity at
date
AMC Date Stock cover on hand (Months)
Required 3 months delivery Quantity
Bandage Cotton 236 11,500 15.01.09 0.0 46,000
Amoxicillin 8,635 5,000 ,, 1.7 20,000
Chloroquine 1 500 ,, 0.0 2,000
Ferrous sulphate 0 3,400 ,, 0.0 13,600
Amoxicillin 3,472 5,000 28.11.08 0.7 20,000
Bandage Cotton 0 11,500 0.0 46,000
No data availed for 2007
No data availed for 2006
No data availed for 2005
Source: NMS Weekly Stores Management Reports 2008, 2009.
Table 10 shows the available stock quantities on hand when AMC is computed. The
computation of AMC is based on only the actual drugs that NMS was able to sell within the
previous six months. This resulted in omission of customer orders not honored in all the
procurement projections. The projections reflect only what NMS managed to sell based on the
24 NMS Stores Management Operations Manual page 7, item 1.7.1

39
existing stock and not total needs of customers as per their orders (that is, orders honored
plus drugs out of stock). The improper needs assessment is reflected in the stock-outs and
excessive stock balances of various drugs as per stores management report extract in Tables 5
and 6.
For example, on 15th January, 2009, AMC for Chloroquine (used in the treatment of malaria)
was computed to be 500 units when the stock on hand was one unit which was even not
enough to cover one day’s requirement of 16.7 units. In the case of Ferrous sulphate (which is
used in blood –related treatments) and Bandage cotton (which is mainly used in emergency
treatments), there was no stock on hand at all.
Furthermore, NMS, in some cases, supplied certain drugs in excess of ordered quantities25.
The cause of this is management’s lack of capacity and non compliance with the existing
Stores Management and Operations Manual.
The resultant effect of drugs supplied in excess of health units’ requirements was expiry
arising from inability to utilize all the quantity supplied. At the same time, drugs supplied to
health units in deficient quantities led to the failure to meet the drug needs of the health units.
2.2.2.5 Coordination between NMS and third parties
Best practice requires that where two or more parties act towards the attainment of a common
objective, there should be a Memorandum of Understanding (MOU) between the parties. The
MOU in question should spell out the respective responsibilities of the parties concerning drug
procurement.
In addition to the distribution of own drugs procured, NMS also stores and distributes drugs on
behalf of third parties such as Global Fund, Center for Disease Control (CDC)/USAID, Malarial
control Project, UNFPA, MoH, Leprosy and TB projects.
Despite serving common customers, the MOUs signed by the parties lack a joint procurement
plan aimed at satisfying the customers. Plans to facilitate joint drug procurement planning,
sharing stock position reports and annual national drug needs to avoid over or under supply to
25 Refer to item 4.1.1 Para. 4

40
the common customer is lacking. The MOU mentions delivery of drugs, storage and payment
of handling fees on delivery. An effort to coordinate procurement with 3rd parties has been
advocated by the NMS management with the MOH promising to take it up.
The absence of coordination of joint procurements leads to the third parties delivering items
that had already been stocked by NMS thus creating duplication as reflected in table 11:
Table 11 List of NMS items which are third party duplicated as at 15th Jan 2007
No Description
Status of NMS Stock (months)as at 15.01.2007
1 Ciprofloxacin Tab 500mg Equivalent to 1.2 months available
2
Penicillin, Benzathine benzyl
2.4MU/1.44g 1,600,000 (to expire 28/2/07) available.
3 Chloroquine 200mg base/5ml Global Fund- Equivalent to 2 months available
4
Pyrimethamine 25mg+sulfadoxine
500mg Equivalent to 7 months available
5 Chloroquine 150mg base Equivalent to 0.8 months available
6 Water for injection 10ml Equivalent to 2.3 months available
7 Acyclovir 5% Equivalent to 10 months available
8 Chlorhexidine Gluconate 20% scrub Equivalent to 2 months available
9 Oral rehydration salts for 1Lt, 27.9g
Global Fund Stock -Equivalent to 11months
available
10 Acetylsalicylic acid 300 mg Equivalent to 1 month available
11 Ketoconazole 200mg Equivalent to 0.5 months available
12 Aciclovir, 200mg Equivalent to 13 months available
13 Nystatin 4 months available
14 Praziquantel 600mg Equivalent to 38 months available
15 Mebendazole, 100mg Equivalent to .5 months available
16 syringe disp. hypodermic Luer 2ml
Injection Safety stocks for selected districts
available
17 Syringe disp. hypodermic Luer 5ml
Injection Safety stocks for selected districts
available
18 Wool cotton B.P. 500g Equivalent to 2months available
19
Set infusion adult, 15-20 drops/ml,
120cm Equivalent to 34months available
20 Gauze W.O.W hydrophilic 90cm x 50m Equivalent to 1.5 months available
21
Cannula intravenous, with inj. port &
stopper 18G GF Stock Equivalent to 16 months available
22 No data for 2008
23 No data for 2006
24 No data for 2005
Source: Annual Procurement Report, 2006/07

41
As seen in table 11, on 15thJanuary 2007 when 3rd parties made deliveries, NMS had stock of
praziquantel enough to last 38 months; Set infusion adult to last 34 months; Cannula
intravenous to last for 16 months and Aciclovir to last 13 months. In all the four cases NMS
had already stocked the same items above the allowable level of 12 months.
The cause of such gross duplications was the absence of clearly spelt out guiding terms for
coordination on the supply of drugs in the MOU. Failure to jointly agree on the estimated
national drug needs for the treatment of various diseases, which all the procurement parties
would target to fulfill, leads to unfocussed and disproportionate stocking of drugs.
The effect is that NMS locked up their funds by stocking similar drugs to those later delivered
by the 3rd parties. The funds would have been used to stock other drugs which were in short
supply. The excess drugs delivered are prone to expiry yet people are dying in the countryside
of treatable diseases. There is also wastage of financial resources in the storage and
destruction costs associated with these expired drugs. NMS drug procurement planning is
distorted by the unpredictable deliveries by third parties.
2.2.3 HANDLING OF EXPIRED DRUGS
2.2.3.1 Sources of expired drugs
The NMS policy is that only stocks that have at least three or more months of remaining shelf
life shall be issued out for sale to customers. Stocks with less than 3 months remaining shelf
life will only be issued upon customer request or after consultation with the customer who
confirms that the drugs will be fully consumed before expiry.
However, a review of the expired drugs records submitted to the Ministry of health by 100
(one hundred) Government health centres country wide indicated that 46% of the expired
drugs were delivered by NMS while the balance of 54% accounted for those donated directly
to DHO and health centres and others procured from private pharmaceutical companies.

42
An analysis of the expired medical drugs destroyed by NMS in November 2008 reveals that 82
% were third party supplies as analyzed in figure 4 below:
Figure 3 Analysis by source of 3rd party expired stock destroyed in November 2008
by NMS
0
500,000,000
1,000,000,000
1,500,000,000
2,000,000,000
2,500,000,000
AIDS COMMISSION
GLOBAL FUND
MOH
TB & LEPROSY CONTROL PROG.
UNFPA
USAID/CDC
OAG Analysis
The analysis of the expired drugs by disease type it treats reveals that 60 % were for
treatment of other diseases other than malaria. The reason for overstocking drugs of less
common diseases was not explained.
The expiry of the drugs which expired in the NMS premises’ was a result of excess stocking of
slow moving drugs procured by NMS and third parties. Third parties could simply be
attempting to absorb donor funds through buying any drug just to fulfill accountability
purposes. Drugs are also procured in excess as a result of improper coordination between NMS
and third Parties.
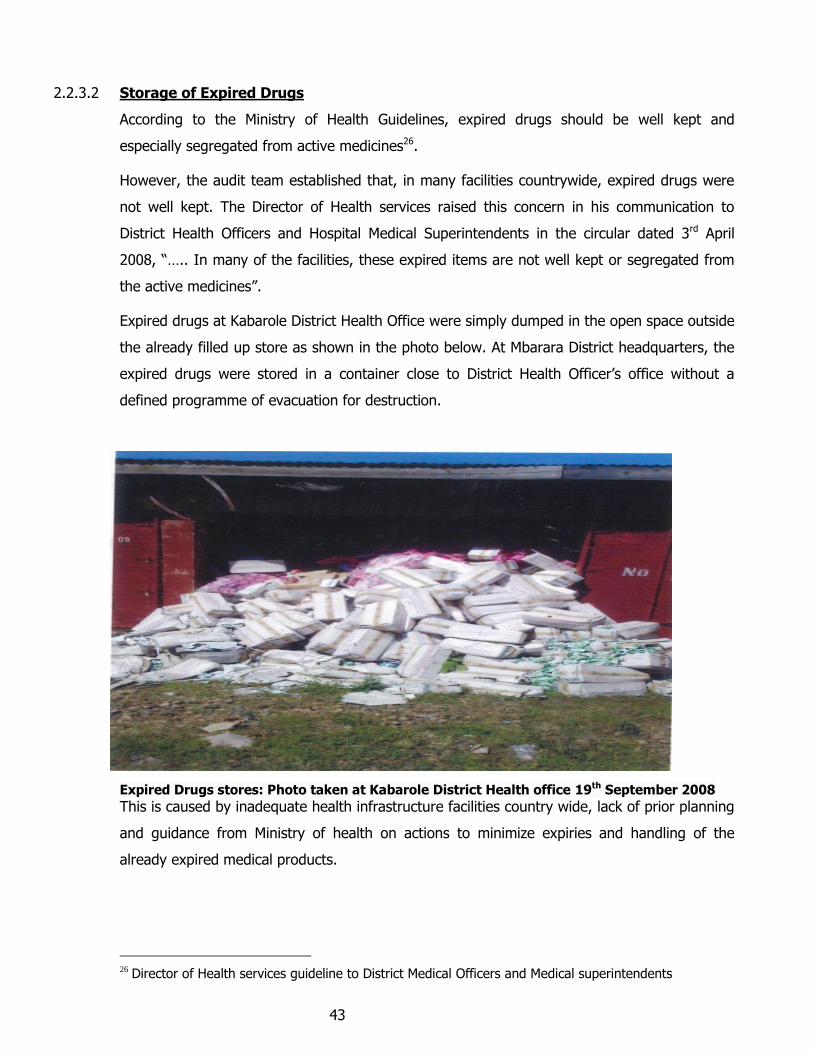
43
2.2.3.2 Storage of Expired Drugs
According to the Ministry of Health Guidelines, expired drugs should be well kept and
especially segregated from active medicines26.
However, the audit team established that, in many facilities countrywide, expired drugs were
not well kept. The Director of Health services raised this concern in his communication to
District Health Officers and Hospital Medical Superintendents in the circular dated 3rd April
2008, “….. In many of the facilities, these expired items are not well kept or segregated from
the active medicines”.
Expired drugs at Kabarole District Health Office were simply dumped in the open space outside
the already filled up store as shown in the photo below. At Mbarara District headquarters, the
expired drugs were stored in a container close to District Health Officer’s office without a
defined programme of evacuation for destruction.
Expired Drugs stores: Photo taken at Kabarole District Health office 19th September 2008
This is caused by inadequate health infrastructure facilities country wide, lack of prior planning
and guidance from Ministry of health on actions to minimize expiries and handling of the
already expired medical products.
26
Director of Health services guideline to District Medical Officers and Medical superintendents
44
The effect is that the expired drugs not properly stored could be causing immense
environmental consequences with slow but long term effects. The possibility of expired drugs
falling into the hands of wrong persons, who could re-cycle them after repackaging them,
cannot be ruled out. This fear was sounded in the communication of the Ministry of Health
Director of Health Services to District Health Officers and Medical Superintendents in the
circular dated 3rd April 2008, “….. leading to fears that some of these expired products may be
mistakenly used”. This was confirmed when the National Drug Authority impounded 1,166kg
of expired and substandard drugs being sold in illegal drug outlets in the eight eastern Districts
of Soroti, Tororo, Bukedea, Katakwi, Busia, Bukwo, Budaka and Nakapiripirit27.
2.2.3.3 Retrieval and destruction of expired drugs
According to NMS general guidelines on write-off of expired Drugs chapter 9, destruction of
written off drugs should be done at least every six months. Ministry of Health has no clear
guidelines on how long it takes expired drugs without destruction in health units.
Massive quantities of drugs were noted to have expired and had not been destroyed for years
at NMS premises and Health centres country wide. NMS last destroyed a stock pile of the
expiries in November 2008 after accumulation for over four years from July 2005 to June
2008. One hundred (100) health centers country wide had submitted list of expired drugs to
the Pharmaceutical division of the Ministry of Health by the time of audit. The last nationwide
destruction of expired drugs by the MOH was ten (10) years ago in 1993.
The status of how private health facilities handle their expired drugs was not established by
this study. However, some of the medical superintendents of Referral hospitals indicated that
certain private pharmacies donate drugs with short shelf life to government facilities with a
hope that they would be consumed by the many patients before expiry.
The causes of non prompt destruction of expired drugs in public health units are: lack of
capacity of health units to individually dispose off expired drugs because of strict
environmental compliance requirements for destruction; lack of clarity on the responsible
Authority for destruction of expiries in health facilities country wide; logistical difficulty in
27 New vision, Tuesday, 23rd June, 2009, Quarterly Drug inspection report, 2009

45
accessing the only Ministry of Defence facility in the country located in Nakasongola; and the
high cost of destruction per tonne of drugs.
The responsibility for the retrieval of expired drugs from health facilities country wide is not
clearly defined. All the 32 respondents interviewed point at either NMS or Ministry of Health as
the authority responsible. Although the Ministry of Health carried out national retrieval and
destruction ten (10) years ago, the officials say, it was based on the Ministry of Health
assuming responsibility simply as a mother ministry responsible for health. NDA is responsible
only for the drugs impounded by them during inspections up to one hundred (100) kgs. Any
excess is the responsibility of the person whose drugs were impounded. All destruction must
be done under the supervision of NDA.
There are also no clear guidelines and criteria designed to ensure drugs that expired in the up
country health centres were retrieved for destruction.
The effect of these uncertainties and denial of responsibilities are that millions of shillings are
spent on storage and remuneration of additional manpower to handle expired drugs storage;
and there is also misuse of the space which could otherwise be beneficial for the storage of
good drugs. Drug suppliers such as NMS, Donors and private pharmacies may utilize this
lacuna to shift the responsibility for destruction to health facilities. There is the risk that
desperate patients could be tricked into buying repacked expired drugs from illegitimate drug
outlets after failing to get genuine drugs from government health centres. The environmental
effect of these expired drugs could be taking a gradual toll on the country which will be
detrimental in future.
2.3 CONCLUSIONS
2.3.1 MEETING CUSTOMERS‟ REQUIREMENTS
2.3.1.1 Capacity to supply ordered quantities
As a result of failure to supply all the drugs ordered by health units, health workers are greatly
frustrated as they cannot provide convincing explanations to the patients who come for
treatment only to go back home untreated. Patients in the countryside who do not have

46
alternative treatment options, may buy drugs from any source regardless of its legitimacy or
resort to traditional treatment.
2.3.1.2 Certificate of drug non-availability
Although the NMS management claims that they promptly issue certificates of non-availability
this is contradicted by the officials in charge of the health centres. The actual situation remains
to be investigated further.
2.3.1.3 Response to Customers‟ orders
NMS does not have a clearly spelt out policy on the standard time it should take to process a
customer order from receipt to delivery at customers’ District or personal collection from at
NMS premises, yet it would be instill professionalism and efficiency in the process.
2.3.2 PLANNING, NEEDS ASSESSMENT AND COORDINATION
2.3.2.1 Procurement Planning
NMS has not been procuring drugs according to realistic annual procurement plans. The result
of this is excessive stocking of slow moving drugs, just waiting to expire, while fast moving
drugs are procured in insufficient quantities, creating stock outs.
2.3.2.2 Buffer stock
NMS does not comply with the replenishment policy in procuring drugs; as a result, they are
not able to maintain buffer stocks to avoid stock outs. This has led to the failure by NMS to
meet customer orders as placed according to the requirements of the health units’.
2.3.2.3 Stock level of drugs
NMS stocks some drugs in excess of the one year’s requirement while others are under-
stocked. The result is the expiry of drugs and medical supplies as evidenced by the huge stock
of expired drugs within health centres country wide and that which was destroyed by NMS.
The expiry of the drugs further denies the citizens the needed drugs for treatment, or, worse
still, exposes them to the hazards of utilizing the expired drugs unwittingly.

47
2.3.2.4 Needs assessment in planning
While NMS duly draws up the estimates of the drugs to be procured during the procurement
cycle, in reality, their computation of AMC is based on the inaccurate data of actual drugs sold
by NMS within the previous six months. Using this approach, the customer orders which are
not considered in the estimates are left out from the computation in the projections of the
drugs to be procured. Only the limited sales by NMS based on the existing stock, and not the
total needs of the customers as per their orders are taken in account. NMS, therefore, does
not keep enough stock of drugs to meet the customers’ continuous consumption needs. The
in-put data for the needs assessment is, therefore, inaccurate. The effect is seen in the stock-
outs and excessive stock balances of various drugs.
2.3.2.5 Coordination in procurement of drugs between NMS and third parties
The MOUs lack clear terms of coordination related to joint procurement planning. The omission
has led to un-coordinated procurement of drugs which results in duplications of certain drugs
in excess quantities, leading to the expiry of such drugs and causing avoidable storage costs.
It also leads to inadequate provisions for the procurement of fast moving drugs in appropriate
quantities; in which case, NMS fails to meet the demands of its clients.
2.3.3 HANDLING OF EXPIRED DRUGS
2.3.3.1 Sources of expired drugs
The most significant source of expired drugs is NMS, although half of the expiries are from
other sources. Most of the expired drugs are not for the treatment of malaria. The rationale
behind the overstocking of drugs of less common diseases, which ultimately expirs, remains
unclear.
2.3.3.2 Storage of expired drugs
In many health centres countrywide, expired drugs are not well-kept. These expiries end up in
the hands of wrong persons, who re-cycle them after repackaging. This was confirmed by the
National drug Authority inspection reports. The inadequate health infrastructure facilities
country wide, lack of prior planning and guidance from the Ministry of Health on actions to be
48
taken to minimize the expiries and handle the already expired medical products is partly the
problem.
2.3.3.3 Retrieval and destruction of expired drugs
Expired drugs both at NMS premises and at health centres country wide remained for an
average of 6 (six) years without destruction, contrary to the recommended destruction period
of after every six months following write off. The effect is that the expired drugs, if not
properly stored, may cause environmental risks whose consequences might be immense, slow
and long term. Besides, millions of shillings are spent on the storage and the remuneration of
additional human resource to handle expired drugs. The space occupied by the expired drugs
could also be better utilized to store good drugs.
2.4 RECOMMENDATIONS
2.4.1 CAPACITY TO SUPPLY ORDERED QUANTITIES
2.4.1.1 NMS should supply drugs in the quantities ordered by the health centres in compliance with
the Act and avoid supplying drugs not ordered by health centres.
2.4.1.2 NMS should use appropriate data to procure the right type and quantities of drugs to
meet customer requirements.
2.4.1.3 The management of NMS should put in place a system and develop staff capacity for
collection, processing and use of appropriate data for decision-making and in conducting the
needs assessments.
2.4.1.4 NMS should enhance the coordination between the procurement and stores departments to
ensure that appropriate linkage is developed between stock replenishment and the
procurement of drugs.
2.4.2 CERTIFICATE OF DRUG NON-AVAILABILITY
2.4.2.1 NMS should develop quick response mechanisms to avail the certificates of non-availability of
drugs to health centres so that they may save lives by procuring drugs from alternative
sources, which option can only be exercised after NMS has permitted them.

49
2.4.2.2 NMS should consider introducing an efficient and effective drug information inquiry desk to
enable health centres to obtain information on the availability of drugs.
2.4.3 RESPONSE TO CUSTOMERS‟ ORDERS
2.4.3.1 The NMS Management should develop a sales policy benchmarked to best practice in
the industry to stipulate the time for processing and delivery of customer orders. This will
eliminate unnecessary delays in the processing and delivery of drugs to health centres. It will
also compel NMS staff to promptly process customer orders to avoid the negative effects of
the delays.
2.4.3.2 NMS should consider opening regional centres from which customers could personally
collect their individual orders. NMS would then concentrate on replenishing the regional stores
periodically to ensure that no stock outs occur. This will enable NMS to be customer focused at
the regional level, in line with their core value. At the national level the focus will then be
concentrated on replenishing the regional centres as has been the normal practice.
2.4.4 PROCUREMENT PLANNING
2.4.4.1 NMS should place orders to suppliers well in time to ensure that stock is replenished
timely for all categories of drugs and medical supplies.
2.4.4.2 NMS should develop strict monitoring mechanisms to ensure compliance with company policy,
rules and regulations to reduce staff inefficiencies. This should be accompanied with intensive
staff sensitization to enable them to appreciate the benefits of compliance and the
consequences of non-compliance with the set company policies on the core objectives of NMS
as stipulated in the Act.
2.4.4.3 NMS should enhance its capacity to generate annually estimates of national drug needs to
guide them in procuring sufficient quantities to hold in stock and for use by other stakeholders
in accordance with the NMS Act.
2.4.4.4 NMS should step up efforts to address the high staff turnover which reduces the capacity of
the corporation to perform arising from staff being continuously on the learning curve, which
affects performance. A reward and motivation policy put in place by the management is a step
in the right direction.

50
2.4.5 BUFFER STOCK
2.4.5.1 NMS should revise and enforce the buffer stock policy to match the response time from
suppliers so as to avoid stock outs. This would minimize the capital locked in idle stock for four
or two months and release funds to stock other fast moving stocks.
2.4.5.2 NMS should prioritize drug procurement to ensure compliance with the stock replenishment
policy and be in conformity with the requirements of the MOH policy on essential drugs as
stipulated in EMLU, 2007. This policy requires that all items of medicine listed for health centre
levels up to and including Hospitals be available at all times in NMS stores. This will save more
lives which could be lost due to stock outs in health centres countrywide.
2.4.6 STOCK AT NATIONAL MEDICAL STORES
2.4.6.1 NMS should develop a market strategy for their stock of medical products to health
practitioners in health centres in close collaboration with the Ministry of Health. It should take
the form of sensitization programs to help them synchronize their choice of the health
products which patients consume, in line with the drug procurement plan of NMS.
2.4.6.2 NMS should utilize the health and drug information from the MOH and other stakeholders. The
MOH should endeavor to improve the capacity of Health Management Information System
(HMIS) to gather and generate health and drug information that can be effectively shared by
NMS and other stakeholders for appropriate health planning.
2.4.7 STOCK AT HEALTH CENTRE STORES
2.4.7.1 NMS and MOH collectively should advocate for NMS to be mandated and allocated funds
directly to deliver all drugs to the various health centres according to EMLU, 2007 based on
the disease information available with MOH. This will eliminate the diversion of funds to other
non drug items by the health centres. It will also eliminate the complications arising from lack
of capacity by the health units to generate drug procurement plans as well as remove
unnecessary delays in the current drug ordering system. Health units could then order only
drugs not automatically delivered by NMS due to exceptional disease circumstances unique to
the health centres.

51
2.4.7.2 NMS should develop a regular practical drug distribution pattern in the regions so that
health centres can predict delivery times to enable them plan for placing orders to match the
NMS delivery pattern. This will eliminate stock outs in the health centres caused by irregular
supplies by NMS.
2.4.7.3 NMS and MOH should enhance their information sharing mechanisms amongst the
health centres, NMS and Ministry of Health on Health Management Information, particularly
concerning drug usage and stocking positions. This will enhance informed planning by all
parties.
2.4.7.4 NMS should streamline their distribution mechanism to seal the loopholes leading to the
pilferage of drugs during distribution as reflected in the forensic audit report.
2.4.8 NEEDS ASSESSMENT IN PLANNING
2.4.8.1 The NMS management should ensure that all customer needs are catered for and that
data from orders are used (both supplied and not supplied) in carrying out the needs
assessments in procurement planning. This will ensure that NMS avoids stock-outs, under
stocking and minimizes drug expiries.
2.4.8.2 The NMS management should institute controls to check non compliance with the Stores
Management and Operations Manual. This will check the non-commitment of staff in the
implementation of the existing manual. Prompt amendments should be made to operational
manuals to make them relevant in addressing the current challenges instead of circumventing
procedures to handle eminent challenges which are not provided for in the manual.
2.4.9 COORDINATION BETWEEN NMS AND THIRD PARTIES
2.4.9.1 The NMS management should champion the efforts to cause the parties to amend their
MOUs to incorporate joint procurement planning and the sharing of stock position reports to
encourage the stocking of drugs in adequate quantities. This will remove duplicate deliveries,
expiries, stock deficiencies and enhance the coordination of procurement of drugs to satisfy
the common customers.
2.4.9.2 Both parties should use national drugs needs to be provided by the quantification

52
committee of NMS as the basis for the procurement of drugs. They should apportion their
procurement targets to fulfill the customers’ needs. This will address the concern of NMS
regarding its drug procurement planning which has been hitherto distorted by the
unpredictable deliveries by third parties.
2.4.9.3 NMS should advocate for the creation of a forum for all health practitioners and suppliers of
drugs to health centres (NMS, Donors and private pharmacies)28 under the auspices of the
MOH to discuss the challenges of drug supply and utilization at health centres. Issues such as
excessive expiry of certain drug categories, responsibility for the safe management of expired
drugs, national drugs needs assessment, etc could be addressed. At this point each supplier
would know what share of the drugs market their sector controls/commands. This would help
to control the influx of various types of drugs in health centres regardless of need and fix
responsibilities for expiries appropriately. The effectiveness of the policy of availability of
essential drugs at health centres could be discussed in light of frequent stock outs at health
centres.
2.4.10 HANDLING OF EXPIRED DRUGS
2.4.10.1 NMS should undertake a study to establish the circumstances leading to the expiry of some of
the drugs they deliver to health centres yet their deliveries are not of short shelf life.
2.4.10.2 NMS should request MOH to commission a study to establish why other organizations
donate drugs directly to health centres for non-common diseases which later just expire. This
will help to check the intention of dumping drugs destined for expiry into Uganda.
2.4.11 STORAGE OF EXPIRED DRUGS
NMS should use their representation in the Technical Review meeting chaired by MOH to
advocate for MOH to develop planning guidelines on drug usage to minimize expiries and
proper storage of the already expired medical products in health centres countrywide. This
will also help to optimize the usage of the existing health infrastructures.
28 Refer to figure 1, page 13,levels B &C

53
2.4.12 RETRIEVAL AND DESTRUCTION OF EXPIRED DRUGS
2.4.12.1 NMS could take up the responsibility of retrieval and subsequent destruction of the drugs
delivered by them to the health centres as a matter of corporate social responsibility on the
part of NMS, as the single major source of expired drugs in health centres countrywide. This
would be in line with their core value: “corporate social responsibility” and “customer focus.”
They could utilize their available transport system (return trip on delivery) and their proximity
advantage to the Nakasongola Incineration point.
2.4.12.2 Health units should take up the responsibility for the destruction of those expired drugs
procured and donated directly to them; or
2.4.12.3 NMS should appropriately share the cost for the destruction of expired drugs with the
responsible third parties and the health units to destroy the expired drugs piled at the health
units.
2.4.12.4 NMS should use their representation in the Technical Review meeting chaired by MOH,
to advocate for a policy to stipulate the time frequency for the destruction of written off drugs
in health centres. This will provide clear guidelines on how long the expired
drugs could be kept in health units without destruction.
2.4.12.5 NMS should use their representation on the NDA board to advocate for NDA to stipulate
alternative means of drug destruction which may be affordable for Health Units. This is to
address the lack of capacity at the health units to individually dispose of expired drugs
promptly in compliance with NEMA environmental requirements. It would also remedy the
logistical difficulty in accessing the only Ministry of Defence facility in the country located in
Nakasongola and the high cost of drug destruction per ton.
2.4.12.6 NMS should further use their representation on the NDA board to advocate for NDA to
enhance their campaign in sensitizing the health units on the procedure for the destruction of
expired drugs countrywide. This should clearly bring out the fact that destruction must be
done by designated service providers supervised by NDA. This will clarify on the responsible
Authority for the destruction of expiries in health facilities country wide.

54
3 INSPECTION OF PRIMARY SCHOOLS BY THE MINISTRY OF
EDUCATION AND SPORTS
3.1 INTRODUCTION
3.1.1 Motivation
This audit was motivated by the declining standards in schools in the country. The Primary
Leaving Examination results indicate that the failure rate increased from 17% in 2006 to 22%
in 2008. Legislators, while debating the Education Bill, expressed concern that education
standards in rural areas had greatly declined due to “poor inspections.” www.parliament.go.ug
(October 2008).
Source:- UNEB released results.
3.1.2 Statutory Mandate
The MOES has the mandate to develop the standards to be used as a measure of performance
in all schools in the country and to inspect regularly to ensure that these standards are
adhered to. This is in accordance with the provisions in the Education Act 1970 which has now
been repealed by the Education Act 2008.
55
In July 2001, an independent agency, the Education Standards Agency (ESA), was formed to
carry out school inspection activities. The agency was expected to operate as an autonomous
body, but the enabling legislation was never presented to Parliament for approval. In July
2008, following the enactment of the Education Act 2008, ESA was transformed into the
Directorate of Education Standards (DES) in the MOES.
3.1.3 Vision
The MoES Vision is: “Quality Education and Sports for All.”
3.1.4 Mission statement of ESA
“To provide a rational system of setting, defining and reviewing standards and quality of
education and sports and to monitor the achievement of such standards and quality to ensure
continually improved education and sports in Uganda.’
3.1.5 Objectives of ESA
The objectives of ESA are to:
a) Develop guidelines for operations in educational institutions.
b) Develop instruments and quality indicators for assessing standards.
c) Inspect and support supervision.
d) Report on the state of education and provide expert advice on education achievements.
e) Develop learning competencies for lower primary.
f) Develop quality indicators for School Management Committees, and Boards of
Governors.
3.1.6 Financing
ESA is funded mainly by the Uganda Government under MOES and through the 5% UPE
capitation dedicated to primary school inspections at local Government level. In the three
Financial Years under audit (2005/06 to 2007/08), the following amounts were expended by
MOES and ESA.

56
Table 1: Funding for inspection of schools for the period 2005/06 to 2007/08
Financial year
Expenditure of MoES (Ug Shs
Billion)
Funding of ESA
by MoES (Ug Shs
Billion)
5%of UPE funds spent on
inspection of schools (Ug
Shs Billion)
Amount spent on inspection as a
percentage of total MOES expenditure
2005-2006 60.6 0.8 1.6 3.96%
2006-2007 109.7 0.7 1.5 2.01%
2007-2008 140.4 0.8 1.5 1.64%
Total 310.6 2.2 4 .6
Source: - Audited final Accounts, 2005/06 to 2007/08.
- UPE Capitation releases extracted from MOES planning section.
From Table 1, it was noted that there was a decline in the funding of inspection activities in
the period under review, when compared to the trend of financing of the MoES. However,
effective from FY 2008/09, the provision of the 5% UPE deducted for inspections ceased and
the sector now has a shs.2.5 billion inspection fund for district inspection activities. These
funds will be provided to the Districts in form of technical support and managed by the PS
MOES.
3.1.7 Organizational Structure
Headquarters
The Ministry of Education and Sports is directly responsible for the setting of education
standards and monitoring whether these standards are met as required. The body that
managed this function for pre primary, primary, secondary and Business, Technical, Vocational
Education and Training (BTVET) was ESA, for the period under review. The Director ESA
reported to the Permanent Secretary. ESA had its headquarters at Kyambogo.
Regional Offices
ESA has 4 Regional Offices situated at Mbale for the Eastern Region, Gulu for the Northern
Region, Mbarara for the Western Region) and Mpigi for the Central Region. Each region is
headed by a Chief Principal Inspector, and has 10-12 specialized inspectors of languages,
social sciences, mathematics, special needs and sports. The overall coordination of the

57
Agency’s operations, in terms of programs, advice and transmission of collated reports is done
at the centre (HQ).
District Inspectors
Each District has its own staffing establishment of School Inspectors. They are employed by
the Local Government and report directly to the District Principal Inspector of schools, who, in
turn, reports to the District Education Officer and Chief Administrative Officer(CAO). The Local
Government Act 1997, section 97 and 98 and the Education Act, require District Inspectors to
report to the MOES periodically.
3.1.8 Audit Scope
3.1.8.1 Audit objective
The audit was conducted to establish if inspections are carried out and whether they help
enhance the standard of education in schools and make recommendations to address the
challenges.
3.1.8.2 Audit Scope
The audit was conducted on the Ministry of Education and Sports, with specific reference to
the inspection of primary schools covering three financial years (2005/06 to 2007/08). The
audit covered the DES headquarters at Kyambogo, the Regional DES Offices of Mpigi, Mbarara,
Mbale and Gulu, Districts of Mpigi, Wakiso, Kayunga, Mbale, Mbarara, Bushenyi, Gulu, Masaka
DA, Jinja, Gulu MC, Masaka MC and 49 schools within these districts.
3.2 FINDINGS
The audit observations are outlined below:-
3.2.1 Legal Mandate of ESA
ESA is expected to be the lead Agency in ensuring the delivery of quality education services
nationally.

58
The inspection function by the MOES was being conducted by ESA during the period under
review. ESA was intended to be an autonomous agency responsible for carrying out
inspections independently and reporting its findings to the Permanent Secretary of MOES for
approval and follow-up on issues raised. The agency was established in 2001 with the
objective of developing guidelines and assessing standards for operations in educational
institutions. ESA was, however, not given adequate mandate. The legal and operational status
of the ESA remained undefined and the enabling legislation was never presented to Parliament
for approval. We noted further that the ESA consultancy report of 2000 that was to help to
establish the entity was never approved and the management only selected a few of the
recommendations made to guide its operations. Consequently, in July 2008 (after the
amendment of the Education Act 2008); ESA was re designated as one of the Ministry
Directorates and its name changed from Education Standards Agency (ESA) to Directorate of
Education Standards (DES).
The failure to give ESA autonomy was attributed to the improper procedures followed to give
autonomy to the agency, which would require an Act of Parliament; but instead, a cabinet
directive was used as a basis to form the agency.
In the absence of an Act of Parliament, the enabling laws and regulations to help the
operationalisation of the entity were not developed thus weakening its performance as an
independent Inspectorate arm of Government.
3.2.2 Staffing Levels
ESA had an authorized establishment of 68 inspectors in 2007. However, at the time of audit
in 2008, 37 posts (54%) were vacant.
Interviews with key stakeholders revealed that the problem of understaffing was caused by
the inability of ESA to motivate and retain its staff.
The resultant high inspector – school ratio at the national and regional levels made it
practically impossible for ESA inspectors to regularly inspect all the schools, monitor and
coordinate the district inspections.
59
3.2.3 Inspections in Primary Schools
i. Full Inspections
The Handbook for School Inspectors (Monitoring and Supporting Policy), requires a full
inspection to be carried out once a year in every school.
ii. Short/Routine Inspections
The Handbook for School Inspectors (Monitoring and Supporting Policy), also requires that
District Inspectors should develop a plan of action to ensure that every school receives one
short inspection per term.
iii. Follow-up Inspections
As a follow-up initiative, the Handbook requires that once an inspection has been conducted,
inspectors should conduct follow-up visits within 18 months to assist schools in implementing
the recommendations and monitor their progress.
The audit revealed that short inspections were conducted in only 11% of the 49 schools
visited. Furthermore, the districts visited had a total of 3,740 primary schools. Using the
criteria of having 3 inspections per year per school, there should have been 33,660 inspections
conducted per year. However, the review of individual, quarterly and annual reports in those
districts revealed that 787(2%) inspections were made in 2005/2006, 657(2%) in 2006/07 and
1366(5%) in 2007/2008. A graphical presentation is shown in Graph 1.

60
GRAPH 1- EXPECTED AND ACTUAL ROUTINE INSPECTIONS
Source: OAG analysis of routine inspection reports
In regard to follow-up and full inspections, we noted that no such inspections were carried out
in all the 9 districts visited.
Furthermore, of all the 49 schools inspected, we found that despite 185 routine inspections
and 134 flying visits having been carried out in these schools during the period under review,
inspection reports were not presented for verification. The only entities which had reports
were Gulu Municipal Council which had 18 routine inspection reports i.e. (9.73%) and 22 flying
visits (inspection) reports (16.42%)and Jinja district whose inspectors had 33 flying inspection
reports.
Irregular inspections were attributed to low staffing levels of inspectors, inadequate
supervision and monitoring of inspectors and also inadequate provision of logistics to carry out
the inspections.
Respondents from the interviews conducted indicated that inadequate inspections resulted into
laxity in attendance by both teachers and pupils resulting in high levels of absenteeism among
the teachers and pupils, conflicts in schools, teachers’ underperformance and low syllabus
coverage hence poor performance in schools.

61
3.2.4 Dissemination of Inspection Findings and Reporting Frequency
An inspector is required to make a summary of observations immediately an inspection is
carried out and to leave a copy at the school. From this, a consolidation of reports is made into
monthly, quarterly and annual inspection reports which are distributed to stakeholders.
According to the School Inspectors’ Handbook, the Education Officer In-charge of Education in
the Local Government is supposed to prepare and provide quarterly inspection reports which
are consolidated into half-yearly and annual reports and disseminated to the Chief Executive
and Council standing committees on Education.
The Chief Executive Officer is supposed to give out copies to ESA Headquarters, ESA regional
offices and MOES. These reports are intended to provide input in policy formulation and
planning at national level and data to the inspection data bank.
Districts and municipalities did not adequately prepare annual and quarterly reports as
required above. Mbale district, having prepared 3 annual reports and 8 quarterly reports (2, 2
and 4 in 2005-2006, 2006-2007 and 2007-2008 respectively), is the only district out of 11
districts and municipal councils visited that prepared all annual and some quarterly reports on
the inspections carried out, representing 9% of the districts and municipal councils visited.
Only two of the eleven districts and Municipalities visited (18%) prepared annual reports to the
executive over the period under review. These were Mbale (3 annual reports) and Mbarara (2
annual reports). No DES regional office prepared quarterly reports.
This was attributed to Inspectors’ failure to carry out any inspections thus making it impossible
to prepare reports when inspections have not been done; and lack of awareness of the
requirement to prepare these reports.
In the absence of these reports, MOES may formulate policies on schools without adequate
information from the majority of the schools.
3.2.5 School Improvement Plan
According to the Framework for School Inspectors developed by ESA, inspections are
supposed to culminate into the production of a School Improvement Plan (SIP). It is the

62
responsibility of the CAO, DEO, CCT, in liaison with DIS and Head teachers to assist schools in
developing and implementing improvement plans aimed at addressing issues raised in the
inspection report.
In all the schools visited, none had prepared a School Improvement Plan.
Schools had not prepared school improvement plans because head teachers lacked the skills to
prepare them and, in addition, they had not been guided by the inspectors. 73% of the
schools visited, reported that inspectors had not guided them on how to prepare SIP at the
end of the inspection process.
In the absence of a SIP, the follow-up on recommendations becomes difficult.
Management response
According to DES, one of the major steps in the development of a SIP is evaluation
(both internal and external) in order to identify key areas of strength and
weakness; and what needs to be done for improvement. While external evaluation
is provided by inspection, internal evaluation is done by the school community
(DES developed and disseminated Self – Evaluation Tools to this effect). There are
also other responsibility centers e.g. CCT, DEO, DIS, and Head teachers who should
also be held accountable.
3.2.6 Monitoring and Evaluation of Inspectors
The Handbook for School Inspectors (Monitoring and Supporting Policy), requires District and
Municipal Councils to develop an action plan for districts and municipal councils to monitor and
evaluate the performance of inspectors annually.
Although 48% of DEO’s and chief executives interviewed stated that inspector’s performance
was evaluated through a review of inspection reports, there was no evidence to confirm that
inspectors were monitored and evaluated.
This was caused by lack of awareness on what is required of DEOs and CAOs to enable the
enforcement of such procedures.

63
In the absence of proper monitoring and evaluation, weaknesses in the inspection process
remained undetected.
3.2.7 Inspection Work Plans
The Handbook for School Inspectors (Monitoring and Supporting Policy), requires District
Inspectors to develop annual and quarterly work plans to ensure that every school receives
one short inspection per term.
We noted that 64% of Districts and Municipal Councils visited had prepared the annual work
plans while 36% had not. 29% of those with annual work plans had not broken down their
work plans into quarters .
The explanation given by the Inspectors for failure to prepare work plans was that inspection
activities depend more on the amount of money made available by Local Governments and
ESA regional offices. However, from our point of view, failure to prepare annual and quarterly
work plans was due to the laxity of inspectors.
Inspections could, therefore, not be carried out in a planned manner in the absence of
approved work plans.
Management Response
However, according to the Ministry of Education and Sports, whereas it was a big
challenge during the period under review, the MOES registered marked
improvement since the financial year 2008/09. With the institution of the “
Inspection Cycle” and new Guidelines, the MOES hopes for a better performance.
3.2.8 ESA Monitoring Quality of Service Provided by District Inspectors
The Handbook for School Inspectors (Monitoring and Supporting Policy), required District
Inspectors to work with ESA in partnership and collaboration. In addition, ESA had the
responsibility for monitoring the quality of service provided by Inspectors at District level and
building their capacity as provided by the Local Government Act of 1997, section 97 and 98.

64
There was limited supervision or monitoring by ESA in the Local Governments during the
period under review. In addition, the evidence availed shows that there was very limited
formal interaction between the ESA and the district inspectors in form of workshops, joint
inspections or meetings during the period.
This was attributed to lack of monitoring capacity by ESA in terms of personnel, funding and
logistics to enable the monitoring to reach the desired levels.
Limited partnership and collaboration between ESA and District Inspectors has affected the
quality of service in inspections. The benefits that could have been derived from the joint
efforts could not be realized and, therefore, the policies made by ESA for national
development may not consider the findings from the district inspections.
Management response
DES attributed these shortcomings to the challenges stemming from inadequate
authority to deal directly with the District/Municipal Inspectors of schools in
accordance with the Local Government Act 1997. ESA, however, conducted
capacity building activities and joint inspections, where Local Government
Inspectors are brought on board using the Associate Assessors Model. ESA also
instituted a District Focal Officer System for ease of coordination, partnership and
collaboration.
According to DES, Primary Education is a decentralized service (Local Government
Act 1997). Whereas DES has a role to play, the biggest responsibility lies mainly
on the Local Government Inspectors of Schools.
3.3 CONCLUSIONS
3.3.1 The Legal Mandate of ESA
The absence of the enabling law at the time had a negative impact on the strategies designed
to achieve the vision, mission and objectives of ESA which may have led to the decline in the
education standards in primary schools.

65
3.3.2 Staffing Levels
With a low staffing level, the operations of the Unit could not have been conducted at desired
levels since a number of schools were not inspected thus leading to poor education standards
in schools.
3.3.3 Inspections In Primary Schools
The objectives of the inspections could not be attained in the event of inadequate inspections.
3.3.4 Dissemination and Frequency of Reporting Inspection Findings
In the absence of monthly, quarterly, half yearly and annual inspection reports, policy makers
at the national level lacked the input of such reports from local governments to provide an
input in planning and policy formulation.
3.3.5 School Improvement Plan
In the absence of SIP, subsequent inspections will have no basis of measuring the
improvements made and the schools’ administrations may fail to mitigate the ever increasing
challenges; and thus decline in the overall standards in schools.
3.3.6 Evaluation and Monitoring of Inspectors
In the absence of the required level of awareness of the evaluation process, the identification
of weaknesses and strengths in the inspection process, which is critical in planning,
implementation and reporting by inspectors cannot be done. The quality of the inspections
done may therefore not measure up to the desired standards. The quality of education in the
country and the minimum standards in schools would continue to be poor.
3.3.7 Inspection Work Plans
Coordinated and comprehensive inspections are not possible in the absence of approved work
plans.

66
3.4 RECOMMENDATIONS
3.4.1 The Legal Mandate of ESA
It is noted that the Education Act 2008 transformed ESA into a Directorate of Education
Standards in the MOES. The legal status of the directorate is now defined and clear.
3.4.2 Staffing Levels
For effectiveness in service delivery, DES should request to carry out a comprehensive
human resource audit to meet the requirements from the ever increasing number of
schools in the country. The current establishment is based on the 2001 consultant’s
report whose considerations could have been overtaken by events. The MoLG, MoES and
DES through the Ministry of Public Service, and the districts should advocate for the
recruitment of adequate inspectors to ensure that the number of inspectors is in tandem
with the population of schools.
In addition, MOES should put systems in place to motivate and retain the inspectors.
3.4.3 Inspections in Primary Schools
DES should regularly conduct workshops and seminars for all its staff, district inspectors
and administrators to remind them of their roles in improving education standards so
that planning and carrying out inspection on schedule becomes a habit. This would also
enable continuous professional development of the inspectors.
The Directorate should prepare and have a strategic plan for school inspections which
should be properly costed. The strategic plan should have short, medium and long term
strategies on improving inspections in schools in the country. Once the strategic plan is
adapted, it should be reviewed annually and action points drawn to enable the
achievement of the strategy.
3.4.4 Dissemination and Frequency of Reporting Inspection Findings
Inspectors should provide an immediate feedback to every school inspected and an
inspection report shortly after inspection.

67
DES should compile and disseminate regular reports on the quality of education and the
state of education standards to relevant stakeholders. This is the core objective for
which the department exists therefore efforts should be made to ensure that the
information given out is comprehensive and represents the population.
DES should make it mandatory for inspectors at all levels (district, regional offices and
DES headquarters) to prepare monthly, quarterly, bi-annual and annual inspection
reports. These reports should be consolidated at the regional level as well as at the
headquarters. Cross-cutting issues and those demanding the action or the attention of
the stakeholders should be clearly highlighted in these reports.
DES should create a data bank for all its inspection reports for easy storage and
retrieval.
3.4.5 School Improvement Plan
Head teachers should be trained and guided by the inspectors on how to develop SIPs.
3.4.6 Evaluation and Monitoring of Inspectors
DES, through the Ministries of Education and sports, and of Local Governments should
develop operational guidelines for evaluating and monitoring inspectors. This will be in
line with the Local Government Act of 1997, section 97 and 98 which gives powers to the
DES to monitor and evaluate inspectors of districts.
DES should train and equip district administrators with the skills of measuring the
performance of inspectors.
Evaluation and monitoring of inspectors should be done at specified intervals and should
be properly documented. These intervals should be regular to improve inspector’s
performance.
Other key players in the primary school inspection system should be held accountable for
their omissions or commissions. The directorate should liaise with District authorities to
adapt results oriented methods of management.
3.4.7 Inspection Work Plans The Directorate, together with the District inspectors, should develop annual and quarterly
work plans to ensure that every school is inspected during the term and put control measures
to ensure that work plans are prepared.

68
4 PENSION PROCESSING BY THE DEPARTMENT OF COMPENSATION:
MINISTRY OF PUBLIC SERVICE
4.1 INTRODUCTION
4.1.1 Motivation
Pension is a very important component of the terms and conditions of service in the Public
service. Public officers on retirement are entitled to receive pension that is commensurate
with their ranks, salary and length of service. The payments should be prompt, regular
and easily accessible to the pensioners29. As stated in the Clients’ Charter and amplified in
the Public Service Pension Management Information Manual, April 2000, new retiring
officers should access the pension payroll within 6 months from the date of
commencement of pension processing. On the contrary however, it takes on average 23
and 30 months for traditional civil servants and teachers respectively to access the
pension payroll. These delays have resulted into the accumulation of pension arrears,
which stood at Shs.128 billion at the beginning of the 2008/2009 financial year30.
It is against this background that a Value for Money (VFM) audit was conducted in the
Ministry of Public Service (MoPS), Compensation Department, to examine the time a
retired officer takes to access his/her pension benefits; the underlying causes for the
delay; and to make recommendations for improvement.
4.1.2 Description of the Audit Area
Pension is managed by the Department of Compensation in the Ministry of Public Service
(MoPS). The Compensation Department handles the pension schemes for the traditional
public service, the teaching service, the defence and the former employees of the defunct
East African Community (EAC). MoPS operates a defined pension benefits scheme which is
29 The Constitution of Uganda, Article 254 (1) and (3) 30 The MoPS Ministerial Policy Statement and budget estimates for 2009/2010

69
computed on the basis of the annual salary before retirement and the total number of
completed months of service, up to a maximum of 435 months31.
4.1.3 Mandate
The Department derives its mandate from the 1995 Constitution of the Republic of
Uganda (Article 254), which states that “A public officer shall on retirement receive such
pension as is commensurate with his or her rank, salary and length of service; The
pension payable to any person shall be exempt from tax and shall be subject to periodic
review to take account of changes in the value of money; The payment of pension shall
be prompt and regular and easily accessible to pensioners”. This mandate is amplified by
the Pensions Act (CAP 281), Armed Forces Pension Act (CAP 298), The Public Authorities
Provident Fund Act (CAP 291) and the Pension Policy.
4.1.4 Vision and Mission
The Compensation’s Department does not have a Vision and Mission of its own but shares
that of MoPS.
Vision
“To develop a Public Service that is loyal, professionally competent, well motivated and
facilitated to support the transformation of Uganda into a modern state”.
Mission
“To develop policies, systems and structures that facilitate efficient and effective public
service performance for national development and improved quality of life in Uganda”.
4.1.5 Objective
The objective of the Compensation Department is “To ensure a fair, equitable, transparent
and prompt system of computation and payment of pension and other terminal benefits”.
4.1.6 Activities of the Compensation Department
The activities include32:- Receiving and approving pension and gratuity applications;
Verifying and assessing pension and gratuity applications;
31 Pension regulation 25 32
The Public Service Pension’s Management Information Manual, April 2000

70
Paying pension and gratuities;
Other activities are:-
Budgeting for pension and gratuities;
Receiving and maintaining pension records and data;
Receiving and answering pension related inquiries and complaints;
Providing technical support to other pension centres;
Monitoring the pension performance of pension policies, programmes, and
procedures to ensure that they meet desired objectives;
Planning and executing pension and retirement awareness programs.
4.1.7 The Organisational Structure
The Ministry comprises the Minister of Public Service assisted by Minister of State for
Public Service33. MoPS has five entitled officers; Deputy Head of Public Service and
Secretary for Administrative Reform, the Permanent Secretary (PS) who is the Accounting
Officer and three Directors responsible for Human Resource Management (HRM),
Efficiency and Quality Assurance (EQA) and Research and Development (R&D).
The mandate of the Ministry is implemented by nine Departments which fall under the
three directorates. The Department of Compensation which falls under the directorate of
Human Resource Management (HRM) is headed by a Commissioner.
4.1.8 Funding
The pension budget is entirely funded by the Government of Uganda (GoU). Funding for
the three financial years under study was as follows:-
Table 1: Pension releases in the financial years 2006/07 - 2008/09
Financial Year Pension Releases Total Shs.
Recurrent Shs. Arrears Shs.
2006/07 78 billion 42 billion 120 billion
2007/08 78 billion 186 billion 264 billion
2008/09 78 billion 101 billion 179 billion
Source: OAG analysis of IFMS Reports
33
MoPS Ministerial Policy Statement and Budget estimate for 2009/2010

71
4.1.9 Scope
The study was carried out in MoPS, Compensation Department and focused on the time it
takes the newly retired traditional public servants and teachers to access pension benefits.
The study considered a period of three financial years from 2006/07 to 2008/09.
4.2 FINDINGS AND CONCLUSIONS
4.2.1 Processing Time
Overall Processing Time
The Public Service Pension Management Information Manual, April 2000 and the Clients’
Charter state that new retiring officers should access the monthly pension payroll within 6
months as shown below:-
Table 2: Expected time of processing pension claims
No. Activity Processing Time
1 Receiving and Approving (acknowledge) Pension
Applications
2 weeks
2 Verifying and Assessing pension 1 month
3 Pension’s payment 3 months
4 Weekends (2 days* 4 weeks* 6 months) 1½ months
Total 6 months
A review of 135 files of the retired officers receiving pension revealed that it took on an
average 23 and 30 months for the traditional civil servants and the teachers respectively
to access the pension payroll from the time the pension process commenced in a three
year period from 2006/07 to 2008/09 as detailed in table 3 below.

72
Table 3: Summary of analysis of pension processing time (months) for
pensioners on the payroll Financial Years Pension Categories
Traditional Civil Servants
(Processing period in Months)
Teachers
(Processing period in Months)
2006/07 22 22
2007/08 28 38
2008/09 18 31
Average 23 30
Source: OAG examination of selected pension files
The teachers took longer (30 months) than the traditional civil servants (23 months) to
access the pension payroll. Teachers take longer compared to the traditional civil servants
because the traditional civil servants have access to information regarding pension
procedures and therefore apply earlier. It was also noted that the teachers registration
certificates have to be authenticated by the MoES before verification commences and this
takes a longer time compared to that of the traditional civil servants.
The longest delay was noted during the financial year 2007/08 where traditional civil
servants and teachers experienced delays of 28 and 38 months respectively. There was
more improvement in the time taken to access pensions by traditional civil servants and
teachers in the financial year 2008/09 compared to the financial year 2007/08.
Scrutiny of the internal assessment report on the “Process Analysis of the Pension
Management System” also revealed that pension processing was taking on average
two years and seven months.34 Interviews with the staff of MoPS involved in pension
processing also confirmed that on average it takes between 2-3 years to process a
pension claim.
The information availed by management on the Pension Information Management System
(PIMS) revealed that there were a total of 31,497 pensioners (both traditional civil
servants and teachers) entered in the system by the time of audit (24th March 2010).
34 Procedure narrative for Pensions Assessment

73
Of these, 2,428 had not accessed the monthly pension payroll due to delays in the
processing system.
Table 4: Traditional civil servants and teachers entered in the PIMS
Category
Status Traditional civil
servants
Teachers Total
On Payroll 17,721 11,348 29,069
Not on Payroll 1,938 490 2,428
Total
Pensioners
19,659 11,838 31,497
Source: Extraction by Systems Analyst from PIMS, 24th March 2010
The above delays were attributed to the following:-
Communication of queries
We observed that the MoPS lacked a communication strategy to promptly disseminate
information on queries raised during pension processing to the Ministries/departments and
applicants and thus delaying feedback. Action on queried files is suspended until the
issues raised have been responded to by the relevant Ministries/ Departments or retired
officers. Queries are answered by retired officers only when they next visit MoPS because
that is when they get to learn of the queries raised, which compounds the delay.
Management response:
The Ministry has improved communication with clients by setting up a pre
verification unit. MoPS currently runs awareness programmes on TV, radio and
conducts sensitization visits in the districts.
Using a checklist, the cases of incomplete submissions are rejected at this level
and handed back to the submitting officers. Any subsequent queries are
submitted to the submitting accounting officers who are required to answer.
Communication between MoPS and the Accounting Officers will further be
strengthened.

74
Utilization of existing records
The MoPS maintains the personal files containing employment records for all public
officers which may be used to commence timely pension processing. However, MoPS does
not make use of these records. We noted that retiring officers are required to furnish
copies of their records on application for pension, leading to delays to commence pension
processing.
The interview with the pension association executive members confirmed that they are
asked to furnish employment records because the HRM departments at both the MoPS
and the mother ministries/departments do not maintain up-to-date records in the
employee personal, files leaving the pensioners with only the option of traveling back to
their homes to look for copies, which takes time, leading to delay.
Management response:
The verification and processing of a pension claim requires that a public officer
has been in the post and active on payroll. We also need evidence that one has
no outstanding debts with Government and that one is retiring on a
pensionable status. In addition, the Ministry does not maintain central records
on non-gazetted police, prison officers and teachers yet they constitute more
than 50% of the Ministry‟s clientele.
Record management system
The MoPS does not have a centralized file tracking and retrieval system where all pension
file movements are recorded and monitored. This made the locating of pension files
cumbersome and delayed decision-making during pension processing. Audit further
revealed that action officers kept queried files in their offices until the pending
queries/issues are resolved which compounds the problem of records management.
Pension Information Management System (PIMS)
The MoPS uses PIMS to manage its pension processes. We noted that the system could
not be relied on to provide adequate information, such as names of persons approving,
authorizing, assessing and the dates of approval, authorization, and assessment which
could have been used to identify the staff who are not carrying out their duties on time

75
and therefore institute timely corrective measures. This was evident in the financial year
2006/07.
In addition, the audit established that the system did not put to use the inbuilt check
mechanisms of rejecting the processing of incomplete records making them prone to
abuse. It is only in 2008 when the inbuilt checks were activated after the insistence and
refusal of the Compensation Department to process incomplete records.
It was also noted that the PIMS entered pensioners who did not furnish bank details and
those who did not qualify for monthly pension in a file referred to as “paying stations”.
These have not been separated to remove all those who do not qualify for payment.
Qualifying pensioners who have not furnished bank details have also not been identified
and informed to do so. This is prone to abuse.
Efforts to ascertain the PIMS’ design, cost and functionality were futile because
management failed to locate the procurement file.
Discussion with management revealed that they have been upgrading the system (PIMS)
due to its inefficiencies and, as a result, management are in advanced stages of procuring
another processing system, Integrated Personnel and Payroll System (IPPS), to address
the existing challenges.
Management response:
The situation was true for claims that were verified and approved before April
2008, when the process of verification, approval and tracking of claims by the
HRM department was manual. Since then, all claims are verified, approved and
assessed on line.
Workflow
Through audit observation and interviews of staff of the MoPS it was noted that the delay
in pension processing was also caused by interruptions by pensioners. Pensioners move to
various offices requesting for information on the current status of their claims which is not
satisfactorily given at the inquiries desk. As a result, staff take time attending to
pensioners even when they do not have the appropriate information.

76
Management response:
A one-stop centre was established to give clients information on the status of
claims but they still move to offices. The centre will be strengthened to give all
the necessary information to pensioners about the queries raised during
verifications and payments.
Besides the general causes of delay to access the pensions’ payroll stated above, the audit
also noted some specific causes associated with the various stages processing as
described below:-
4.2.2 Receiving and Approving Pension Application Forms
Applications for pension should be received and acknowledged by the MoPS PS within 2
weeks from the date of receipt35.
From the selected files in the three year period (2006/07, 2008/09 and 2008/09), it took
the PS an average of 13 months and 16 months to acknowledge pension applications of
traditional civil servants and teachers, respectively, as shown in the following table:
Table 6: Time taken (months) by PS to acknowledge pension
applications
Financial
Years
Pension Categories
Traditional Civil Servants Teachers
2006/07 13 14
2007/08 15 20
2008/09 12 13
Average 13 16
Source: OAG analysis of selected pension files
The audit attributed the delay to acknowledge pension applications by the PS to lack of
time limits allocated to sub activities carried out before the submission of application
forms to the PS. The absence of time limits affects effective monitoring and supervision of
35 The Public Service Pensions Management Information Manual April 2000

77
the activities carried out by officers. Officers take time to file application letters and
documents in a CP file (for traditional public servants) or subject matter file (for teachers).
Management‟s responses:
Setting of time limits for the sub activities carried out prior to the submission
of application forms to the PS will be considered. Pension application forms are
now submitted to the PS for approval every Wednesday and take one week to
be signed.
The delay to acknowledge pension applications resulted in the delay to commence the
verification process in the HRM department and therefore affects the total processing time
of pension claims.
Conclusion
The acknowledgement of pension applications is critical in pension processing. Delay
therefore in acknowledging pension applications affects the time it takes to process
pensions.
4.2.3 Verification and Assessment of Pension claims
Pension claims should be verified and assessed within 1 month from the date of
acknowledgement .
The reviewed pension files did not indicate the dates and results of the verification
exercise, making it difficult for the audit to establish how long files were taking to be
verified. In addition, the dates of approval by C/HRM in the PIMS during the financial year
2006/07 were completely missing and in the financial years 2007/08 and 2008/09 could
not be relied on because C/HRM was approving before acknowledgement by PS, which
was found to be irregular.
However interviews of senior managers of MoPS and a review of the MoPS’ internal
assessment report on the “Process Analysis of the Pension Management System”
revealed that it was taking an average of 14 months to verify and assess pension files.
Out of this, verification accounted for 12 months while assessment took 2 months.

78
The delay in the HRM department was attributed to the long verification time caused by
slow response by the retired officers to the queried pension applications. Queries are
mostly raised regarding the absence of letters of appointment, promotion or confirmation
and the retired officers have to refer back to their mother ministries/departments for
copies.
Management response:
MoPS has set up a pre verification unit which carries out initial checks of
pension applications against a checklist and pensioners are immediately
informed of any missing documents. This has reduced the queries raised
during verification.
The audit further noted that apart from the role of verifying pension files, the HRM
department also handles other core roles of recruitment, appraisal, promotion and training
of staff in the entire public service and these take priority as compared to verification of
pension files. Failure to give appropriate attention to pension verification, yet the
Compensation Department is dependent on the HRM Department, delays the assessment
process.
Management response:
The verification unit has been strengthened by recruiting additional staff to
specifically handle pension verification in the HRM Department and produce
monthly status reports on the number of cases received, verified and queried.
The assessment unit also reports to C/Comp the cases received, assessed, sent
to and queried by audit.
In addition a meeting between the departments of Compensation and HRM was
convened to strengthen the verification activities and the two departments
now meet monthly to review work progress and challenges.
The slow response to queries and paying less attention to the verification of pension files
by the HRM Department leads to delayed assessment and eventual authorisation of access
to the pension payroll.

79
Conclusion
MoPS delayed the verification and assessment of pension files and this had an impact on
the whole pension processing time.
4.1.4 Payment of Pensions
Payment of Pension should be effected within 3 months from the time of authorization by
the Commissioner of Compensation36.
We observed that it took on average 8 months and 9 months for traditional civil servants
and teachers, respectively, in the financial years 2007/08 and 2008/09 to access pension
from the date of authorization as shown in the table below:
Table 7: Average time (months) taken by pensioners to access the
Pension‟s payroll.
Financial Years Pension Categories
Traditional Civil Servants Teachers
*2006/07 - -
2007/08 9 10
2008/09 7 7
Average 8 9
Source: OAG analysis of selected pension files and MoPS‟s PIMS, 25th August 2009
*2006-07 : Average time taken for pensioners to access the pensions payroll could not be
determined due to missing data in the PIMS ie authorization dates.
Management attributed the delay to access the pensions’ payroll to insufficient funding
under the defined benefit scheme which is entirely dependent on budgetary provisions
from MoFPED which fell short of the funds requisitioned and therefore could not cater for
the entire Department’s pension liability as shown in the following table:
36
The Public Service Pensions Management Information Manual, April 2000

80
Table 8: Pension funding position for traditional civil servants and
teachers in the financial years 2006/07- 2008/09
Source: Approved budgets and OAG analysis of IFMS Reports
Management response:
Releases from MoFPED have been falling short of the approved amounts in the
budget and as a result pension reforms were initiated by MoPS in collaboration
with other stakeholders towards the introduction of a contributory pension
scheme.
The PS/ST has also promised to fully fund annual pension bills and officers will
be paid their pension benefits as soon as they retire with effect from 1st July
2010.
Besides inadequate funding, audit revealed that MoPS’s method of budgeting for pension
was wanting. Projections of pensioners likely to retire at a given period of time that forms
the basis for budgeting were never made. Management arbitrarily estimates the pension
figures that do not reflect the true financial requirement of pension the scheme. The
analysis of the Ministry’s budgeted arrears figures for all pension categories, considering
2005/06 as a base year, showed inconsistencies due to failure by the MoPS to prudently
forecast pension requirements.
For example, in 2005/06, the MoPS had opening balance of pension arrears of Shs.320.7
billion. Given the pension bill of Shs.108 billion and actual expenditure of Shs.100.4 billion
in the same year, the closing arrears would have been Shs.328.3 billion. This closing
balance is also the opening balance for 2006/07 which, if applied in the computation,
results into closing arrears of Shs.323.3 billion for the year and not Shs.284.4 billion as
reflected in the Ministry’s Policy Statement. Table 9 shows that the Ministry has been
Financial
Years
Budget
Submissions
Actual Release Under funding
2006/07 98 billion 68 billion 30 billion
2007/08 102 billion 68 billion 34 billion
2008/09 102 billion 68 billion 34 billion

81
under budgeting in the financial years 2006/07, 2007/08 and 2008/09 by Shs.38.9 billion,
Shs.10.3 billion and Shs.34.4 billion respectively.
Table 9: Annual analysis of Arrears
YEAR 2005/06
Billion Shs
2006/07
Billion Shs
2007/08
Billion Shs
2008/09
Billion Shs
Arrears *320.7 328.3 323.3 202.5
Current Year
pension bill
108 122 144 152
428.7 450.3 467.3 354.5
Actual
Expenditure
100.4 127 264.8 192
Arrears c/f 328.3 323.3 202.5 162.5
Arrears as at
Year End
2006/07 2007/08 2008/09
Auditors’
Analysis
323.3 202.5 162.5
Ministry’s
Budget Figure
(Policy
Statement)
284.4 192.2 128
Under
Budgeting
38.9 10.3 34.5
*Assumption: Opening arrears of Shs. 320.7 in 2005/06 Policy Statement is correct.
Management response:
In preparing the estimate for pension budget, the assumptions used by the
ministry include past performance for payment of death gratuities, the number
of officers due to retire on mandatory grounds and the projected salary
increases for the forthcoming financial year. Due to the budget ceilings given
by MoFPED, pension is under provided for in the approved budget.
Further analysis of the submissions made to both Parliament and MoFPED revealed that
MoPS submitted different figures of arrears yet the two submissions are meant to be the
same given the fact that the same situation is being reported on as shown in the table
below:

82
Table 10: Arrears Submission to Parliament and MoFPED
YEAR 2005/06 2006/07 2007/08 2008/09
Arrears (Policy
Statements)
320.7 284.4 192.2 128.0
Arrears Submission to
MoFPED
282.1 298.0 254.4 100.3
Variance 38.6 -13.6 -62.2 27.7
The inconsistency in the figures casts doubt on the correctness and reliability of the
ministry’s budgeted figures.
The executive members of the Uganda Government Pensioners’ Cooperative Society Ltd,
an umbrella organization of pensioners, attributed the limited funding to failure by
Government to provide for the pension fund in accordance with the Pensions Act, Section
7(1) which states that “all pensions, gratuities or other allowances shall be
charged on and payable out of the Consolidated Fund without further
appropriation than this Act”. and as a result MoPS treats pension as a contingent
rather than a commitment.
Further analysis of funds utilisation also revealed that the funds released by MoFPED to
cater for the various pension categories were being diverted from one category to others.
This delays the payment of pension in the category whose funds have been diverted, for
example, in the period under review, management, diverted teachers’ pension of Shs.12
billion. According to the management such diversions are done to cater for payments of
other pension categories. For example, Shs.3 billion was diverted from other categories to
pay the traditional civil servants. Details as per the following table:

83
Table 11: Pension releases against the Actual Bank payments for Traditional
Civil servants and Teachers for the financial years 2006/07- 2008/09
Recurrent
Traditional Civil servants
Financial Year Actual Releases Actual Payments Variance
2006/07 40 billion 41 billion (1 billion)
2007/08 41 billion 43 billion (2 billion)
2008/09 41 billion 41 billion Nil
Total 122 billion 125 billion (3 billion)
Teachers
2006/07 28 billion 23 billion 5 billion
2007/08 27 billion 23 billion 4 billion
2008/09 27 billion 24 billion 3 billion
Total 82 billion 70 billion 12 billion
Source: Approved budgets and OAG analysis of IFMS Reports
Management response:
Monthly pension payments are the priority pension expenditures. Money was
therefore moved from teachers‟ monthly budget to beef up Traditional civil
servants and UPDF widows where there were shortfalls.
Insufficient funds release by MoFPED coupled with improper budgeting, failure to comply
with the Pensions Act and diversion of pension funds lead to limited funds available to
settle pension bill, which in turn leads to delay to access pension as evidenced by the
piled pension files in the accounts department which are pending payment.

84
Picture 2: Verified and Assessed pension files pending payment, taken on 15th October
2009
Delay to access pension affects the retired officers’ livelihood thereby making them
frustrated and some of them not accessing pension in their lifetime.
Conclusion
There is insufficient funding by Government towards the settlement of pension liability as
it falls due, leading to accumulation of pension arrears.
Effect of Delayed Processing of Pension
The general delays stated above led to failure by retired officers to provide for themselves
and their families leading to increased dependency burden, distress, frustration and
demoralization.
General Conclusion
Delayed access to pension leads to the violation of the pensioners’ rights enshrined in the
National Constitution, Article 254 (3) which states that, “the payment of pensions shall be

85
prompt, regular and easily accessible to pensioners.” and as a result Government in
general and MoPS, in particularis being viewed by the populace as inefficient and
indifferent to the plight of pensioners.
4.3 RECOMMENDATIONS
To reduce pension processing time, the audit recommends as follows:
4.3.1 Overall Processing Time
Management should consider developing a communication strategy that allows for
prompt dissemination of information to Ministries/ Departments and retired officers
when queries are raised during the processing of pension claims so as to enable
immediate action and follow up thus reducing on the processing time.
The MoPS and HR sections of ministries/departments should keep existing
employment records in the personal files up-to-date and use them when needed to
commence timely pension processing instead of retired officers having to furnish
the information.
The MoPS should collaborate with MoES to have teachers registration certificates
authenticated before pension applications are submitted to MoPS.
Management should hasten the procurement and installation of the IPPS and
should ensure that during the design, installation and testing phases, user
requirements are taken into consideration and that the system has an integrated
internal audit module.
The MoPS should put in place a proper records management system which enables
easy filing and retrieval of pension records whenever they are required and
ensure that information is regularly entered in the PIMS so as to enable ease of
monitoring of the staff involved in pension processing and to ensure that they
execute their roles within the set time period so as to reduce on processing time.
86
Delete all the pensioners on PIMS (paying stations) who do not qualify for drawing
monthly pensions and notify the qualifying pensioners who have not yet furnished
MoPS with bank accounts.
4.3.2 Receiving and Approving Pension Application Claims
Management should set and enforce processing time limits for sub activities in the
central registry within which officers should receive and forward application files to
the Permanent Secretary (PS) for approval.
4.3.3 Verification and Assessment of Pension claims
HRM departments at both MoPS and mother ministries/departments should
maintain up-to-date employment records in employees’ personal files to avoid
referring to retiring officers when letters of appointment, promotion or
confirmation are required for verification.
The Directorate of HRM in MoPS should reorganize its departments to ensure that
all departmental activities are accorded appropriate attention and that they work in
harmony to achieve the objectives of the Directorate.
Management of MoPS should establish a specific pension information and query
desk that should be equipped to attend to pensioners’ requests in order to avoid
pensioners moving from one office to another searching for information and
disrupting action officers.
4.3.4 Payment of Pension
Management should expeditiously pursue the recommendations put forward
towards establishing the contributory pension’s scheme which should address the
recurrent under funding problem in the Department.
MoPS should periodically make realistic projections during budgeting for pension
and ensure that the same information is furnished to Parliament, MoFPED and
other stakeholders to enhance the acceptability of budget requests and for better
decision making.

87
MoPS should prepare and present pension estimates to Parliament in accordance
with the Pensions Act, Section 7(1) which requires pensions, gratuities and other
allowances to be charged on and paid out of the Consolidated Fund without further
appropriation. This will improve Government commitment and availability of
pension funds.
MoPS should continue persuading MoFPED to always release funds as approved by
Parliament.
MoPS should ensure that all pensioners are paid through the bank accounts so as
to reduce the possibility of misappropriation of funds.
MoPS management should spend pension funds in accordance with the Treasury
Accounting Instructions (TAI’s) and Financial and Accountability rules and
regulations that prohibit the diversion of funds.

88
5 PROVISION OF BASIC NECESSITIES TO PRISONERS
BY UGANDA PRISONS SERVICE
5.1 INTRODUCTION
5.1.1 Background to the Audit:
This Value for Money audit on the provision of basic necessities by Uganda Prisons Service has
been conducted in accordance with Article 163(3) of the Constitution of the Republic of
Uganda. This mandate is amplified under Section 21(1) of the National Audit Act 2008 which
requires the Auditor-General to carry out value for money audits for purposes of instilling
economy, efficiency and effectiveness in the operations of any department or ministry.
Motivation:
The study was motivated by public concern about the provision of food, clothing and medical
care to prisoners in Uganda. The prisoner population in Uganda has been on the increase over
the past years from 900037 in 2005 to the current 32,00038 prisoners in June 2009. This poses
a challenge to the provision of basic necessities, which, ultimately affects the general living
conditions of prisoners.
The provision of inadequate basic necessities to prisoners is a threat to their lives as they have
no alternatives while in detention and are thus deprived of their basic human right to adequate
wellbeing as well as to their personal liberty. They depend on the services provided by the
government, through prison authorities. Besides, the rights of prisoners on remand, who are
considered innocent until proven guilty, ought to be respected.
5.1.2 Description of the Audit Area:
The Uganda Prisons Service is charged with the management of 222 prisons in the country,
accommodating 32,000 prisoners as at 30th June 2009. 171 of the prisons were formerly under
Local Government Administration (before the enactment of the Prisons Act 2006); while 51
were originally under the Central Government Administration. They are managed under 11
37 SIP II page 11 paragraph (d) 38 Ministerial Policy Statement, Ministry of Internal Affairs 2008/09 page 88.

89
administrative units, namely: Kampala Extra, Central, Southern, South-Eastern, Northern,
North-East, Western, Eastern, North Western, South Western and Mid-Western.
Besides the major custodial functions, UPS also develops vocational skills, like: carpentry,
tailoring, functional adult literacy, shoe making and formal and informal educational
programmes. Other enterprises managed by UPS include: poultry, piggery, cultivation,
beekeeping, handcrafts, brick making and printing services. These activities form part of the
rehabilitation process of inmates while in prison and enable them to integrate into
communities after serving their terms.
5.1.3 Statutory Mandate:
The Uganda Prisons Service is an autonomous body under the Ministry of Internal Affairs. It
was established in 1896 as a branch of the Kings African Rifles and attained full autonomy in
1958 when the Prisons Ordinance, Rules and Regulations came into existence. The Prisons
Ordinance, 1958 (Revised in 1964) together with Prisons Rules and Regulations made
thereunder, continued to provide the legal framework for the operations of Prisons, till the
Prisons Act 2006 came into force.
The Prisons Act (2006) was enacted in accordance with the provisions of the Constitution of
the Republic of Uganda, Article 215, with the intention of establishing the Prisons Authority
and the Prisons Council, under a unified Central/Local Administration Prisons of the Uganda
Prisons Service and to bring the Act in line with effective humane, modern and universally
acceptable standards.
The Act further requires the UPS to contribute to the protection of all members of society by
providing reasonable, safe, secure and humane custody and rehabilitation of offenders in
accordance with universally accepted standards39.
5.1.4 Vision, Mission, Goals and Objectives:
The Vision, mission, goals and objectives of the UPS as contained in its strategic plans are
discussed as shown below:
Vision:
“UPS aspires to be a centre of excellence in providing human rights based correctional services
within the African region.”
39 Prisons Act, 2006 - Section 4(1)

90
Mission Statement:
“To provide safe, secure and humane custody of offenders while placing human rights at the
centre of correctional programmes.”
The Core Values of UPS are Professionalism, Reliability, Integrity and Openness.
Strategic Objectives:
To enhance the safety and security of offenders, staff and the public.
To foster human rights awareness and practice in the prisons.
To promote the rehabilitation of offenders and reduce the incidence of crime.
To enhance professionalism in the Service and strengthen management accountability.
5.1.5 Major Activities:
In its effort to realize its strategic objectives and to provide basic necessities to prisoners, UPS
undertakes the following activities:-
(i) Promote the right to health, food, water, shelter and clothing for prisoners and staff
through the renovation and construction of prisons and staff houses; the provision of
uniforms and meals; improve water and sanitation facilities; and develop food security
and quality assurance systems.
(ii) Recruit and train staff.
(iii) Provide health care services to prisoners and staff.
(iv) Prevent the spread of communicable diseases through establishment of isolation wards.
(v) Implement HIV/AIDS policies to prevent its spread; and support persons
infected/affected by the disease.
(vi) Provide psychosocial support to prisoners through counseling.
(vii) Enhance Human rights awareness and practice among staff and prisoners.
(viii) Reduce the incidence of human rights violations through the establishment of human
rights committees; disciplining staff who violate human rights; protection of
whistleblowers; and implementation of recommendations from other bodies, like NGO’s
and UHRC.
(ix) Promote and enhance productivity and self-sufficiency in the procurement of farm
inputs, diversification of farm activities, and purchase of farm machinery.
(x) Utilise alternative dispute resolution mechanisms.

91
5.1.6 Organisation Structure:
The Prisons Authority is the top decision and policy organ of the UPS, with the Minister for
Internal Affairs as its chairperson. Other members of the Authority include the Attorney
General, Commissioner General (UPS), Deputy Commissioner General (UPS), Permanent
Secretary Ministry of Public Service, a senior officer in charge of Personnel at UPS
headquarters and two other persons appointed by the President. Below the Authority is the
Prisons Council comprising top management of the service, with the Commissioner General
(CG) as the chairperson. The CG is the Chief Executive of the organization and is charged with
the day-to-day management of the UPS.
5.1.7 Financing:
The UPS is funded by the Government of Uganda and development partners, such as: the
European Union, the International Committee for the Red Cross (ICRC), GTZ and internally
generated revenue. The details of funds by source are summarized below:
Table 1: UPS Funding for the period 2005/06 to 2008/09:
Source/Financial Year 2005/06
(Shs in bn)
2006/07
(Shs in bn)
2007/08
(Shs in bn)
2008/09
(Shs in bn)
Revenue:
GoU Funds 27.66 32.73 38.76 45.99
Donor Funds 2.11 4.13 1.86 0.72
Internally Generated 1.45 1.75 0.71 1.95
Total Income 31.22 38.61 41.33 48.66
Source: UPS Financial Statements 2005/06 – 2008/09.
5.1.8 Scope:
The report covers Four Years from July 2005 to June 2009. It focuses on the provision of basic
necessities to prisoners40. The audit covers 15 prisons (7%) in the four regions of Uganda
which were selected using stratified random sampling method as described below: Northern
region covered Arua, Lira and Gulu; Central region covered Kampala, Rakai, Mityana, and
Wakiso; Eastern region covered Kumi, Jinja and Mbale; and Western region covered Kabale,
Kyenjojo and Kasese.
40 Basic necessities for purposes of this study will include; food, health care and clothing/bedding.

92
5.2 FINDINGS
5.2.1 PROVISION OF FOOD AND WATER:
5.2.1.1 Adequacy of food:
According to UPS Standing orders, the following authorised dietary scales are expected to be
provided to prisoners in full and may not be varied without the authority of the Commissioner
General except in the interests of the health of a prisoner and on the written authority of a
Medical Officer. The prisoners are supposed to be served three meals a day, namely:
breakfast, lunch and supper.
Table 2: Minimum Prisoners Food Requirements by Item and dietary scale:
ITEM Scale per prisoner
per day (Kgs)
Number of days Annual Scale per prisoner
Posho 0.681 365 248.565
Beans 0.142 269 38.198
Ground Nuts 0.142 269 38.198
Meat 0.085 96 8.16
Cooking Oil 0.015 365 5.475
Salt 0.015 365 5.475
Sugar 0.0284 365 10.366
Fresh Vegetables 0.142 365 51.83
Source: UPS Planning Unit.
We noted in all the 15 prisons visited that Posho and beans are the only items served out of
the minimum food requirements and dietary scale recommended in table 2 above. Other
recommended items were not served at all. We observed that in 9 out of the 15 prisons like
Kumi, Mutukula, Ndorwa, Jinja, Kitalya, Lira, Mubuku, Pece and Luzira Women, all the 3 meals
were provided in the specified quantities while in Luzira Upper Prison, breakfast was being
served but lunch and supper were combined. In 3 prisons including: Arua, Butiiti and Mityana,
inmates were served only 2 meals (breakfast and lunch), denying prisoners supper. We noted
that in Butiiti, this practice was discontinued in 2009/10 financial year after the intervention of
the RPC. Breakfast is not served at all in Mbale prison. The interviews carried out during audit
revealed that 42% (28 prisoners) of the 67 prisoners were satisfied with the quantity of food
served while 58% (39 prisoners) felt the food was not enough.
The analysis of estimates of approved GoU funding for FY 2009/10 and current production
levels, however, indicate that UPS has the capacity to provide all the food required to feed at
least 30,000 prisoners in a year without any substantial funding gap. While the total food and

93
firewood requirements amount to Shs 21.27bn, GoU funding and UPS food production has also
increased to Shs 21.62bn (Shs 17.27bn+Shs 4.35bn respectively) as illustrated in Table 3
below:
Table 3: Total Food and Firewood for the period 2009/10 in billion shillings:
Source: OAG analysis extracted from UPS records.
The current procurement practice is that food and other items, like salt, are procured centrally
through the Quartermaster General’s Department but some upcountry prisons receive maize
flour directly from suppliers contracted by the UPS headquarters. The practice is that the
Quartermaster General receives maize grain from suppliers and prison farms for milling at the
Flour Mill/stores in Kampala Industrial Area. Purchase of grain instead of maize flour was
adopted to control the quality of food and the moisture content of the maize. About 28% (or
2,860,000kgs) of the food required (or 10,306,000kgs) is grown on the prisons farms while
72% (7,446,000kgs) is purchased utilising funds released by GoU. From the 2009/10 Financial
Year, the production level is expected to increase to 50%.
ITEM Scale per prisoner per
day (Kgs)
Number of days
Annual Scale per prisoner
UNIT PRICE
AMOUNT Total annual budget for feeding 30,000 prisoners
Posho 0.681 365 248.565 1,500 372,848 11,185,425,000
Beans 0.142 269 38.198 1,900 72,576 2, 177,286,000
Ground Nuts 0.142 269 38.198 2,693 102,867 3, 086,016,420
Meat 0.085 96 8.16 6,000 48,960 1, 468,800,000
Cooking Oil 0.015 365 5.475 4,000 21,900 657,000,000
Salt 0.015 365 5.475 1,500 8,213 246,375,000
Sugar 0.0284 365 10.366 2,000 20,732 621,960,000
Fresh
Vegetables
0.142 365 51.83 500 25,915 77,450,000
Total (food for 30,000 prisoners) -
annual requirements
20,220,312,420
Firewood/lumpsum - (assume Shs.
125.8m per month)
1,509,600,000
Total (food and firewood for 30,000
prisoners)
21,729,912,420
Food Grown on UPS Farms (2.9m kgs
of posho @1,500)
4,350,000,000
Funds from GoU 2009/10 budget
(Food and firewood)
17,274,918,000
Available
Funds
21,624,918,000
Funding gap 104,994,420

94
Late deliveries from headquarters contributed to deviations in amount of food served to
prisoners as OCs resort to borrowing or batter arrangements with private businessmen where
both the quantity and quality of food is difficult to control. We noted further that
documentation and accountability of farm produce was not satisfactory. Such a weakness can
pose a risk of under-declaring farm produce by OCs, further compounding food shortages in
prisons. Besides, laxity by management to verify deliveries and dishonest business practices
like delivering less quantities of food items also reduces the amount of food available for
serving prisoners as evidenced in picture 1 below.
Picture 1: A stone of 6kg was found in a sack of beans at Upper Prison, Luzira as they were preparing to
cook. Photo taken on 3rd September 2009 at 11.18am. (OAG Photo).
We also noted that lack of prioritisation also impacts on the resources available for food as
evidenced by the re-allocation of Shs 100m in 2007/08 FY from the vote intended for purchase
of food, to Vehicle Maintenance (money that could have fed about 300 prisoners in that year).
Another cause of inadequacy of food in prisons is the practice of taking inmates to work on
private farms rather than focusing their efforts on working on prison farms. This compromises
production capacity and ultimately the amount of food available.

95
Failure to provide the recommended food rations implies that prisoners are not receiving
reasonable quantities of food while they are in custody and their basic right to food is violated.
This, consequently, leads to malnutrition.
Management Response:
Management further explained that serving combined meals (double meal) was
caused by challenges of getting firewood, cooking utensils and water in some
stations. Regarding Upper Prison in Luzira, management indicated that the
problem will soon be sorted out as more boilers are being installed with assistance
from the British Government. An officer has also been appointed at the rank of ACP
to streamline the weaknesses identified in farm inspections.
Regarding the re-allocation of Shs 100m in the FY 2007/08 from food to vehicle
maintenance, UPS management explained that this was done to ensure that
prisoners are taken to court since there was a shortfall in the maintenance budget.
Prisoners have other human rights to be observed apart from the right to food.
5.2.1.2 Quality of food and meal times:
Part 2 of the UPS Standing Orders requires that every prisoner shall be provided with food of
nutritional value adequate for health and strength of wholesome quality, well prepared and
served at usual hours by the administration41.
From the approved requirements and dietary scales, apart from Posho and beans which are
served daily in all the 13 prisons visited, meat (for proteins and fats) was being served only
once a year on Christmas, while groundnuts (proteins and fats) and sugar (for carbohydrates)
are not served at all. According to management, UPS had started providing the sick and
elderly with mukene, cooking oil, eggs and first class posho to prisoners in Fort-Portal, Luzira
and Kigo prison on pilot basis. These do not cover all the sick and elderly throughout the
country. Where such support is not extended, the sick only get vegetables and additional
porridge. Charity organisations were also providing these items to the sick, especially those on
HIV/AIDS treatment.
41 UPS Standing Orders Part 2 Chapter 57 paragraph 9.

96
UPS also carries out poultry farming in Luzira. The products from these farms (eggs and
chicken) are used to supplement the diet for sick inmates in Luzira prison. At the time of audit,
UPS had about 550 heads of cattle in Isimba, Mubuku, Kiburara, Mutukula, Tororo and Fort-
Portal mainly for beef purposes. On Christmas day, meat from culled animals from these farms
supplemented by purchases made by UPS from private companies is distributed to the
inmates. The Prisons service has vast land which is being taken by government for
resettlement and investment purposes. This land is not being used for rearing of animals to
provide an alternative source of animal protein for prisoners.
During field visits, we observed that 9 prisons, out of the 15 (representing 60%) had
vegetable gardens to supplement their dietary requirements, depending on seasons, while
40% did not.
From the interviews conducted, 54% of the 63 prisoners indicated that the food served was of
good quality, especially those who produce their own food and where food was served hot,
46% said the quality was not good highlighting bad taste/sour, bad colour of posho, hard
beans (due to overstaying in stores), beans infested with weevils or unsorted beans as the
main reasons affecting quality.
Regarding the time at which meals were served, we observed in all the 15 prisons visited that
breakfast was being served between 7.00am - 7.30am, lunch between 12.00pm-2.00pm and
evening meal served very early at 4.00pm to precede the nightly lock-up.
Picture 2: Cooking Private food in progress at
Upper Prison Luzira. Photo taken on 3rd
September 2009 at 11.17am, (OAG photo).
Picture 3: The bean weevils were evident
and many in the store. Photo taken on 28th
July 2009 at 11.02am at Mubuku Prison
Farm. (OAG Photo).
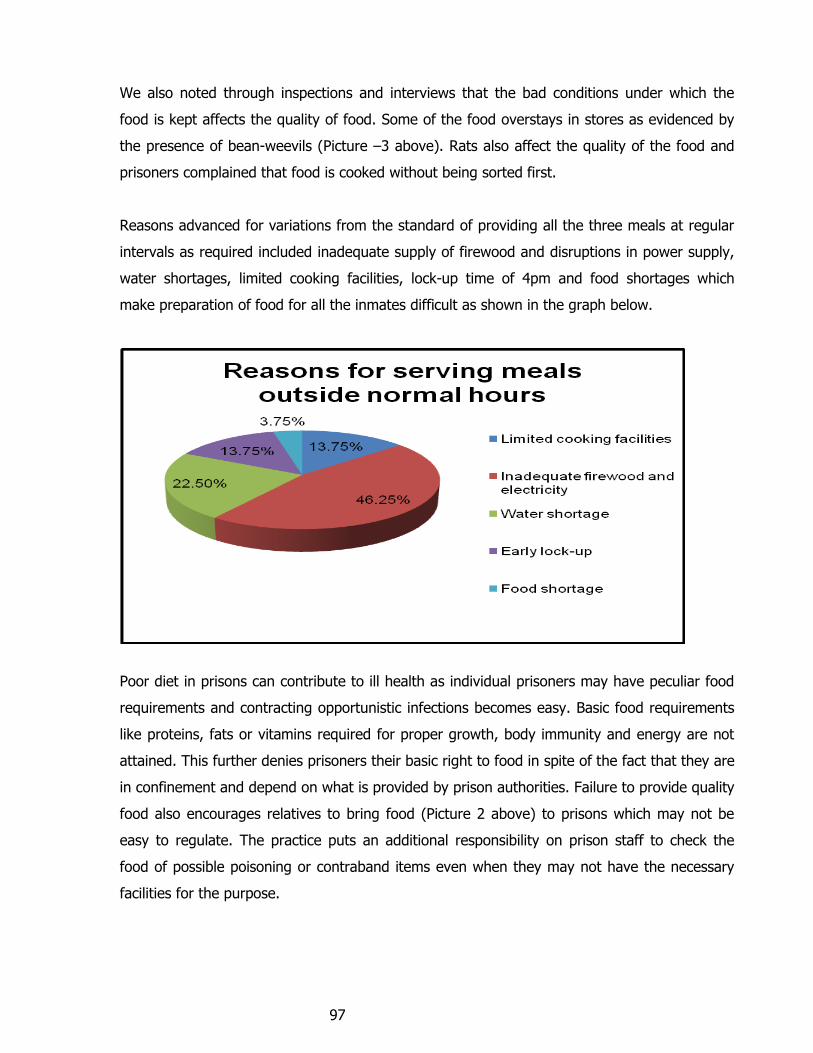
97
We also noted through inspections and interviews that the bad conditions under which the
food is kept affects the quality of food. Some of the food overstays in stores as evidenced by
the presence of bean-weevils (Picture –3 above). Rats also affect the quality of the food and
prisoners complained that food is cooked without being sorted first.
Reasons advanced for variations from the standard of providing all the three meals at regular
intervals as required included inadequate supply of firewood and disruptions in power supply,
water shortages, limited cooking facilities, lock-up time of 4pm and food shortages which
make preparation of food for all the inmates difficult as shown in the graph below.
Poor diet in prisons can contribute to ill health as individual prisoners may have peculiar food
requirements and contracting opportunistic infections becomes easy. Basic food requirements
like proteins, fats or vitamins required for proper growth, body immunity and energy are not
attained. This further denies prisoners their basic right to food in spite of the fact that they are
in confinement and depend on what is provided by prison authorities. Failure to provide quality
food also encourages relatives to bring food (Picture 2 above) to prisons which may not be
easy to regulate. The practice puts an additional responsibility on prison staff to check the
food of possible poisoning or contraband items even when they may not have the necessary
facilities for the purpose.

98
Management Response:
Management indicated that because of inadequate funds, high prisoner population,
difficulty in getting water and firewood make it difficult for them to provide all the
approved food requirements and dietary scales. However, cooking pots have been
purchased and distributed and more will be purchased in the FY 2010/2011. They
also stated that intensive poultry farming started in Luzira and will soon spread to
other regions to address the dietary needs of the inmates.
5.2.1.3 Clean Water for Drinking:
UPS Standing Orders require that safe drinking water should be available to prisoners
whenever it is needed42.
We noted that in all the 15 prisons visited, 84% had access to clean drinking water whenever
needed while 16% did not. Apart from the piped water available in some prisons (especially
those in urban areas like Luzira, Lira, Kabale, Mbale, Mityana and Jinja), other sources where
water is collected like streams/swamps are not protected from contamination especially in
prisons in rural areas or those formerly under the Local Government Administration, for
instance Mubuku, Butiiti, Pece, Kitalya and Apac. (Kitalya and Pece prisons received piped
water in May and June 2009, respectively). To improve on the quality and make the water safe
and clean for drinking, some of the prisons regularly boil water for drinking. Deviations were,
however, observed in some of the stations where water scarcity prevailed and the practice of
boiling water was not strictly being followed. There was no adequate provision for storage of
water for drinking, save for some plastic drums and jerry-cans donated by ICRC in some of the
prisons.
Non-compliance was attributed to mainly water scarcity, competing needs for firewood (like
prioritising cooking food as against boiling drinking water), limited cooking utensils to boil
water, lack of adequate water storage facilities and the distance prisoners walk to collect the
water. We also noted that the UPS management had no systematic arrangement in place to
harvest rain water to supplement existing water sources.
42 Prisons Act, 2006 – Section 69(2)
99
Failure to provide clean drinking water whenever required can lead to the spread of water
borne diseases like typhoid, diarrhoea and cholera; the costs of treatment once an outbreak
occurs notwithstanding. There is also a risk of losing lives.
5.2.2 HEALTH CARE:
5.2.2.1 Medical Examination:
(i) Admission to prison:
Every prisoner is to be examined by the Medical Officer (MO) on the day of admission (or as
soon as possible after his/her admission) and in any case not later than the first working day
after his/her admission and pending such examination, a prisoner will be kept separate from
other prisoners if considered necessary until certified fit by the (MO) to be located with other
prisoners.43
Each prisoner is supposed to be weighed in ordinary prison dress without cap and shoes
whether on reception and discharge (within 24hours) or at any intermediate period. Weighing
should also be done at intervals of 1 month during his/her prison life and a record kept in the
prisoner’s weight book44.
We evaluated the UPS activities regarding the admission of new prisoners or those who have
been convicted to determine whether prisoners received the required screening and
examination within the mandatory 24hours. Despite the provisions of the Standing Orders
regarding medical examination, of all prisoners on admission, we noted that the practice is not
being observed. Prisoners’ measurements on admission and subsequent weights on monthly
basis to monitor their state of health were not taken and no such records were available in
prisoners’ weight book in the prisons we visited. Prisoners are mixed in wards without due
consideration of their medical status.
(ii) Regarding work:
Regarding prisoners fitness to work, the MO is to record the state of health of each prisoner
and whether fit for work or not. Until such time as the prisoner has been medically examined,
43 UPS Standing Orders Part 2 Chapter 3 paragraph 18 44 UPS Standing Orders Part 2 Chapter 20 paragraph 4

100
he/she shall so far as possible be kept apart from other prisoners.45 Prisoners are expected to
be weighed on reception, at intervals of 1 month and on discharge. Standing Orders also
provide that no prisoner shall be employed in the kitchen until the MO or Clinical Officer has
noted in his/her record that he/she has been tested as a non-carrier of a disease and is fit for
such work46. All prisoners employed in the kitchen or in handling food must first be examined
by the MO and passed as free from any infectious or contagious disease and thereafter
examined every month.47 Every prisoner so employed must be free from typhoid. A nominal
roll is to be hung in a prominent position in the kitchen of each establishment showing the
serial numbers and names of all prisoners employed in the kitchen together with due dates of
medical examinations and inoculations.48
We were unable to obtain a nominal roll or certification confirming that cooks or those serving
food had undergone medical examination.
(iii) Vaccination and Inoculation:
In addition, every convicted prisoner on admission is supposed to be vaccinated and given an
initial inoculation; thereafter protection is renewed as often as the medical officer considers
necessary according to prevailing guidelines. A record of vaccinations and inoculations is
supposed to be kept in each prisoner’s record sheet. 49
Vaccination and inoculation of convicted prisoners was not being carried out as required. The
audit team was not able to obtain medical records/cards for the period under review to verify
whether these functions were being carried out and documented systematically.
This lapse was caused by lack of medical facilities and limited medical staff in the prison
service. Even where medical facilities and staff were available, there was no strict adherence
to these requirements, an indication of lack of awareness, laxity in enforcement and lack of
staff awareness regarding medical procedures required on admission. Some of the medical
staff were not aware of these requirements. The situation is made worse by late admissions as 45 UPS Standing Orders Part 2 Chapter 20 paragraph 2 46 UPS Standing Orders Part 2 Chapter 28 paragraph 9(i) 47
UPS Standing Orders Part 2 Chapter 11 paragraph 2(i) 48
UPS Standing Orders Part 2 Chapter 11 paragraph 2(ii) 49
UPS Standing Orders Part 2 Chapter 20 paragraph 3

101
prisoners come from courts late in the evening beyond normal working hours when medical
facilities are closed.
Failure to carry out medical examination and vaccination on admission impairs the ability of
UPS to control the spread of contagious diseases in the already congested prisons in addition
to exerting more pressure on available medical resources to treat diseases which would have
otherwise been prevented. TB and respiratory tract infections like cough are among the
common diseases treated in health facilities within the prisons, yet early detection through
examination can improve management of these cases and reduce their spread.
From Graph 2 below, TB alone on average contributed to 19% of the reported deaths for the
period July 2005 to June 2008. The state of prisoners’ health is not regularly monitored as
initial and monthly weights are not taken and recorded as required. Delivering effective
counselling, care and treatment of those admitted in a verminous condition, HIV/AIDS cases or
those with the history of drug/substance abuse becomes difficult. Disease spread and ill-health
if not well managed ultimately lead to death.
Management response:
The UPS management explained that lack of isolation facilities and limited access
to laboratory diagnostic facilities make it difficult for them to implement those
interventions. They also indicated that new prison rules have been drafted to
operationalise the Prisons Act, 2006 and as such the requirement of examining
convicted prisoners will no longer be necessary. Where coordination with the MoH
is a pre-requisite, management will liaise with the responsible offices to implement
some of the requirements.
The UPS management further informed us that screening prisoners has been
successfully piloted at three prisons of Upper Luzira, Gulu and Katojo/Fort-Portal
under a two year joint UPS/ICRC project. They also informed us that medical cards
are used in these three prisons for the last 2 years.
5.2.2.2 Availability of Medical Facilities in Prisons:
Objective 15 of the UPS Policy Document requires UPS to provide optimal Primary Health Care
services to all prisoners. Providing quality preventive remedial services to those under the care

102
of UPS shall be achieved by making available at every Institution the services of qualified
Medical Officers who will provide prisoners with treatment of the same quality and standard as
is affordable to those who are not imprisoned or detained.50 Rule 22(2) of the UN Standard
Minimum Rules for the Treatment of Prisoners states that sick prisoners who require specialist
treatment shall be transferred to specialized institutions or to civil hospitals. Where hospital
facilities are provided in an institution, their equipment, furnishing and pharmaceutical supplies
shall be proper for the medical care and treatment of sick prisoners, and there shall be a staff
of suitable trained officers. Other key equipment shall be provided to prisoners for proper
personal hygiene and cleanliness.
(i) Existence and Functionality of Health Facilities and Medical Equipment:
We examined the capacity of UPS in the delivery of health care services to prisoners regarding
the institutional arrangements of health facilities and methods of managing drugs in the
service. UPS operates Murchison Bay Hospital as a referral/district hospital for the entire
service and it is recognised by the Ministry of Health (MoH) as a general/institutional hospital.
The hospital provides support supervision to health units in other prisons countrywide which
are its immediate referring units. This activity was not being implemented regularly. It also
provides health care services to residents of Luzira Upper Prison, Kampala Remand, Murchison
Bay Prison, Women Prison, UPS Training School, prison staff and their relatives with an
estimated population of 5,000 people. In addition, the hospital provides free health care
services to the neighbouring communities of Luzira, Mutungo, Kitintale, Butabika, Biina,
Bugolobi, Nakawa and Industrial Area making a total catchment area of approximately
125,46951.
During audit, we observed that the health care provided in prison facilities across the country
varies greatly. In 22% of the 13 prisons visited there was no operational health unit, while
78% had in-house health units. Those which were operational had no laboratory services to
carry out investigations and the facilities were not matching with the standard of service
expected in terms of physical infrastructure (see picture 4 below), equipment and skilled
health cadres.
50 UPS Policy Document page 34. 51 Murchison Bay Hospital Work-plan 2008/09 paragraph 2.

103
Picture 4: Arua Health Centre designated Health Centre III for the West Nile region and is currently
housed in a Uniport. Photo taken on 20th July 2009 at 1.28pm. (OAG photo).
The existing units treat minor illnesses and mostly rely on other public health facilities nearby
to access medical services or refer patients to those institutions. We noted also that in some
cases, prisoners walk long distances to access medical services. Apart from Murchison Bay
Hospital, laboratories and other diagnostic facilities were lacking in prisons.
We noted that Murchison Bay Hospital refers specialist cases to Mulago Hospital on a daily
basis. Not all patients recommended for referral/consultation are actually taken because of
limited shared transportion between the prisoners and staff/escorts on the ratio of at least 1:3.
This denies sick prisoners the opportunity of getting specialist consultation, delayed treatment
which worsens their medical condition. The hospital has also made arrangements to engage
visiting medical Consultants (Psychiatrist Consultant from Butabika National Mental Referral
Hospital and Surgeons from Mulago National Referral Hospital) on a weekly basis to reduce on
some of the referral cases. Investigations and admission cases in Mulago and visiting
consultants are funded from the Murchison Bay Hospital budget.
Murchison Bay Hospital does not provide the minimum health care package such as surgical
interventions and emergency obstetric care which are still referred to National Referral
Hospitals. The theatre is not operational because the necessary minor facilities like electrical
fittings, plumbing installations and painting are not done to make it functional. (See picture 5
and 6 below).

104
Picture 5: Evidence of leakage and hanging electric
wire in the theatre. Photo taken on 17/07/09 at
1.47pm at Murchison Bay Hospital. (OAG photo).
Picture 6: Plumbing works have not been
fixed to make the theatre operational. Photo
taken on 17/07/09 at 1.37pm at Murchison
Bay Hospital. (OAG photo).
This condition has continued to persist even when medical staff have been trained to carry out
basic functions, surgical equipment and supplies were provided by donor agencies and are still
lying idle in the stores since 2006 as shown in pictures 7 and 8 below. The value of the items
donated to the hospital could not be easily ascertained as their corresponding costs were not
recorded in the ledgers.
Picture 7: Some of the donated theatre
equipment lying idle at Murchison Bay Hospital.
Photo taken on 17/07/09 at 1.36pm at
Murchison Bay Hospital. (OAG photo).
Picture 8: Boxes of sundry surgical supplies
that have not been in use for over 10
years. Photo taken on 17/07/09 at 2.16pm
at Murchison Bay Hospital. (OAG photo).
The UPS management indicated that plans have been made to have eleven (11) Health Centre
IV’s at regional level to ease the management of referral cases. Accordingly, JLOS through
sector wide planning is assisting in the construction of Gulu Health Centre IV, provide it with
equipment and a functional laboratory. Nine (9) other Health Centres have been selected as Health

105
Centre III facilities to cover female prisoners. The UPS also plans to build health units in prisons
which are far from established health facilities if districts do not provide health centres within the
next 5 years. To ease referral management, plans are underway to procure a minibus under
JLOS funding for the patients at Murchison Bay Hospital in 2009/10 FY.
(ii) Availability of Drugs and Sundries:
As far as the management of drugs and sundries is concerned, all medical drugs and sundries
for the entire service are purchased centrally and distributed by Murchison Bay Hospital
monthly. We noted that the delivery of drugs and sundries is associated with delays while the
supplies are not enough to take care of the basic needs of these units. We also observed that
the conditions in some health centres under which these items are managed are not good as
they are characterised by extreme heat, inadequate ventilation or dampness. In some cases,
old buildings housing stores leak and require renovation. Other key items recommended for
issue to prisoners like washing soap are inadequate, while others like toilet paper,
toothbrush/toothpaste are not issued in all prisons visited.
Our view is that the UPS policy of providing free medical services to non-prisoners and the
neighboring community impacts adversely on the resources available considering that the
prisoners have no alternative health care options since they are confined, and the fact that the
MoH currently does not contribute to health care financing in the prisons service. Available
data for each of the two years (2007/08 and 2008/09) shown in the graph below indicates that
non-prisoners represent over 50% of the patients treated at Murchison Bay Hospital.

106
This drains available resources in the Health Services Division generally and Murchison Bay
Hospital (which also serves other prisons in the country), ultimately denying prisoners quality
medical services.
We also noted that lack of sufficient staff and prioritisation of health care financing and timely
intervention in carrying out repair works for key areas necessary in service provision was
another contributing factor.
The overcrowded prison conditions and lack of resources to deliver adequate care aggravate
the prisoners’ existing medical conditions. Chronic illnesses such as hypertension, diabetes,
asthma, and heart diseases require regular monitoring and constant care to keep the diseases
from escalating to crisis levels. With prisoners on longer remand period, coupled with the
effects of old age while in detention, developing the diseases of the elderly like respiratory
tract infections, ulcers and mental health problems may not be avoidable.
Furthermore, given limited medical facilities in prisons, monitoring and timely management of
such conditions regularly becomes difficult. Failure to provide basic equipment like toothpaste
can lead to poor oral health which complicates and compounds the ill effects of diseases like
diabetes. Poor medical services in prisons compromises the well-being of inmates, threatens
their basic right to life and the desired objective of providing quality preventive and remedial
health services to prisoners becomes unattainable.
Failure to provide adequate, immediate and effective medical treatment by subjecting sick
prisoners to walking long distances to seek medical attention does not only worsen their
condition but also increases the spread of opportunistic infections leading to death; costs of
transporting inmates to and fro, and additional expenditure on outside consultations not
withstanding.
Management Response:
During our discussions with the UPS management, it was stated that the MoH has
agreed to incorporate Prison Health Units on the list of government benefiting
units in the respective areas supervised by District Health Officers on the National

107
Drug Credit Lines effective from 2010/11 FY. This arrangement is expected to
improve medical care in prison facilities.
5.2.2.3 Availability of Medical Staff:
The UPS authority in consultation with the Health Service Commission is to appoint qualified
MOs at every prison in the country (as detailed in 3.2.2 above) and be responsible for the
health of prisoners and staff.52 The service shall address the special health concerns of certain
offenders such as drug abusers, sex offenders and the mentally disordered, through
preventive, rehabilitative and counselling programmes administered by qualified personnel.53
The analysis of the approved medical staff structures against the actual positions filled for the
period 2007/08 to June 2009/10 is shown in the graph below. (Figures for 2009/10 have been
included as projection, since 46 additional positions had been advertised) at the time of audit.
While staffing levels are progressively improving over the period, the numbers are inadequate
compared with the prisoner population.
Analysis by OAG using data from UPS.
During audit, we analysed the staffing patterns for the medical department to ascertain
whether they were commensurate with existing workloads. We noted that UPS currently,
employs 226 staff in the medical department (or 52%) out of 436 approved by the Ministry of
Public Service (MoPS) in July 2007. A total of 94 are posted in Murchison Bay Hospital, Luzira
against the approved structure which provides for at least 190 in the hospital while 127 are in
52 Prisons Act 2006, S.26(2) 53 UPS Policy Document page 34.

108
other health units countrywide and 5 at head-office. Key positions of qualified staff with
knowledge of Psychiatry, Dentists and Obstetrics and Gynaecology remain vacant.
Lack of staff is caused by failure in recruitment as per approved structure by Ministry of Public
Service, which UPS attributed to the limited financial resources. The UPS management
indicated that the MoPS advised them to implement the approved structure for medical staff
within the available wage allocation for 2007/08 FY. They also highlighted inadequate/absence
of basic health infrastructure to enable staff apply their skills as a unique challenge in prisons.
Accordingly, UPS has failed to attract and retain health workers resulting into high attrition
rates.
The effectiveness of any health care system is largely dependent on staffing considerations.
Because of existing staff gaps, basic functions like medical examinations on admission,
weighing, ascertaining medical status and fitness of those to work as cooks or farm labourers
are not being done. There is also a risk of exposing prisoners who are not medically fit, to
hard labour. Staff gaps in the medical department have also led to uniformed staff performing
clinical duties against the UPS regulations which prohibit uniformed staff from performing
these functions. Besides, the practice denies them time to concentrate on their core duties
further worsening the staff to prisoner ratio which stands at 1:9 instead of the recommended
1:3, additional costs of outsourcing specialists notwithstanding.
5.2.2.4 Management of Communicable Diseases:
A section of the prison hospital or room or ward in the hospital is supposed to be set aside to
receive suspected cases. The MO will give directions as to the requirements for isolation of
staff attending cases. If necessary, arrangements will be made by the OC to provide a mess
within the prison for staff with the infection.54
Field visits revealed that only 38% (i.e. 5) of the facilities inspected had a separate ward/room
for TB patients but 62% did not have adequate space or separate rooms for such patients
apart from those located at the regional centres with health units and/or in-house sick bays.
Smaller units did not have provision for separate rooms for patients with suspected cases let
alone facilities for testing and examining them. Prisoners were mixed regardless of their
medical conditions in wards which were overcrowded. Medical staff also indicated that they did
54 UPS Standing Orders Part 2 Chapter 20 paragraph 9(c)

109
not have adequate protective gear and they have had no training in infection control for the
last four years yet TB cases are prevalent in prisons and can spread easily, to both staff and
prisoners given the fact that overcrowding in prisons at the time of audit stood at 212%.
Failure to separate prisoners is attributed to lack of medical staff to examine prisoners on
admission and lack of space to carry out effective separation.
This further exposes prisoners to spread of contagious diseases like TB, skin related diseases
mostly scabies, Upper Respiratory Tract Infections, eventually leading to death.
5.2.2.5 Control of insects, rodents and vermin transmitting diseases:
Officers in Charge of prisons are supposed to be acquainted with the requirements of the
relevant sections of Public Health Act and ensure that all such requirements are observed by
them55. The Public Health Act provides for the prevention of the spread of disease by flies or
other insects and the destruction and the removal of or the abatement of conditions permitting
or favouring the prevalence or multiplication of the insects; destruction of rodents and other
vermin and the removal or abatement of conditions permitting or favouring the harbourage
and multiplication of rodents and other vermin.56
The inspection of prisons facilities revealed that although the facilities and wards are old and
have not been painted over time, they were kept clean most of the time except in isolated
cases when water shortage was experienced. Disinfect/fumigation of wards was mainly done
in Luzira prisons, where indoor residue spraying is done semi-annually. ICRC also provides
fumigation powder (pyrethrum) to Luzira for killing lice and bedbugs in the wards.
We observed that of the 13 prisons inspected, only Luzira, Jinja and Lira had made provision
for mosquito wire mesh in the ventilation spaces provided in the wards. In Arua for example, a
swarm of mosquitoes was seen in the female wing and there was evidence of blood stains on
the walls as confirmation that mosquitoes were common in cells at night.
We also observed that there was no clear method of preventing and controlling rodents as rats
could easily enter stores as evidenced by rat droppings.
55
UPS Standing Orders Part 2 Chapter 20 paragraph 8 56 Public Health Act S.27 (i) and (j)

110
Failure to control the entry of insects, rodents and vermin was caused by lack of
preventive/control measures and limited knowledge of existing guidelines and laws by the
respective OCs.
Analysis by OAG from data extracted from UPS records.
This results into a high incidence and spread of preventable diseases like malaria, and other
water-borne diseases like diarrhoea which could otherwise be avoided with better control and
preventive methods. 100% of the prisons visited reported that prisoners suffer from malaria
and 11% of the deaths reported over a period of 4 years under audit were caused by malaria
as shown in the graph above. Other insects if not sprayed regularly can lead to skin diseases
or even anaemia as they can cause skin irritation and suck blood. Besides, rats are known
carriers of bubonic plague.
5.2.3 PRISONER‟S CLOTHING AND BEDDINGS:
5.2.3.1 Uniforms:
Every convicted prisoner is supposed to be provided with a complete set of clothing and
equipment on admission, as laid down in the Standing Orders and he/she will be responsible
for the safe keeping and care of these items. All such clothing and equipment are supposed to
be clean and in a good state of repair at the time of issue.57 For ease of identification and for
purposes of security in prisons, it is good practice that all prisoners be in uniforms provided by
prisons authorities.
57
UPS Standing Orders Part 2 Chapter 3 paragraph 31

111
Prisoners employed in the kitchen are also supposed to be provided with aprons and hats
specially made for the purpose and shall wear them at all times when they are on duty. A
clean issue of aprons and hats shall be made daily. An officer detailed for duty in the kitchen
shall wear an apron over his ordinary uniform clothing.58 The UPS Policy document also
highlights the provision of optimal standards of welfare services and living conditions of
prisoners.59
We noted during audit that the requirement of providing at least 2 uniforms to prisoners is not
adhered to. Even a single uniform is not available to some of the prisoners. At the time of
audit, we noted that 38% of the prisons had provided all inmates with at least 1 uniform
(mainly delivered in the 2009/10 financial year), while 62% could not provide all the prisoners
with a pair of uniform. The graph below shows overall the uniforms issued by UPS to prisoners
against the required number for the period July 2005 to June 2009.
Apart from 2005/06 when at least a pair of uniforms was provided, UPS has failed to provide 2
pairs of uniforms to each prisoner in the period under audit. Notably, in 2006/07 only 1.6% (or
470 uniforms) of 29,298 prisoners received uniforms, while in 2008/09 only 29% received as
shown in the graph below.
Analysis by OAG from data extracted from UPS records.
58
UPS Standing Orders Part 2 Chapter 54 paragraph 9
59 UPS Policy Document page 24
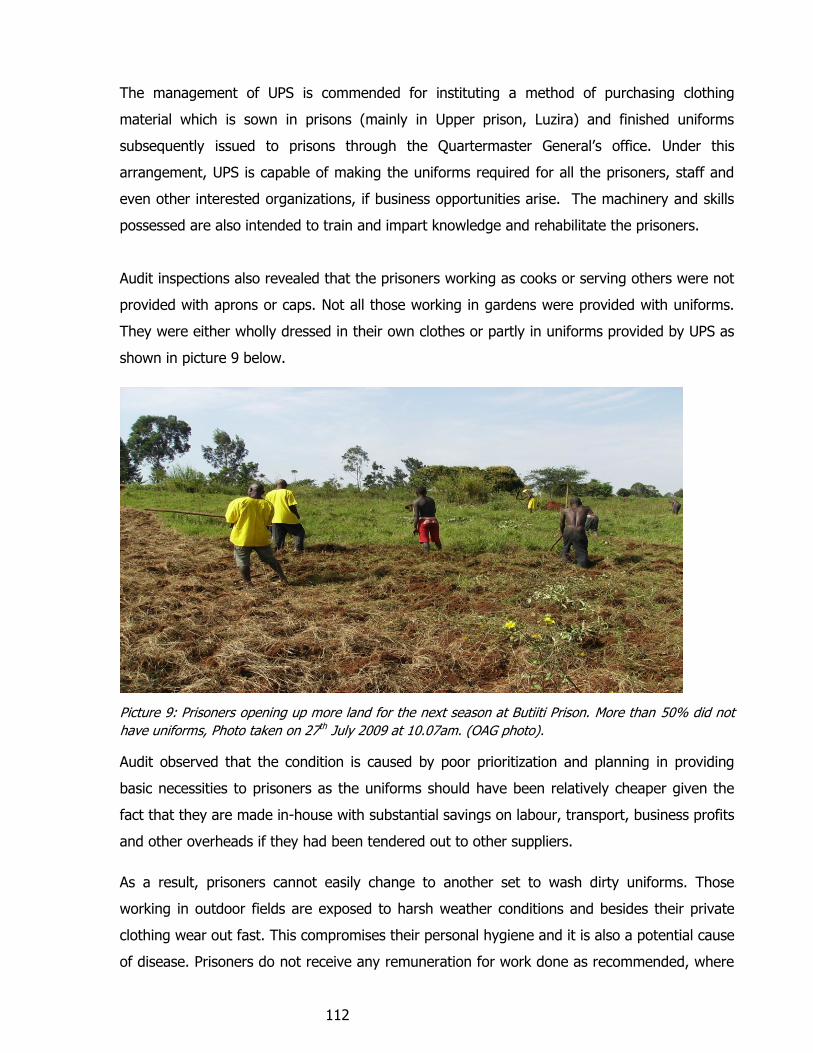
112
The management of UPS is commended for instituting a method of purchasing clothing
material which is sown in prisons (mainly in Upper prison, Luzira) and finished uniforms
subsequently issued to prisons through the Quartermaster General’s office. Under this
arrangement, UPS is capable of making the uniforms required for all the prisoners, staff and
even other interested organizations, if business opportunities arise. The machinery and skills
possessed are also intended to train and impart knowledge and rehabilitate the prisoners.
Audit inspections also revealed that the prisoners working as cooks or serving others were not
provided with aprons or caps. Not all those working in gardens were provided with uniforms.
They were either wholly dressed in their own clothes or partly in uniforms provided by UPS as
shown in picture 9 below.
Picture 9: Prisoners opening up more land for the next season at Butiiti Prison. More than 50% did not
have uniforms, Photo taken on 27th July 2009 at 10.07am. (OAG photo).
Audit observed that the condition is caused by poor prioritization and planning in providing
basic necessities to prisoners as the uniforms should have been relatively cheaper given the
fact that they are made in-house with substantial savings on labour, transport, business profits
and other overheads if they had been tendered out to other suppliers.
As a result, prisoners cannot easily change to another set to wash dirty uniforms. Those
working in outdoor fields are exposed to harsh weather conditions and besides their private
clothing wear out fast. This compromises their personal hygiene and it is also a potential cause
of disease. Prisoners do not receive any remuneration for work done as recommended, where

113
savings could be made to enable them replenish their belongings and start a new life with
dignity and ease on discharge from prison.
5.2.3.2 Beddings:
In accordance with local and international standards, every prisoner is supposed to be
provided with a separate bed and with separate and sufficient beddings.60
UPS does not provide beds, mattresses or blankets to prisoners. They sleep on the floor
without mattresses and adequate blankets to cover themselves and get sufficient warmth.
Picture 10 shows typical accommodation arrangements in UPS wards. However some sections
of female prisons and few male wards were equipped with beds, mattresses and blankets with
support from donor agencies and NGOs like ICRC and the Government of Germany as shown
in picture 11 below.
Mats are provided mainly by ICRC for prisoners to sleep on but these are not enough to cover
all prisoners. (This is an initiative improvised to alleviate the hard conditions of those who
sleep on the floor, as there are not enough beds/beddings to cater for the basic
accommodation requirements of prisoners). In prisons where donor support has not been
received, OCs purchase blankets and local mats using internally generated funds at source, for
instance, from the sale of farm produce. We also noted that no blankets have been purchased
60 UPS Standing Orders Part 2 Chapter 57 paragraph 8
Picture 10: A male ward in Mubuku Prison Farm.
Photo taken on 28/07/2009 at 11.09am. (OAG
photo).
Picture 11: A ward in Luzira female section with
beds and mattresses donated by the
Government of Germany. Photo taken 16/07/09
at 11.24am. (OAG photo).

114
from the UPS budget and provided to prisoners for the period under review and preceding
years extending to a decade. A total of 30,000 pieces of blankets have been purchased and
have been distributed in the current financial year 2009/10 (September-October 2009).
Lack of beds and beddings was attributed to inadequate funds to purchase the necessary
items. It is also evident that increased numbers of inmates in prisons and lack of sufficient
space for beds also pose more challenges to the provision of the necessary items to make the
living conditions of prisoners meaningful and humane. Consequently, the provision of separate
beds with sufficient beddings appears to be a dream. Lack of prioritisation in planning for the
provision of these basic needs cannot be ruled out as there was no proposal made in the
previous budgets to procure these items.
Poor bedding facilities deny the prisoners their basic rights and services compatible with
human dignity. This further aggravates the suffering and loss of self respect; and yet their
basic human rights should not be taken away from them even in detention. Prisoners are not
kept warm and comfortable and, accordingly, the objective of providing living conditions
similar to those of normal life is also violated. Coldness also impacts on the prevalence of
pneumonia cases as we observed in some of the places.
5.3 CONCLUSIONS
From the audit findings outlined above, the following conclusions were made to highlight the
opinions formed during the course of the audit.
5.3.1 PROVISION OF FOOD:
5.3.1.1 Adequacy of food:
The UPS does not provide adequate food to all prisoners as required and at the right time.
There is also inconsistency in serving food to prisoners as some prisons do not provide some
of the planned meals to the inmates.
5.3.1.2 Quality of food and meal times:
The quality of food served to the prisoners is not wholesome as it cannot provide all the
nutritional requirements stipulated in the approved food requirements and dietary scale.

115
5.3.1.3 Drinking Water:
The UPS has not put in place a clear system of providing clean drinking water; nor has it
provide for proper water storage facilities which can be availed to all prisoners whenever
required.
5.3.2 HEALTH CARE:
5.3.2.1 Medical Examination and vaccination on admission to prison:
The UPS does not examine all prisoners on admission. The service does not maintain inmate
medical records for all essential screenings and examinations for purposes of follow-up,
support supervision and timely management of illnesses. There is a higher risk of contracting
infectious or communicable diseases in a prison setting. By not administering all mandatory
screenings and vaccinations, the identification and control of contagious and chronic conditions
becomes difficult.
5.3.2.2 Availability of Medical Facilities in Prisons:
Medical facilities too are inadequate to cater for the health care services of prisoners. Available
facilities are inadequate and not maintained to function properly and offer the desired level of
services comparable to those outside confinement. Grievances related to health care services
and litigations; resulting from such omissions may not be avoided.
5.3.2.3 Availability of Medical Staff:
The staffing level in the Health Services Division is too low to deliver adequate medical
services in all prisons. As a result, the individual and public health benefits accruing from
timely and complete health assessments, as well as the cost savings resulting from early
detection and treatment of prisoners are not achieved. This further raises the cost of providing
health care services in the UPS.
5.3.2.4 Management of Communicable Diseases:
The systems of managing communicable diseases in prisons are inadequate. There is no
provision for carrying out medical examinations to detect those illnesses on admission. The
provision for the segregation of the sick in cells to prevent the spread of such illnesses are not
satisfactory because of lack of the enabling facilities, medical staff shortages and limited
medical supplies.

116
5.3.2.5 Control of insects, rodents and vermin transmitting diseases:
The UPS has no organised method of preventing insects, rodents and vermin from entering
the prisons. Wards were not being disinfected to control the incursion of such vermin. As a
result they spread diseases amongst prisoners.
5.3.3 PRISONERS CLOTHING AND BEDDINGS:
5.3.3.1 Uniforms:
The UPS does not provide enough uniforms to prisoners. This makes the identification of
prisoners difficult. Moreover, torn clothes degrade and humiliate prisoners and detracts on
their dignity. Accordingly, the objective of providing optimal standards of welfare and living
conditions is not attained.
5.3.3.2 Beddings:
Prisoners are not provided with beds. Despite the efforts made by development partners and
humanitarian agencies to provide blankets and mats, the UPS has not taken a leading role to
fill the gap left by the development partners and humanitarian agencies in the provision of
sufficient beddings to prisoners.
5.4 RECOMMENDATIONS
Based on the findings and conclusions reached above, the following recommendations aimed
at addressing the existing deficiencies, have been suggested in light of the emerging policy
which views prisons as places of correction and rehabilitation of the inmates for eventual
reintegration into society. This affirms the fact that the rights of those arrested, detained or
accused should be protected by prison authorities through the provision of appropriate basic
necessitates in all places of confinement.
5.4.1 PROVISION OF FOOD:
Adequacy of food:
5.4.1.1 The UPS should improve on farm inspections to ensure that all the food produced on prison
farms is properly recorded, accounted for and availed to feed the prisoners with the
appropriate amounts of food.

117
5.4.1.2 Prisons authorities should also liaise with other government agencies with a view of benefiting
from the advisory services and accessing the requisite inputs to increase food production in
prisons given the advantage of availability of cheap/free labour.
5.4.1.3 The UPS should also evaluate the benefits of strengthening other regional food centres/prison
farms where maize mills and storage facilities exist to alleviate the shortages and cost of
transporting food supplies from Kampala stores.
5.4.1.4 All convicts without serious security concerns should preferably be transferred to the nearest
prisons with farms so as to boost food production in prison farms.
5.4.1.5 The practice of hiring out prisoners to work on private/individual farms should also be
discouraged as it violates their rights and deprives the prison farms of essential human
resource labour.
5.4.1.6 To reduce pressure on available resources, the UPS should take a leading role in addressing
the challenge of increased prisoner population and high remand levels in prisons which
currently stands at an average of 60%. This should be discussed with other stakeholders,
including the Judiciary, DPP, and Local Authorities, with a view of improving on the pace of
investigations and case management; as well as the promotion of other non-custodial methods
of administration of criminal justice, such as the use of community service and other
alternative sentences rather than imprisonment.
5.4.1.7 The UPS should identify dishonest suppliers who deliver less or sub-standard food supplies
with a view of blacklisting them.
With increased food production the prison would be in position to enhance food security and
provide all the recommended food requirements and dietary scale, (if local food production is
increased to at least 50% from the current 30%).
Quality of food and meal times:
5.4.1.8 The UPS management should endeavour to provide the recommended food on the dietary scale in
view of the current level of funding and farm production.
5.4.1.9 The production on prison farms should also focus on the diversification and growing of other
relevant food crops which have been identified as essential for the provision of the minimum
food requirements for the inmates. UPS should also prioritise projects like: poultry, fish
farming, and beef/diary production that would potentially provide the necessary food
requirements for prisoners, given the available resources at their disposal.

118
5.4.1.10 Where marketing and production potential for the growing of cash crops has been identified,
(for example sugar cane, simsim and cotton which are currently being grown), the benefits
accruing from growing such cash crops on prison farms should be channelled in purchasing
other items like groundnuts, meat, sugar or cooking oil and improving the quality of food
served to prisoners as well as other aspects of their well-being.
5.4.1.11 The UPS management should also ensure that food stores are kept clean and old food stocks
should be well prepared and protected free of weevils and other pests.
Clean Water for Drinking:
5.4.1.12 The UPS management should ensure that clean and safe water for drinking is provided all the
time. The UPS should make provision for harvesting rain water to supplement existing sources.
Good practices like water purification, currently done in some prisons could also be shared,
adopted and applied elsewhere.
5.4.2 HEALTH CARE:
Medical Examination and vaccination on admission to prison:
5.4.2.1 The UPS should develop and implement a comprehensive and proactive arrangement to
ensure that the assessment of the health of all inmates upon admission is carried out for
timely prevention and subsequent management of diseases in prisons.
5.4.2.2 The staff at reception centres should in turn regularly report the results of such examination to
higher levels in the service. Regular support supervision and systematic monitoring of such
practices should be designed to ensure compliance.
5.4.2.3 The clinical staff and the OCs should also be sensitised on the need for continuous assessment
and the benefits of such examination on saving on the costs of treatment.
5.4.2.4 The UPS management should also ensure that inmate medical records are properly and duly
completed, regularly updated and routine checks and weighing are done to monitor the
medical and health condition of prisoners.
Availability of Medical Facilities in Prisons:
5.4.2.5 While the policy of providing free medical services to the communities surrounding the prisons
is well-intentioned, the UPS management should re-evaluate this arrangement with a view of
concentrating their efforts and available resources to serving their primary target population -

119
the prisoners, until such a time when the MoH will take over/supplement health care provision
in the prisons.
5.4.2.6 The UPS management should also prioritise key repair works to the theatre at Murchison Bay
Hospital to increase the capacity and functionality of this facility.
5.4.2.7 To avoid the problems of essential drugs running out of stock, and to streamline management
of prisoner treatment, the UPS should regularly review and adjust drug purchase plans,
allocation portions and distribution consignments in consultation with all health units within the
system.
Availability of Medical Staff:
5.4.2.8 Availability of qualified medical staff is paramount in accomplishing the goals of providing an
effective health care delivery system in a prison setting. The recruitment of key medical staff
should be prioritized to save on the cost of referral cases and increase preventive leverages by
examining prisoners on admission, and at regular subsequent intervals.
5.4.2.9 The posting of medical staff to upcountry prisons should be rationalized and effected in line
with the prisoner populations to be served to ensure that basic primary health care functions
are attended to immediately as cases of illnesses are reported and complaints registered by
prisoners are recorded. This will also reduce on the referral cases to Murchison Bay Hospital
and other public health institutions within the various regions for minor and manageable
illnesses.
5.4.2.10 Prisoners that may require special attention for instance those who have HIV/AIDS related
infections, mental disorders or the pregnant, should be transferred to prisons with adequate
staff and facilities for appropriate management and support.
Management of Communicable Diseases:
5.4.2.11 Initial screening of prisoners on admission, prevention and appropriate separation of the sick
should be enforced to avoid the prevalence and spread of communicable diseases in prisons.
5.4.2.12 Isolation wards should be established in prisons to avoid the spread of
contagious/communicable diseases.
5.4.2.13 To ensure that HIV prisoners get proper treatment, such prisoners should be referred to
prisons that have medical staff, adequate facilities and counselling services. This should
preferably be done with a view of promoting peer support, coping more responsibly with their
condition and minimising new infections without denying their rights to participate in activities,
like games and other rehabilitation work, with other prisoners during the day.

120
Management of insects, rodents and vermin:
5.4.2.14 The management should design and enforce better and practical methods of controlling the
entry of insects, rodents and vermin in prisons as they are carriers of diseases. This will
greatly reduce on infections leading to saving on the cost of treatment.
5.4.3 PRISONERS CLOTHING AND BEDDINGS:
Uniforms:
5.4.3.1 The UPS should exploit the advantage of having enough capacity, including equipment and
skilled human resources, of making the uniforms in-house to be able to provide enough
uniforms to prisoners.
5.4.3.2 The UPS management should also coordinate with other public sector institutions and
regulatory agencies in procurement to secure business opportunities and utilize excess
capacity to generate additional income for the procurement of clothing materials and
maintaining the tailoring unit.
5.4.3.3 The UPS management should also make an analysis of its operational costs to identify
potential savings and ascertain if it has maximized its ability to manage resources to meet the
existing financial challenges.
Beddings:
5.4.3.4 The UPS management should take a leading role in providing prisoners with enough beddings
instead of depending entirely on contributions from development partners and humanitarian
agencies which are not enough to cover all the inmates.

121
6 PROJECT MANAGEMENT: A CASE STUDY ON EIGHT DEBT FUNDED
PROJECTS
6.1 INTRODUCTION
6.1.1 MOTIVATION
The Auditor General’s Report of F/Y 2004/2005 highlighted a problem of low absorption of
External Debt/ loan by implementing agencies. A sum of Shillings Six (6) billion was paid out
as commitment fees on loan amounts not drawn by beneficiary projects. The report further
highlighted a problem of failure by Government to release the budgeted counterpart funding in
full.
The Public Accounts Committee of Parliament (PAC) while discussing the OAG report of the
financial year ended 30th June, 2005 recommended that Government should not get loans
which it cannot absorb. The Committee directed that any Accounting Officer who does not
absorb loans as agreed, should be charged for inefficiency and negligence.
The Committee further directed that Government should budget for all counterpart funds
before procuring a loan.
The Office of the Auditor General embarked upon an independent evaluation of the Project
performance in External Debt/ loan utilization in an effort to determine the cause of low
absorption of external debt and make recommendations to address the challenges.
6.1.2 BACKGROUND OF THE AUDITEE/STATUTORY MANDATE
In accordance with the provisions of Article 159 of the Constitution of the Republic of Uganda,
Government may borrow from any source. Government shall borrow in a manner as
authorized by or under an Act of Parliament.
Additionally, the Public Finance and Accountability Act, 2003 (PFAA) expounds upon the
necessary measures in the control and management of public finances, including the

122
regulation of government borrowing. Under this Act, the management of the Consolidated
Fund and the supervision and control of all the financial affairs of the Government is entrusted
to the Ministry of Finance, Planning and Economic Development.
The Ministry of Finance, Planning and Economic Development is responsible for the borrowing
of funds and monitoring of the projects funded by borrowed funds while the respective Line
Ministries are responsible for managing and accounting for those funds.
6.1.3 DEBT FINANCING
IDA, ADF, IFAD,EIB and the NORDIC FUND are the major sources of external debt financing to
Uganda. For the period from 2005 to 2008, debt funding of Ug Shs 5.069 trillion was received
as indicated below:-
Table I: Debt Financing
Source: Ministry of Finance Planning and Economic Development
6.1.4 AUDIT OBJECTIVE AND SCOPE
Audit Objective
The audit objective was to examine the causes of low absorption of external debt by
implementing agencies and make recommendations to address the challenges.
Audit Scope
The Audit was carried out in the Ministry of Finance, Planning and Economic Development and
the relevant line ministries which hosted the projects. The audit focused on the financial years
from 2004/2005 to 2007/08 and on eight (8) debt funded projects out of the fifty nine (59)
projects implemented and whose closing dates were extended during the period under review.
Financial Year Amount (Ug Shs‟000)
2004/2005 1,755,702,792
2005/2006 889,837,068
2006/2007 1,906,748,498
2007/2008 517,562,784
Total 5,069,851,142

123
Of the eight projects, four were funded by ADF, three were funded by IDA and one was
funded by IFAD as shown in the table overleaf:
Table III: Project Funding
PROJECT NAME DEVELOPMENT PARTNERS
ADF IFAD IDA
Northern Uganda Social Action Fund(NUSAF)
Small Towns Water Supply and Sanitation
Fisheries Development project,
Road Development Program Phase 1,
Road Sector Support Programme I
North West Smallholder Agricultural Project
Vegetable Oil Development Project
Economic, Financial and Management Project (EFMP II)
TOTAL 4 1 3
6.2 FINDINGS
6.2.1 IMPLEMENTATION OF PROJECTS
For each debt funded project being implemented by Government, the effective and completion
dates are clearly stated in the relevant financing agreement. The dates are set after both the
Development partner and Government have carried out a detailed review of the economic,
financial and technical requirements of the project have been identified and the key success
factors agreed upon.
The eight (8) debt funded projects under study, had their completion dates extended due to
the delays in achieving the critical development objectives (milestones). The commitment fees
paid during the period under review amounted to Ug Shs 20.6 billion including penalities as
shown in the table below:-

124
Table IV -Commitment Fees
Financial Year Amount paid in Billions of Shillings
2004/2005 6.4
2005/2006 5.5
2006/2007 4.4
2007/2008 4.0
Total 20.6
Source:- Ministry of Finance Planning and Economic Development
The audit revealed that the DMFAS Accounting software used by MOFPED for external debt
management did not produce information on penalties resulting from the low absorption of
borrowed funds on an ongoing basis. According to MOFPED the penalties are embedded in
the commitment fees calculated by the system.
The study of the eight projects further revealed that the projects delayed for a period ranging
from half a year to 5 years, and according to MOFPED, it is estimated that an amount of US$
585,358 is to be paid as excess commitment fees as shown in the table below:
Table (V)- Delays and Excess Commitment Fees
S/No Project Extended
Period
(Years)
Un-disbursed
amounts
(US $ and SDR)
Extra
Commitment
Fees (US $)
1 Second Economic Financial Management
Project
3 SDR 410,421 220,438.18
2 North Uganda Social Action Fund Project 11/2 1,208,562 55,204.48
3 Small Towns Water Supply and
Sanitation Development
6 months 1,805,254 12,281.63
4 Fisheries Development Project 2 11,867,655 49,428.64
5 Vegetable Oil Development Project 5 6,492,841 -
6 North West Small Holders Agricultural
Project
3 2,064,854 158,153.15
7 Road Development Programme Phase 1 11/2 6,075,725 89,312.70
8 Road Sector Institional Support Technical
Assistance Project (RSSTP)
3 4,411,240 534.98
Total 585,358.76
Source: Ministry Of Finance Planning Economic Development

125
The delays in implementation and low absorption of the external debt does not only cause loss
of public resources as government has to meet the excess commitment fees and penalty on
un-disbursed funds held on the loan accounts by the development partners but also leads to
cost escalation such as increased future prices of goods and services due to inflation and extra
administrative costs.
It was noted that the delayed implementation of projects was caused by the following
factors:-
6.2.1.1 Counterpart Funding
Each loan/credit financing agreement stipulates various categories of expenditure, coupled
with percentages, to be financed by government (counterpart funding). Every financial year,
counterpart funds have to be budgeted for and approved by Parliament for which a respective
Accounting Officer of the line ministry is responsible (section 145 of the TAI refers).
The counterpart funds usually cater for the cost of operational activities which may include the
day to day operations of a project such as field activities, monitoring and evaluation activities,
payment of tax liability and maintenance of vehicles as stipulated in their respective financing
agreements.
It was noted that Government did not honor its obligation of approving all counterpart funds
as budgeted for by the PIUs/line ministries as shown below:-
Table VI- Analysis of Budget against approved estimates (2004/5 – 2007/8)
S/N Project name Budget „000‟ (Ug Shs)
Approved estimates „000‟ (Ug Shs)
(Shortfall) (Ug Shs)
% Contribution
1 Fisheries Development project 20,289,000 8,419,560 (11,869,440) 41%
2 North West Small Holders
Agricultural project
13,277,800 5,517,542 (7,760,258) 42%
3 Vegetable oil Project 15,993,000 5,983,426 (10,009,574) 37%
4 Road Development programme
phase I
19,160,000 14,767,091 (4,392,909) 77%
5 Road Sector Support Project 25,880,000 22,837,598 (3,042,402) 88%
6 Small Towns Water and
Sanitation project
26,902,047 15,036,027 (11,866,020) 56%
Total 121,501,847 72,261,244 (48,891,602)
Source: Line Ministry Policy Statements

126
It was further noted that Government did not honor its obligation of releasing in full the
counterpart funds as per the approved estimates. It was noted during the review that only
Shs12,765,421,421 out of the approved estimates of Shs57,525,217,000 in five projects was
released by Government, which was only 22.2% of the total budgeted amount, as shown in
the table below:-
Table VII: Approved estimates and actual releases
S/N Project Name Approved estimates (Shs)
Actual G.O.U releases (Shs)
Under funding (Shs)
%ge of releases
1 Fisheries
Development Project
8,419,560,000 417,153,842 (8,002,406,158) 5%
2 North West Small
Holders Agricultural
Project
5,517,542,000 1,762,171,024 (3,755,370,976) 32%
3 Vegetable Oil
Development Project
5,983,426,000 3,895,222,555 (2,088,203,445) 65%
4 Road Sector Support
Project (1)
14,767,091,000 4,834,065,000 (9,933,026,000) 32.7%
5 Road Development
Program phase 1
22,837,598,000
1,856,809,000 (20,980,789,000) 8.1%
Total 57,525,217,000 12,765,421,421 44,759,795,579 22.2%
Source: Financial Statements/Progress Reports
In relation to the budgeted funds, the Fisheries development project the North West Small
Holders Agricultural Project and of the Road Sector Support Project received as low as 5%,
32% and 33% respectively (1) as shown in the table above. However, the Vegetable Oil
Development Project received more than 50%.
According to MOFPED, government’s failure to remit the budgeted counter part funds is due to
the inadequate government resources (Budget constraints) and prioritization of Government
programmes. The failure of government to honor its obligation of providing the budgeted
counterpart funding led to the following:-
The project commencement time was delayed because funds that were needed to kick
start the activities were insufficient and this in turn resulted in failure to utilize debt
funds.
127
A case in point is the Vegetable Oil Development Project, which could not take off
without land which was supposed to have been purchased using counterpart funds. At
the time of the audit, Government had not released the total budget for the purchase of
the land.
The implementation of project activities could not be on schedule and according to work
plans due to failure by government to provide funds as planned which led to delays in
project implementation.
A case in point was the Fisheries Development Project which could not secure the
required land titles for the civil works in time because management did not have
adequate counterpart funds. Negotiations with private land owners failed to materialize
as planned. Consequently, the implementation of the civil works component was delayed
for two years.
The failure of government to honor its obligation of providing the budgeted counterpart
funding led to the failure of the projects to attain their intended objectives. This failure is also
a violation of the funding agreement covenant and could lead to the suspension of project
disbursements by the Development Partner and consequently stall project implementation.
6.2.1.2 Diversion of Project Funds
According to Treasury Accounting Instructions (TAI) 2003, Section 145, published estimates
should contain estimated revenue and expenditure budgets of all debt funded projects which
have been approved by Parliament. Any re-allocation has to be approved by the Permanent
Secretary/ Secretary to the Treasury (ST), MOFPED. (Section 152 refs)
It was noted that four (4) out of the eight (8) projects had their counterpart funds amounting
to Shs.3,174,454,821 diverted by the Ministries during the period under review as shown
below:-

128
Table VIII: Diverted project funds (2004/05 to 2007/08)
Project Name Approved
estimates (Shs)
Amount diverted
( Shs)
Fisheries Development Project 8,419,560,000 1,815,533,963
North West Small Holders Agricultural Project 5,517,542,000 832,627,325
Vegetable Oil Development Project 5,983,426,000 164,619,537
Road sector support project (1) 14,767,091,000 361,673,996
Total 34,681,619,000 3,174,454,821
Source: Auditor General‟s Reports
Diversion of funds deprived the projects of the much needed operational funds leading to
delayed project implementation. According to interviews carried out with the Project
Coordinators and MOFPED staff, the diversion of funds is attributed to lack of direct control of
counterpart funds by the project coordination units and mixing of project releases on the same
account with line Ministries’ releases. The diversion of counterpart funds was also attributed to
non-adherence to control procedures and financial indiscipline by government officials.
6.2.2 OPERATIONAL CONDITIONALITIES
The general conditions as set out in the loan agreements have to be adhered to before and
during the project implementation. These agreements further set out the conditionalities that
have to be met by either party. It was noted that some of the performance conditions set in
the agreements took long to be fulfilled leading to delays in utilization of funds. Some projects
were delayed for a period ranging from 2 to 7 years because of the difficulties the projects
were experiencing in fulfilling the conditionalities. For example:-
In some projects, the conditionality was fulfilled after 5 years as in the case of the
Vegetable Oil Development Project, where it took the project 5 years to identify a private
partner.
The Credit component under the Fisheries Development project was delayed for more
than 3 years and eventually cancelled and funds reallocated to another component
within the project.
In addition, the Fisheries Development Project loan agreement required that districts
should provide evidence of land ownership at the sites where 30 fish landing centers and

129
21 fish market stalls were to be constructed/ rehabilitated before any civil works could
commence which delayed the commencement of civil works under the project by 2
years.
The Road Development Program was extended for a period of more than 7 years until
the conditionality of establishing UNRA was fulfilled.
In the case of Small Towns Water Supply and sanitation project, the project was
extended for more than 7 years because of failure to acquire land title deeds.
The causes of failure to meet the conditionalities were attributed to the following:-
Lack of technical persons on the project implementation team to provide technical
guidance on the tasks which are not easy to implement.
Lack of commitment by some stakeholders.
The operational conditionalities affected the project implementation by delaying the start of
the project and slowing down the rate of implementation.
6.2.3 PROCUREMENT
Section 34 sub-section 2 of the PPDA Act, requires the user department / Project Coordination
unit to prepare work plans for procurement based on the annual approved budget which is
submitted to Procurement and Disposal Unit in the Ministry for implementation.
We noted that the procurement units within the line ministries did not execute the
procurement plans on schedule.
For instance, some projects were faced with delays ranging from three months to 12 months
in the processing and awarding of contracts as shown below:-
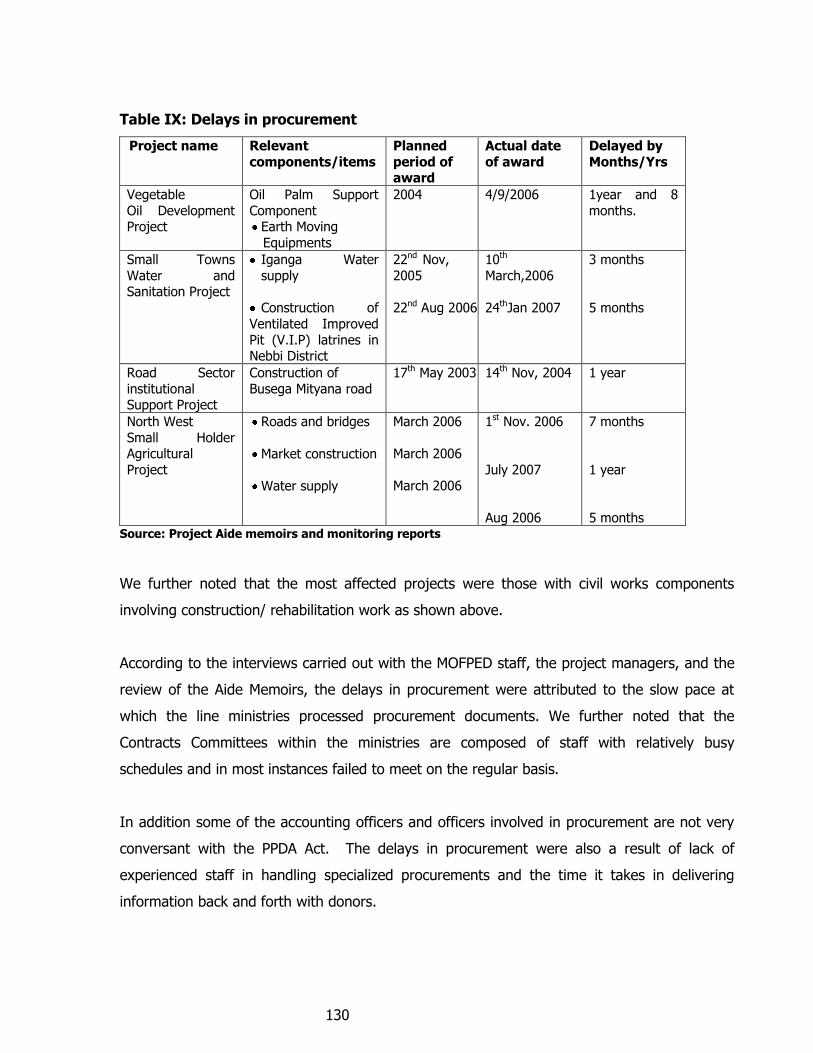
130
Table IX: Delays in procurement
Project name Relevant
components/items
Planned
period of award
Actual date
of award
Delayed by
Months/Yrs
Vegetable
Oil Development Project
Oil Palm Support
Component Earth Moving
Equipments
2004 4/9/2006
1year and 8
months.
Small Towns
Water and Sanitation Project
Iganga Water
supply
Construction of
Ventilated Improved
Pit (V.I.P) latrines in Nebbi District
22nd Nov,
2005
22nd Aug 2006
10th
March,2006
24thJan 2007
3 months
5 months
Road Sector
institutional Support Project
Construction of
Busega Mityana road
17th May 2003 14th Nov, 2004 1 year
North West
Small Holder Agricultural
Project
Roads and bridges
Market construction
Water supply
March 2006
March 2006
March 2006
1st Nov. 2006
July 2007
Aug 2006
7 months
1 year
5 months
Source: Project Aide memoirs and monitoring reports
We further noted that the most affected projects were those with civil works components
involving construction/ rehabilitation work as shown above.
According to the interviews carried out with the MOFPED staff, the project managers, and the
review of the Aide Memoirs, the delays in procurement were attributed to the slow pace at
which the line ministries processed procurement documents. We further noted that the
Contracts Committees within the ministries are composed of staff with relatively busy
schedules and in most instances failed to meet on the regular basis.
In addition some of the accounting officers and officers involved in procurement are not very
conversant with the PPDA Act. The delays in procurement were also a result of lack of
experienced staff in handling specialized procurements and the time it takes in delivering
information back and forth with donors.

131
6.2.4 MONITORING AND EVALUATION
The Project loan agreements require the borrower to maintain policies and procedures
adequate to enable it evaluate on an ongoing basis all the debt funded projects. The loan
agreement also stipulates the outputs and performance indicators each project should achieve.
The policies and procedures require the existence of an institutional frame work, M & E units
with adequate qualified staff, production of reliable and broadly adequate reports in a timely
manner as amplified in the M & E manuals.
MOFPED and the line ministries carry out the role of monitoring, evaluation and follow-up of
debt funded projects.
According to the World Bank Independent Evaluation Group (WBIEG) report of 2007, it was
reported that Uganda had a large number of uncoordinated monitoring systems at the sector
and sub sector levels. This led to the creation of a National Integrated Monitoring and
Evaluation System (NIMES) under the jurisdiction of the office of the Prime minister in 2006.
The objectives of NIMES were to create an umbrella M & E strategy within which the existing
systems could be coordinated and harmonized and Government capacity to conduct and use
the M & E strategy strengthened.
However, according to the report of the National M & E Technical Working Group,
Subcommittee on NDP of May 2009 it was reported that, NIMES has yet to be fully
implemented, and that the overall coordination frame work intended by NIMES, as a basis to
harmonize and standardize procedures and practices has not been realized.
It was further observed that according to the RSISTAP Quality Assurance Group (QAG) report,
M & E reports were not sufficiently sensitive to tracking progress through intermediate targets
and benchmark. The benchmarks used in measuring progress are those which were
formulated in terms of end results or outputs whereas project implementation is through
phased process which requires intermediate benchmarks to monitor progress and to make
adjustments as need arises.

132
We also noted from the Aide Memoirs and the reports that the M & E reports were often
produced late.
From the documentation review and interviews conducted, we noted the causes of inadequate
M & E as being:-
Poor coordination among the key players in M & E.
Lack of adequate facilitation for the M & E units.
The failure of key players in the M & E of debt funded projects to coordinate and harmonize
their work and address the critical challenges in a timely manner led to failure of decision
makers taking appropriate decisions/action in their annual planning and implementation
processes.
6.2.5 PROJECT DESIGNS
Before the project is considered feasible and becomes operational, it is first scrutinized in
detail through the project development cycle by Consultants/Experts by both Government and
Donor to ensure that project designs meet the requirements for successful implementation.
However, we noted that 4 projects out of the 8 were subjected to modifications during
implementation as a result of omissions in the design stage leading to delays in project
implementation as shown below:-

133
Table X: Inappropriate Designs
Project Name Initial design Adjustment in
the design
Time taken to
adjust/Redesign
Impact on
implementation
Fisheries Development Project
Lack of in house Engineer in the original design Engaging a rural Micro-Finance Institution to
administer a Credit revolving fund.
Recruitment. Cancelled.
3 years. 3 years.
Delays in procurement process and commencement of the civil works. Funds remained idle and later on reallocated. Protracted negotiations affected the pace of project implementation.
Vegetable Oil Development Project
Private Sector Contribution estimated at US$ 33.13 million
Revised to US$ 120milliom
5 years. Protracted negotiations affected the pace of project implementation.
North West Small Holder Agricultural Project
To identify a Microfinance institution to administer a credit revolving fund
Lack of an in house Engineer in the original design.
Adjusted the design to include carrying out capacity building and logistical support of the MFI
Recruitment of an in house engineer
3 years
3 years
For 3 years there was no activity in this component.
The production and approval of Rural infrastructure designs and BOQs was delayed for 3 years
Road Sector Institutional Support Technical Assistance Project
Creation of an agency under Executive Authority Board (EAB)
Creation of a Uganda National Road Agency
2 years Extension of project life for 7 years
Source: Literature review by the auditors
It was noted that inappropriate designs affected those projects which had to implement credit
components and those with components involving civil works.
The development of inappropriate project designs has been attributed to inadequate
consultations by the line ministries at the design stage, coupled with lack of proper and
detailed risk analysis by the Development committee in the MOFPED.

134
6.3 CONCLUSIONS
6.3.1 Counterpart Funding
Inadequate counterpart funding affected the implementation of project activities by slowing
down the rate of project implementation.
6.3.2 Diversion of Project funds
Diversion of project funds deprived the implementing agencies of the resources needed to
achieve the project intended objectives.
6.3.3 Operational Conditionalities
Some operational conditionalities affected the project implementation by slowing down the
pace of implementation.
6.3.4 Procurement
Delays in procurements denies the projects inputs necessary for timely project
implementation.
6.3.5 Monitoring and Evaluation
Without adequate M & E, project stakeholders are not able to identify the implementation
difficulties and address them in time.
6.3.6 Project Designs
Inappropriate design derails project objectives and is costly to correct in terms of both time
and financial resources.
6.4 RECOMMENDATIONS
6.4.1 Delays in Project implementation
MOFPED and line ministries should ensure that Debt funded projects are implemented on
schedule and according to work plans to avoid payments of excess commitment fees/
penalties.
The Accounting Officers and Project Managers who fail to absorb loans as agreed be
reprimanded for inefficiency and negligence.

135
6.4.2 Counterpart Funding
Government should budget for adequate counter-part funding requirements for all loans
procured.
MOFPED should give priority to debt funded projects by releasing all the amounts as per
approved budgets to ensure compliance with the loan agreements.
6.4.3 Diversion of Project funds
MOFPED should enforce compliance with the TAI and Financial and Accountability rules and
regulations that prohibit diversion of funds.
The Accountant General should carry out efficient checks including surprise inspections as
stipulated in Sec 7(3)h of the PFAA-2003 to avoid diversion and mismanagement of project
funds.
Diverted project funds should be refunded by the responsible line Ministries.
Accounting officers responsible for the diversion should be disciplined for their conduct.
6.4.4 Operational Conditionalities
MOFPED should carry out early warning studies in consultation with implementing agencies
and the development partners to identify the causes and difficulties in fulfillment of the loan
conditionalities and address them in the shortest possible time.
MOFPED and line Ministries should equip PMU with technical persons who should provide
technical guidance during Project implementation.
All Project Stakeholders should be encouraged to show commitment at all levels during project
implementation.
6.4.5 Procurement
MOFPED and line Ministries should take action on procurement staff who do not implement
procurement plans as scheduled.
MOFPED should build capacity in all ministries through training of staff serving in the
procurement and disposal units and ensure that the staff recruited are up to the task.
All key stakeholders in the procurement process should observe the procurement plans set up
by Contract Committees and procurement and Disposal units in the Ministries.
Line Ministries should consider setting up sub contract committees and Procurement and
Disposal units for projects.

136
6.4.6 Monitoring and Evaluation
OPM should expedite the process of establishing and operationalising coordination frame work
intended by NIMES, as basis to harmonize and standardize procedures and practices of M & E.
There should be well established and functional M & E units with adequate and qualified staff
who are well facilitated in the MOFPED, in the line ministries and at the Districts.
OPM should analyze and consolidate their reports and produce a M & E report on all
government projects and this should be regular.
There should be an institutional arrangement for follow up based on the annual M & E report
and having possible interventions available to act on when implementation is not progressing
as planned.
MOFPED should also consider providing information on commitment fees on an ongoing basis
to avoid payment of excess commitment fees.
6.4.7 Project designs
Line ministries should carry out wide consultations with the key stakeholders during the
project design phase.
The Development Committee in the MOFPED should also undertake detailed analysis of project
design and risk before projects are approved.
● The Development Committee should be institutionalized and MOFPED should consider
training members of the Committee in modern techniques of strategic planning such as
computer based project design and also develop Hand books to guide them in their work.

137
7 SOLID WASTE MANAGEMENT IN KAMPALA
7.1 INTRODUCTION
7.1.1 BACKGROUND
Kampala is the capital city of Uganda. It is administered by an elected Council headed by a
mayor, (LC V). The technical functions are carried out by a team of professionals headed by
the Town Clerk (Chief Executive).
Kampala is a decentralized district administered under the Local Governments Act (1997).
Kampala City Council is constituted of five administrative units (Divisions) namely:-
Central division
Kawempe division
Rubaga division
Makindye division
Nakawa division
Each division is a municipality with a fully fledged administrative unit. Kampala is
approximately 198 sq Km with a night population of between 1.2 million to 1.5 million people.
The day population is estimated at close to 3 million people of which 15.4% live in informal
and unplanned settlements. 40% of the house-holds engage in urban agriculture which
contributes a lot to the accumulation of waste 1. (Solid Waste Management Strategy,
December, 2002, as revised in 2006).
According to the SWMS, December, 2002, 70-80% of the garbage generated in the city is
organic while the rest is inorganic comprising of glass, paper, metals construction and
demolition waste as indicated in the waste stream on the following pie chart:

138
Chart showing garbage composition in the Kampala city
Compiled by OAG from SWMS,of December 2002
Waste represents a threat to human health if not handled or disposed of properly. It is a
responsibility of every Local Authority, according to section 5 of the Public Health Act,
Cap.281, to take all lawful, necessary and reasonably practical measures to safeguard and
promote public health. It is also a duty of a local authority to maintain its area at all times in a
clean and sanitary condition and prevent the occurrence of any nuisance2 (Section 55 of the
Public health Act, Cap.281). In its definition of nuisance, Section 57 of the Public health Act,
Cap.281, includes un-collected garbage among others as being a public nuisance.
Section 3 (1) of the KCC Solid Waste Management Ordinance, 2000 refers to solid waste to
mean garbage, refuse, trash and other materials or products including putrescible and non-
putrescible waste, organic and inorganic waste, combustible and non-combustible waste, and
liquid non-hazardous waste, but does not include hazardous waste or human body parts.
The collection, transportation and disposal of garbage is the responsibility of Kampala City
Council (KCC) and its divisions according to section 17 of the KCC Solid Waste Management
Ordinance, 2000. KCC is required through its agents, servants or licensed collectors to ensure
that solid waste (Garbage) is collected and conveyed to treatment installations or approved
disposal sites to the extent required to satisfy both public health and environmental
conservation requirements.
139
Before 1996, Kampala City Council used to openly dump waste at various locations in Busega,
Kinawataka, Bukoto, along Lugogo bypass, Wakaliga and Luzira among other places. The
public strongly complained against the indiscriminate disposal of waste by KCC, which forced
management to acquire land at Kitezi, Nangabo sub county Wakiso district to dispose of the
garbage.
The rate of garbage generation, according to the SWMS of December 2002 and revised in
2006, based on the population in the city, was averaging 1 Kg per capita per day. This
translated into 1,200 – 1,500 tonnes of garbage generated in a day. There has been
increasing volume of solid waste generated in the city as a result of the growing urban
population, concentration of industries in the city, poor behavior and consumption habits of
residents and inappropriate waste management practices. Most of the un-collected garbage is
found in slum areas of the city occupied by the majority poor. The problem of uncollected
garbage does not exist in upscale residential places occupied by the more affluent members of
society. In these places, garbage is collected by private collectors because the households can
afford to pay collection fees. Such places include; Kololo, Naguru, Muyenga, Bugolobi, Ntinda
and the city centre. Institutions such as; Universities, schools, hospitals, embassies, banks,
hostels and some markets and bus parks also engage private collectors.
7.1.2 MOTIVATION
KCC and the divisions spent a substantial amount of money to the tune of Shs.10.4 billion on
garbage collection, transportation and disposal in a period of five years from 2002 to 2007
which averaged to Shs.2.08 billion annually.
Despite the expenditure, the city remains chocked with un-collected garbage. Out of 1,200–
1,500 tonnes of garbage estimated to be generated per day, only 400-500 tonnes was found
to be collected giving a collection efficiency of approximately 40% according to SWMS, of
December, 2002. This implies that 60% of the garbage generated daily is not collected and
disposed which has resulted into a public nuisance. The presence of un-collected garbage all
over the city puts the lives of dwellers to the risk of environmental and human health related
problems such as diseases and air pollution in form of offensive smell.

140
The audit sought to ascertain why KCC and the divisions have failed to establish an efficient
garbage collection, transportation and disposal system to solve the problem of un-collected
garbage in the city and to make recommendations for improvement.
7.1.3 MANDATE
KCC and the five divisions are mandated under the Solid Waste Management Ordinance, 2000
and the Local Governments Act 2003 to collect, transport and dispose garbage generated in
the city.
7.1.4 ACTIVITIES
The activities involved in waste management include:
a) Collection of garbage
b) Transportation of garbage
c) Disposal of garbage
d) Organization of awareness campaigns on waste disposal
e) Enforcement of the waste management ordinance clauses
7.1.5 FUNDING
The activities of waste management in KCC and the divisions are funded through Annual
Budget allocation. In the period under review a total of Shs.10.4 billion was spent on garbage
collection as shown in the following table.
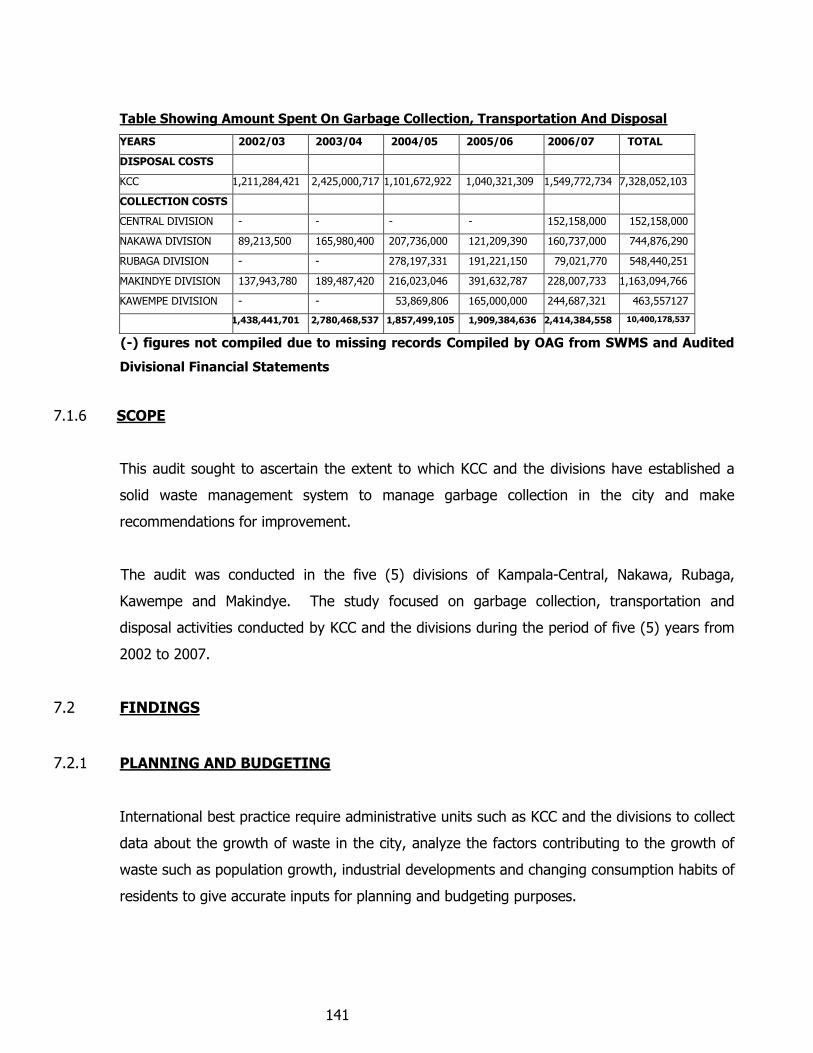
141
Table Showing Amount Spent On Garbage Collection, Transportation And Disposal
YEARS 2002/03 2003/04 2004/05 2005/06 2006/07 TOTAL
DISPOSAL COSTS
KCC 1,211,284,421 2,425,000,717 1,101,672,922 1,040,321,309 1,549,772,734 7,328,052,103
COLLECTION COSTS
CENTRAL DIVISION - - - - 152,158,000 152,158,000
NAKAWA DIVISION 89,213,500 165,980,400 207,736,000 121,209,390 160,737,000 744,876,290
RUBAGA DIVISION - - 278,197,331 191,221,150 79,021,770 548,440,251
MAKINDYE DIVISION 137,943,780 189,487,420 216,023,046 391,632,787 228,007,733 1,163,094,766
KAWEMPE DIVISION - - 53,869,806 165,000,000 244,687,321 463,557127
TOTAL 1,438,441,701 2,780,468,537 1,857,499,105 1,909,384,636 2,414,384,558 10,400,178,537
(-) figures not compiled due to missing records Compiled by OAG from SWMS and Audited
Divisional Financial Statements
7.1.6 SCOPE
This audit sought to ascertain the extent to which KCC and the divisions have established a
solid waste management system to manage garbage collection in the city and make
recommendations for improvement.
The audit was conducted in the five (5) divisions of Kampala-Central, Nakawa, Rubaga,
Kawempe and Makindye. The study focused on garbage collection, transportation and
disposal activities conducted by KCC and the divisions during the period of five (5) years from
2002 to 2007.
7.2 FINDINGS
7.2.1 PLANNING AND BUDGETING
International best practice require administrative units such as KCC and the divisions to collect
data about the growth of waste in the city, analyze the factors contributing to the growth of
waste such as population growth, industrial developments and changing consumption habits of
residents to give accurate inputs for planning and budgeting purposes.

142
We observed that KCC and its divisions were not regularly updating their data base to reflect
the changing environment in solid waste management.
In the absence an up to date data base, KCC and its divisions did not carry out a proper
assessment of waste being generated in the city and therefore do not have well researched
information on solid waste for proper strategic development and decision making.
We also noted that the data captured at the disposal site at Kiteezi is not regularly sent to
Divisions, but sent to KCC for purposes of calculating monthly payments to the contractor
managing the land fill.
Therefore, their plans and budgets were not realistic because they were not based on proper
assessment of garbage generated per division and this resulted in failure of KCC to adequately
address the challenges of garbage collection and disposal in the city.
Management response
During discussions with top management of KCC and Divisions, it was explained
that the data base that existed was created on a sample basis and results
extrapolated using population figures during a study carried out in 2002. The
results of the survey helped in the development of the solid waste management
strategy of 2002 which was revised in 2006.
Management also explained that they faced a challenge of implementing a strategy
that had been overtaken by socio-economic events and that they were also facing
challenges in up dating the database on a regular basis. Management further
explained that efforts were being made to have all
Divisional solid waste engineers meet together and discuss the challenges faced
and provide common solutions to management.
7.2.2 DISPOSAL OF SOLID WASTE
Solid waste disposal typically involves the collection, transportation and finally covering the
waste with soil. The performance audit considered compliance by KCC and the divisions with
the existing rules, regulations and best practices on garbage disposal.

143
7.2.2.1 Collection of Solid Waste
To achieve effective collection, it was necessary for KCC to create awareness on collection of
solid waste to the city residents and establish effective mechanisms of enforcing the waste
management by laws in the city.
Solid Waste Management Awareness
According to the Solid Waste Management Strategy (SWMS) of 2002 Para.7, members of the
public are supposed to be educated in matters of waste management such as;
sorting/separation of waste according to their categories of organic and inorganic, efficient use
of skips, waste recycling, home composting, waste minimization and adherence to waste
management laws to increase collection coverage to 80% from 40%.
It was noted through interviews with households, market vendors and through documentary
reviews that solid waste awareness campaigns were not conducted by KCC and the divisions.
We were informed that little information about waste management was being exchanged
during the Local Council (LC) meetings.
A review of work plans and expenditure patterns at the divisions did not reveal any evidence
of solid waste management awareness campaigns conducted while the collection coverage had
stagnated at an average of 40%.
It was also noted that most of the city dwellers are not aware of the provisions of the KCC
(Solid Waste management) Ordinance, 2000. Efforts by KCC to translate the law into local
dialects such as “Luganda” and sensitize the public did not take off as the program lacked
management support.
There has been laxity by management and failure by KCC and the divisions to conduct public
awareness campaigns as means of boosting KCC and divisional efforts in collection and
disposal of solid waste. Solid waste management campaigns have not been viewed as a
priority by Council during budgeting. The divisional health inspectors in all the divisions
expressed dissatisfaction with the way the respective Councils were allocating funds to the
solid waste section.

144
Lack of solid waste management awareness campaigns has led to unacceptable and prohibited
waste management practices such as indiscriminate littering and disposal of garbage.
Management response
During discussions, KCC management explained that some awareness efforts were
being made whereby vehicles with mounted loud speakers are used to disseminate
information to the public about KCC‟s daily collection programs, places where to
dump garbage and when.
Enforcement of the Solid Waste management by-laws
According to section 20 (d) of the Solid Waste Management ordinance, 2000, it is an offence
for a person to scatter or litter solid waste at any private or public property. Section 5 (1) of
the ordinance also prohibits depositing of waste on private property, public street, roadside, or
in a ditch, river, stream, lake, pond, channel or in a park, excavation or any other place where
it may be or become a public health nuisance. Section 39 of the ordinance also imposes a fine
not exceeding two currency points or imprisonment not exceeding six months for a person
who commits an offence under the ordinance. The responsibility to enforce these rules and
regulations rests with KCC and the divisions.
It was noted during inspections in all the divisions and through interviews with the five DHIs
that KCC and the divisions were not enforcing the laws despite the existence of a fully fledged
enforcement department.
“No dumping” signposts to curb unauthorized dumping have caught a blind eye of the
perpetuators because of laxity by KCC and the divisions in the enforcement of the law.
Cases of illegal dumping of solid waste were noted at market places at Mulago, Nakawa,
Kalerwe, Ntinda and Kikubo to have caused unnecessary suffering to the neighborhood
through air pollution and blockage of the drainage system leading to floods.

145
Illegal dumping of garbage despite KCC signpost “No dumping “at Binaisa road, near Mulago hospital
Garbage Dumping in the drainage system along Kalerwe- Gayaza road
In addition the public was not sensitized on the bye-law and evidence of arrests made by the
KCC enforcement department of persons violating the ordinance was not seen.
Lack of enforcement of the by-law has led to indiscriminate disposal of garbage and other
hazardous practices such as burning of garbage in the city which is prohibited by law.
Indiscriminate dumping of garbage has also led to the blockage of the drainage systems which
has contributed towards the cause of epidemics such as cholera around the city slum areas
and suburbs.

146
Management response
Management explained that the problem of enforcement was caused by inadequate
capacity to enforce the by-laws and the failure to provide alternative garbage
disposal means to the public by KCC. They further explained that KCC prematurely
withdrew the use of skips and sometimes failed to collect garbage daily leaving the
public with no alternative, but to indiscriminately dump garbage. They, however,
noted that KCC and Divisions have acquired new refuse vehicles which will help
them improve the collection efforts and that plans were underway to build capacity
of the private collectors.
Working Conditions of Personnel in Garbage Collection
Section 1 of the SWM ordinance defines the protective clothing to be supplied to staff working
in the collection, transportation and disposal of garbage which include; gumboots, industrial
gloves, masks, overalls and head covers.
It was noted through interviews and physical observation that the staff involved in garbage
collection, transportation and disposal are not supplied with protective clothing. Garbage
collection workers, expressed dissatisfaction with the way management was handling matters
concerning their working conditions. We observed that the refuse staff work under poor
working conditions without protective gear such as; gumboots, industrial gloves, masks,
overalls and head covers.
Management at the divisions has failed to procure protective clothing of the refuse collection
workers despite the presence of the budgetary provision under the supply of goods and
services. The lack of conducive working conditions affects staff morale which may in turn
affect their performance at work.

147
Garbage collection workers from Nakawa division with improvised head gear
Wage Payment
The staff involved in garbage collection are supposed to be paid by the 28th of every month.
The garbage collection workers complained about the late payment of wages by division
authorities. This was further confirmed by the review of payment records of the divisions
visited which revealed arrears of wages unpaid to refuse collection workers. In Nakawa,
Makindye and Rubaga divisions the refuse collection workers spend between two-three (2-3)
months without pay and these matters have been evidenced in the Auditor General’s Financial
Audit Reports of earlier periods.
Delayed payment of salary affects the staff morale which in turn affect their performance at
work
Management response
Management explained that the situation has now improved. For example in
Kawempe Division arrears of wages have been reduced from six (6) months to
three (3) and that gumboots and other protective gear have been ordered. They
however experienced a challenge of loss of the protective gear to workers who are
casual and leave without notice.

148
7.2.2.2 Transportation of Garbage
This is a very critical element in the chain of activities of garbage disposal.
Vehicle Fleet for Garbage Collection
KCC and the divisions required on average 86-five tonnage lorries disregarding the private
sector contribution to be able to collect and transport garbage from the city to achieve 100%
performance, on the assumption that each vehicle makes 3 trips per day.
However, we noted that KCC and the divisions operated on average 35-five tonnage lorries
which was 40% of the fleet required to enable prompt waste collections and disposal in the
city as shown below:
YEAR 2002/03 2003/04 2004/05 2005/06 2006/07 TOTAL AVERAGE
Estimated Garbage to be
generated (tons)
434,037 450,096 466,750 484,019 501,930 2336832 486364
Required number of
vehicles (100%)
79 82 85 88 92 426
85.2
Actual vehicles used
(current)
32 36 34 32 41 175 35
Source of information: KCC Solid Waste Management Engineer
KCC and the divisions could not acquire the required number of vehicles due to poor
performance in revenue collection during the period under review and also lacked a vehicle
replacement policy. In the absence of the required number of vehicles to transport garbage,
KCC and the divisions could not attain the 80% required garbage collection performance level.
Vehicle Maintenance
A good fleet management system is supposed to keep vehicles in good running condition to
facilitate the daily collection and transportation of refuse.
Out of the required 85 refuse vehicles in the city, only 35 (40%) were operational at the time
of audit. The Auditor General’s Financial Audits Reports had attributed poor vehicle
maintenance to weak controls such as failure to inspect vehicles before and after repairs by a
qualified Engineer.

149
A grounded refuse vehicle (skip loader) at Makindye division offices.
In four divisions with exception of the Central Division, the Divisional Health Officers also
expressed dissatisfaction with how KCC and the divisions were handling vehicle replacement,
repairs and maintenance initiatives.
The constant vehicle break down has led to accumulation of un-collected garbage to
undesirable levels and this is evidenced by the presence of refuse which has taken more than
one day without being collected. Worst cases were noted at market places in Nakawa,
Kalerwe, Ntinda, Makindye and Kikuubo in central division.
Un-collected garbage at Kalerwe market, Kawempe division

150
Un-collected refuse on the skip at Kitintale, Nakawa division
Indiscriminate littering and disposal of garbage makes it difficult to regularly collect and
dispose garbage. Some other prohibited refuse disposal methods such as burning garbage
have also cropped up.
Indiscriminate garbage littering and disposal at Entebbe road flyover, Makindye Division
Management response
Management explained that KCC is seeking the services of a consultant who would
come up with a fleet management system which would look into all fleet
management aspects including replacement, handling and tracking of vehicles
among others. They further explained that each division has acquired five (5) new
specialized refuse trucks which compress and compact refuse for proper disposal.

151
Hiring of additional trucks would no longer be necessary once the vehicles are
fuelled and in good running condition.
7.2.3 ENGAGEMENT OF PRIVATE GARBAGE COLLECTORS
It is an offence under section 20 (d & e) of the SWM Ordinance, 2000 to collect, transport,
remove or dispose refuse for a fee or other consideration without a valid permit from the
Council. The SWMS para 4.8 also recommended providing legal recognition of the private
garbage collectors so that they become more organized and also ensure better working
conditions for them.
We observed that a number of private garbage collectors like BINIT, Nabugabo, UPDEAL,
NOREMA, HOME CLEAN, UCODEA and ESKOM were operating without permits from KCC.
Although known to the divisional authorities, they had not signed agreements with the Council
allowing them to operate contrary to the law. Despite the absence of the signed contracts,
Kawempe division, at the time of the Audit in June 2007 had an outstanding amount of
Shs.225,000,000 payable to contractors as follows:
S/NO CONTRACTOR NO. OF MONTHS AMOUNT (SHS)
1 NOREMA 10 75,000,000
2 HILLTOP 10 75,000,000
3 ESKOM 5 75,000,000
TOTAL 225,000,000
We also noted that there is no mechanism put in place to regulate the activities of private
collectors. The number of households and institutions visited by private collectors is not known
to KCC and the divisions contrary to section Para. 4.8 of the SWMS.
It was further noted during interviews carried out with DHIs and during physical inspection of
the garbage sites in the divisions and from the land fill at Kitezi that private
Contractors/collectors were not managed and coordinated by KCC and divisions. This was also
confirmed by the three (3) Directors of; UPDEAL,NOREMA and Nabugabo. We also noted that
some of the private collectors have no capacity to collect and transport refuse to the landfill
and instead deposit it at divisional collection sites.

152
A private collector dumping garbage at one of the Council sites at Kitintale, Nakawa division
This has been caused by failure of KCC to establish proper mechanism for regulating the
operations of private garbage collectors. KCC failure to operationalize the provision of SWM
ordinance regarding private sector participation delayed the provisions of establishment of a
proper coordination between the divisions and private collectors.
Management response
Management explained that all the Divisional town clerks have been asked to
register all private collectors who should be screened and those found eligible
should be issued with licenses for collection of garbage. They also explained that
the City was to be zoned and specific areas allocated to private collectors who will
be responsible for proper collection of garbage in that area and guard against
illegal collectors. They further explained that all the revenue collected by the
private collectors in the pilot phase shall accrue to them and that KCC will benefit
at a later stage when the scheme is rolled out.

153
7.2.4 SUPERVISION, MONITORING AND CONTROL OF SOLID WASTE MANAGEMENT
ACTIVITIES
According to Section 17 of the SWM ordinance, 2000, either KCC or its agents, servants or
licensed collectors are required to ensure that solid waste in the district is collected and
conveyed to treatment installations or approved disposal sites to the extent required to satisfy
both public health and environmental conservation requirements and as provided in the
ordinance.
Section 20 (a) of the SWM ordinance, 2000 also requires that the various refuse generators
should be correctly identified, categorized and mapped to enable determination of the revenue
potential.
It was noted during interviews and documentary reviews that private collectors were not
regularly collecting and conveying refuse to the disposal site at Kiteezi and instead deposit it at
divisional collection sites.
Verification of refuse monthly reports to DMOs by DHIs did not reveal any information on the
number of private collectors and their performance, with exception of central division. There
are no records to indicate that supervision was done.
It was further noted that the garbage sites are not mapped making it difficult to plan and
monitor the progress of garbage collection.
This was because KCC and the divisions were not supervising and monitoring the activities of
private collectors due to lack of signed agreements and data on the number and capacity of
private collectors. It was noted during inspection of institutions and households that private
collectors enter into agreements with their clients without the knowledge of KCC and divisions
for garbage collection, transportation and disposal.
The refuse gangs met at divisions were also not supervised daily and the DHIs attributed the
problem to lack of fuel and the overwhelming number of garbage sites, some of which are
illegally operated by garbage generators.

154
Failure by KCC and the divisions to adhere to SWM ordinance provisions governing the
supervision of refuse collection, transportation and disposal procedures led to the absence of
adequate supervision, monitoring and control mechanisms which has aggravated the problem
of uncollected garbage.
An overflowing skip at Bishop Kihangire site at Kitintale, Nakawa division
Management response
Management explained that the solid waste engineers have been receiving garbage
collection records from the landfill but have not been passing over the information
to the Division Town Clerks. They further explained that garbage collection was at
one time under the city engineer and in 1999 it was put under the district health
department. This has created a problem in that whereas the health department is
responsible for garbage collection, the refuse fleet including repairs, maintenance
and fueling is controlled by the District Engineer. It becomes unfair to gauge the
performance of the department that lacks full responsibility. They noted that in
some countries, solid waste management stands as a fully fledged department.

155
7.3 CONCLUSIONS
7.3.1 PLANNING AND BUDGETING
Planning is a very important tool in management and properly developed plans which are
supported by adequate and reliable data help management in coming up with realistic
decisions, strategies and budgets to achieve organizational objectives or targets. Data when
well interpreted provides information about the magnitude and scope of the challenge faced.
KCC and the divisions failed to create a database on the variables concerning waste
management and as a result most of the efforts put in the preparation of work plans and
budgets and decisions undertaken, do not appropriately address the challenges faced in
garbage collection and disposal.
The division budgets, especially on waste management were not based on proper assessment
of garbage being generated and therefore could not provide enough funds for garbage
collection, transportation and disposal.
Garbage collection, transportation and disposal has remained a big challenge to KCC and the
divisions due to inappropriate strategies, budgets and decisions made due to lack of
appropriate data among other reasons.
7.3.2 GARBAGE DISPOSAL
7.3.2.1 Solid Waste Management Awareness
Educational programs are a practical approach to enhancing public awareness in waste
management. A sensitized public is very critical in the management of waste. KCC’s programs
such as; separation of waste at source, site selection for refuse skips and land fill location,
waste recycling, home compositing, litter clean-up campaigns, waste minimization, policing
against illegal waste management and household hazardous waste management systems can
not be successfully implemented without creating public awareness.
KCC and divisions failed to carry out solid waste management awareness campaigns and as a
result the public has not appreciated the salient issues required of it in waste management.
156
Lack of public participation increases resistance of the people to embrace Council’s solid waste
management programs and has also contributed to the Council’s failure of attaining the 80%
targeted collection level.
7.3.2.2 Enforcement of the Solid Waste Management by-laws
The failure of KCC and the divisions to enforce the provisions in the Solid Waste Management
ordinance, 2000 has resulted into the public to engage in illegal solid waste management
practices. Practices such as indiscriminate dumping of garbage, burning of garbage and non
sorting/separation of refuse hinder the operations of garbage collectors. Indiscriminate
dumping of refuse in unauthorized sites leads to neglect of these sites by KCC and the
divisions.
7.3.2.3 Working Conditions of Personnel in Garbage Collection
The staff involved in the collection, transportation and disposal of refuse is not provided with
protective clothing and their wages are delayed. The poor working conditions coupled with
delayed payment of wages affect staff morale and performance. KCC and divisions may fail to
achieve their garbage collection, transportation and disposal targets if they are not supported
by the staff directly involved on the ground.
7.3.2.4 Transportation of Garbage
KCC and Divisions lacked a fleet management system which would help them in the
management of vehicle aspects such as replacement, repairs, maintenance and tracking to
minimize on constant vehicle break down and safeguard against vehicle misuse.
7.3.3 ENGAGEMENT OF PRIVATE GARBAGE COLLECTORS
Coordination of the activities of various stakeholders, especially private collectors is very
critical in solid waste management. Lack of a coordination mechanism affects the performance
of private garbage collectors and this is manifested in failure by KCC to legally recognize the
role of private sector participation.

157
7.3.4 SUPERVISION, MONITORING AND CONTROL OF SOLID WASTE MANAGEMENT
ACTIVITIES
When the project or activity is supervised and monitored it is more likely that its objectives will
be achieved. Any deviation from planned output should be identified and corrective measures
devised. There is inadequate supervision and monitoring by KCC and divisions of the activities
involved in solid waste management. Private collectors and refuse gangs are not supervised.
There is also lack of a control mechanism to review performance of garbage collection
initiatives. Limited supervision, monitoring and control has led to poor performance registered
by the divisions as evidenced by the presence of uncollected garbage in the city.
7.4 RECOMMENDATIONS
7.4.1 PLANNING AND BUDGETING
Planning is an important tool in general management of projects, government programmes
and activities. It is essential to have plans that are based on realistic and reliable data and
information. We recommend that:
7.4.1.1 KCC and divisions should recognize and analyze the factors contributing to the growth
in waste to draw up appropriate annual strategies for waste management.
Management response
KCC prepared a strategy for waste management in 2006 to cover a period of 10
years. Due to the ever changing waste environment, KCC is now compelled to
address new challenges that have emerged and this may involve preparation of
another strategy before the expiry of the current one so as to capture the salient
issues as they develop.
7.4.1.2 KCC and divisions should ensure that a database is created for all the variables on solid waste
management such as the amount of garbage generated and collected, the composition of the
solid waste stream, generators by geographical areas among others which should be updated

158
regularly to enhance the appropriateness of budgets and work plans to address the challenges
faced in solid waste management.
Management response
The data base exists but shall be expanded to include generators by geographical
area as recommended. The work plans to address the challenges faced in solid
waste management shall be incorporated in the strategies to be formulated by KCC
and updated annually or more regularly where appropriate.
7.4.2 DISPOSAL OF SOLID WASTE
Solid waste management awareness campaign
It is very important that the public is made aware of the good practices in solid waste
management system. We recommend that:
7.4.2.1 KCC should design solid waste management awareness campaigns which should regularly be
carried out to increase public awareness on matters of waste management such as
sorting/separation of garbage, home compositing, proper disposal practices, waste
minimization and policing against illegal waste management practices.
Management response
KCC through the Government of Uganda received a credit from the International
Development Association (IDA) to finance the Kampala Institutional and
Infrastructure Development Project Phase I (KIIDP). Part of the credit will be
applied to cover eligible payments under the contract for public relation and
awareness services which is expected to cover a period of 2 years. A community
sensitization strategy shall be embraced in the adopted strategy.
7.4.2.2 KCC should consider allocating adequate funds to solid waste management awareness
campaigns during budgeting.

159
Management response
This shall be done as part of the budget for waste management. Added funding for
servicing and operationalising of the new refuse plant needs to be harnessed from
the Centre and prioritization of garbage management by Divisions needs to
emphasized.
7.4.2.3 The programme for the translation of the KCC (Solid Waste Management), Ordinance, 2000
into local dialects should be revived to ease the dissemination of solid waste management
awareness information.
Management response
This shall be done as soon as the financial situation of KCC improves and needs to
be prioritized in the coming budget FY 2010/2011. It may also be carried out
through the KIIDP project under the public relations services described earlier.
7.4.2.4 KCC should consider introducing waste management programmes to city schools.
Management response
A discussion between KCC and officials from the ministry of education and sports is
necessary and shall be arranged soon. There is need to mainstream appropriate
waste handling messages and other issues of environment into the school
programs especially at primary level.
7.4.2.5 KCC should consider sensitizing other law enforcement agencies in the City and request them
to join hands in the enforcement of the solid waste management ordinance.
Enforcement of the by-laws
7.4.2.6 KCC and the divisions should operationalize the SWM ordinance including the enforcement of
the provisions using the already existing enforcement department.
Management response
KCC needs to prioritize and adequately budget for this activity.

160
7.4.2.7 The enforcement department of KCC should be restructured to include solid waste
management enforcement as its core activity and ensure that the public complies with the
provisions in the SWM ordinance.
Management response
KCC has professionalized its enforcement department. Policing against illegal
waste practices now needs to be integrated and emphasized in the day to day
assignment of City Law Officers. There is need to activate village courts to
reprimand illegal dumpers that are caught in the different areas of the City.
7.4.2.8 The public should be sensitized on the provisions in the by-law and the role of the
enforcement department in solid waste management as this will increase compliance and
better solid waste management practices.
Management response
This shall be done as part of the public relations campaign explained earlier in
7.4.2.1.
7.4.2.9 Other organs of the Council such as the local Councils and parish chiefs should also be
encouraged to enforce the provisions in the SWM ordinance.
Management response
This is being done and shall be improved when the public relations campaigns and
awareness are ongoing.
Working conditions of personnel in garbage collection
7.4.2.10 Management at both KCC and divisions should exercise good budgetary discipline and
prioritize the procurement of protective clothing to the refuse gang members to improve their
working conditions and morale.
Management response
KCC understands that it is essential to provide the necessary tools to enable
employees perform their duties. KCC shall soon prioritize provision of safety ware

161
and gear to those involved in actual implementation of projects. It shall come as a
package separate from wage/salary.
7.4.2.11 Wages of staff involved in refuse collection and transportation should be paid in time to avoid
unnecessarily staff dissatisfaction.
Management response
KCC endeavors to pay its employees on time. KCC also recognizes that it is only
motivated and satisfied employees that can enable an organization to function
effectively and efficiently.
Transportation of Garbage
A good fleet management system keeps vehicles in good running condition and ready to
facilitate the daily collection and transportation of refuse. We recommend that:
7.4.2.12 KCC should develop suitable repair and maintenance policies to allow the regularrepair and
maintenance of vehicles with ease and this will reduce on the frequency of vehicle breakdown
and the time vehicles spend in the garages.
Management response
KCC is in the final stages of preparation of a fleet management system and expects
to implement it as soon as it has been approved by Council. From late December
2009, the current fleet has been beefed up by introduction of at least 35 – 40 new
trucks. KCC shall endeavor to have this fleet functional in as far as resources are
available.
7.4.2.13 KCC should provide for adequate annual budget provisions that will allow them accumulate
funds needed to replace their fleet whenever they become old and worn out in accordance
with the government vehicle replacement policy.
Management response
This shall be done through prioritization of fuel apportionment for garbage
collection and transportation.

162
7.4.2.14 KCC and the divisions should establish the amount of fuel required by each vehicle type per
trip of refuse collected and record the vehicle movements and the number of trips made in a
day. This will help in making drivers accountable for the fuel given to them and will increase
their efficiency.
Management response
This is being done and has proved helpful for planning and effective truck
monitoring during waste transportation operations.
7.4.2.15 KCC and divisions should consider hiring private trucks as a stop gap mechanism in case of
total vehicle breakdown and emergency cases.
Management response
This shall be considered though it is envisaged to be overtaken by events since KCC
acquired new refuse trucks, in December 2009, under the Chinese Grant.
7.4.3 ENGAGEMENT OF PRIVATE GARBAGE WASTE COLLECTORS
7.4.3.1 KCC should develop a coordination mechanism that stipulates the specific roles and
responsibilities of each stakeholder in order to improve their efficiency in waste management.
Management response
KCC shall set up a mechanism in which all private collectors working in a particular
Division are known and programmed. The issue of demarcation of their operational
areas and giving them working programmes on a regular basis where applicable is
being considered.
7.4.3.2 All private collectors should be registered and authorized by Council to collect, transport
and dispose garbage in accordance with Sections 17 and 20 of the Solid waste management
ordinance, 2000.
Management response
All private collectors shall be registered and authorized by KCC. They will all be
required to obtain a trading license from KCC, in addition to other statutory

163
requirements. KCC will develop guidelines in a bid to control private collectors from
compromising Council‟s efforts and roles. All unauthorized collectors shall be
stopped from operating in a bid to control illegal waste management practices
normally exhibited by unauthorized groups.
7.4.3.3 KCC and divisions should consider establishing solid waste management work groups at each
administrative level that should regularly meet to review performance and develop SWM
strategies that match the current trends in development.
Management response
This shall be considered and incorporated in the waste strategies to be formulated.
7.4.4 SUPERVISION, MONITORING AND CONTROL OF SOLID WASTE MANAGEMENT
ACTIVITIES
7.4.4.1 KCC and divisions should develop a proper supervision, monitoring and control mechanism
stipulating the specific roles and responsibilities of each stakeholder. This will enable easy
supervision, monitoring and control of garbage collection, transportation and disposal.
Management response
Kampala district, just like any other districts in Uganda, is a decentralized district
administered under the Local Governments Act (1997). The City Council is
constituted by the Headquarter (HQ) under which are 5 administrative units
(Divisions), namely: Central, Kawempe, Lubaga, Makindye and Nakawa whereby
each division is a municipality with a fully fledged administrative unit. The
Headquarter essentially is a policy, coordination, and supervision institute. The HQ
mainly handles the waste disposal while the divisions mainly handle waste
collection and transportation.
7.4.4.2 All authorized garbage sites in the divisions should be mapped to allow proper
planning, supervision, monitoring and control of the activities at these sites.

164
Management response
KCC shall map all authorized waste collection centres in all Divisions to enable
better planning, supervision, monitoring and control of the activities of these
centres. That shall also facilitate the provision of recognized alternatives to the
community/public and may check the prevailing illicit dumping that happens in
several spots in Divisions.
7.4.4.3 A copy of the computer generated garbage collection data at the landfill should be regularly
submitted to respective divisions and information therein brought to the attention of Town
Clerks to help them plan and control performance.
Management response
The records at the landfill are regularly distributed to all the 5 KCC Divisions to
enable them check performance vis-à-vis resources invested in waste collection
and transportation.
7.4.4.4 Supervision, monitoring and control of garbage activities should not only be left to divisions,
but also should involve other lower administrative units such as local Councils and village
parishes.
Management response
KCC has embarked on involving the public and local Councils in the management of
waste. KCC intends to have this as a sustainable system and to include activities
therein in its future budget processes. KCC believes that the more the public is
aware of the challenges in solid waste management, the more they are willing to
help.

165
8 REGULATION AND ENFORCEMENT OF STANDARDS BY UGANDA
NATIONAL BUREAU OF STANDARDS (UNBS)
8.1 INTRODUCTION
8.1.1 MOTIVATION
Uganda National Bureau of Standards (UNBS) is a government parastatal charged with the
formulation of standards for quality assurance and control of consumer products on the
Uganda market. The body is responsible for ensuring consumer protection, public health and
safety, industrial and commercial development and international trade among others. The
Bureau is, therefore, mandated to protect the public against substandard, hazardous
(harmful), and underweight goods. According to the audited financial statements, total funding
to the Bureau increased by 33% from 5.3 billion in 2005/06 to 8.0 billion in 2007/08 in an
effort to facilitate the implementation of the above mandate.
However, despite the above mandate and facilitation, there are persistent press reports and a
general public outcry about substandard, hazardous and counterfeit goods on the Ugandan
market. Goods ranging from Consumer goods, Capital goods, Household goods, Agricultural
Inputs, Drugs and Pharmaceuticals are sometimes substandard. A survey carried out by the
National Association of Professional Environmentalists (NAPE) on the impact of hazardous
products on health and environment in Uganda in the towns of Entebbe, Kampala and Mukono
revealed that the local market had been flooded with thousands of products containing deadly
chemicals such as melamine in milk, mercury in cosmetics and pesticides among others.
According to the Report, cosmetics, creams, oils contained harmful chemicals which damage
the liver and lungs as well as affect the reproductive system. The chemicals cause bone
malformation, poor brain development, cancer and death, in some instances. They also cause
infertility, by disabling sperms from swimming to the egg for fertilization, and prevent the
development of limbs in a foetus. In some women, the chemicals caused loss of hair and skin
bleaching as shown in the picture below:

166
Courtesy photo- UNBS: Effects of mercury found in skin lightening cosmetics
In addition, pesticides cause tumours and affect the human immune system, lungs and liver.
Gramovone pesticide, used for controlling weeds, destroys fingers and nails when inhaled or
during contact with the skin. A doctor at the Mulago School of Public Health confirmed that the
Hospital was already receiving medical cases linked to the substandard products, such as
bathing soap with mercury, dry battery cells, electrical products, food stuffs and drinks,
electronic products and textiles\footwear.
A Senior Analyst and Head of Chemistry Laboratory at UNBS acknowledged the presence of
substandard goods on the market but said that while the Bureau was doing everything within
its means to reduce the problem, it was not adequately facilitated.
The audit, therefore, sought to ascertain whether UNBS was performing its role of regulating
and enforcing product standards to the satisfaction of its stakeholders.

167
8.1.2 Background
Uganda National Bureau of Standards (UNBS) is a statutory organization under the Ministry of
Tourism, Trade and Industry established by The Uganda National Bureau of Standards Act of
Parliament No.1 of June 1983 (Cap. 327) and became operational in 1989. This was aimed at
enhancing the competitiveness of local industries and promoting quality, safety of
goods/services and fair trade. The UNBS headquarters are located at Nakawa Industrial Area
with regional offices in Lira, Mbale, Jinja, Kampala and Mbarara. The Bureau is responsible for
Standards development, Quality assurance, Testing and Metrology.
In 1993, the Department of Weights and Measures in the then (former) Ministry of Commerce
was merged with UNBS. This merger added the function of legal Metrology to the Bureau’s
already existing Industrial Metrology function.
8.1.3 Mandate
The mandate of UNBS is derived from Section 3 of the 1983 UNBS Act of Parliament (CAP327)
and The Weights and Measures Act 1964 (CAP 103). The mandate is twofold;
(i) Promotional - Promoting and facilitating trade and Industries and promoting the quality
and competitiveness of locally manufactured products.
(ii) Regulatory - Enforcing standards to protect consumers and ensuring fairness in trade.
8.1.4 Vision
The UNBS vision is: “To be a leading institution of International repute in the provision of
standardization services.”
8.1.5 Mission
The UNBS mission is: “To enhance National Development through the application of standards
in Trade, Industry and Consumer Protection”
8.1.6 Uganda National Bureau Standards Objectives
The Uganda National Bureau Standards (UNBS) is charged with the responsibility of enhancing
national development through the application of standards and has the following objectives:

168
i. To promote the quality of goods and services produced in Uganda
ii. To enhance the competitiveness and export capabilities of local industry and products.
iii. To protect the health and safety of the public against hazards related to locally
manufactured and imported products.
iv. To protect consumer interests and ensure fairness in the market place.
v. To maintain an internationally traceable National Measurement System.
8.1.7 The Bureau‟s Funding
Being a government parastatal, UNBS is funded mainly through government grants. Other
sources of funding for the entity include donations (Donor funding) and the locally generated
revenue from verification /laboratory analysis fees. The funding of UNBS at the time of the
audit stood as tabulated below for the years under review:
Table 1 showing UNBS sources of funding for the period 2005/06 to 2007/08
YEARS
FUNDING
2005/06
(000‟)
2006/07
(000,000‟)
2007/08
(000‟)
TOTAL
(000‟)
Govt Grants (UGX) 3,811,900 3,830,001 4,774,641 12,416,542
Donations (UGX) 180,470 174,676 49,550 404,696
Verification/Lab
Analysis Fees (UGX)
1,340,200 1,620,532 2,076,206 5,036,938
Fuel Marking 1,140,181 1,140,181
TOTAL 5,332,570 5,625,209 8,040,578 18,998,357
Source: Audited Accounts and UNBS Progress reports
8.1.8 Scope
The audit focused on inspection by UNBS of goods both locally manufactured and imported
into the country with the aim of ascertaining whether the Bureau is effectively performing its
role of controlling the influx of sub-standard goods onto the Ugandan market. Other areas
such as Legal Metrology which enforces Weights and Measures Act of 1964 were also
considered. The Audit was conducted on, UNBS which is a parastatal under the Ministry of
Tourism, Trade and Industry (MoTTI).
The audit covered the UNBS headquarters at Nakawa-Kampala, being the main administrative
unit and contact point, five Regional Offices of Kampala, Mbale, Mbarara, Lira and Jinja, being

169
the location points of UNBS in the country. It also covered the major border entry points and
ICDs managed by UNBS such as Malaba, Busia, Entebbe Airport and Mutukula, which account
for over 80% of Uganda’s imports. Rwakhakha and Katuna were included to establish the
volume of activities at the unmanaged entry points. The three financial years of 2005/06,
2006/07 and 2007/ 008 were considered to establish the trend of performance over the
period.
8.2 FINDINGS
INTRODUCTION
The findings are summarized from primary source data and documentary reviews and
presented in tables, graphs and photographs.
8.2.1 Inspections of Goods
UNBS Annual activity plans detail a number of expected inspections for the various inspection
activities to be carried out on both locally manufactured and imported goods.
However, a review of UNBS annual performance reports for the period 2005/06 to 2007/08
revealed that the Bureau did not achieve some of its planned inspection activities as shown in
the table below:
Table 2 Showing Planned And Actual Inspections Carried out by UNBS Between 2005/06 and 2007/08
Source: * Extracts from UNBS Annual Ministerial policy statements and Budget framework papers
figures are for 10 months July 2005-April, 2006 and July, 2006-April, 2007.
Activity 2005/06 2006/07 2007/08 Planned Actual Variance
Planned Actual Variance Planned Actual Variance
Calibration services 500 311* (189) 650 750 100 1,290 1,022 (268)
Product Certification 370 356* (14) 140 150* 10 200 165** (35)
Import Inspection 12,000 8,151* (3,849) 12,500 8,750* (3,750) 14,500 11,548 (2,952)
Factory inspections - - - 68 42* (26) 150 84** (66)
Market surveillance - - - 100 72* (28) 250 229** (21)
Lab Analysis tests 2,950 2,404* (546) 2,975 3,265* 290 2,650 3,925 1,275
Standards Development
202 78* (124) 202 420* 218 180 220** 40
Verification of weights and measures
510,000 425,125* (84,875) 250,000 395,142 145,142 235,000 390,695 155,695

170
** UNBS Annual reports figures are for 11 months July 2007-May, 2008
The above table shows the various inspection activities undertaken by UNBS. It reflects the
performance of the Bureau for the period 2005/06 to 2007/08. Further analysis of the
information contained in the above table shows that UNBS was unable to meet most of its
planned inspection activities as presented here below:
Import Inspection
12,000 import inspections were planned in the FY 2005/06 but only 8,151 were actually
carried out leaving 3,849 inspections undone, representing 32% for the ten months
performance figures reviewed. In 2007/08 14,500 import inspections were planned but only
11,548 were conducted leaving 2,952 consignments uninspected, representing 21%. A trend
analysis of this activity over the period under review shows that whereas the UNBS
management plans (budgets) for this activity were on the increase year after year, the actual
performance still fell below targets for the entire period under review.
This was a result of setting targets without due consideration to prior year’s actual
performance and/or change of management priorities during the course of the year. For
instance, in the FY 2006/07, a target of 12,500 inspections was set yet the actual performance
in FY 2005/06 was only 8,151 inspections. Such a target was unrealistic.
Local Factory Inspections
68 local factory inspections were planned for the year 2006/07 but only 42 were carried out,
representing an achievement of 62%. In 2007/08 the inspection target was raised to 150, but
the Bureau only managed 84 inspections, representing 56% total local factory inspections in
that year. From the above analysis, management appears to have placed little emphasis on
local factory inspections, yet this is a vital activity in as far as ensuring the quality of locally
manufactured goods is concerned.
According to the management, this downward trend was because most of the substandard
commodities were imported products and not locally manufactured commodities. However, it
is important to note that Uganda has numerous factories and the industrial sector is steadily
growing at a rate of 9.1% by FY 2007/08 (Background to the Budget 2009/10). Annual
Statistical Abstracts of the Uganda Bureau of Statistics for the period 2006-2008 indicate a

171
39% increase in Uganda’s industries over the period that is, from 150 establishments in 2006
to 209 in 2008.
Verification of Weights and Measures
510,000 scales were planned to be verified in the FY 2005/06 but only 425,125 were actually
verified, leaving 84,875 undone. This was attributed to management shifting its emphasis from
verification of weights and measures to import inspection activities since the majority of
substandard commodities were majorly imports at the time. However, it was noted that
although the management surpassed its targets in 2006/07 and 2007/08, its planning figures
were declining (ie.510,000 for 2005/06. 250,000 for 2006/07 and 235,000 for 2007/08).This
implies that the Bureau operated below its potential since it had exhibited ability to verify
425,125 scales in 2005/06.This downward trend is shown in the line graph below:
Source: OAG analysis from UNBS Annual Ministerial policy statements and Annual
management reports
We observed that UNBS planned for few inspection activities considering the huge unexpected
increase in the volume of goods that were imported into the country during the period under
review. According to the Uganda Bureau of Statistics Annual Statistical Abstract for 2008,
Uganda’s imports increased in terms of value by 77% over the period that is, from US$
2,557,308M in 2005/06 to US$4,525,859M in 2007/08 due to the increasing demand for
commodities created by the increasing population (growth rate of 3.1%).
However, the Bureau registered positive performance in the FY 2006/07 in the areas of
calibration, standards development, product certification and laboratory tests as it managed to
surpass its planned inspections.
Planned and actual verification of weights and measures by UNBS
0
100000
200000
300000
400000
500000
600000
2005/06 2006/07 2007/08
Years
Nu
mb
er
of
Sca
les
Sc
ale
s
Actual
verifications
Planned
Verifications

172
The inability on the part of the management to meet its inspection targets, according to the
audit team, was attributed to the following factors: Unmanaged entry points, the focus by
management on revenue generation and classification of goods for inspection as explained
here below:
Unmanaged Entry Points
Field visits revealed that UNBS was not represented at 141(92%) ICDs out of 154 and 19
(79%) Border entry points out of 26 which led to insufficient inspections. The management
attributed this underrepresentation to limited capacity in terms of human resources and
logistics.
Focus on Revenue Generation
The interviews conducted with various staff, office correspondences and reports perused by
the audit team revealed that the UNBS management placed much emphasis on generating
revenue internally from the verification of weights and measures, laboratory analysis tests,
calibration of equipment and product certification other than providing or rendering services to
the public, which is contrary to the mission, goals and objectives for which the organization
was established.
The performance of some staff and or Regional Offices was rated according to the amount of
revenues generated as evidenced by the monthly performance reports from Regional Offices
and the job description of the officer in-charge Weights and Measures Department. This was
further evidenced by the estimates prepared on the basis of expected revenue and not
number of equipment or areas inspected.
This was attributed to inadequate funding to UNBS. According to the UNBS Management, since
the start of its operations it has never received any financial support towards development
expenditure during this period and had to rely on internally generated funds to be able to
acquire some of the critically needed laboratory and office equipment.
UNBS further explained that revenue generation is a consequential outcome and an indirect
product which increases with the volumes of activities performed. For example, certification is

173
demand driven by local manufacturers seeking for certification to access better markets which
is a promotional and at the same time indirectly consumer protection aspects of UNBS.
The management also attributed the emphasis on revenue to huge budget shortfalls the
Bureau was experiencing and the fact that AIA accounted for 36% of its budget.
Non-inspection of low risk goods/Classification of goods for inspection
According to the UNBS staff interviewed, goods imported or locally manufactured were
classified as high risk or low risk goods. High risk goods were those goods that were
considered sensitive and likely to cause direct harm to the public hence were given high
priority while low risk goods were those that were considered less harmful and inspection was
optional (at the discretion of the inspector). Examples of goods categorized as high risk were
processed food stuffs, motor vehicle tyres, rectified (neutral) spirits, electrical items, and fuel
among others. The audit team noted that non-inspection of goods on account of having been
classified as low risk goods limited the Bureau’s ability to meet its planned inspections. The
fact sheets collected from the field in this regard provide testimony to this fact.
The management attributed this to the fact that risk analysis is a process practiced
internationally to effectively target resources where they are needed most. UNBS can consider
sampling on the low risk goods depending on the availability of additional staff in the
inspections and other resources e.g Laboratory consumables or reagents, relevant standards,
logistics such as space.
8.2.2 Staffing Levels and Deployment
In order to mitigate the influx of substandard goods on the market, it is good practice that
UNBS deploys at all border entry points in the country and it should have a documented policy
on recruitment. In addition, the UNBS approved staff establishment details out the total
number and categories of staff required to effectively execute the UNBS mandate.
However, the audit revealed that 249 out of 457 approved positions in the staff establishment
were not filled; staff was not deployed at all entry points. Here below are the factors
responsible for the above development, according to our analysis:
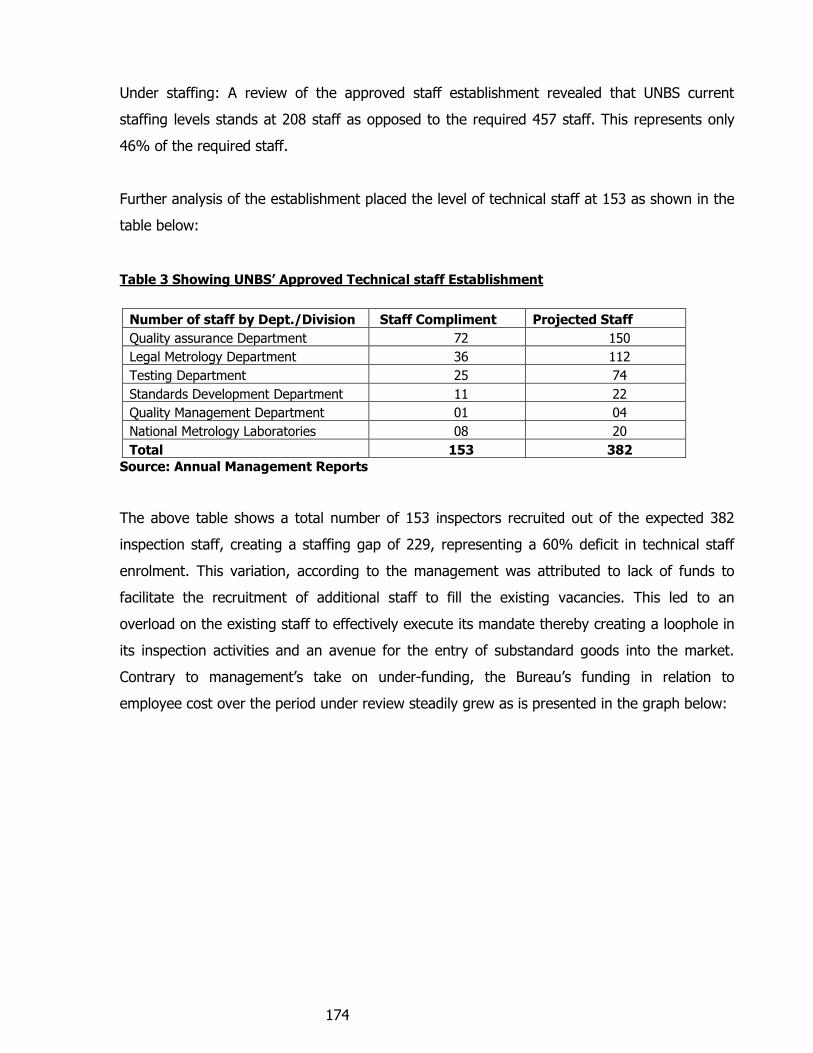
174
Under staffing: A review of the approved staff establishment revealed that UNBS current
staffing levels stands at 208 staff as opposed to the required 457 staff. This represents only
46% of the required staff.
Further analysis of the establishment placed the level of technical staff at 153 as shown in the
table below:
Table 3 Showing UNBS‟ Approved Technical staff Establishment
Source: Annual Management Reports
The above table shows a total number of 153 inspectors recruited out of the expected 382
inspection staff, creating a staffing gap of 229, representing a 60% deficit in technical staff
enrolment. This variation, according to the management was attributed to lack of funds to
facilitate the recruitment of additional staff to fill the existing vacancies. This led to an
overload on the existing staff to effectively execute its mandate thereby creating a loophole in
its inspection activities and an avenue for the entry of substandard goods into the market.
Contrary to management’s take on under-funding, the Bureau’s funding in relation to
employee cost over the period under review steadily grew as is presented in the graph below:
Number of staff by Dept./Division Staff Compliment Projected Staff
Quality assurance Department 72 150
Legal Metrology Department 36 112
Testing Department 25 74
Standards Development Department 11 22
Quality Management Department 01 04
National Metrology Laboratories 08 20
Total 153 382

175
Graph 1 Showing Government grants to UNBS during the period 2005/06 to
2007/08
Source: OAG analysis of UNBS Audited final accounts for the relevant periods
From the graph above, UNBS funding (Government grants) steadily grew from 3.8 billion in
2005/06 to 4.7 billion in 2007/08, representing a 25% increase over the period. The
management made an effort to increase staff from 151 to 184. However, the Institution has
not yet attained the optimal staff level. According to our analysis, the management priorities in
the allocation of funds to its various functional areas was not clear as most heads of
departments interviewed expressed dissatisfaction with the budgetary formulation and
implementation.
Staff Recruitment and Deployment:
An interview with the UNBS Human Resource Manager revealed that the Bureau staff
recruitment was demand driven. In this case staff was deployed according to volume of
activity at the respective work stations. This was also attributed to understaffing as the Bureau
did not have adequate staff to deploy at all existing work stations.
The demand driven recruitment method leaves the purportedly less busy areas unattended
hence insufficient inspections. For instance, boarder entry points as Lwakhakha and Suam in
the East, Oraba in West Nile and Ntoroko in the West have no single UNBS staff. This
contributes to the entry of substandard goods into the Ugandan market.
UNBS Funding
3,811,900,001 3,830,001,000
4,774,640,802
2005/06 2006/07 2007/08
Years
Amount

176
8.2.3 URA Green Channel Clearance Systems
The UNBS Mandate as provided for in its 1983 Act of Parliament and the Import Inspection
and Clearance Regulations of 2002 require the Bureau to inspect all goods.
However, the audit team found that sometimes UNBS did not inspect goods cleared under the
Green Channel System. Under this system, goods imported by reputable and tax compliant
URA clients were assessed for taxes and permitted to proceed to the market with minimum
delay.
The management of UNBS admitted that Green channel is a problem to them. To mitigate this,
management was in the process of securing a service provider to inspect goods from their
point of origin before dispatch to Uganda (PVOC). In addition, management requested URA to
allow them connectivity into their ASCYUDA system to enable fast tracking of consignments
destined for Uganda.
8.2.4 Inspection Of Goods At Owner‟s Premises
According to UNBS Inspection procedures that spell out the inspection process, goods are
supposed to be in the custody of the Bureau until the completion of their testing.
However, the audit revealed that the Bureau at times lost custody of goods before testing as a
result of release to owners premises.
Management attributed the following to be the cause of this scenario:
UNBS‟ incapacity to test goods at entry points
Field visits and interviews conducted revealed that UNBS did not have adequate testing
facilities (laboratories and equipment) as well as warehouses at entry points. As a result of this
setback, UNBS released some goods to their final destinations (Owners Premises) where they
would eventually carry out the testing. However, the practice led to goods going to the market
without being inspected as follow up became a problem given UNBS staffing position and
communication gaps between the border points and head office, hence leading to the entry of
substandard goods into the Ugandan Market.

177
According to UNBS, it is important to note that conditional release is an international
phenomena meant to facilitate trade while ensuring consumer protection. It is better to
improve the management of this process rather than completely eliminating it from the
inspection process.
8.2.5 Enforcement Of Standards
The mandate of UNBS as derived from Section 3(f) of the 1983 UNBS Act of Parliament
(CAP327), the Weights and Measures Act 1964 (CAP 103) and the Import Inspection and
Clearance Regulations,2002 require the Bureau to enforce standards in the protection of the
public against harmful ingredients, dangerous components, shoddy material and poor
performance.
The audit however, found that the Bureau was unable to effectively enforce standards. The
management attributed this to the following:
Obsolete and inadequate law: The current legislation governing UNBS is obsolete as it did not
provide deterrent penalties for manufacturers or importers of products which do not comply
with the set standards. For instance, Section 26 (1 and 2) of the UNBS Act, 1983 provides
penalties ranging from fines of Shs.10,000 to a maximum of Shs. 30,000 or imprisonment
ranging from 12 Months to a maximum of 24 months or both such fine and imprisonment. The
penalties provided for under this law are non deterrent considering the value of goods involved
which is normally in terms of millions or billions of shillings.
The same Law is inadequate as it does not cover counterfeit goods, does not allow the Bureau
to prosecute offenders directly and is pegged to the existing standards alone.
Existence Of Other Regulators
There exist other bodies or organizations in Uganda charged with the responsibility of
enforcing standards. Such bodies include: Ministry Of Health, National Drugs Authority
(Drugs), Ministry of Agriculture (Agric products), Dairy Development Authority (Dairy products)
Ministry of Works (roads and construction materials), among others. This, therefore, created a
conflict in mandates and /or roles in such a way that it was not clear at what point the Bureau
was required to intervene.
178
To overcome this setback, management has made efforts to sensitize the regulators to assume
their enforcement role so that the Bureau concentrates its resources on areas not covered by
other regulators.
8.3 CONCLUSION
8.3.1 Inspection Of Goods
The Bureau has not effectively managed all entry points, focused on revenue generation and
has not inspected goods categorized as “low risk goods”. Consequently, it has not achieved its
planned inspection activities thereby creating a loophole for the entry of substandard goods
onto the Ugandan market.
8.3.2 Staffing Levels and Deployment
UNBS staffing levels are far below its human resource requirement as its approved staff
establishment reflects a staff compliment of only 208 staff representing 46% of the required
457 staff. In addition, deployment was done, depending on the need at the time.
As a result, UNBS lacks capacity to manage all entry points, ICDs and cannot cope with the
URA Green channel system. The available workforce is overstretched and therefore not
effective in curbing the entry of substandard goods onto the market.
8.3.3 The Green Channel Clearance System
The Green Channel Clearance System limits UNBS Inspection activities as their staff is
sometimes not given the opportunity to inspect goods cleared under such a system. Although
it allows quick processing of entries, it makes inspection of goods difficult since the profiles
currently used in the selection do not have provisions for quality evaluation. As such, the other
institutions responsible for evaluating safety and quality are unable to effectively do their work
since they are not catered for in the profile.
Besides, URA is not obliged to hand over goods to UNBS for quality inspection after tax
assessment.
However, this system should not be a problem for UNBS, if its staffing levels were able to
match the rate at which goods are received and cleared by the URA system above. The

179
System should not stop them from exercising their mandate under the law. This is creating a
leeway or an avenue for sub-standard goods to enter the Ugandan market.
8.3.4 Inspection Of Goods At Owner‟s Premises
UNBS is not able to inspect all goods imported into the country at the entry points as required
and neither is it able to follow up and test/inspect all consignments released under seal to
owners. This inability to follow up on all consignments leads to goods entering the market
untested.
8.3.5 Enforcement Of Standards
UNBS enforcement arm has not been able to effectively curb the entry of sub-standard goods
into the Ugandan market due to the nature of the laws that govern it. These laws are non-
deterrent, inadequate, and are pegged to existing standards only. Besides, the inactive nature
of the-would be other government agencies tasked with the enforcement of standards also
compounds the problem.
8.4 RECOMMENDATIONS
8.4.1 Inspection Of Goods
UNBS management should ensure that all entry points are managed. Priority should be given
to inspection activities as opposed to revenue generation and should as much as possible carry
out random tests on goods profiled as low risk or design a system that will ensure better
classification and hence capture of more goods for inspection. This will ensure the safety of
consumers, attainment of planned inspections and minimize the influx of substandard goods
into the country.
8.4.2 Staffing Levels And Deployment
The issue of low staff levels requires an increase in the number of staff by management,
especially technical staff/inspectors from the various disciplines such as food science,
chemistry, toxicology, electrical engineering, metrology, laboratory analysis, among others. In
this way, a significant improvement will be registered in inspections as all entry points will be

180
effectively managed by competent staff capable of making independent and informed
decisions.
The management should take advantage of the increasing budgetary remittances from the
Central government to match the required staffing levels as par its approved staff
establishment.
8.4.3 Green Channel Clearance System
The UNBS management should coordinate with URA to ensure that the goods cleared under
the Green Channel System are tested for quality and conformity with standards before release
to the market. There is also need for the management to enhance collaboration with the
counterpart institutions in neighbouring countries regarding the trans-boundary movement of
hazardous consumer products. Establish pre-shipment verification protocols with countries
from where goods originate and ensure control of porous borders. This will ensure that all
goods entering into the country are inspected.
The Bureau should also implement the Harmonised System (HS) codes with the technical
nomenclature of products by URA to ease communication of the profiles. In the short run, the
management should ensure that all entries (imported goods) have got UNBS clearance, that is,
the UNBS import clearance certificate should form part of customs document.
8.4.4 Inspection Of Goods At Owner‟s Premises
In order to minimize cases of loss of custody, the management should strengthen or
streamline this system to ensure that all consignments released to owners are followed up and
inspected. It should also set up mini laboratories at entry points or expedite testing activities
by reducing on the time lag between receipt of samples and provision of test results.
In addition, Surveillance activities should be stepped up as a matter of urgency and public
awareness should be created as regards the risk/dangers of substandard consumer products
on the market, how to identify them and how to deal with them at the various levels of
society. This will assist in detecting and withdrawal from the market of substandard products
that enter the market as a result of gaps in the above system or porous/unmanaged borders.

181
8.4.5 Enforcement Of Standards
UNBS should petition/lobby Parliament and other stakeholders to amend the existing
governing legislation (laws) in order to introduce/ incorporate deterrent penalties for
manufacturers or importers of non conforming goods as well as give it the mandate to handle
counterfeit goods.
The Bureau should also decentralize its market and industrial surveillance activities to its
Regional offices in order to expand or widen its coverage and hence perfect its enforcement
activities.
There is also need for concerted and vigilant efforts by government (UNBS and sister
institutions), the private sector and civil society organizations to monitor and report the
presence of substandard and potentially harmful consumer products on the Uganda market.
Such products should be explicitly prohibited from entering the country or conditioned and
controlled by individuals or institutions qualified to handle them.

182
9 PASSPORT PROCESSING BY THE PASSPORT CONTROL
DEPARTMENT: MINISTRY OF INTERNAL AFFAIRS
9.1 INTRODUCTION
9.1.1 MOTIVATION
Article 29 (2C) of the Constitution of the Republic of Uganda, states that, “Every Ugandan shall
have the right to a passport or other travel document”. It is therefore a constitutional right for
every Ugandan to have a passport and the main objective of the Passport Control Department
is to issue travel documents expeditiously. The processing of passports by the Passport Control
Office (PCO) takes longer period, with an average delay of 9 - 30 days at Ministry
headquarters and regions respectively than the stipulated ten working days or fourteen
calendar days. This has resulted into the public being dissatisfied with the service rendered by
the government in this regard.
The audit sought to ascertain the magnitude of the delay in the processing of passports and
to examine the underlying causes of the delays and suggest to the management
recommendations that could improve its performance and reduce the days taken to process
passports.
9.1.2 DESCRIPTION OF THE AUDIT AREA
The Ministry of Internal Affairs (MIA) and, particularly, the Directorate of Citizenship and
Immigration Control (DCIC), is responsible for the issuance of passports in Uganda. Other
documents, such as: Certificates of identity, Conventional travel documents and temporary
movement permits are also issued by the Directorate.
The approval and printing of passports is centralized at the Ministry headquarters in Kampala,
also referred to as the issuing office, but the issuance of application forms and the distribution
of processed passports is decentralized to regional and district immigration offices. There are
four (4) regional offices (Mbale, Fortportal, Gulu and Kampala) and ten other passport issuing
centres at the districts (Mbarara, Masaka, Mubende, Hoima, Masindi, Lira, Arua, Mityana,

183
Tororo and Jinja). The Passport Control Office in the Citizenship Control Department
coordinates all the activities regarding the processing of passports.Some Ugandan Embassies
and High Commissions abroad, such as those in South Africa and the United Kingdom, also
process and issue passports to Ugandans abroad.
9.1.3 Mandate
The Ministry of Internal Affairs (MIA) and the Directorate of Citizenship and Immigration
Control derives its mandate to issue, monitor and ensure safe custody of Ugandan Passports
from the Constitution of the Republic of Uganda under Article 15, the Uganda Citizenship and
Immigration Control Act (Cap.66) and Statutory Instruments No.15 and 16.
9.1.4 Vision
The vision of the Directorate of Citizenship and Immigration Control is: “Smooth, lawful stay
and movement of persons in and out of Uganda”
9.1.5 Mission
The mission of the Directorate of Citizenship and Immigration Control is:
“Provision of quality services to Ugandans and foreign nationals who enter and move out of
Uganda”
9.1.6 Objectives of the directorate
The strategic object of the Directorate pertaining to the issuance of passports
include:
To increase the pace of processing immigration documentation.
To improve the control and facilitation mechanism for exit and entry into Uganda.
To improve the method of identifying both citizens of Uganda and foreign nationals.
To set up training programmes and develop a curriculum for the Directorate.
To install communication at Headquarters and border posts.
9.1.7 Activities in the directorate
The following activities are undertaken in the directorate regarding the issuing of Passports:
Issuing of application forms
Receipt of application forms
Interviewing applicants

184
Verification of citizenship
Printing and signing Passports
Delivery of Passports
Supervision of staff
Motivation and appraisal of staff
Training and coaching of staff
Development of the data base for all passport categories
Carrying out customer feedback surveys
Developing a Directorate website
Creation of customer care centres
Other activities at the directorate include:
Improvement of the quality of service delivery and building confidence among the public
through effective public relations strategies
Training staff in relevant performance fields to improve efficiency and effectiveness in
service delivery
Provision of communication equipment to link the border posts and the Ministry
Headquarters
Motivation of staff through awards and rewards
Improvement on non-tax revenue collection
Renovation of dilapidated office blocks
Provision of transport facilities, utilities and logistics for all immigration staff
Acquisition of appropriate ICT hard and software
Coordination and monitoring of all the immigration posts in the country
Computerization of all the registers of the Directorate
Establishment of a website for the Directorate, to strengthen public relations
9.1.8 Funding
The activities of MIA and the DCIC are funded through government budget support. The
Ministry received and spent an average of Shs.4.1 billion per annum on the DCIC as follows:

185
Table 1: Annual Directorate expenditure
FINANCIALYEAR AMOUNT SPENT ON DCIC (SHS)
2006/07 4.1 billion
2007/08 4.2 billion
2008/09 3.7 billion
TOTAL 12 billion
Average 4 billion
The Passport Control Office contributed Shs.3.01 billion (2006/07), Shs.3.37 billion (2007/08)
and Shs.3.45 billion (2008/09) in Non Tax Revenue (NTR) from passport fees totaling to
Shs.9.83 billion in the period under review as illustrated in the bar graph below:
Source: Audited Financial Statements of the MIA
9.1.9 Scope
The audit sought to:
Ascertain the number of days taken by the Immigration and Passport Control
Department to process a passport.
Ascertain the average delay in the processing of passports.
Identify the causes of delay in processing passports and
Suggest recommendations that could help the management to mitigate the causes of the
delay.

186
The audit focused on the processing of Passports by the Department of Passport Control
Office, Directorate of Citizenship and Immigration Control in the MIA in three financial years
from 2006/07 to 2008/09. It covered the Ministry headquarters and seven (7) of the thirteen
(13) regional/district immigration offices: Mbarara, Fort portal, Masaka, Mubende, Jinja, Gulu,
and Mbale.
9.2 FINDINGS AND CONCLUSIONS
9.2.1 PROCESSING OF PASSPORTS
The Processing of a passport, according to the DCIC, takes ten working days and each section
having a standard time allocated within which to perform its responsibilities as follows:-
Table 3: Number of days required to process a Passport
SECTION NUMBER OF DAYS
RECEIVING 1
PCO 1
PRINTING (STRONG ROOM) 4
DELIVERY (FRONT DESK) 4
TOTAL 10
The above criterion applies to both new issues and renewals.
NEW ISSUES
9.2.1.1 Overall Performance
The audit evaluated the total time it takes to process a passport through the whole process
from receiving and approval of application forms to the delivery of passports to clients. It was
noted that the processing of passports generally delayed with an overall average delay of 24
days in 2006/07, 25 days in 2007/2008 and 13 days in 2008/09. There were delays at both
the Ministry Headquarters and regional/district offices.
The processing of passports at the Ministry Headquarters registered average delay of 13 days
in 2006/2007 and 11 days in 2007/2008. Great improvement was noticed in FY 2008/2009
which registered an average delay of 2 days. There were instances when individual passports
were processed within less than the standard time of 10 days during FY 2008/2009. This

187
improvement was mostly attributed to the introduction of the new passport pre-payment
system introduced in September 2008, where applicants are required to pay in advance before
approval of application forms. This is intended to increase applicants’ commitment and
response time on matters regarding their applications.
The regional performance (all regions/district combined) registered an average delay of 34
days in 2006/2007, 39 days in 2007/08 and an improvement to 24 days in FY 2008/2009.
Jinja was the poorest performing region/district followed by Masaka and Fort Portal. Mbarara
district performed well. The good performance in Mbarara region/district was attributed to
effective communication by the immigration officer who uses his personal mobile phone to
either call or send short messages to applicants when their passports are ready.
The detailed performance of regional/district offices and the Ministry Headquarters is
illustrated in the following graph:
Bar graph showing delays at Headquarters, Regions/districts and Overall
Performance
Source: OAG analysis of Passport dates from registers at Headquarters and regional/district
offices
NB: 0 means “no records were availed to the audit team”

188
An analysis of the delays in Gulu and Mubende districts for FY 2006/07 and 2007/2008 could
not be performed due to poor record keeping at the stations during the period.
9.2.1.2 Sectional Performance
The audit also evaluated the time it takes to process a passport at different sections of the
production process. Each section has got a standard time within which to perform its activities.
However, it was not possible to analyze the performance of all sections due to poor record
keeping which was characterized by failure to record files in the registers and lack of dates on
some entries. Sectional performance was analyzed as described below:-
Delays from Receipt of Application Forms to Printing
It takes a maximum of 6 working days from the date of receipt of an approved application
form to the printing of a passport.
The audit revealed that the processing of application forms to the printing of a passport was
taking longer than the stipulated time. The delays averaged from 21 days in FY 2006/07, 25
days in FY 2007/08 and 11 days in FY 2008/09. The audit revealed that regional/district
offices were experiencing longer delays on an average of 31 days in 2006/07, 36 days in
20007/08 and 16 days in 2008/09.
For example, Jinja registered an average delay of 10 days in FY 2007/08 while Masaka posted
average delays of 87 and 65 days during FYs 2006/2007 and 2007/2008 respectively. The
delays at the Ministry Headquarters were 10 days in FY 2006/2007, 13 days in FY 2007/08 and
5 days in FY 2008/2009. The good performance for the head office during 2008/2009 is
attributable to the introduction of the new passport prepayment system.
The duration of delay from application form processing to the passport printing stages is
summarized in the following table:

189
Table 4: Delays from receipt of application forms to passport printing (days)
2006/7 2007/08 2008/09
HEADQUARTERS 10 13 5
GULU * * 10
JINJA 30 100 52
MBALE 18 2 9
MBARARA 4 3 4
MASAKA 87 65 14
MUBENDE * * 3
FORT PORTAL 17 11 17
REGIONAL AVERAGE 31 36 16
OVERALL AVERAGE 21 25 11
*Records not maintained
Source: OAG Compilation from Passport registers at Headquarters and regional/district
offices
Management response:
There has been an improvement in this area and the passports at the headquarters
are issued out within 10 working days. However, for the upcountry in issuing
stations, the time is still beyond ten days because there are delays from banks
upcountry in issuing the returns to the applicants, and also due to the fact that the
officers have to travel to the headquarters for processing and collection of the
ready passports. Regional Immigration officers have to first accumulate a sizeable
number of applications for 2 or 3 days before making an economic journey to the
headquarters. The problem is exacerbated by inadequate logistics at the
regional/district offices.
Delivery of Passports
The delivery section is supposed to deliver passports to clients within four working days from
the date of receipt of the printed passports from the printing room by the front desk to the
date of handover to clients.
It was noted that there were delays in delivering the passports to the clients, with an average
of three days in FY 2006/7, one day in FY 2007/08 and three days in FY 2008/09. At the
Ministry Headquarters, Passports were delivered to the clients on an average of two and three
days before the due delivery dates in 2007/08 and 2008/09 respectively. However,
regions/districts performed more poorly compared to the headquarters. Clients received their

190
passports after longer delays averaging three days after the due delivery dates in 2006/07
and 2007/08. In 2008/09 it was noted that clients received their passports on an average of
eight days after the due delivery dates.
The nature of the delay in the delivery of passports is summarized in the table 5 below:
Table 5: Delays in delivery of Passports
2006/7 2007/08 2008/09
HEADQUARTERS 3 -2 -3
GULU * * 1
JINJA 4 11 6
MBALE -3 8 6
MBARARA 0 -3 -3
MASAKA 2 -4 29
MUBENDE * * 6
FORT PORTAL 12 5 10
REGIONAL AVERAGE 3 3 8
OVERALL AVERAGE 3 1 3
*Records not maintained
Management response
It is not possible to keep passports in the delivery office (front desk) for 4 days
after production due to lack of storage facilities. The problem that is experienced is
the failure of applicants to collect their passports. A surcharge should be imposed
on all those applicants who fail to collect their passports on time, after due
notification.
9.2.1.3 Renewals
Renewed passports are expected to be delivered to the applicants within four (4) days after
the printing of the passports. The delays in renewals could not be analyzed from the time of
printing the passport to its delivery to the clients due to the poorly maintained renewals’
register which had many missing entries and or booking dates.
The analysis of renewals at the regional/district immigration offices was also impossible due to
lack of separate registers for renewals and new issues.

191
In the period under review, it took an average of 12, 4 and 3 days in 2006/07, 2007/08 and
2008/09, respectively to deliver renewed passports to applicants. The failure to adhere to the
stipulated delivery time caused an average delay of eight (8) days in 2006/07. However,
improvement was noted in 2007/08 where there was no delay and in 2008/09 renewed
passports were on average delivered to clients before the stipulated delivery time as shown in
table 6 below:
Table 6: Delays in the delivery of renewed Passports
YEAR Average days taken to
deliver renewed passports
Average delay
(Days)
2006/07 12 8
2007/08 4 0
2008/09 3 -1
Source: OAG Compilation from Passport registers at Headquarters
Management response
Two new records staff have been recruited to help streamline the renewals
register. All files that are taken out of the registry are recorded.
9.2.1.4 Exceptional Cases
It was noted that there were some isolated cases where the processing of passports had taken
a very long period of more than ten years. The issuing of passports on these files had been
delayed for an average of 14, 18 and 17 years during 2006/07, 2007/08 and 2008/09 Financial
Years. The application forms had been submitted between 1980 to 2004 and the passports
printed during 2006/07, 2007/08 and 2008/09 Financial years. These applications had been
submitted before the introduction of the new passport prepayment system when the
commitment of the clients was very low.
It was further noted that the delivery section still had un-collected passports which had been
processed at least six months prior to the audit. In October 2008, the last recorded date, un-
collected passports totaled 1,155.
192
The section did not have an up-to-date figure of un-collected passports at the time of audit
(September 2009). It was also not clear whether the applicants are notified when the
passports are ready.
Management response:
Before the introduction of the new system of prepayment for passports, there was
lack of commitment by applicants who would take longer to respond to queries or
pick up the processed passports.
Some applicants are confused by illegal middlemen who prolong the passport
process in preference to charging them exorbitant fees. We have issued strong
instructions to the police to arrest all those middlemen/agents who hang around
immigration offices and take advantage of innocent applicants.
9.2.2 CAUSES OF THE DELAYS IN PROCESSING OF PASSPORTS
The causes of the delays in the processing of passports can be traced throughout the entire
processing cycle. The following causes were identified during the audit:
9.2.2.1 Verification of Citizenship
The verification of applicants’ citizenship at the receiving section relies on the
recommendations of the various local administrators and government agencies comprising of
chairpersons of Local Council (LC I) to LC.III), the District Internal Security Officers (DISO),
the Criminal Investigation Department (CID) and the Resident District Commissioner (RDC).
At the receiving section, DCIC performs additional verification procedures such as interviewing
the applicant; considering physical features such as facial complexion and skin colour, among
others. The procedures are time consuming and lead to congestion and clients queuing for a
long time. All the staff interviewed confirmed that the verification methods used are time
consuming and render the exercise long because of the unconventional methods used.
Conclusion:
The use of unconventional citizenship verification methods delays the interviewing exercise
and the subsequent processing of application forms. This in turn affects the time taken to
submit approved application forms to the strong room for passport printing.

193
Management response:
Extra checks are performed to ensure that the right people get the passports. The
Verification process does not go by physical features and facial complexion alone,
it also involves a combination of several other verification aspects such as putting
to the applicant additional questions during interview. The lack of National Identity
Cards farther prolongs the verification exercise.
9.2.2.2 Information Technology
There was limited use of IT in the processing of passports. The activities such as: registration
of application forms, forwarding of files to the PCO and to the printing room, registration of
the printed passports and the delivery of passports to clients are performed manually. In the
strong room, the printing and indexing of passports is computerized. Tagging, writing,
stamping and registration activities are carried out manually.
Immigration officer capturing application files
We noted that the Department has not embraced the use of IT in its work processes. We
noted that 62% of the staff, interviewed possessed IT skills but only 9% were using IT in their
work situations.
Conclusion:
The Passport Control Office has not embraced the use of IT in the passport processing cycle
and this continues to hamper the attainment of the objective to increase the speed of
processing passports and other immigration documentation set by the directorate.

194
Management response:
The Ministry computers are not networked to link all passport issuing centres in
the country. A local area network exists at the headquarters and some immigration
offices such as that of the director and the commissioner are linked to the passport
printing room. The IT skills of staff will be harnessed to help improve the passport
production process.
9.2.2.3 Handling of Queried Applications
The applicant is supposed to be notified of the query by telephone. We noted that 90% of the
queried applicants are verbally notified when they make follow up on their applications at the
front desk. It is only 10% of the applicants who are advised on phone. This facility is only
available at the Headquarters in Kampala but not available in all the up-country stations. The
verbal communication of the queried application forms to clients affects the client response
time and hence the delays in the process.
In its efforts to reduce the incidence of queried application forms, the Directorate has
embarked on public awareness campaigns where television and radio programmes have been
introduced to enlighten the public on matters and procedures concerning the acquisition of
passports and other travel documents. Information and educational materials have also been
introduced and a Public Guide to Uganda Passport procedures (2009) was published with the
assistance from Justice Law and Order Sector (JLOS). The Directorate has also established a
website (www.immigration.go.ug) to strengthen public relations.
Conclusion:
The PCO lacks the efficient communication facilities required to increase efficiency in the
modern business environment which in turn hampers the business-client feedback mechanism,
which is very important in effective service delivery.
9.2.2.4 Records Management
We noted that the recording, filing and retrieval of client files at the central registry was not
properly done. Some files are brought or taken out of the registry without being recorded.
We also observed that entry into the registry is not restricted. It is accessible to every member
of staff including the support staff as well as to the clients.

195
According to the Officer-in charge of the central registry, the problems in the registry are due
to uncoordinated recording and filing activities between his section and the receiving section
and the lack of storage space which leads to haphazard storing of records. He further
explained that the registry still stores old records of as far back as the 1930s when the first
passport was issued in Uganda.
The audit inspection found the central registry overwhelmed by the huge volume of
records/files which were not properly stored. Records/ files with effect from 2001 to date were
still lying on the registry floor.
Poor records management affects the location and retrieval of records/files during the
processing of passports hence causing delays in the processes. Most affected is the renewal of
old passports where the client’s file has to be retrieved before the approval of application
forms. Also affected are new applications whose records have been queried, and also new
cases where a family maintains one file.
Out of the 216 files under renewals category which were requested for from the central
registry for up-country stations, only four files were retrieved and availed for audit after
searching for two weeks.
A project to computerize the registers had begun with the central registry whereby the
scanning of files had commenced. At the time of audit in September 2009 the project had
stalled due to implementation challenges.
Records/files fully packed in central
registry
Records/ files kept on the registry floor due
to lack of storage space

196
Conclusion
The Directorate has not established a proper record management system and this affects the
processing time of passports especially when the decisions to approve application forms
depend on reference information that has to be retrieved.
Management response
There is a register for booking files leaving the registry. The filing system in the
registry is inadequate due to the limited storage space. Files from the year 2005 to
date are not on shelves. Attempts to request for more storage space from the
Ministry of Public Service did not yield results. The Ministry has embarked on an
exercise of scanning records of files from 2001 to date. The exercise, however, is
slow due to lack of heavy duty scanning machines. Two records assistants have
also been recruited to increase on the manpower.
9.2.2.5 Staff Working Conditions
Staff commitment and concentration towards work was very low which in turn affects the
speed of processing passports.
It was noted that the flow of work during the processing of passports was affected by the poor
staff working conditions. When members of staff were interviewed about their working
conditions, they cited the problems of office accommodation, transport, communication and
poor remuneration. We also noted that immigration officers were using very old furniture both
at the regions/districts and at head office. All the visited regions/districts were housed in old
and dilapidated central government buildings constructed a long time ago. Most of the
immigration officers in the PCO at head office are also housed in old structures built during the
colonial times.
Staff at the head office also complained of air pollution caused by tobacco fumes from the
adjacent tobacco factory which is a health threat to their lives.
Another concern of the staff was that they are only provided with one pair of uniforms
whereas they are expected to be in uniform from Monday to Friday yet they have to wash in
between the working days.
We noted that all the 7 regional/district immigration offices visited, lacked transport facilities.
Officers have to travel to headquarters in Kampala by public means, using their personal

197
funds, to deliver clients’ application forms and collect the processed passports for onward
delivery to owners. The Department of Citizenship Control is allocated only one (1) vehicle,
which is mainly used to collect blank passports and embossed passports from B.O.U and
MoFPED, respectively.
We noted that it is difficult to conduct inspection visits satisfactorily in the whole country using
one vehicle.
Dissatisfaction was also expressed by staff against being financially marginalized; citing the
fact that despite the annual revenue contribution of Shs.3.01 billion (2006/07), Shs.3.37 billion
(2007/08) and Shs.3.45 billion (2008/09) from passport fees collection alone, their working
conditions remained poor.
Conclusion:
The audit findings from the staff interviews affirmed that the directorate did not adequately
address the working conditions of staff as stated in its objectives of providing transport
facilities, utilities and logistics for all immigration staff, renovating dilapidated office blocks,
motivating staff through awards and rewards and coordinating and monitoring all the
immigration posts in the country.
Management response:
The Ministry acknowledges the observations made, but mitigation measures are
constrained by the government budgeting system. The Ministry of Finance,
Planning and Economic Development allocates a budget ceiling beyond which a
ministry cannot make budget provisions. Plans are underway to provide staff with
uniforms.
9.2.3 OVERALL EFFECT OF DELAYED PROCESSING OF PASSPORTS
The overall effect of delayed processing of passports is the dissatisfaction of the public who
may resort to other means of acquiring passports such as using middlemen who request for
illegal and exorbitant processing fees.

198
9.2.4 GENERAL CONCLUSION
The time taken to process passports was generally longer than the expected time and this was
mainly as a result of the bottlenecks in the system which mostly affected up-country
regions/districts.
The improvement at the headquarters can further be extended to achieve a shorter passport
processing time if the Ministry removed most of the bottlenecks hampering the efficient
operation of production process.
9.3 RECOMMENDATIONS
9.3.1 Verification of Citizenship
The MIA should address the challenges and iron out the setbacks affecting thecompletion of
the National Identification Project which, when completed will reduce on the time immigration
officers take during the citizenship verification exercise.
9.3.2 Information Technology
The MIA should take advantage of the existing Passport software used in the printing section
and existing computer networks in all the sectional offices to computerize the passport
processing cycle to reduce on the time taken to process passports.
The MIA should tap the IT skills possessed by the staff, which has not been exploited
to increase staff efficiency at work.
The staff that lack IT skills should be trained and refresher courses regularly carried
out to enable them to increase their efficiency in the processing of passports.
9.3.3 Handling of Queried Applications
The MIA should improve on its communication strategy and feedback mechanisms to enable
clients to respond quickly to the queries raised during processing application forms.

199
The MIA should focus on the implementation of their budgets and monitor the budgetary
Performance to ensure that the objectives of the their policy statements are achieved.
The MIA should develop a sustainability plan to enable it to support its newly introduced public
awareness programmes in the media. This will create awareness among the clients regarding
the processes involved in the timely acquisition of a passport.
The published passport guidelines should be distributed to all passport processing centers and
be well displayed to enable the public to understand and appreciate the passport procedures.
9.3.4 Records Management
The project to computerize the central registry should be revived and completed to
improve on records management.
The Directorate should harmonize the recording and filing procedures between the central
registry and the application receiving section to allow for the proper management of records.
9.3.5 Staff Working Conditions
The MIA should develop a strategy to improve staff welfare and working conditions so as to
improve on their efficiency in performing their duties.
The MIA should implement its reward strategy whereby the best performing regions/districts
or individual staff are recognized and rewarded to increase institutional and staff motivation
and commitment at workplaces.

200
10 NORTHERN UGANDA SOCIAL ACTION FUND: OFFICE OF THE PRIME
MINISTER
10.1 INTRODUCTION
10.1.1 Background to the Audit
The Performance audit on the NUSAF1 Project has been conducted in accordance with
Article 163 (3) of the Republic of Uganda, and section 21(1) of the National Audit Act
2008. The audit focused on the management of the Northern Uganda Social Action Fund
Project, in the 29 districts of Northern, West Nile, North East and Eastern Uganda where it
was implemented.
10.1.2 Motivation
Uganda faces considerable challenges in meeting its poverty eradication objectives
to reduce absolute poverty to less than 10% of the population by the year 2017.
Geographical desegregation of poverty dynamics suggests that one third (33.3%)
of the chronically poor are resident in Northern Uganda.
The Northern Uganda Social Action Fund (NUSAF) was developed by the
Government of Uganda after realizing that despite the significant gains in reducing
poverty recorded throughout most of Uganda, the North had continued to lag
behind and indeed fallen further into poverty. NUSAF strived to improve the
livelihood of people of Northern Uganda, by empowering communities in 29
districts to enhance their capacity in their own value systems.
The NUSAF project was jointly funded by the World Bank and GOU to a tune of
US$120m equivalent to Uganda shillings One hundred and eighty billion (shs180b). By
December 2008, the project had funded a total of 9,324 sub projects.
However, in spite of this high level intervention , there arose widespread complaints
regarding the mismanagement of the project which threatened the project’s ability to
fully achieve its objectives.

201
Statistics on Poverty trends (UBOS 2008) indicated that there was a proportionately
increasing difference in the poverty gap index between the Northern region and other
regions; 60.7% of the population in the North still lives below the poverty line while
Eastern 35.9%, Western 20.5% and Central 16.4%.
The Office of the Auditor–General carried out a Value for Money Audit to: assess the
operations of the NUSAF Project in empowering Communities and improving their
livelihoods; identify the challenges and their causes. The Audit provides possible
recommendations that would address the challenges that were faced under the NUSAF
Project.
10.1.3 Description of the Audit Area
The NUSAF Project was one of the services in the PEAP undertaken by the Government of
Uganda, aimed at reducing poverty levels and increasing the standard of people living in
rural areas. The Objective of the project was to empower rural communities and improve
the livelihoods of vulnerable groups such as women, People living with HIV, the youth in
war affected areas of the North and Eastern Uganda.
The Project started in February 2003, under the Office of the Prime Minister. Funding for
the programme comprised IDA funding by World Bank and counterpart funding by the
Government of Uganda.
The implementation of the Project was divided into five (5) regions, namely; West Nile
region, comprising the districts of Arua, Nebbi, Moyo, Yumbe and Adjumani; Acholi
Region, comprising Gulu, Amuru, Kitgum and Pader; Teso Region – Soroti, Katakwi,
Pallisa, Kumi, Bukedea, Amuria, Kaberamaido and Budaka; Lango Region – Lira, Amolator,
Apac, Oyam and Dokolo and; Karamoja region-Moroto, Kotido, Nakapirpirit, Abim and
Kaabong.
The Project strived to improve the livelihood of people of Northern Uganda by
empowering communities in 29 districts by enhancing their capacity to systematically
identify, prioritize and plan for their needs within their own value systems.
202
The nuclear of NUSAF institution was the community that would serve their own
community. Sub-projects were formed according to identified community needs that were
categorized in the following components; Community Development Initiative (CDI),
Vulnerable Group Support (VGS), Community Reconciliation and Conflict Management
(CRCM) and Institutional Development.
10.1.4 Statutory Mandate
The Northern Uganda Social Action Fund operated under the Office of the Prime Minister.
This office which is mandated to lead Government business in Parliament is responsible
for the coordination and implementation of government policies across ministries,
departments and other public institutions, including policy and management issues. The
Office is also responsible for the pacification and development of Northern Uganda,
Luwero Triangle and Karamoja Region. The NUSAF Project came into existence following
the signing of a Development Credit Agreement between the Republic of Uganda and the
International Development Association (IDA) on 7th August 2002.
10.1.5 Mission Statement
The Northern Uganda Social Action Fund shares the Office of the Prime Minister’s Mission,
that is “To instill and maintain efficient and effective systems in Government that enable
Uganda to rapidly develop”
10.1.6 Vision Statement
The Northern Uganda Social Action Fund shares the Office of the Prime Minister’s Vision,
that envisions “A public sector which is responsive and Accountable in steering Uganda
towards Rapid Economic Growth and Development”
10.1.7 Goal
To “Empower communities in Northern Uganda’s 29 districts, located in the North and
East, by enhancing their capacity to systematically identify, prioritize and plan for their
needs within their own value systems, while implementing sustainable development
initiatives that improve socio-economic services and opportunities, thereby contributing to
improved livelihoods”

203
10.1.8 Objectives
To Strengthen community participation, leadership development and encourage
sustainable utilization and mobilization of natural resources.
To Improve quality and access to social services and community-initiated
infrastructure.
To Provide and facilitate support to vulnerable groups, especially the youth,
women and people infected and affected by HIV and conflict.
To Support community reconciliation and conflict management through local
institutions and Civil Society Organizations (CSOs).
To provide institutional support to build capacity to manage the Project,
disseminate information, monitor and evaluate activities as well as strengthen
the local government institutions that provide technical support to the Project.
10.1.9 Activities
Promoting awareness, by disseminating information through education and
communication to the communities.
Participatory micro planning done through situational analysis, needs and resource
identification.
Sub-Project formulation and selection of CPMCs.
Desk and Field Appraisals of Sub-Projects.
Approval of Sub Projects.
Building and enhancing the capacity of communities and other stakeholders
through training.
10.1.10 Organizational Structure
At the National level, is the National Steering Committee that oversees the implementation
of the programme. NUMU is headed by an Executive Director (ED), assisted by four
Directors: The Director of Programmes, The Director of Systems, Directorate of Finance
and Administration and The Chief Internal Auditor.

204
10.1.11 Financing
The NUSAF project was funded by the Government of Uganda (10%), and the World Bank
International Development Association (IDA) (90%). Details are summarized below:
Table: 1 Funding to NUSAF Project
Source/Financial Year IDA Funds
(USD)
GoU Funds
(Shs.)
2004 15,729,595 -
2005 23,381,056 -
2006 30,511,394 -
2007 36,075,455 7,773,183,784
2008 12,679,110 258,200,317
2009 1,839,920 221,701,596
Total Amount 120,216,530 8,253,085,697
Source: OAG Analysis of NUSAF Financial Reports
10.1.12 Audit Scope
The Value for Money audit was carried out on the Northern Uganda Social Action Fund
(NUSAF), a project under the Office of The Prime Minister. The audit focused on
Vulnerable Group Support (VGS) and the Community Development Initiative (CDI)
components of the project.
The study covered a period of five (5) years from July 2004 when the project activities
commenced to January 2009.
Thirteen (13) out of the twenty nine (29) Districts in Uganda were sampled for the Audit.
The sampled districts include; Arua, Nebbi and Yumbe in the West Nile region; Gulu,
Kitgum, in the Acholi region; Lira and Apac in the Lango region; Soroti, Pallisa and
Katakwi in the Teso region; Kotido and Moroto and Nakapiripirit in the Karamoja region.

205
10.2 FINDINGS
10.2.1 Sub-project Funding
The NUSAF Financial Manual requires that funds released to Sub-projects should be
consistent with the terms and conditions of the Subproject contract. Accordingly funds
were to be transferred to Subprojects based on the amount stated in the budgets and
disbursement requests from the Subprojects.
The Director of Programmes was responsible for managing the Project budget and
adjusting budgets according to sector requirements.
The audit revealed that 20% of the 2,650 CDI (i.e. 530) Subprojects that were audited
received funds above the requested amount.
It further established that 10% of the 5,306 VGS Subprojects i.e. 531 received funds
above sub-project requests. Below are the details:

206
Table: 2 Funding to Community Development Initiative Subprojects
District No. of
CDI Sub
Projects
NUSAF
Budgeted
Amount
( shs)
Total Amount
Disbursed
Amount
Disbursed
above the
Budget
Excess
funds
Returned
Total
Funding
above the
Budgets
Adjumani 33 1,290,454,335 1,304,276,460 13,822,125 - 13,822,125
Apac 251 8,282,607,445 8,411,660,018 129,052,573 - 129,052,573
Arua 363 12,912,830,645 13,063,222140 150,391,495 20,838575 129,552,920
Gulu 116 4,194,856,145 4,199,887,521 5,031,376 - 5,031,376
Kaberamaido 46 2,098,858,568 2,114,325,851 15,467,283 - 15,467,283
Katakwi 180 7,250,443,600 7,290,111,109 39,667,510 5,357,619 34,309,893
Kitgum 100 4,326,914,033 4,421,699,504 94,785,471 - 94,785,471
Kotido 165 7,019,670,196 7,064,113,175 44,442,979 - 44,442,979
Kumi 201 8,383,015,814 8,438,906,135 55,890,321 - 55,890,321
Lira 210 8,930,096,966 8,957,445,725 27,348,759 - 27,348,759
Moroto 116 5,000,498,408 5,098,553,747 98,055,348 - 98,055,348
Nakapiripirit 93 3,699,482,883 3,715,602,185 16,119,301 - 16,119,301
Nebbi 125 4,377,642,509 4,405,043,195 27,400,686 22,647,895 4,752,791
Pader 83 3,502,235,520 3,647,851,710 145,616,190 41,863,997 103,752,193
Pallisa 283 9,798,135,274 9,866,541,116 68,405,842 - 68,405,842
Soroti 210 5,698,949,675 5,762,622,581 64,572,906 - 64,863,997
Yumbe 75 2,514,176,008 2,562,925,507 51,034,634 50,912,845 121,789
Sub Total 2,650 99,277,682,877 100,324,787,675 1,047,104,798 141,620,931 905,483,867
Source: OAG Analysis of NUSAF Disbursement Trackers

207
Table: 3 Funding to Vulnerable Group Support Subprojects
District No. of
VGS Sub
Projects
NUSAF
Budgeted
Amount
Total Amount
Disbursed
Over funding Returned
funds
Total Over
Funding
Adjumani 196 2,74,108,148 2,082,954,597 8,846,449 - 8,846,449
Apac 649 6,506,356,111 6,556,243,645 49,887,534 - 49,887,534
Arua 377 4,344,439,719 4,354,215,783 9,776,064 6,080,000 3,696,064
Gulu 495 7,240,871,453 7,255,357,573 14,486,120 - 14,486,120
Kaberamaido 164 2,204,598,949 2,231,755,438 27,156,489 - 27,156,489
Katakwi 171 1,696,609,670 1,760,753,539 64,143,869 28,774,057 35,369,819
Kitgum 644 7,956,990,384 8,000220,608 43,230,224 - 43,230,224
Kotido 70 740,641,481 747,607,166 6,965,685 - 6,965,685
Kumi 308 2,694,847,832 2,779,644,836 84,788,004 - 84,788,004
Lira 503 5,356,629,526 5,368,143,678 11,514,152 - 11,514,152
Nakapiripirit 53 426,595,535 431,095,535 4,500,000 - 4,500,000
Nebbi 276 2,383,743,200 2,389,275,384 5,532,184 - 5,532,184
Pader 305 3,834,736,691 3,860,066764 25,270,073 7,075,850 18,194,223
Pallisa 416 3,005,512848 3,010,836,848 5,324,000 - 5,324,000
Soroti 261 3,191,192,734 3,210,947,196 10,754,462 - 10,754,462
Moyo 126 1,085,492,977 1,098,266,448 12,773,471 - 12,773,471
Sub Total 5,306 57,139,614,015 57,537,336,861 397,722,846 49,110,553 348,612,293
Grand Total 7,956 1,444,827,644 190,731,484 1,254,096,260
Source: OAG Analysis of NUSAF Disbursement Tracker
Over funding of Subprojects was attributed to lack of effective internal audit function which
did not have an internal audit manual to guide the staff working in this department. For
instance, the internal audit department did not pre-audit payments.
In addition the study revealed that NUSAF had designed an excel spread sheet known as
“subproject tracker” for purposes of managing funds disbursed to the sub projects. The
audit was not availed with evidence of independent review of the system, implying that
errors could not easily be identified\detected and addressed in a timely manner.
As a result, 1,061 sub projects out of 7956 subprojects both CDI and VGS in tables 2 and 3
above, received funds above the budgeted amounts totaling to Shs.1,444,827,644 out of
which Shs.190,731,484 was recovered leaving a balance of Shs.1,254,096,160 without
proper justification rendering the expenditure wasteful.

208
Management Response
Management attributed the over funding of Subprojects to multiple tranching of
subprojects funds using a manual system both at the district and NUMU which
led to errors. They stated further that they later installed and operated a
computerized SUN Accounting System in March 2008 which helped minimize the
human errors. Secondly, management relied on District Trackers for
Accountability and tracking sub project disbursements in the absence of a
computerized accounting system. These District Trackers also had limitations in
terms of tracking errors.
10.2.2 MAINTENANCE OF FINANCIAL RECORDS BY SUBPROJECTS
NUSAF subprojects were supposed to maintain a simple cash book and to utilize standard
accounting forms. Prior to the sub- project launch, CPMC\CSO members were supposed to
be trained to ensure consistency and compliance with NUSAF procedures. Training was to
be conducted for five days. The purpose of the training was to assist in upholding
transparency and accountability in the delivery of project activities.
The audit revealed that 70% of the subprojects in a sample of 642 i.e 449 CDI sub
projects, did not maintain a Cash book and did not make use of the standard accounting
forms.
The poor record keeping was caused by inadequate training of subproject members and
lack of followup training regarding financial matters. Illiteracy among the Subproject
members also affected the ability of members to maintain financial records.
In the absence of proper financial records at the CDIs, it was difficult to verify, reconcile
and update the financial information of the sub projects by NUMU and NDTO which led to
the over funding of sub projects.
10.2.3 PROCUREMENT PROCEDURES
The procurement was based on the following procedures:
1. The community placing adverts in public places (Local bidding).

209
2. Sending invitations to at least three firms (Local shopping).
3. Direct contracting (Direct Selection of a contractor among the community)
4. Community participation using their own equipments and tools.
For effective community participation in procurement, the communities were required to
constitute Community procurement committees comprising five members, which were
responsible for the procurement of all the goods and services required in the
implementation of the sub projects.
The study ascertained that, out of the 642 CDI Subprojects visited 60% i.e 385 did not
have Community Procurement committees, while only 40% ie 257 had constituted
Community Procurement committees.
The audit further revealed that 50% i.e 128 out of the 257 CDI’s which had constituted
procurement committees did not follow procurement guidelines.
This was due to inadequate training of the members of the Subprojects at the pre-launch.
75% of the committee members interviewed at the sub projects were of the view that
procurement was not adequately covered during training.
Failure to follow the Community Based Procurement Guidelines led to the escalation of the
cost of the sub projects and failure to attain economy.
10.2.4 SUPERVISION AND MONITORING OF CIVIL WORKS
Under the Community Development Initiative component, supervision was essential for
ensuring quality control and the cost effectiveness of sub-projects.
The NUSAF district technical officer and the District Engineer were responsible for
conducting Supervision and monitoring of the civil works under construction on a monthly
basis to ensure quality control and the cost effectiveness of sub-projects. In addition the
Community Based Procurement and Stores Manual required that for all construction work,
certification would be done at every stage by the relevant sector specialist before payment
was made.

210
The documentation review and the interviews conducted during the field study revealed
that only 33% of the 642 CDIs i.e. 212 of the Subprojects were monitored by the NDTO on
a monthly basis.
The audit also revealed that only 5% of the 642 CDIs i.e. 32 Subprojects were supervised
and monitored by the District Sector Specialist/District Engineer.
It was further established that 80% out of the 642 CDIs i.e. 514 Subprojects did not have
payment certificates attached to payment vouchers.
Documentation review and interviews revealed that the staffing gaps and laxity of the
sector specialists (District Engineers) and NDTO’s, were the cause of inadequate
supervision of civil works.
Verification of civil work revealed that lack of proper supervision of the civil work resulted
into poor quality civil works of the sub projects.
The audit ascertained that 54% of the buildings had cracked floors, 26% had walls with
cracks, 10% had broken windows and 10% had broken doors.
Lack of close supervision of the civil work resulted into poor quality civil works of the sub
projects; as was in the case of Panyangara health Centre in Kotido District where a staff
house was plastered but without a verandah and appeared deserted.
Figure: 3 Poor quality Civil Works
Source: OAG Field Inspections

211
10.2.5 COMPLETION OF SUBPROJECTS
The time limit for completion of community Subprojects was set at twelve months.
The audit revealed that out of 642 CDI projects, only (31%) i.e. 199 sub projects were
completed in time while 69% i.e. 443 were not completed on schedule.
The audit established that the average completion time for construction of CDI sub projects
during the NUSAF project lifespan was 27 months as reflected in the graph below.
Table: 5 Completions of CDI Subprojects
Completion of CDI Sub- Projects
0
5
10
15
20
25
30
35
2003/04 2004/05 2005/06 2006/07 2007/08
Financal Years
Av
era
ge c
om
ple
tio
n p
erio
d in
mo
nth
s
PLANNED
ACTUAL
Source: OAG Analysis of NUSAF Progress Reports
The delays in completion of sub projects was attributed to delays in disbursement of funds
to sub projects, non adherence to procurement guidelines and lack of proper monitoring
and supervision by Technical experts.
The delay in completion of the sub projects led to the extension of NUSAF project life,
additional administrative costs and cost escalation.

212
10.2.6 DISBURSEMENT OF FUNDS TO SUBPROJECTS
At the Sub-project launch, an initial deposit in form of a cheque was supposed to be given
as the first tranche of funding to start the project.
The audit revealed that the transfer of funds to some subprojects was not done at the
launch. Through document review, it was noted that in the year 2004/05, disbursements to
subprojects were done on average 10 months after the launch (2005/06; 6 months, in
2006/07; 5 months, and in 2007/08; 7 months).
As a result of delays in the disbursement of funds, the Subprojects could not complete their
activities on schedule and according to their work plans.
10.2.7 SUBMISSION OF ACCOUNTABILITIES
To ensure full accountability for the funds remitted to each district and other implementing
Agencies, funds were supposed to be transferred to Subproject in tranches upon receipt of
accountabilities for the previous release.
The audit found that 40% of the 642 CDIS i.e. 257 of the sub projects received more than
one tranche prior to submission of previous accountabilities.
The study further revealed that accountabilities for funds received by subprojects were not
submitted in accordance with project norms. For instance according to the Auditor
General’s report of NUSAF for the year ended 30th June 2008, the age analysis of the
advances revealed that an amount of Shs.262,506,090 had been outstanding for more
than twelve months.
The audit further revealed that out of the total of 2,322 CDIs sub projects, 20% i.e 475 sub
projects had not submitted accountabilities amounting to Shs.2,607,315,491 at the close
of the project in September 2009 as shown below.

213
Table: 4 Proportion of subprojects that did not submit accountabilities
District No. of
CDI
Sub
Projects
No. of
Subprojects with
Un Submitted
Accountabilities
Percentage of Un
Submitted
Accountabilities
Amount of Un
Submitted
Accountabilities
Adjumani 33 3 9% 2,502,500
Apac 251 52 20% 163,270,712
Arua 363 20 5% 33,880,246
Gulu 116 18 15% 26,569,887
Katakwi 180 25 13% 23,297,582
Kitgum 100 15 15% 68,977,283
Kotido 165 37 22% 285,864,832
Kumi 201 129 64% 102,560,987
Lira 210 23 10% 80,742,677
Nakapiripirit 93 28 30% 225,334,546
Nebbi 125 18 14% 44,524,226
Pader 83 45 54% 117,235,323
Pallisa 283 47 16% 37,873,545
Yumbe 75 10 13% 47,402390
Moyo 44 5 11% 10,015,468
TOTAL 2,322 475 20% 2,607,315,491
Source: OAG Analysis of NUSAF Disbursement Trackers
The Failure of Subproject members to follow disbursement procedures and submit
Subproject accountabilities on time was attributed to inadequate training and mentoring of
the members of the Subproject on financial matters and high illiteracy rate among
members.
The delays by sub-projects members to present accountability affected the liquidity of
NUSAF and consequently affected timely completion of Subprojects. For instance Acholi
Community water supply project in Moroto District was abandoned after sinking pipes as
shown below:

214
Figure 2 Abandoned project
Source: OAG Field Inspections
10.2.8 COMMISSIONING OF COMPLETED SUBPROJECTS
The CAO is required to organize relevant sectoral experts or consultants appointed by
NUMU to evaluate the completed sub projects\facility on the basis of technical
performance, evaluate the extent to which the construction or equipment functions were
satisfactory, the extent of use of the facility or service and analysis of the number and
composition of people benefiting from the sub project.
The audit noted that out of the 449 completed sub projects, 30% i.e 135 were not
commissioned and were not functional because they lacked basic facilities, of which 50%
i.e 67 Health centers lacked medical equipment and staff houses, 30% i.e 41 were
classroom blocks which needed furniture and 20% i.e 27 teachers, houses which did not
have toilets and bathrooms and therefore were using school facilities instead.
The Audit also revealed that out of 449 completed CDI subprojects, 60% i.e 270 were
completed and functional. Districts of Teso and west Nile regions, namely: Arua, Soroti,
Pallisa and Nebbi were noted to have Community Development Initiative subprojects that
were of good quality civil works and beneficial to the communities.

215
An example of such properly completed project is Ciforo Youth skills training centre in
Adjumani District in which training activities were going on as shown below:
Figure: 4 Complete and functioning project
Source: OAG Field Inspections
However, some projects were incomplete and of the 213 Incomplete CDI
Subprojects, 60% i.e. 128 were from the Education Sector which comprised
Classroom blocks, Teachers houses; Dormitories, Laboratories and Community
Halls. 20% i.e. 43 were from the Water Sector, comprising Boreholes and Piped
water supply systems. 5% was from the Road Sector i.e. 11 incomplete sub
projects, which are feeder Roads, Bridges and Culvert installations, 15% i.e. 32
were from the Health sector, including Maternity Wards, Out Patient
Department and Medical Staff house.
Failure to complete CDI Subprojects in time was attributed to delays in disbursement of
Subproject funds, non adherence to Procurement Guidelines regarding civil works and lack
of effective supervision and monitoring.

216
Table: 6 Number of Incomplete CDI‟s subprojects by districts
District Number of
CDI Sub
Projects
Number of
Complete
Sub
Projects
Number of
Incomplete
Subprojects
Percent
age
Of In
Complet
ion
Funds Spent
on Incomplete
Subprojects
Arua 99 89 10 10% 264,673,513
Apac 125 57 60 48% 2,065,684,326
Gulu 40 30 10 35% 232,972,482
Pallisa 20 17 3 15% 282,679,278
Kitgum 35 27 8 22% 328,134,785
Kotido 70 44 26 37% 1,110,852,315
Moroto 75 34 41 54% 2,545,963,364
Nakapiripirit 48 19 18 37% 712,265,019
Kumi 35 23 12 34% 245,828,270
Lira 30 20 10 33% 300,258,788
Nebbi 15 13 2 13% 38,000,000
Katakwi 40 11 12 30% 794,854,546
Soroti 10 9 1 10% 85,874,359
Total 642 449 213 33% 9,008,041,045
Source: OAG Field inspection and analysis of NUSAF Progress reports
The incomplete CDI sub projects meant that they were unsuccessful and did not achieve
the purpose for which they were intended and the expenditure on such sub projects was
wasteful.
10.2.9 PERFORMANCE OF VGS SUBPROJECTS
Vulnerable Group Support Subprojects were expected to be operational in order for the
vulnerable groups to develop, manage and ensure sustainability of the subprojects.
The audit revealed that out of the 1,048 VGS Subprojects, 64% i.e 667 of VGS Subprojects
implemented by the communities operated for an average of (8) eight months and later
closed.
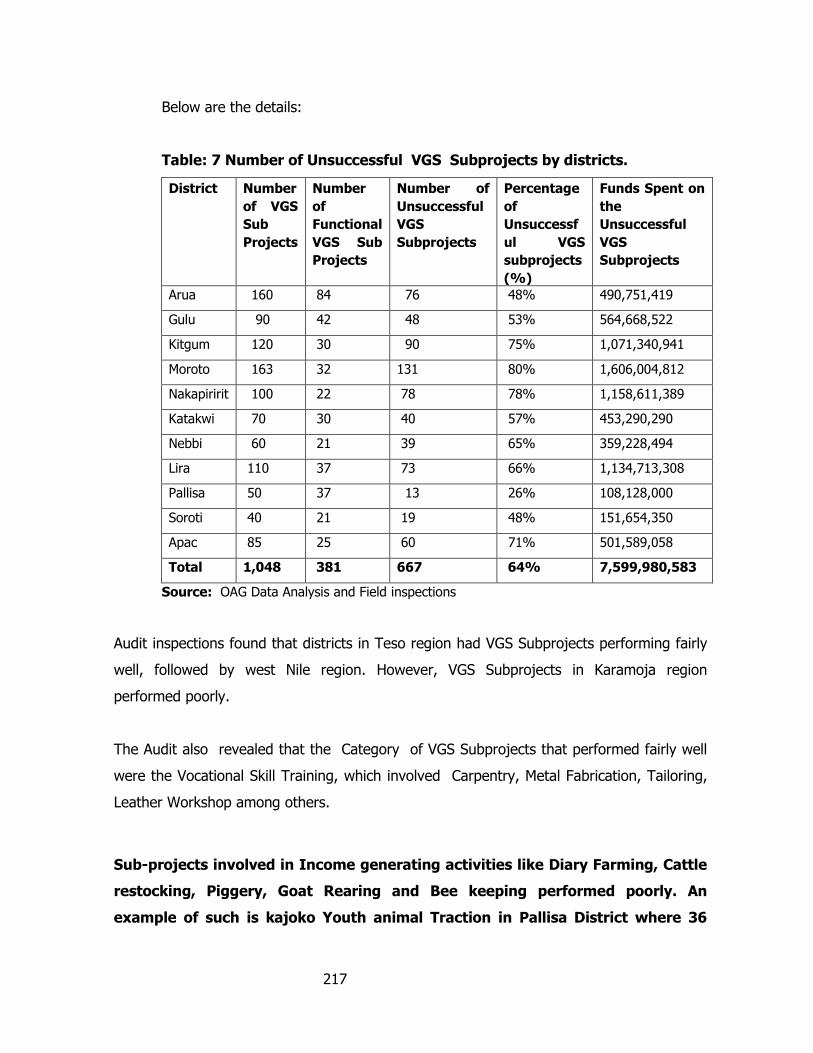
217
Below are the details:
Table: 7 Number of Unsuccessful VGS Subprojects by districts.
District Number
of VGS
Sub
Projects
Number
of
Functional
VGS Sub
Projects
Number of
Unsuccessful
VGS
Subprojects
Percentage
of
Unsuccessf
ul VGS
subprojects
(%)
Funds Spent on
the
Unsuccessful
VGS
Subprojects
Arua 160 84 76 48% 490,751,419
Gulu 90 42 48 53% 564,668,522
Kitgum 120 30 90 75% 1,071,340,941
Moroto 163 32 131 80% 1,606,004,812
Nakapiririt 100 22 78 78% 1,158,611,389
Katakwi 70 30 40 57% 453,290,290
Nebbi 60 21 39 65% 359,228,494
Lira 110 37 73 66% 1,134,713,308
Pallisa 50 37 13 26% 108,128,000
Soroti 40 21 19 48% 151,654,350
Apac 85 25 60 71% 501,589,058
Total 1,048 381 667 64% 7,599,980,583
Source: OAG Data Analysis and Field inspections
Audit inspections found that districts in Teso region had VGS Subprojects performing fairly
well, followed by west Nile region. However, VGS Subprojects in Karamoja region
performed poorly.
The Audit also revealed that the Category of VGS Subprojects that performed fairly well
were the Vocational Skill Training, which involved Carpentry, Metal Fabrication, Tailoring,
Leather Workshop among others.
Sub-projects involved in Income generating activities like Diary Farming, Cattle
restocking, Piggery, Goat Rearing and Bee keeping performed poorly. An
example of such is kajoko Youth animal Traction in Pallisa District where 36

218
members changed the project to heifer rearing but without records of the
members signing for the heifers.
Figure: 5 Income generating activities
Source: OAG Field Inspections
Out of the 667 Unsuccessful VGS 60% i.e 400 were involved in Income Generating
activities, 20% i.e 133 were Vocational Skill Training,10% i.e 67 were Time and Labour
saving Technologies, 5% i.e 33 were Family Support Activities, and 5% i.e 33 Counseling
Activities.
During the Interview, the reasons given for the unsuccessful VGS Subproject were: (49%
i.e. 327) due to project mismanagement, (13% i.e. 87) due to members disintegrating or
relocating, (22% i.e. 147) due to death of Animals and 16% i.e. 107 due to items (Tools or
Animals) being shared amongst members. This affected the ability of members to sustain
the VGS subprojects hence affecting the overall goal of the VGS component which was
to use targeted interventions in a participatory, equitable and sustainable manner in
improving the social livelihoods of the members of the subprojects.

219
Poor Performance of Vulnerable Group Support Subprojects was attributed to inadequate
Monitoring and Supervision, inadequate Field Appraisals, poor Community participatory
Appraisal & Training, ineligible Subproject group composition, projects not launched and
inadequacies in approval process of Subprojects.
Most vulnerable Group Support subprojects operated for less than a year and as such there
were no long term benefits to members from the Subproject which failed. An example of
such projects is Gborogborocu borehole in Yumbe District where the borehole broke down
and it appears the community is not capable of repairing it.
Figure: 6 Short lived project
Source: OAG Field Inspections
As a result of short lifespan and existence of incomplete sub projects, the community did
not benefit from the services they were expected to receive from the Shs.16,608,021,628
incurred on these sub projects.

220
10.3 CONCLUSION
From the audit findings above, the following conclusions have been made in light of the study
carried.
10.3.1 Maintenance Of Financial Records By Subprojects
In the absence of proper financial records at the CDIs, it was difficult to verify,
reconcile and update financial information of the sub projects by NUMU and NDTO
which led to over funding of sub projects.
10.3.2 Procurement Procedures
Failure to follow the Community Based Procurement Guidelines led to sub projects cost
escalation and failure to procure with due regard to economy.
10.3.3 Civil Works
Lack of close supervision of the civil work resulted into poor quality civil works of the sub
projects.
10.3.4 Completion of Subprojects
The delay in completion of the sub projects led to the extension of the NUSAF project life,
extra administrative costs and cost escalation.
The incomplete CDI sub projects meant that they were unsuccessful and did not achieve
the purpose for which they were intended and the expenditure on such sub projects was
wasteful.
10.3.5 Disbursement of Funds to Subprojects
Over funding of sub projects to the tune of Shs.1,254,096,160 without proper approvals
rendered the expenditure nugatory.
The delays by sub-projects to present accountability affected the replenishment of funds
and consequently affected timely implementation of Subprojects.

221
10.3.6 Submission of Accountabilities
By the close of the NUSAF1 project, accountabilities for Shs.2,606,315,491 had not been
submitted.
10.3.7 Commissioning of Completed Subprojects
As a result of delays in the disbursement of funds, the Subprojects could not complete their
activities on schedule and according to their work plans.
10.3.8 Performance of Vgs Subprojects
As a result of short lifespan and existence of incomplete sub projects, the community did
not benefit from the services they were meant to receive out of the Shs.16,608,021,628
incurred on the sub projects.
10.4 RECOMMENDATIONS
In light of the above findings and conclusions the following recommendations have been
made to facilitate the implementation of NUSAF II developed to consolidate the gains of
NUSAF I.
10.4.1 Budgeting and Budgetary Control
Independent checks should be done, on data entered into the accounting
package/Disbursement tracker, to ensure that the funds disbursed to subprojects are in
accordance with subprojects budgets and disbursement requests, where discrepancies
exist, immediate remedial steps should be taken by NUMU and the CAO’s.
10.4.2 Maintenance of Financial Records By Subprojects
The NUSAF Management Unit should ensure that cash books and standard
accounting forms are kept by Subprojects. NUMU should computerize all data regarding
Subproject budgets and funding. The information should be captured in the accounting
package and reports produced monthly for reconciliation with the districts.
The Office of the Prime Minister through NUMU should ensure adequate training of

222
the Community Subproject Members on financial matters, to enable Subproject
members to gain skills to prepare and keep accounting records like simplified cashbooks
and standard accounting forms.
10.4.3 Procurement Procedures
NUSAF Management Unit and NDTO’s should ensure that subproject Procurement
Committees are constituted and members adhere to set procurement guidelines.
NUMU should ensure that the Community Procurement Committee members are
adequately trained and able to implement procurements as per guidelines.
10.4.4 Civil Works
District Engineers/Sector Specialists should carry out adequate monitoring of Civil
Works on a monthly basis, and ensure that the Payment Certificates are issued at every
stage of completion before payment is made.
OPM through NUMU and the NUSAF District Technical Officers should encourage
sector specialists to carry out effective Supervision and Monitoring of Subproject.
10.4.5 Completion of Subprojects
OPM should institute a study to re-assess the incomplete sub projects and those not
commissioned with a view to re-activate them under NUSAF II. This should aim at
addressing the underlying causes of non-completion and commissioning with the view of
salvaging the loss that arose from earlier resources injected and ensures that the
community benefits from the intended services envisaged from the subprojects.
10.4.6 Disbursement of Funds to Subprojects
OPM through NUMU ensures that Initial Disbursement of Funds to Sub projects be done at
the launch of the sub project.
10.4.7 Submission of Accountabilities
NUMU Should also institute measures to ensure that CPMC Members make timely
submission of accountabilities.

223
10.4.8 Commissioning of Completed Subprojects
The CAO should promptly organize relevant sectoral experts or consultants appointed by
NUMU to evaluate completed sub projects so as to commission them to enable people
benefit from the sub project as intended.
10.4.9 Performance of Vgs Subprojects
NUSAF District Technical Officers and sector specialists should carry out adequate field
appraisal on all completed projects and encourage community participation so that the
projects are sustainable and serve the purpose for which they were intended.

224
11 PROCUREMENT AND DISTRIBUTION OF RELIEF ITEMS IN THE
OFFICE OF THE PRIME MINISTER
11.1 INTRODUCTION
11.1.1 Motivation
Uganda has suffered various naturally triggered and man-made disasters over a long period
of time. These have caused loss of lives and property. For instance:
The floods that variously hit the Eastern and Northern parts of the country from
July 2007 to November 2007 affected close to 3 million people and most
particularly, the Teso sub-region (in the districts of Soroti, Katakwi, Kaberamaido,
Amuria, Kumi and Bukedea) and displaced over 300,000 people (50,000
households).61
The landslides that hit several Sub- Counties in Mbale district in October 2007,
where over 5,000 families were left helpless, 36 schools damaged and a total of 142
Kms of roads washed away.62
The armed conflict in the Northern part of the country between the Government of
Uganda and Lords Resistance Army for over 20 years, which forced close to 1.7
million people into camps of Internally Displaced Persons (IDP’s), especially in the
districts of Apac, Amuru, Gulu, Kitgum, Pader, Oyam and Nebbi.63
In responding to the above disasters, there were public concerns about the untimely and
insufficient relief food supplies (maize flour and beans) delivered to the affected persons.
61
Progress report to top management on government intervention in the flood affected areas and post flood
activities, by MOSRDP&R dated 22nd
February 2008. 62
Disaster report of Mbale district Ref: CR/105/2 dated 7th
November 2007. 63
OPM records.

225
It is against this background that the Office of the Auditor General deemed it imperative to
conduct a value for money audit in this area to ascertain the challenges and/or problems
affecting the procurement and distribution of food relief items and provide possible
recommendations to improve the operations of OPM-DDMR in responding to disasters.
11.1.2 Description of the Audit Area
The audit was conducted in the Office of the Prime Minister (OPM) with specific emphasis
on the Department of Disaster Management and Refugees (DDMR). DDMR is responsible
for settlement of disaster victims, restoration of lives and provision of food relief items.
11.1.3 Mandate of DDMR
In accordance with the provisions of Article 108 A (2) of the Constitution of the Republic of
Uganda, OPM is mandated to lead Government business in Parliament, be responsible for
co-ordination and implementation of Government policies across ministries, departments
and other Public institutions.
11.1.4 Vision, Mission, Objectives and Activities of DDMR
Vision
DDMR derives its vision from that of OPM which is:
“A public sector, which is responsive and accountable in steering Uganda towards
rapid economic growth and development”.64
Mission
The mission of DDMR is:
“To save lives and livelihood as well as minimize vulnerability levels of the people of
Uganda against disasters”.65
64
http://opm.go.ug/index.php 65
OPM Ministerial Policy Statement F/Y 2007/2008, Page 66.

226
Objectives Of DDMR 66
The objectives of DDMR are:
To assist disaster victims in restoration of their normal lives within the shortest
possible time.
To reduce disaster vulnerability levels of the society and alleviate human
suffering against disasters.
To implement and coordinate Government and Non-Government programs on
disaster management.
To create local capacities for planning, implementing and monitoring disaster
management programs such as emergency relief.
To contribute to national poverty eradication by ensuring that the IDPs and
other disaster victims regain minimum levels of production.
To establish a minimum state of early warning system and disaster
preparedness as means of mitigating and responding promptly to disasters.
Activities of DDMR
The following activities are carried out by OPM/DDMR in order to achieve the above
objectives:
Planning and budgeting for disasters
Disaster risk analysis
Assessment of situations after the occurrence of disasters
Coordination of disaster management programs
Procurement of food relief items
Receipt, storage and distribution of food relief items
Monitoring and evaluation of disaster management programs
11.1.5 Funding of DDMR
DDMR is funded by the Government of Uganda (GOU) and supported by donor
contributions. The total funding for the period 2005/2006 to 2008/2009 is as shown below:
66
OPM Ministerial Policy Statement F/Y 2007/2008, Page 66.

227
Table 1: Showing G.O.U funding to humanitarian assistance; for the
FY‟s 2005/2006, 2006/2007, 2007/2008 and 2008/2009.
Financial
Year (FY)
Approved
budget (Shs)
Supplementary
Budget (Shs)
Revised budget
(Shs)
Releases
(Shs)
2005/06 638,864,472 3,402,080,000 4,040,944,472 4,040,944,472
2006/07 1,442,040,000 0 1,442,040,000 1,269,837,000
2007/08 1,836,250,000 25,565,926,850 27,402,176,850 27,402,176,850
2008/09 613,633,342 8,577,265,224 9,190,898,566 9,190,898,566
Total 4,530,787,814 37,545,272,074 42,076,059,888 41,903,856,888
Source: GoU IFMS System
11.1.6 Organization Structure
DDMR is headed by a Commissioner who reports to the Permanent Secretary (Accounting
Officer of OPM). The Commissioner is assisted by 2 Assistant Commissioners heading
disaster management and refugees sections respectively.
11.1.7 Audit Objective
This audit was conducted to ascertain the challenges affecting the procurement and
distribution of relief food items by OPM/DDMR and provide possible recommendations that
will improve the operations of OPM/DDMR in responding to disasters.
Specific audit objectives
The specific audit objectives were:
a) To ascertain the time taken by OPM/DDMR to respond to disasters.
b) To ascertain how OPM/DDMR was assessing disaster needs.
c) To ascertain how disaster activities are coordinated by OPM/DDMR.
d) To ascertain how disaster activities are funded.
e) To ascertain how food relief items are procured.
f) To ascertain how the distribution and allocation of food relief items was done.
228
11.1.8 Audit Scope
The audit was conducted in OPM/DDMR focusing on the procurement and distribution of
food relief items by OPM/DDMR. The audit focused on four Financial Years (F/Y’s) from:
2005/2006, 2006/2007, 2007/2008 and 2008/2009.
11.2 FINDINGS
11.2.1 Disaster Response Time
International standards on disaster response and preparedness require that when disaster
occurs, within the first 48 hours (i.e. 2 days) of the occurrence of disaster, immediate
response (i.e. food relief items) should be provided to the affected people to save lives.67
The audit revealed that in some cases response time to districts or areas that were affected
by disasters far exceeded the international standard of 48 hours (i.e. 2 days). It took OPM
an average of 1,176 hours (i.e. 49 days) to respond to some disasters. In the 21 districts
studied, only 10% (i.e. 2 districts) had prompt response while 57% (i.e. 12 districts) had
food relief items delivered to the affected people after the recommended 48 hours (i.e.
after 2 days). 33% (i.e. 7 districts) had no record of the time it took to deliver food relief
items. There are districts, such as Mbarara, where it took 10,416 hours (i.e. 434 days) to
deliver food relief assistance.
The delays were attributed to OPM’s inability to maintain an adequate stock of emergency
food relief items in the stores. For example, at the time the floods hit the Teso region on
24th August 2007, there were only 112,000 kgs of maize flour which could feed 250,000
people (i.e. 72%) out of 348,000 affected people in the whole region for only one day. In
addition, available beans (258,000 kgs) could only feed 322,500 people (i.e. 93%) out of
348,000 affected people in the whole region for one day. There was also inadequate
staffing at DDM, leading to the staff getting overwhelmed at times of disaster. Two officers,
namely the ACDMR and the PDMO, are responsible for handling disaster related activities at
67
Sphere Minimum Standards on Humanitarian Aid

229
OPM and coordinating emergency relief programs in the field. It was further noted that lack
of reliable data to forecast the occurrence and effect of disasters led to inappropriate
decisions being taken regarding the procurement and distribution of food relief items. The
centralized procurement and storage of emergency food relief items in Kampala also
contributed to the delays in the delivering of the food relief items to the disaster affected
areas.
The inability by OPM to offer immediate response after the occurrence of disasters led to
starvation and deterioration in the living conditions of the victims who were already living
below the poverty line in the country side.68.
Management response
Affirmed that there are delays in responding to disasters and that there is no
emergency standby fund to cater for emergencies. However, OPM and MOFPED
have completed a Bill for the establishment of a National Emergency Standby
Fund due to be tabled in Cabinet and Parliament.
Once established, this will be used to maintain adequate minimum stock of
emergency food relief items.
On staffing, the Department of Disaster Management was being upgraded to a
Directorate and would soon recruit eight more professional staff.
Furthermore, OPM was encouraging Local Governments to include a budget line
for emergencies in their annual budgets.
11.2.2 Disaster Needs Assessment
OPM/DDMR is responsible for ensuring that a multi-sectoral and multi-skilled
comprehensive disaster needs assessment involving all the relevant institutions of
government (i.e. line ministries), development and humanitarian partners, affected
communities and the Civil Society Organizations is carried out to ascertain the disaster
68
Uganda bureau of statistics abstract of June 2009.
230
magnitude and the financial requirements needed. OPM/DDMR is supposed to produce a
comprehensive disaster needs assessment report.
We noted that although only a few districts (14%) attempted to prepare preliminary
disaster reports, the reports did not show information on key issues such as: number of
persons affected, damage suffered, the quantified financial and other resources required.
During the interviews with the CDMR, it was explained that failure by OPM/DDMR to
prepare comprehensive disaster needs assessment reports was due to inadequate staffing
at OPM. The two officers, namely the ACDMR and the PDMO, who are responsible for
handling disaster related activities at OPM could not coordinate emergency relief programs
in the field and also prepare the comprehensive reports at the same time.
The absence of comprehensive disaster needs assessment reports led to delayed response
in providing required food relief assistance and also affected the mobilization of the
required resources from the various sources, such as the supplementary budget.
11.2.3 Coordination Of Disaster Activities
OPM/DDMR chairs monthly national platform meetings for disaster preparedness and
management. In these meetings, decisions are taken on how the various agencies will
intervene/respond to the disaster in question to avoid duplication of resources. The ACDMR
and the PDMO are responsible for mapping out the areas of operation of the various
humanitarian agencies69 . The various agencies are supposed to present field reports to
OPM/DDMR indicating what food relief items they procured and how they were distributed
to the disaster affected people. DDMR is supposed to produce monthly reports on the
coordination and implementation of emergency humanitarian activities in the country.70
69
OPM Staff schedule of duties as at 1st July 2006, Page 40. 70
OPM Ministerial Policy Statement F/Y 2008/2009, item 7, Page 73.

231
The mapping details for the various humanitarian agencies that were operating in the 21
districts studied were not availed for verification. We further observed that NGO’s did not
submit their work plans and field activity reports to OPM/DDMR. It was noted from OPM’s
internal audit report of 10th January 2008 that the NGOs operating in flood hit North and
Eastern Uganda were not regularly reporting to OPM/DDMR on their field activities.71
Failure by NGO’s to submit their work plans and field activity reports to OPM/DDMR was
attributed to attitudinal belief that NGO’s are accountable to those they seek to assist only.
The inability of OPM/DDMR to map out areas of operation for various humanitarian
agencies also led to the concentration of NGOs in urban centers at the expense of rural
areas where food relief assistance was needed.
Management response
The Northern Uganda Data Centre (NUDC) under OPM has mapped out areas of
need in Karamoja region, Eastern, and Northern Uganda, while other parts of
the country will be covered. Humanitarian agencies are required to register with
NUDC before embarking on any activity in the country.
The Disaster Management Technical Working Group (DMTWG) annually draws
an inter-agency work plan and strategic action plan for all humanitarian
agencies.
Management reported that NGOs are submitting monthly reports to DMTWG but
do not include financial information.
11.2.4 Allocation of Food Relief Items to Disaster Victims
World Food Program (WFP) guidelines specify the minimum daily ration of 450 grams of
cereals and 80 grams of pulses per person per day for 3 months in a disaster hit area.
71 OPM Internal audit memo dated 10th January 2008.

232
It was revealed that the food relief items delivered by OPM/DDMR in 7 out of the 21
districts could not meet the minimum daily ration as shown in table 4 and 5 below:
Table 2: Showing under delivery of food relief items to affected districts in the financial year 2007/2008.
DISTRICT
AFFECTED
POPULATION MINIMUM REQUIREMENT
DELIVERIES BY OPM DEFICIENCY
COLUMN 1 COLUMN 2 COLUMN 3 COLUMN 4 COLUMN 5
POSHO
(„000KGS)
BEANS
(„000KGS)
POSHO
(„000KGS)
BEANS
(„000KGS)
POSHO
(„000KGS)
BEANS
(„000KGS)
Katakwi 72,000 2,916 518 237 53 2,679 465
Kumi 19,536 791 141 150 20 641 121
Amuria 84,000 3,402 605 284 75 3,119 530
Kaberamaido 26,064 1,056 188 29 6 1,027 182
Bukedea 44,778 1,814 322 216 40 1,598 283
Soroti 101,832 4,124 733 347 48 3,777 685
Lira 350,828 14,209 2,526 273 44 13,936 2,482
Average 99,863 4,044 719 219 41 3,825 678
Source: District reports and central stores ledgers

233
Column 5 of table 2 is translated into the likely number of people who were not served with
food relief items in Table 3 below:
DISTRICT AFFECTED
POPULATION
No. of People not
supplied
Average number of
people not supplied
both maize flour and
beans
People
Supplied
POSHO BEANS Number Percentage Percentage
1 Katakwi 72,000 66,148 64,583 65,366 90.8 % 9.2%
2 Kumi 19,536 15,827 16,806 16,316 83.5 % 16.5%
3 Amuria 84,000 77,012 73,611 75,312 89.7 % 10.3%
4 Kaberamaido 26,064 25,358 25,278 25,318 97.1 % 2.9%
5 Bukedea 44,778 39,457 39,306 39,381 87.9 % 12.1%
6 Soroti 101,832 93,259 95,139 94,199 92.5 % 7.5%
7 Lira 350,828 344,099 344,722 344,410 98.2 % 1.8%
699,038 661,160 659,444 660,302 91.4% 9.6
Average 99,863 94,4515 94,206 94,329 91 9%
Source: OAG analysis
Using Katakwi to explain the figures above:-
From table 2, deficiency is 2,679,000kgs and 465,000kg for posho and beans respectively.
Using the minimum daily ration of 450gm(0.45kg) and 80gms(0.08kg) for posho and beans
respectively, it means for the 3 months (90 days), number of people (x) & (y) for posho
and beans respectively likely not to have been served is:
For Posho 2,679,000; 0.45*90days*x= 2,679,000.
Thus x= 2,679,000/(0.45*90)= 66,148 people
For beans 465,000; 0.08*90days*y= 465,000.
Thus y= 465,000/(0.08*90)= 64,583 people

234
Average no. of people not served = (66,148+64,583)/2= 65,366 people. In percentage
terms, (65,366/72,000)*100 = 90.8%
Through interviews with the CDMR and stores assistant, it was explained that the
dispatch/allocation of food relief items from the central stores to disaster hit areas was
based on the availability of resources.
Provision of inadequate food relief items led to malnutrition and starvation of the affected
people.
Management response
Management said that other funding modalities are being used to respond to
disasters; for instance, the institution of the Peace Recovery Development Plan
(PRDP) and Northern Uganda Social Action Fund (NUSAF).
11.3 CONCLUSIONS
From the above findings, the following conclusions were made to highlight the opinions
observed during the course of the audit.
11.3.1 Disaster Response Time
Delayed access to food impinges on the survival of the persons affected by disaster.
11.3.2 Disaster Needs Assessment
In the absence of an initial assessment of the disaster situation, OPM could not have a
clear analysis of the threats to life and whether an external response was required and if
so, the nature of the response.

235
11.3.3 Coordination of Disaster Activities
Without regularly updated and shared information on coordination and implementation of
emergency humanitarian activities, it becomes difficult to identify emerging problems and
priorities and to address them in a timely manner.
11.3.4 Allocation of Food Relief Items to Disaster Victims
Failure by OPM/DDMR to allocate food relief items to the disaster affected people, in
accordance with WFP minimum ration daily allocation, could lead to starvation and death.
11.4 RECOMMENDATIONS
From the above findings and conclusions, we wish to make the following recommendations
which are aimed at addressing the weaknesses observed in the procurement and
distribution of food relief items by OPM/DDMR:
11.4.1 Disaster Response Time
OPM/DDMR should maintain adequate minimum stock of emergency food relief
items to enable prompt response to disasters.
OPM should consider increasing on the number of staff in the DDMR with the
objective of improving performance in the area of disaster management including
the effective supervision and monitoring of staff in the Department.
OPM/DDMR should develop and regularly up-date a disaster trend database to
enable realistic forecast of disasters requirements. This should include the
establishment of a minimum state of early warning and disaster preparedness as a
means of mitigating and responding promptly to disasters.
OPM should consider procuring food relief items from the suppliers nearest to a
disaster affected area so as to be able to meet distribution targets and schedules.

236
11.4.2 Disaster Needs Assessment
The staffing needs should be addressed as mentioned in 11.2.2 above.
11.4.3 Coordination of Disaster Activities
The areas of operation for the various humanitarian agencies should be clearly mapped
out to improve on coordination and fair distribution of assistance to disaster victims.
OPM/DDMR should enforce the existing disaster management coordination system whereby
all humanitarian agencies and line ministries should work together to avoid the duplication
of resources and overconcentration in a particular area or group of people.
Humanitarian agencies should be encouraged to prepare monthly reports on the
implementation of their activities and present them to OPM/DDMR. OPM/DDMR should
ensure that such reports are widely distributed so as to contribute to transparency and
accountability and allow for lessons to be learned across programs and agencies.
11.4.4 Allocation of Food Relief Items to Disaster Victims
OPM/DDMR should establish a framework to ensure the mobilization of adequate resources
so as to assist disaster victims restore to their normal lives within the shortest possible
time.

237
GLOSSARY OF TERMS
TERM
DEFINITION
ABC Classification
This refers to annual sales, lost sales and increase or decrease in market demands as follows: A Category is items that contribute 80% of sales turnover B Category is items that contribute 15% of sales turnover C Category is items that contribute 5 % of sales turnover D Category is items that are specific for NMS Kampala branch and other special requirements.
Accreditation A formal Recognition that a body is competent to carry out specific tasks.
Action Officers Means officers carrying out pension processing activities.
Assessment Means confirmation of bio-data, employment history and the calculation of a pensioner’s benefits.
Bail: Security, usually a sum of money, exchanged for the release of an arrested person as a guarantee of that person's appearance for trial.
Buffer stock The minimum relief food stuffs (maize flour and beans) level that should be kept in the stores at all times to cater for any emergency that may occur.
Calibration The set of operations which establish, under specific conditions, the relationship between values indicated by the measuring instrument or measuring system or values represented by a material measure, and the corresponding known values of a measure.
Cereals Maize flour
Certification Procedure by which a third party gives written assurance that product, process or service confirms to the specific requirements.
Codex Alimentarius
WHO/FAO Commission for food standard Commission Inspection conformity evaluation by observation and judgment accompanied as appropriate by measurement, testing or gauging.
Community Service:
A scheme whereby a person who has committed a minor offence is sentenced to perform unpaid work instead of being sent to prison. This work should be of benefit to the general public/community.

238
Confidential Personal file
Means a restricted file containing employment information of confidential nature about a public officer.
Contributory pension scheme
Means a pension plan in which the participating employees are required means a to support the plan with contributions.
Convicted Prisoner
A prisoner under a sentence of a court or a court-martial.
Core credit line drugs:
These are items that are “a must have” in all Health Centres in Uganda; they are also items that are used up to Level II Health Centres. They were also making part for the List of items agreed upon by the MoH to supply under the Credit line arrangements (financial year 2008/2009 and back).
Court Any court or authority entitled to pass a sentence in a criminal case or to order a person to be detained in custody in any case.
Defined benefit scheme
Means the pension plan in which MoPS pays a specified monthly benefit on retirement that is predetermined by a formula based on the retiring officer’s earnings history, tenure of service and age.
Disaster A serious disruption of the functioning of society, causing widespread human, material or environmental losses which exceed the ability of the affected society to cope with using its own resources.
Disaster management
The administrative decisions and operational activities that pertain to the various stages of a disaster at all levels, that is to say, international, national, community and individual.
Disaster response
The provision of assistance or intervention during or immediately after a disaster has occurred to meet life preservation and basic subsistence needs of the people affected. It can be immediate, short-term or protracted duration.
District Means a highest administrative division managed by a local government.
Emergency This involves activities aimed at saving lives and property after the occurrence of a disaster. It involves among other activities the assessment of the magnitude and scale of disaster and its effects.
Entitled Officers
Means officers in Public Service whose emoluments are paid directly from the Consolidated Fund.

239
Essential drugs Drugs listed in Essential Medicines list for Uganda, EMLU,2007.
Food items This is relief support in form of maize flour and beans.
Food relief This is the assistance in form of food (maize flour and beans) that is given to any disaster affected people or society who are unable to feed themselves using their own resources.
Green Channel A URA clearance system where imports are not inspected at the Clearance system - border.
Humanitarian agencies
These are non government organizations which are involved in the assisting people affected by disasters.
ISO 9000 A set of International Standards describing and specifying requirements for Quality Management Systems.
ISO/IEC 17025 International Standards specifying the general Requirements for the competence of testing and Calibration laboratories.
Mapping The process of allocating places of operation to various humanitarian agencies.
Matooke A mashed plantain meal.
Metrology Science of Measurement (applied to ensure accuracy and precision of measuring tools and instruments).
Mukene A fast-swimming smallish fish (of ray-finned fish specie) mainly found in Lake Victoria. It is usually dried and mixed in sauce.
Native Service forms
means pension forms designed during the colonial days to be filled by indigenous public officers and are still in use.
Noncore credit line drugs:
These are items that may be needed at Health Centres in Uganda; A Health Centre II may function well without them; They were also making part for the List of items agreed upon by the MoH to supply under the Credit line arrangements (financial year 2008/2009 and back).
Obsolete items Are defined as items which have not been sold for more than 3 years, and have been declared by the NMS inventory team as obsolete on a case by case basis.
Operation Q Section of UNBS responsible for market surveillance (Standard Enforcement in the market place).

240
Other priority lists
Refers to any product that does not belong to the priority products, e.g. Medical Instruments, Orthopedic supplies, Slow moving stock, etc
Pension Means a steady and regular income paid to a person, usually after retirement or end of service rendered to the Public Service under legal or contractual terms.
Pensioner Means a person who has retired and collecting pension.
PHC products All products requested for by Health Centres that are not part of those supplied under the Credit Line arrangement.
Pick quantity Means the quantity of drugs available for sale at a given point in time.
Posho A local dish which is a cornmeal product and a staple starch component. It is commonly made from maize flour and water, and varies in consistency from porridge to a dough-like substance.
Priority lists Priority products refers to the “Core products”, the “Non Core products” and the “PHC products”.
Prisoner A person duly committed to custody under warrant or order of court exercising criminal jurisdiction or by order of court.
Processing time
Means the time clients have to wait for services to be delivered.
Public Officer Means any person holding or acting in office in the Public Service.
Public Service means service in any civil capacity of government, the emoluments for which are payable directly from the Consolidated Fund or directly out of monies provided by Parliament.
Pulses Beans
Quality Degree to which inherent characteristics fulfils requirements.
Quality Assurance
Part of quality measurement focused on providing confidence that quality requirements will be fulfilled.
Quality Audit Systematic, independent and documented process for obtaining Audit evidence and evaluating it objectively to determine the extent to which audit criteria are fulfilled.

241
Quality Mgt Management system to direct and control an organization with system regard to quality.
Remand The act of sending an accused person back into custody to await trial (or the continuation of the trial).
Rodents An animal having sharp front teeth for gnawing. Rats, mice, squirrels, woodchucks, and beavers are all included in this group.
Standard Document, established by consensus and approved by recognized body, that provides, for common and repeated use, rules, guidelines or Characteristics for activities of their results aimed at the achievement of optimum degree of order in a given context.
Standardization The activity of establishing, with regard to actual or potential Problems, provision for common and repeated use, aimed at the achieving of the optimum degree of order in a given context.
Stock-cover(in months)
Means the estimated number of months the stock of drug available on hand can sustain customer demands before it runs out of stock.
Technical Committees
A team of experts and stakeholders mandated to develop in a specific area/field.
Terminal benefits
Means monies that a public officer is entitled to, as a result of termination of services that they have rendered to the public service.
Third Parties Are development partners under specific health programmes from whom NMS receives medical supplies for storage and distribution to health facilities in accordance with delivery schedules prepared by MOH.
Traditional public Officers
Means officers in the public service, other than defense and teaching service.
Vaccination An injection of microorganisms, such as bacteria or viruses administered to induce immunity or to reduce the effect of associated infectious diseases.
Verification Means checking documents for completeness and authenticity.

242
Vermin These are small animals or insects such as rats or cockroaches flies, crickets, mosquitoes, beetles, butterflies, or bees, similar arthropod animals, such as spiders, centipedes, or ticks that cause harm, are troublesome, destructive, annoying, or injurious to health.


![AUDiToR inDEPEnDEnCE 9 - ANU Presspress-files.anu.edu.au/downloads/press/p127531/pdf/ch0921.pdf · AUDiToR inDEPEnDEnCE 9 [T] ... most debated aspects in the maintenance of auditor](https://static.fdocument.pub/doc/165x107/5b4fed8a7f8b9a166e8d6686/auditor-independence-9-anu-presspress-filesanueduaudownloadspressp127531pdf.jpg)


