O TE KAUNIHERA O TĀMAKI MAKAURAU … Rfipoata fl-Tau 2016/2017 o Te Kaunihera o Tāmaki Makaurau...
116
Pokanga 3: Ngā Pūrongo Pūtea | 1 Te Rīpoata ā-Tau 2016/2017 O TE KAUNIHERA O TĀMAKI MAKAURAU AUCKLAND COUNCIL Annual Report 2016/2017 Pokanga 3: Ngā Pūrongo Pūtea Volume 3: Financial statements
Transcript of O TE KAUNIHERA O TĀMAKI MAKAURAU … Rfipoata fl-Tau 2016/2017 o Te Kaunihera o Tāmaki Makaurau...

Te Rīpoata ā-Tau 2016/2017 o Te Kaunihera
o Tāmaki Makaurau
Pokanga 3: Ngā Pūrongo Pūtea | 1
Te Rīpoata ā-Tau 2016/2017 O TE KAUNIHERA O TĀMAKI MAKAURAU
AUCKLAND COUNCIL
Annual Report 2016/2017
Pokanga 3: Ngā Pūrongo PūteaVolume 3: Financial statements

Auckland Council Annual Report 2016/2017
2 | Volume 3: Financial statements
Westhaven Boardwalk
Auckland Council Annual Report 2016/2017
2 | Volume 3: Financial statements

Te Rīpoata ā-Tau 2016/2017 o Te Kaunihera
o Tāmaki Makaurau
Pokanga 3: Ngā Pūrongo Pūtea | 3
He mihi
Noho mai rā Tāmaki Makaurau,moana waipiata,maunga kākāriki.
Mai i ngā wai kaukau o ngā tūpuna,ki ngā puke kawe i ngā reo o te tini,
i puta ai te kī mōu.Tū ana he maunga,
takoto ana he raoraoheke ana he awaawa.
Ko ō wahapū te ataahua,ō tāhuna te mahora,
te taiao e whītiki nei i a koe he taonga tuku.Tiakina kia meinga tonu ai koe
ko ‘Te Kāinga Noho Āhuru o te Ao’.
Tāmaki Makaurau tirohia te pae tawhitihe whakairinga tūmanako
mō ngā uri whakaheke ō āpōpō,te toka herenga mō te hunga ka takahi ake
mā ō tomokanga,te piriti e whakawhiti ai
tō iwi ki ngā huarahi o te ora.
Tāmaki Makaurau e toro whakamua,hikina te mānuka.
Tērā te rangi me te whenua te tūtaki.Maranga me te rā, he mahi māu me tīmata,
ka nunumi ana ki te pō,whakatārewahia ō moemoeā ki ngā whetū.
Ko te oranga mutunga mōukei tua i te taumata moana.
Tūwherahia ō ringa, kūmea mai ki tō uma.
Tāmaki Makaurauhe tāone ūmanga kurupounamu ;
tukua tō rongo kia rere i te ao.
Tāmaki Makaurauwho bestrides shimmering seas,and verdant mountains.From the bathing waters of our forebears,and hills that echo with voicesthat acclaim.Your mountains stand lofty,your valleys spread from themand your streams run freely.Your harbours are majestic,your beaches widespread,the environment that surrounds you is a legacy.Take care of it so that you will always be knownas ‘The World’s Most Liveable City’.
Tāmaki Makaurau looking to the future,repository of our hopesfor generations to come,anchor stone for those who venturethrough your gateway,and the bridge that connectsyour citizens to life.
Tāmaki Makaurau moving on,accepting all challenges.Where even heaven and earth might meet.Rise with the sun as there is work to be doneand when evening comes,your dreams to glide among the stars.
Perpetual health and growthis beyond the horizon of cresting waves.Open your arms and pull them to your embrace.
Tāmaki Makaurau, you are a citywhere valued business and enterprise thrives;let your good name traverse the world.
Auckland Council Annual Report 2016/2017
4 | Volume 3: Financial statements
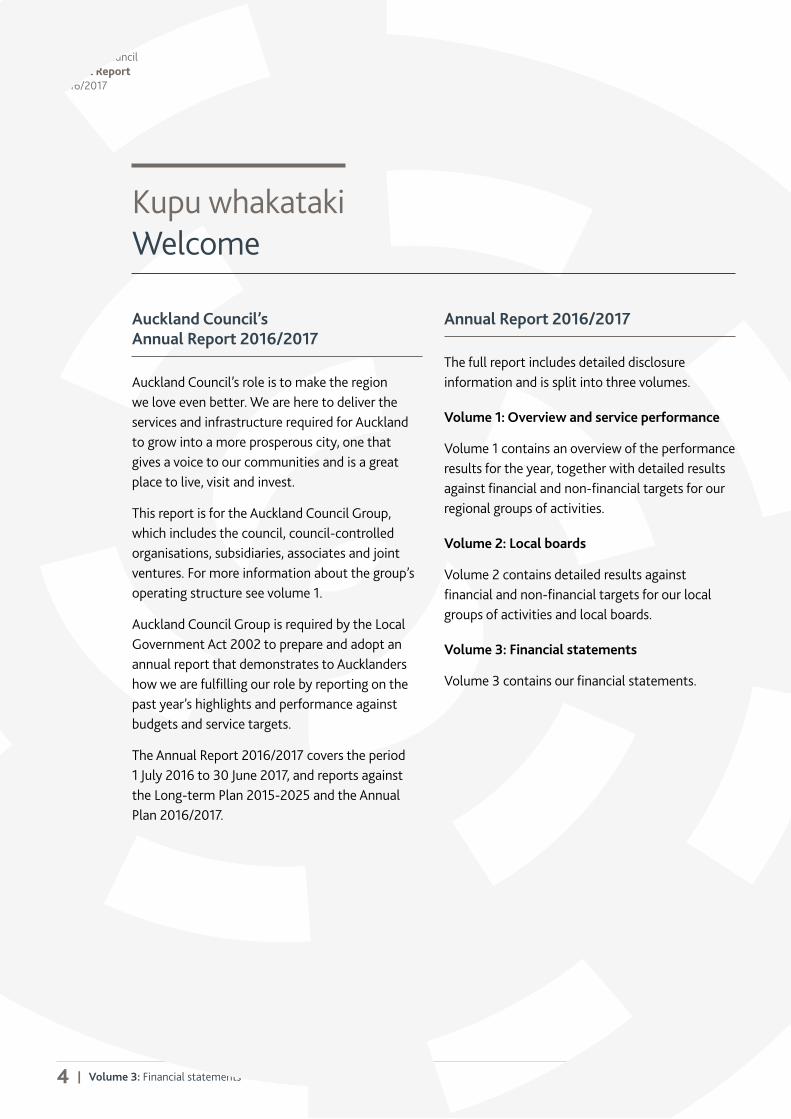
Kupu whakatakiWelcome
Auckland Council’s Annual Report 2016/2017
Auckland Council’s role is to make the region we love even better. We are here to deliver the services and infrastructure required for Auckland to grow into a more prosperous city, one that gives a voice to our communities and is a great place to live, visit and invest.
This report is for the Auckland Council Group, which includes the council, council-controlled organisations, subsidiaries, associates and joint ventures. For more information about the group’s operating structure see volume 1.
Auckland Council Group is required by the Local Government Act 2002 to prepare and adopt an annual report that demonstrates to Aucklanders how we are fulfilling our role by reporting on the past year’s highlights and performance against budgets and service targets.
The Annual Report 2016/2017 covers the period 1 July 2016 to 30 June 2017, and reports against the Long-term Plan 2015-2025 and the Annual Plan 2016/2017.
Annual Report 2016/2017
The full report includes detailed disclosure information and is split into three volumes.
Volume 1: Overview and service performance
Volume 1 contains an overview of the performance results for the year, together with detailed results against financial and non-financial targets for our regional groups of activities.
Volume 2: Local boards
Volume 2 contains detailed results against financial and non-financial targets for our local groups of activities and local boards.
Volume 3: Financial statements
Volume 3 contains our financial statements.

Te Rīpoata ā-Tau 2016/2017 o Te Kaunihera
o Tāmaki Makaurau
Pokanga 3: Ngā Pūrongo Pūtea | 5
How the annual report fits into our planning and reporting framework
Auckland Plan30-year
vision for region-wide
infrastructure and social
development Annual reportOverview of
performance against annual targets and budgets, and key
achievements related to other plans and
strategies
Auckland Unitary PlanRules for protection and development of our
natural and built environment
Place-based plans and core strategiesPlans that cover specific locations or areas of council responsibility
Long-term plan10-year overview of planned budgets,
activities, services and investments (reviewed and updated every three years)
Annual plansBudget outlining investments, services
and activities for the financial year, including 21 local board agreements, and
statements of intent for council-controlled organisations that set out what they are
responsible for delivering
Local board plansThree-year work programmes and priorities
for each of Auckland’s 21 local boards

Auckland Council Annual Report 2016/2017
6 | Volume 3: Financial statements
Rārangi kōreroContents
Cover: Outdoor cinema at Silo Park, Central Auckland, by Todd Eyre
About this volume ......................................................... 8
Message from the Group Chief Financial Officer ... 9
Statement of compliance and responsibility ........ 10
Statement of comprehensive revenue and expenditure ......................................................... 11
Statement of financial position ............................... 12
Statement of changes in equity .............................. 13
Statement of cash flows .......................................... 14
Basis of reporting ....................................................... 15
Section A: Results of the year .................................. 17
A1 Revenue ............................................................... 18 A2 Operating expenses .......................................... 21 A3 Employee benefits ............................................ 23 A4 Depreciation and amortisation ..................... 24 A5 Finance costs ..................................................... 25 A6 Net other gains and losses ............................... 26 A7 Income tax ......................................................... 26
Section B: Long-term assets .................................... 28
B1 Property, plant and equipment ..................... 29 B2 Intangible assets ............................................... 41 B3 Investment property ........................................ 43
Section C: Borrowings and financial instruments ................................................ 44
C1 Borrowings ......................................................... 45 C2 Derivative financial instruments ................... 46 C3 Other financial assets ...................................... 48 C4 Fair value and classification of financial instruments ...................................49
Section D: Working capital and equity .................. 52
D1 Cash and cash equivalents ............................... 53 D2 Receivables and prepayments ......................... 53 D3 Payables and accruals ...................................... 54 D4 Employee entitlements .................................... 55 D5 Provisions ........................................................... 55 D6 Ratepayer equity .............................................. 58
Section E: Financial risk management .................... 61
E1 Foreign exchange risk ....................................... 62 E2 Interest rate risk ................................................ 62 E3 Credit risk .......................................................... 64 E4 Liquidity risk ...................................................... 65
Section F: Other disclosures .................................... 68
F1 Non-current assets held for sale ................... 69 F2 Deferred tax assets and liabilities ................. 69 F3 Investment in other entities .......................... 70 F4 Contingencies, commitments and subsequent events .................................... 71 F5 Related party transactions ............................. 76 F6 Reconciliation of surplus/ (deficit) after income tax to net cash inflow from operating activities ................................ 82 F7 City Rail Link project (CRL Project) .............. 82
Section G: Financial reporting and prudence benchmarks ....................................... 84
Section H: Council-controlled organisations ........ 89
Independent auditor’s report .................................. 96
NZX and other exchange listing requirements ................................................ 103
Main differences between IFRS and PBE Accounting Standards ............................. 105
Glossary ..................................................................... 110

Te Rīpoata ā-Tau 2016/2017 o Te Kaunihera
o Tāmaki Makaurau
Pokanga 3: Ngā Pūrongo Pūtea | 7
Takapuna playground
Te Rīpoata ā-Tau 2016/2017 o Te Kaunihera
o Tāmaki Makaurau
Pokanga 3: Ngā Pūrongo Pūtea | 7

Auckland Council Annual Report 2016/2017
8 | Volume 3: Financial statements8
About this volume This volume of the annual report contains our financial statements of the Auckland Council and the Group for the year ended 30 June 2017. The Group includes Auckland Council (the council) and its council-controlled organisations (CCOs). The Annual Report 2016/2017 received an unmodified audit opinion and was adopted by Auckland Council on 28 September 2017. The references to documents and information on Auckland Council and other websites are provided solely for the convenience of the readers who may require more detailed information and none of the documents or other information on those websites forms part of the Annual Report 2016/2017. For the clarity and usefulness of this report, this volume has the following sections:
A. Results of the year B. Long-term assets
C. Borrowings and financial instruments D. Working capital and equity E. Financial risk management F. Other disclosures G. Financial reporting and prudence
benchmarks H. Council-controlled organisations
The notes to the financial statements contain detailed financial information as well as the relevant accounting policies, explanation of significant variances against budget and local government disclosures. Additional signposting has been used throughout the annual report to provide readers with a clearer understanding of key information in the financial report. In addition to signposting, accounting policies are denoted by the box surrounding them and significant judgement and estimates are denoted by green highlights. The following signposts have been used throughout this volume of the annual report:
Signposts Explanation
Accounting policy
Significant judgement and estimates
Explanation of significant variances against budget
Local government disclosures

Te Rīpoata ā-Tau 2016/2017 o Te Kaunihera
o Tāmaki Makaurau
Pokanga 3: Ngā Pūrongo Pūtea | 98
About this volume This volume of the annual report contains our financial statements of the Auckland Council and the Group for the year ended 30 June 2017. The Group includes Auckland Council (the council) and its council-controlled organisations (CCOs). The Annual Report 2016/2017 received an unmodified audit opinion and was adopted by Auckland Council on 28 September 2017. The references to documents and information on Auckland Council and other websites are provided solely for the convenience of the readers who may require more detailed information and none of the documents or other information on those websites forms part of the Annual Report 2016/2017. For the clarity and usefulness of this report, this volume has the following sections:
A. Results of the year B. Long-term assets
C. Borrowings and financial instruments D. Working capital and equity E. Financial risk management F. Other disclosures G. Financial reporting and prudence
benchmarks H. Council-controlled organisations
The notes to the financial statements contain detailed financial information as well as the relevant accounting policies, explanation of significant variances against budget and local government disclosures. Additional signposting has been used throughout the annual report to provide readers with a clearer understanding of key information in the financial report. In addition to signposting, accounting policies are denoted by the box surrounding them and significant judgement and estimates are denoted by green highlights. The following signposts have been used throughout this volume of the annual report:
Signposts Explanation
Accounting policy
Significant judgement and estimates
Explanation of significant variances against budget
Local government disclosures
Annual Report 2016/2017
Volume 3: Financial statements 9
Message from the Group Chief Financial Officer Auckland Council’s focus is to operate in a financially sound and prudent manner, providing value for money for ratepayers and investors, and addressing the challenges facing our region. This year we funded our core services with total revenue of $4,129 million, which was above plan by $160 million. While rates is a major component, more than half of the total revenue came from other sources; it is the latter, primarily vested assets, that account for the favourable variance this year. We continuously seek alternative revenue sources to ensure we are able to deliver the services Aucklanders have told us they want, while reducing our reliance on rates. Total operating expenditure exceeded budget by $122 million, principally due to adjustments to provisioning for weathertightness, closed landfills, loan guarantees and holiday pay entitlements, as well as unbudgeted redundancies. As a successful and increasingly global city, Auckland’s population is growing rapidly. This continuously adds to the demands on our transport, three waters, waste and community infrastructure. We need to balance the delivery of core services with new investment in infrastructure to meet the needs of the growing population. Auckland Council Group holds long-term assets of $43.4 billion, including operational and infrastructure assets. Robust asset management ensures that assets are maintained and service levels remain high and are fit for purpose. When investing in infrastructure, we borrow funds so repayment can be spread across the generations that benefit from these assets. At year-end our total debt (after cash on hand) was $7.9 billion, which is $467 million below the Annual Plan forecast.
We prudently manage our debt levels across a diversified range of sources to maintain one of the strongest credit ratings in New Zealand. As with prior years, we continue to maintain our credit ratings of AA (stable) from Standard and Poor’s and Aa2 from Moody’s Investor Services. We are focused on providing value for money by renegotiating contracts with suppliers, maintaining a strong financial control environment and exercising sound judgement around valuing our assets. We carefully plan for growth to ensure future Aucklanders have the necessary resources available to them. We have finished this financial year with an operating surplus before gains and losses of $340 million. Moving forward, we need to keep rates increases low and manage cost pressures. As the Group Chief Financial Officer I feel a strong obligation to ensure that the group acts prudently and with fiscal responsibility. We are stewards of substantial assets and revenue held on behalf of our communities, and we have a significant impact on the daily lives of our citizens, both now and into the future.
Sue Tindal Group Chief Financial Officer

Auckland Council Annual Report 2016/2017
10 | Volume 3: Financial statements

Te Rīpoata ā-Tau 2016/2017 o Te Kaunihera
o Tāmaki Makaurau
Pokanga 3: Ngā Pūrongo Pūtea | 11
Annual Report 2016/2017
Volume 3: Financial statements 11
Statement of comprehensive revenue and expenditure For the year ended 30 June 2017
Group Council
Actual Budget Actual Actual Budget Actual $million Note 2017 2017 2016 2017 2017 2016 Revenue
Rates
1,641 1,637 1,564 1,651 1,649 1,574 Fees and user charges
1,193 1,228 1,083 252 242 243
Grants and subsidies
459 500 404 16 37 22 Development and financial contributions
164 163 131 164 163 131
Other revenue 281 240 260 166 182 179 Vested assets 374 196 247 106 74 64 Finance revenue 17 5 16 91 95 100 Total revenue excluding other gains A1 4,129 3,969 3,705 2,446 2,442 2,313
Expenditure
Employee benefits A3 853 811 803 508 481 484
Depreciation and amortisation A4 874 886 828 256 256 237 Grants, contributions and sponsorship A2 127 125 126 1,057 1,057 909 Other operating expenses A2 1,464 1,380 1,281 570 480 516 Finance costs A5 471 465 417 413 415 360 Total expenditure excluding other losses 3,789 3,667 3,455 2,804 2,689 2,506
Operating surplus/(deficit) before gains and losses 340 302 250 (358) (247) (193) Net other gains/(losses) A6 281 - (552) 161 - (443) Share of surplus in associates and joint ventures 75 55 63 4 2 - Surplus/(deficit) before income tax 696 357 (239) (193) (245) (636) Income tax (benefit)/expense A7 56 27 (8) - - - Surplus/(deficit) after income tax 640 330 (231) (193) (245) (636)
Other comprehensive revenue/ (expenditure)
Net gain on revaluation of property, plant and equipment
1,468 1,018 1,626 - - 1,156
Tax on revaluation of property, plant and equipment
- (91) (4) - - -
Movement in cashflow hedge reserve
3 - (9) - - - Tax on movement in cash flow hedge reserve
- - 2 - - -
Share of associates and joint ventures' reserves
2 - 171 - - -
Net unrealised gain/(loss) on revaluation of financial assets classified as available-for-sale
11 - 2 - - -
Total other comprehensive revenue 1,484 927 1,788 - - 1,156 Total comprehensive revenue/ (expenditure) 2,124 1,257 1,557 (193) (245) 520
Explanations of significant variances against budget are included within the notes.
The accompanying notes to the financial statements form part of, and are to be read in conjunction with, these financial statements.

Auckland Council Annual Report 2016/2017
12 | Volume 3: Financial statements
Annual Report 2016/2017
12
Statement of financial position As at 30 June 2017
Group Council
Actual Budget Actual Actual Budget Actual $million Note 2017 2017 2016 2017 2017 2016 Assets
Current assets
Cash and cash equivalents D1 337 330 137 279 282 103
Receivables and prepayments D2 345 262 275 279 213 181 Derivative financial instruments C2 - 2 - - 1 - Other financial assets C3 276 265 389 361 288 473 Inventories 35 17 28 11 5 8 Income tax receivable - - 1 - - - Non-current assets held-for-sale F1 332 53 43 40 52 32 Total current assets 1,325 929 873 970 841 797 Non-current assets
Receivables and prepayments D2 9 26 24 4 16 16 Derivative financial instruments C2 170 200 263 161 198 255 Other financial assets C3 141 139 128 1,814 1,912 1,653 Property, plant and equipment B1 43,361 42,439 41,156 13,659 13,059 13,410 Intangible assets B2 511 521 478 297 283 287 Investment property B3 735 560 681 162 102 121 Investment in subsidiaries* F3 - - - 21,068 21,178 21,080 Investment in associates and joint ventures F3 1,096 900 1,074 16 18 14 Other non-current assets 11 1 2 3 1 2 Total non-current assets 46,034 44,786 43,806 37,184 36,767 36,838 Total assets 47,359 45,715 44,679 38,154 37,608 37,635 Liabilities
Current liabilities
Bank overdraft D1 6 - 9 - - -
Payables and accruals D3 688 753 607 673 679 540 Employee entitlements D4 95 87 90 52 51 53 Borrowings C1 1,125 1,613 1,447 975 1,408 1,169 Derivative financial instruments C2 7 2 7 2 1 2 Income tax payable - 2 - - - - Provisions D5 82 61 101 77 55 99 Total current liabilities 2,003 2,518 2,261 1,779 2,194 1,863 Non-current liabilities
Payables and accruals D3 49 62 45 27 50 22 Employee entitlements D4 5 5 5 2 2 2 Borrowings C1 7,175 7,153 6,164 6,729 6,617 5,772 Derivative financial instruments C2 865 485 1,207 653 327 901 Provisions D5 374 243 290 367 236 285 Deferred tax liabilities F2 1,112 1,192 1,055 - - - Total non-current liabilities 9,580 9,140 8,766 7,778 7,232 6,982 Total liabilities 11,583 11,658 11,027 9,557 9,426 8,845 Net assets 35,776 34,057 33,652 28,597 28,182 28,790 Equity
Contributed equity D6 26,728 26,728 26,728 26,569 26,569 26,569 Accumulated funds D6 951 1,075 290 (824) (476) (633) Reserves D6 8,097 6,254 6,634 2,852 2,089 2,854 Total equity 35,776 34,057 33,652 28,597 28,182 28,790
*Total investments in council-controlled organisations (CCOs) and entities listed in Local Government Act 2002 section 6(4) of the council for 2017 is $21 billion (2016: $21 billion). The accompanying notes to the financial statements form part of, and are to be read in conjunction with, these financial statements.

Te Rīpoata ā-Tau 2016/2017 o Te Kaunihera
o Tāmaki Makaurau
Pokanga 3: Ngā Pūrongo Pūtea | 13
Annual Report 2016/2017
12
Statement of financial position As at 30 June 2017
Group Council
Actual Budget Actual Actual Budget Actual $million Note 2017 2017 2016 2017 2017 2016 Assets
Current assets
Cash and cash equivalents D1 337 330 137 279 282 103
Receivables and prepayments D2 345 262 275 279 213 181 Derivative financial instruments C2 - 2 - - 1 - Other financial assets C3 276 265 389 361 288 473 Inventories 35 17 28 11 5 8 Income tax receivable - - 1 - - - Non-current assets held-for-sale F1 332 53 43 40 52 32 Total current assets 1,325 929 873 970 841 797 Non-current assets
Receivables and prepayments D2 9 26 24 4 16 16 Derivative financial instruments C2 170 200 263 161 198 255 Other financial assets C3 141 139 128 1,814 1,912 1,653 Property, plant and equipment B1 43,361 42,439 41,156 13,659 13,059 13,410 Intangible assets B2 511 521 478 297 283 287 Investment property B3 735 560 681 162 102 121 Investment in subsidiaries* F3 - - - 21,068 21,178 21,080 Investment in associates and joint ventures F3 1,096 900 1,074 16 18 14 Other non-current assets 11 1 2 3 1 2 Total non-current assets 46,034 44,786 43,806 37,184 36,767 36,838 Total assets 47,359 45,715 44,679 38,154 37,608 37,635 Liabilities
Current liabilities
Bank overdraft D1 6 - 9 - - -
Payables and accruals D3 688 753 607 673 679 540 Employee entitlements D4 95 87 90 52 51 53 Borrowings C1 1,125 1,613 1,447 975 1,408 1,169 Derivative financial instruments C2 7 2 7 2 1 2 Income tax payable - 2 - - - - Provisions D5 82 61 101 77 55 99 Total current liabilities 2,003 2,518 2,261 1,779 2,194 1,863 Non-current liabilities
Payables and accruals D3 49 62 45 27 50 22 Employee entitlements D4 5 5 5 2 2 2 Borrowings C1 7,175 7,153 6,164 6,729 6,617 5,772 Derivative financial instruments C2 865 485 1,207 653 327 901 Provisions D5 374 243 290 367 236 285 Deferred tax liabilities F2 1,112 1,192 1,055 - - - Total non-current liabilities 9,580 9,140 8,766 7,778 7,232 6,982 Total liabilities 11,583 11,658 11,027 9,557 9,426 8,845 Net assets 35,776 34,057 33,652 28,597 28,182 28,790 Equity
Contributed equity D6 26,728 26,728 26,728 26,569 26,569 26,569 Accumulated funds D6 951 1,075 290 (824) (476) (633) Reserves D6 8,097 6,254 6,634 2,852 2,089 2,854 Total equity 35,776 34,057 33,652 28,597 28,182 28,790
*Total investments in council-controlled organisations (CCOs) and entities listed in Local Government Act 2002 section 6(4) of the council for 2017 is $21 billion (2016: $21 billion). The accompanying notes to the financial statements form part of, and are to be read in conjunction with, these financial statements.
Annual Report 2016/2017
Volume 3: Financial statements 13
Statement of changes in equity For the year ended 30 June 2017
Group
$million Note
Contributed equity
Accumulated funds Reserves
Total equity Budget*
Balance as at 1 July 2015 26,728 517 4,834 32,079 31,983 Deficit after income tax - (231) - (231) 226 Other comprehensive revenue - - 1,788 1,788 5 Total comprehensive (expenditure)/revenue - (231) 1,788 1,557 231 Found assets - 16 - 16 - Transfers to/(from) reserves D6 - (12) 12 - - Balance as at 30 June 2016 D6 26,728 290 6,634 33,652 32,214
Balance as at 1 July 2016 26,728 290 6,634 33,652 32,800 Surplus after income tax - 640 - 640 330 Other comprehensive revenue - - 1,484 1,484 927 Total comprehensive revenue - 640 1,484 2,124 1,257 Transfers (from)/to reserves D6 - 21 (21) - - Balance as at 30 June 2017 D6 26,728 951 8,097 35,776 34,057
Council
$million Note
Contributed equity
Accumulated funds Reserves
Total equity Budget*
Balance as at 1 July 2015 26,569 20 1,681 28,270 27,924 Deficit after income tax - (636) - (636) (205) Other comprehensive revenue - - 1,156 1,156 - Total comprehensive (expenditure)/revenue - (636) 1,156 520 (205) Transfers (from)/to reserves D6 - (17) 17 - - Balance as at 30 June 2016 D6 26,569 (633) 2,854 28,790 27,719
Balance as at 1 July 2016 26,569 (633) 2,854 28,790 28,427 Deficit after income tax - (193) - (193) (245) Total comprehensive expenditure - (193) - (193) (245) Transfers to/(from) reserves D6 - 2 (2) - - Balance as at 30 June 2017 D6 26,569 (824) 2,852 28,597 28,182
*The opening balances as at 1 July 2015 were updated in the Annual Budget 2016/2017 based on the most up-to-date forecast information.
The accompanying notes to the financial statements form part of, and are to be read in conjunction with, these financial statements.

Auckland Council Annual Report 2016/2017
14 | Volume 3: Financial statements
Annual Report 2016/2017
14
Statement of cash flows For the year ended 30 June 2017
Group Council
Actual Budget Actual Actual Budget Actual
$million Note 2017 2017 2016 2017 2017 2016 Cash flows from operating activities
Receipts from customers, rates, grants and other services 3,692 3,732 3,453 2,170 2,128 2,081 Interest received 14 5 13 12 95 12 Dividends received 57 54 49 90 93 72 Payments to suppliers and employees (2,528) (2,296) (2,324) (2,113) (2,065) (1,874) Income tax refund/(paid) 1 (9) - - - - Interest paid (422) (455) (420) (365) (405) (366) Net cash inflow/(outflow) from operating activities F6 814 1,031 771 (206) (154) (75) Cash flows from investing activities
Repayment of loans to related parties - - - 137 - 24 Advances of loans to related parties - - - (288) (262) (232) Sale of property, plant and equipment, investment property and intangible assets 107 87 22 57 85 21 Purchase of property, plant and equipment, investment property and intangible assets (1,542) (1,945) (1,340) (434) (592) (377) Acquisition of other financial assets (190) (5) (76) (208) (5) (64) Proceeds from sale of other financial assets 308 100 59 316 100 62 Advances to external parties (14) (9) (3) (2) (9) (3) Proceeds from community loan repayments 6 - - 6 - - Net cash outflow from investing activities (1,325) (1,772) (1,338) (416) (683) (569) Cash flows from financing activities
Proceeds from borrowings 3,919 2,222 1,994 2,692 2,096 958 Repayment of borrowings (3,205) (1,481) (1,635) (1,894) (1,259) (493) Repayment of finance lease principal - - (1) - - - Net cash inflow from financing activities 714 741 358 798 837 465 Net increase/(decrease) in cash and cash equivalents 203 - (209) 176 - (179) Opening cash and cash equivalents 128 330 337 103 282 282
Closing cash and cash equivalents D1 331 330 128 279 282 103 The accompanying notes to the financial statements form part of, and are to be read in conjunction with, these financial statements.

Te Rīpoata ā-Tau 2016/2017 o Te Kaunihera
o Tāmaki Makaurau
Pokanga 3: Ngā Pūrongo Pūtea | 15
Annual Report 2016/2017
14
Statement of cash flows For the year ended 30 June 2017
Group Council
Actual Budget Actual Actual Budget Actual
$million Note 2017 2017 2016 2017 2017 2016 Cash flows from operating activities
Receipts from customers, rates, grants and other services 3,692 3,732 3,453 2,170 2,128 2,081 Interest received 14 5 13 12 95 12 Dividends received 57 54 49 90 93 72 Payments to suppliers and employees (2,528) (2,296) (2,324) (2,113) (2,065) (1,874) Income tax refund/(paid) 1 (9) - - - - Interest paid (422) (455) (420) (365) (405) (366) Net cash inflow/(outflow) from operating activities F6 814 1,031 771 (206) (154) (75) Cash flows from investing activities
Repayment of loans to related parties - - - 137 - 24 Advances of loans to related parties - - - (288) (262) (232) Sale of property, plant and equipment, investment property and intangible assets 107 87 22 57 85 21 Purchase of property, plant and equipment, investment property and intangible assets (1,542) (1,945) (1,340) (434) (592) (377) Acquisition of other financial assets (190) (5) (76) (208) (5) (64) Proceeds from sale of other financial assets 308 100 59 316 100 62 Advances to external parties (14) (9) (3) (2) (9) (3) Proceeds from community loan repayments 6 - - 6 - - Net cash outflow from investing activities (1,325) (1,772) (1,338) (416) (683) (569) Cash flows from financing activities
Proceeds from borrowings 3,919 2,222 1,994 2,692 2,096 958 Repayment of borrowings (3,205) (1,481) (1,635) (1,894) (1,259) (493) Repayment of finance lease principal - - (1) - - - Net cash inflow from financing activities 714 741 358 798 837 465 Net increase/(decrease) in cash and cash equivalents 203 - (209) 176 - (179) Opening cash and cash equivalents 128 330 337 103 282 282
Closing cash and cash equivalents D1 331 330 128 279 282 103 The accompanying notes to the financial statements form part of, and are to be read in conjunction with, these financial statements.
Annual Report 2016/2017
Volume 3: Financial statements 15
Basis of reporting This section contains the significant accounting policies of the Group and the council that relate to the financial statements as a whole. Significant accounting policies are also included in the related note disclosures.
Auckland Council (the council) is a local authority domiciled in New Zealand and governed by the following legislation: Local Government Act 2002 (LGA 2002); Local Government (Auckland Council) Act
2009 (LGACA 2009); and, Local Government (Rating) Act 2002.
The council is an FMC Reporting Entity under the Financial Markets Conduct Act (FMCA) 2013. The council’s principal address is 135 Albert Street, Auckland Central, New Zealand. The Auckland Council Group (the Group) consists of the council, its CCOs, associates and joint ventures. A summary of substantive CCOs1 is provided on the following page. Other significant entities are listed in Note F3. All entities are domiciled in New Zealand. The primary objective of the Group and the council is to provide services and facilities to the Auckland community for social benefit rather than to make a financial return. Accordingly, the council has designated itself and the Group as public benefit entities (PBEs) and applies New Zealand Tier 1 PBE Accounting Standards. These standards are based on International Public Sector Accounting Standards (IPSAS), with amendments for the New Zealand environment. Basis of preparation The financial statements have been prepared: in accordance with New Zealand Generally
Accepted Accounting Practice (NZ GAAP), the LGA 2002, the LGACA 2009 and the Local Government (Financial Reporting and Prudence) Regulations 2014 and comply with PBE Accounting Standards;
on a historical cost basis, except for financial instruments which have been measured at fair value (Note C2), certain classes of property, plant and equipment (Note B1) and investment property (Note B3) which have been subsequently measured at fair value;
on a going concern basis and the accounting policies have been applied consistently throughout the period; and,
in New Zealand dollars (NZD) and are rounded to the nearest million dollars, unless otherwise stated.
All items in the financial statements are stated exclusive of Goods and Services Tax (GST), except for receivables and payables, which include GST invoiced.
Significant judgements and estimates
The preparation of the financial statements requires judgements, estimates and assumptions. Application is based on future expectations as well as historical experience and other factors, as appropriate to the particular circumstances. Judgements and estimates which are considered material to understanding the performance of the Group and the council are found in the following notes: Note B1: Property, plant and equipment Note C2: Derivative financial instruments Note D5: Provisions Budget figures The budget figures presented in the Annual Report of the Group and the council are those included in the Annual Budget 2016/2017 (Annual Plan) adopted by the council on 30 June 2016 and are consistent with the accounting policies used to prepare the financial statements. Basis of consolidation The consolidated financial statements are prepared by adding together like items in the Group on a line-by-line basis. Transactions and balances between the council and its CCOs are eliminated on consolidation. Investment in CCOs and other subsidiaries held by the council, as disclosed in Note F3, is carried at cost less any accumulated impairment. Where necessary, adjustments are made to the financial statements of CCOs to bring their accounting policies in line with the Group.
1Section 4(1) of the LGACA 2009 defines substantive CCOs as a CCO that is either wholly owned or wholly controlled by the council and either is responsible for the delivery of a significant service or activity on behalf of the council; or owns or manages assets with a value of more than $10 million; and includes Auckland Transport.

Auckland Council Annual Report 2016/2017
16 | Volume 3: Financial statements
Annual Report 2016/2017
16
Basis of reporting The substantive CCOs within the Group comprise the following:
Name Principal activity and nature of relationship where there is no direct ownership
Percentage ownership %
2017 2016
Auckland Transport Owns the public transport network and manages the transport infrastructure and services in Auckland.
*Auckland Transport is a body corporate with perpetual succession and is treated under the LGACA 2009 as if the council is its sole shareholder.
* *
Auckland Council Investments Limited (ACIL)
Holds and manages the Group’s major investments, including:
Ports of Auckland Ltd (POAL) (100% owned) Auckland International Airport Ltd (22.33% owned).
100 100
Auckland Tourism, Events and Economic Development Limited
Manages projects for economic development, tourism and events promotion in the Auckland region.
100 100
Panuku Development Auckland Limited
Facilitates the redevelopment of urban locations. Contributes to accommodating residential and commercial growth. Optimises the council’s property portfolio. Continues to lead the development of the Auckland waterfront.
100 100
Regional Facilities Auckland (RFA)
Supports and promotes the engagement of the Auckland community in arts, culture, heritage, leisure, sports and entertainment activities and develops, owns and manages the venues for these activities.
*Regional Facilities Auckland is a charitable trust of which Regional Facilities Auckland Ltd, a 100% owned subsidiary of the council, is the sole trustee.
* *
Watercare Services Limited (Watercare)
Owns and manages the Auckland region's water and wastewater assets. Watercare is restricted by LGACA 2009 section 57(1)(b) from paying any dividend or distributing any surplus directly or indirectly to the council.
100 100
Implementation of new and amended standards PBE International Financial Reporting Standard (IFRS) 9 Financial Instruments is effective from periods beginning on or after 1 January 2021. PBE IFRS 9 addresses the classification, measurement and recognition of financial assets and financial liabilities and relaxes current requirements for hedge accounting. The Group and the council are yet to assess the impact of PBE IFRS 9 to the Group and the council. The Group and the council intend to early adopt the standard when it becomes effective for for-profit entities from period beginning on 1 July 2018. The five new standards, PBE IPSAS 34 Separate Financial Statements, PBE IPSAS 35 Consolidated Financial Statements, PBE IPSAS 36 Investment in Associates and Joint Ventures, PBE IPSAS 37 Joint Arrangements and PBE
IPSAS 38 Disclosure of Interests in Other Entities, are effective from periods beginning on or after 1 January 2019. The Group and the council intend to early adopt these standards beginning 1 July 2017. The new standards will have an impact to the Group and the council in assessing control through using additional guidance of the new standards and in determining the types of joint arrangements based on two types: joint operations and joint ventures. The Group and the council are yet to assess the impact of these new standards. All other standards, interpretations and amendments approved but not yet effective in the current year are either not applicable to the Group and the council or are not expected to have a material impact on the financial statements of the Group and the council and, therefore, have not been disclosed.

Te Rīpoata ā-Tau 2016/2017 o Te Kaunihera
o Tāmaki Makaurau
Pokanga 3: Ngā Pūrongo Pūtea | 17
Annual Report 2016/2017
16
Basis of reporting The substantive CCOs within the Group comprise the following:
Name Principal activity and nature of relationship where there is no direct ownership
Percentage ownership %
2017 2016
Auckland Transport Owns the public transport network and manages the transport infrastructure and services in Auckland.
*Auckland Transport is a body corporate with perpetual succession and is treated under the LGACA 2009 as if the council is its sole shareholder.
* *
Auckland Council Investments Limited (ACIL)
Holds and manages the Group’s major investments, including:
Ports of Auckland Ltd (POAL) (100% owned) Auckland International Airport Ltd (22.33% owned).
100 100
Auckland Tourism, Events and Economic Development Limited
Manages projects for economic development, tourism and events promotion in the Auckland region.
100 100
Panuku Development Auckland Limited
Facilitates the redevelopment of urban locations. Contributes to accommodating residential and commercial growth. Optimises the council’s property portfolio. Continues to lead the development of the Auckland waterfront.
100 100
Regional Facilities Auckland (RFA)
Supports and promotes the engagement of the Auckland community in arts, culture, heritage, leisure, sports and entertainment activities and develops, owns and manages the venues for these activities.
*Regional Facilities Auckland is a charitable trust of which Regional Facilities Auckland Ltd, a 100% owned subsidiary of the council, is the sole trustee.
* *
Watercare Services Limited (Watercare)
Owns and manages the Auckland region's water and wastewater assets. Watercare is restricted by LGACA 2009 section 57(1)(b) from paying any dividend or distributing any surplus directly or indirectly to the council.
100 100
Implementation of new and amended standards PBE International Financial Reporting Standard (IFRS) 9 Financial Instruments is effective from periods beginning on or after 1 January 2021. PBE IFRS 9 addresses the classification, measurement and recognition of financial assets and financial liabilities and relaxes current requirements for hedge accounting. The Group and the council are yet to assess the impact of PBE IFRS 9 to the Group and the council. The Group and the council intend to early adopt the standard when it becomes effective for for-profit entities from period beginning on 1 July 2018. The five new standards, PBE IPSAS 34 Separate Financial Statements, PBE IPSAS 35 Consolidated Financial Statements, PBE IPSAS 36 Investment in Associates and Joint Ventures, PBE IPSAS 37 Joint Arrangements and PBE
IPSAS 38 Disclosure of Interests in Other Entities, are effective from periods beginning on or after 1 January 2019. The Group and the council intend to early adopt these standards beginning 1 July 2017. The new standards will have an impact to the Group and the council in assessing control through using additional guidance of the new standards and in determining the types of joint arrangements based on two types: joint operations and joint ventures. The Group and the council are yet to assess the impact of these new standards. All other standards, interpretations and amendments approved but not yet effective in the current year are either not applicable to the Group and the council or are not expected to have a material impact on the financial statements of the Group and the council and, therefore, have not been disclosed.
Annual Report 2016/2017
Volume 3: Financial statements 17
Section A: Results of the year
This section focuses on the performance of the Group and the council during the year. This highlights the rates and other revenue earned and how these are applied against our major expenses such as employee benefits and finance costs.
The notes in the section are as follows:
A1 Revenue
A2 Operating expenses
A3 Employee benefits
A4 Depreciation and amortisation
A5 Finance costs
A6 Net other gains and losses
A7 Income tax

Auckland Council Annual Report 2016/2017
18 | Volume 3: Financial statements
Annual Report 2016/2017
18
Section A: Results of the year
A1 Revenue
Accounting policy
The Group and the council receive their revenue from exchange or non-exchange transactions. Exchange transaction revenue arises when the Group and the council provide goods or services to a third party and receives approximately equal value in return that is directly related to those goods and services. Non-exchange transaction revenue arises when the Group and the council receive value from another party without having to provide goods or services of equal value directly. Non-exchange revenue comprises rates and transfer revenue. Transfer revenue includes grants, subsidies and fees and user charges derived from activities that are partially funded by rates. Revenue is measured at fair value which is usually the cash value of a transaction.
Type Recognition & measurement Rates In full at point of issuance of the ratings notice and measured at the amount
assessed, which is the fair value of the cash received or receivable.
Grants and subsidies When they become receivable unless there is an obligation in substance to return the funds if conditions of the grants and subsidies are not met. If there is such an obligation, the grants and subsidies are initially recorded at fair value as grants and subsidies received in advance and recognised as revenue when conditions of the grant and subsidies are satisfied.
Development contributions
When the council is capable of providing the service for which the contribution was levied.
Financial contributions When they are expended on the activity for which the contribution was levied.
Vested assets1 When control of the asset is transferred to the Group and the council at its fair value.
Fines and infringements
When the infringement notice is issued.
Finance revenue2 Using the effective interest method.
Dividend revenue When the Group and the council’s right to receive the dividend is established.
Fees and user charges Water and wastewater When invoiced or accrued in the case of unbilled services at fair value of cash
received or receivable.
Sale of goods When the substantial risks and rewards of ownership have been passed to the buyer.
Sale of services On a percentage of completion basis over the period of the service supplied.
Port operations In the period the services are rendered, by reference to the percentage of completion of the specific transaction.
Consents By reference to the percentage of completion of the transaction at balance date based on the actual service rendered.
Licences and permits On receipt of application as these are non-refundable. 1 Arise when property developers undertake development which requires them to build infrastructure in the development area. When the development is complete these are vested to the Group and the council. 2 Includes interest revenue and realised gains from the early close-out of derivative positions.

Te Rīpoata ā-Tau 2016/2017 o Te Kaunihera
o Tāmaki Makaurau
Pokanga 3: Ngā Pūrongo Pūtea | 19
Annual Report 2016/2017
18
Section A: Results of the year
A1 Revenue
Accounting policy
The Group and the council receive their revenue from exchange or non-exchange transactions. Exchange transaction revenue arises when the Group and the council provide goods or services to a third party and receives approximately equal value in return that is directly related to those goods and services. Non-exchange transaction revenue arises when the Group and the council receive value from another party without having to provide goods or services of equal value directly. Non-exchange revenue comprises rates and transfer revenue. Transfer revenue includes grants, subsidies and fees and user charges derived from activities that are partially funded by rates. Revenue is measured at fair value which is usually the cash value of a transaction.
Type Recognition & measurement Rates In full at point of issuance of the ratings notice and measured at the amount
assessed, which is the fair value of the cash received or receivable.
Grants and subsidies When they become receivable unless there is an obligation in substance to return the funds if conditions of the grants and subsidies are not met. If there is such an obligation, the grants and subsidies are initially recorded at fair value as grants and subsidies received in advance and recognised as revenue when conditions of the grant and subsidies are satisfied.
Development contributions
When the council is capable of providing the service for which the contribution was levied.
Financial contributions When they are expended on the activity for which the contribution was levied.
Vested assets1 When control of the asset is transferred to the Group and the council at its fair value.
Fines and infringements
When the infringement notice is issued.
Finance revenue2 Using the effective interest method.
Dividend revenue When the Group and the council’s right to receive the dividend is established.
Fees and user charges Water and wastewater When invoiced or accrued in the case of unbilled services at fair value of cash
received or receivable.
Sale of goods When the substantial risks and rewards of ownership have been passed to the buyer.
Sale of services On a percentage of completion basis over the period of the service supplied.
Port operations In the period the services are rendered, by reference to the percentage of completion of the specific transaction.
Consents By reference to the percentage of completion of the transaction at balance date based on the actual service rendered.
Licences and permits On receipt of application as these are non-refundable. 1 Arise when property developers undertake development which requires them to build infrastructure in the development area. When the development is complete these are vested to the Group and the council. 2 Includes interest revenue and realised gains from the early close-out of derivative positions.
Annual Report 2016/2017
Volume 3: Financial statements 19
Section A: Results of the year
A1 Revenue (continued) The split of exchange and non-exchange revenue is disclosed below.
Group Council
$million 2017 2016 2017 2016 Revenue from non-exchange transactions: Revenue from rates General 1,452 1,391 1,462 1,401 Targeted 178 172 178 172 Penalties 18 15 18 15 Rates remissions (6) (11) (6) (11) Discounts (1) (3) (1) (3)
Total revenue from rates 1,641 1,564 1,651 1,574 Revenue from transfers Sales of goods and services 274 194 84 83 Vested assets 374 247 106 64 Fines and infringements 34 32 3 3 Consents, licences and permits 166 157 165 156 Capital grants and subsidies 187 153 2 10 Operating grants and subsidies 272 251 14 12 Other transfer revenue 105 94 43 57
Total revenue from transfers 1,412 1,128 417 385 Total revenue from non-exchange transactions 3,053 2,692 2,068 1,959 Revenue from exchange transactions: Water and wastewater 456 443 - - Sales of goods and services 49 51 - 1 Port operations 214 204 - - Development and financial contributions 164 131 164 131 Finance revenue 17 16 91 100 Dividends received 10 27 96 94 Other exchange revenue 166 141 27 28
Total revenue from exchange transactions 1,076 1,013 378 354 Total revenue 4,129 3,705 2,446 2,313
The annual rates revenue of the council for the year ended 30 June 2017 for the purposes of the Local Government Funding Agency Ltd (LGFA) Guarantee and Indemnity Deed disclosure is $1.7 billion (2016: $1.6 billion). Refer to Note F4 for further information.

Auckland Council Annual Report 2016/2017
20 | Volume 3: Financial statements
Annual Report 2016/2017
20
Section A: Results of the year
A1 Revenue (continued)
Explanation of significant variances against budget
Group Council
2017 $million Actual Budget Actual Budget Total revenue 4,129 3,969 2,446 2,442
Group Revenue is higher against budget by $160 million mainly due to the following: higher volume of vested infrastructure assets received than budgeted ($178 million); favourable results on other revenue ($29 million) mainly driven by higher than expected:
rental income of various CCOs ($12 million); Infrastructure Growth Charge by Watercare ($8 million) due to growth in developments during
the year; dividend income from the Group’s Other financial assets ($5 million); and, income from AT Hop card sales and other commercial activities ($4 million).
The above favourable results are partly offset by the following: lower capital grants received from New Zealand Transport Agency (NZTA) ($40 million) for
transport infrastructure due to capital projects being behind budget; and, lower than expected public transport income and parking fees by Auckland Transport ($12 million).
The remaining variance is driven by net favourable variance which are not individually material.
Local government disclosures The council’s rating base information relating to preceding financial year as at 30 June 2016 follows:
2016
Number of rating units 542,408 Total capital value of rating units (in $million) 488,382 Total land value of rating units (in $million) 290,907

Te Rīpoata ā-Tau 2016/2017 o Te Kaunihera
o Tāmaki Makaurau
Pokanga 3: Ngā Pūrongo Pūtea | 21
Annual Report 2016/2017
20
Section A: Results of the year
A1 Revenue (continued)
Explanation of significant variances against budget
Group Council
2017 $million Actual Budget Actual Budget Total revenue 4,129 3,969 2,446 2,442
Group Revenue is higher against budget by $160 million mainly due to the following: higher volume of vested infrastructure assets received than budgeted ($178 million); favourable results on other revenue ($29 million) mainly driven by higher than expected:
rental income of various CCOs ($12 million); Infrastructure Growth Charge by Watercare ($8 million) due to growth in developments during
the year; dividend income from the Group’s Other financial assets ($5 million); and, income from AT Hop card sales and other commercial activities ($4 million).
The above favourable results are partly offset by the following: lower capital grants received from New Zealand Transport Agency (NZTA) ($40 million) for
transport infrastructure due to capital projects being behind budget; and, lower than expected public transport income and parking fees by Auckland Transport ($12 million).
The remaining variance is driven by net favourable variance which are not individually material.
Local government disclosures The council’s rating base information relating to preceding financial year as at 30 June 2016 follows:
2016
Number of rating units 542,408 Total capital value of rating units (in $million) 488,382 Total land value of rating units (in $million) 290,907
Annual Report 2016/2017
Volume 3: Financial statements 21
Section A: Results of the year
A2 Operating expenses
Accounting policy
Grants and subsidies
Where grants and subsidies are discretionary, the expense is recognised when the Group and the council have advised their decision to pay and when conditions, if any, are satisfied. Non-discretionary grants are recognised on receipt of application that meets the specified criteria.
Impairment of property, plant and equipment and intangible assets
The initial measurement on property, plant and equipment and intangible assets is disclosed in Notes B1 and B2.
Intangible assets subsequently measured at cost that have indefinite useful life are tested annually for impairment. Property, plant and equipment and intangible assets subsequently measured at cost that have finite useful life are reviewed for impairment whenever events or changes in circumstances indicate that the carrying amount may not be recoverable. If any indication exists, the Group and the council estimate the asset’s recoverable amount. The recoverable amount is the higher of an asset’s fair value less costs to sell and value in use.
An impairment loss is recognised in surplus or deficit for the amount by which the asset’s carrying amount exceeds its recoverable amount.
Assets are considered cash generating if their primary objective is to provide a commercial return. The value in use for cash-generating assets is the present value of expected future cash flows.
For non-cash generating assets, value in use is determined using an approach based on a depreciated replacement cost.
Property, plant and equipment that is measured at fair value, is not required to be separately tested for impairment.
Operating expenses include:
Group Council
$million 2017 2016 2017 2016
Grants, contributions and sponsorship 127 126 1,057 909 Goods and services 696 535 168 121 Consultancy and professional services 151 174 70 99 Repairs and maintenance 247 243 116 112 Utilities and occupancy 84 81 46 46 Rental and lease 50 42 29 28 Impairment of receivables 2 2 - - Fees paid to elected members 10 10 10 10 Fees to auditors 4 4 1 1
Explanation of significant variances against budget
Group Council
2017 $million Actual Budget Actual Budget
Other operating expenses 1,464 1,380 570 480
Auckland Council Annual Report 2016/2017
22 | Volume 3: Financial statements
Annual Report 2016/2017
22
Section A: Results of the year
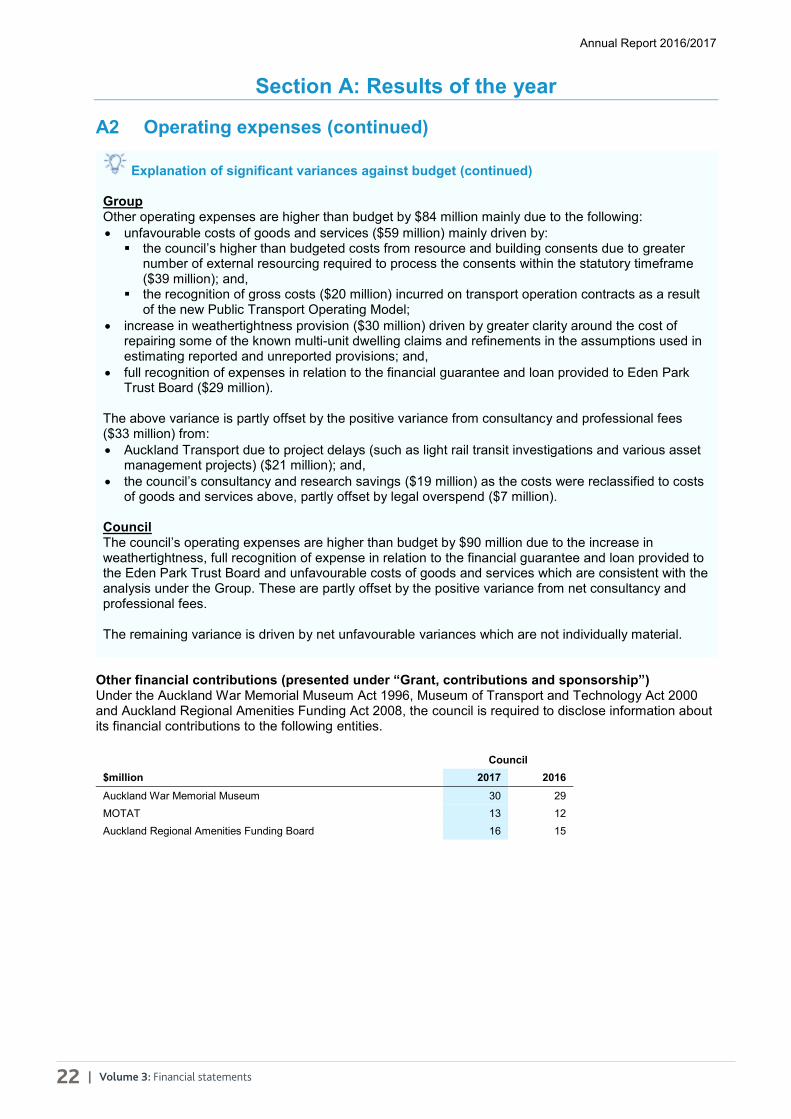
A2 Operating expenses (continued)
Explanation of significant variances against budget (continued) Group Other operating expenses are higher than budget by $84 million mainly due to the following: unfavourable costs of goods and services ($59 million) mainly driven by:
the council’s higher than budgeted costs from resource and building consents due to greater number of external resourcing required to process the consents within the statutory timeframe ($39 million); and,
the recognition of gross costs ($20 million) incurred on transport operation contracts as a result of the new Public Transport Operating Model;
increase in weathertightness provision ($30 million) driven by greater clarity around the cost of repairing some of the known multi-unit dwelling claims and refinements in the assumptions used in estimating reported and unreported provisions; and,
full recognition of expenses in relation to the financial guarantee and loan provided to Eden Park Trust Board ($29 million).
The above variance is partly offset by the positive variance from consultancy and professional fees ($33 million) from: Auckland Transport due to project delays (such as light rail transit investigations and various asset
management projects) ($21 million); and, the council’s consultancy and research savings ($19 million) as the costs were reclassified to costs
of goods and services above, partly offset by legal overspend ($7 million). Council The council’s operating expenses are higher than budget by $90 million due to the increase in weathertightness, full recognition of expense in relation to the financial guarantee and loan provided to the Eden Park Trust Board and unfavourable costs of goods and services which are consistent with the analysis under the Group. These are partly offset by the positive variance from net consultancy and professional fees. The remaining variance is driven by net unfavourable variances which are not individually material.
Other financial contributions (presented under “Grant, contributions and sponsorship”) Under the Auckland War Memorial Museum Act 1996, Museum of Transport and Technology Act 2000 and Auckland Regional Amenities Funding Act 2008, the council is required to disclose information about its financial contributions to the following entities.
Council
$million 2017 2016 Auckland War Memorial Museum 30 29 MOTAT 13 12 Auckland Regional Amenities Funding Board 16 15
Te Rīpoata ā-Tau 2016/2017 o Te Kaunihera
o Tāmaki Makaurau
Pokanga 3: Ngā Pūrongo Pūtea | 23
Annual Report 2016/2017
22
Section A: Results of the year
A2 Operating expenses (continued)
Explanation of significant variances against budget (continued) Group Other operating expenses are higher than budget by $84 million mainly due to the following: unfavourable costs of goods and services ($59 million) mainly driven by:
the council’s higher than budgeted costs from resource and building consents due to greater number of external resourcing required to process the consents within the statutory timeframe ($39 million); and,
the recognition of gross costs ($20 million) incurred on transport operation contracts as a result of the new Public Transport Operating Model;
increase in weathertightness provision ($30 million) driven by greater clarity around the cost of repairing some of the known multi-unit dwelling claims and refinements in the assumptions used in estimating reported and unreported provisions; and,
full recognition of expenses in relation to the financial guarantee and loan provided to Eden Park Trust Board ($29 million).
The above variance is partly offset by the positive variance from consultancy and professional fees ($33 million) from: Auckland Transport due to project delays (such as light rail transit investigations and various asset
management projects) ($21 million); and, the council’s consultancy and research savings ($19 million) as the costs were reclassified to costs
of goods and services above, partly offset by legal overspend ($7 million). Council The council’s operating expenses are higher than budget by $90 million due to the increase in weathertightness, full recognition of expense in relation to the financial guarantee and loan provided to the Eden Park Trust Board and unfavourable costs of goods and services which are consistent with the analysis under the Group. These are partly offset by the positive variance from net consultancy and professional fees. The remaining variance is driven by net unfavourable variances which are not individually material.
Other financial contributions (presented under “Grant, contributions and sponsorship”) Under the Auckland War Memorial Museum Act 1996, Museum of Transport and Technology Act 2000 and Auckland Regional Amenities Funding Act 2008, the council is required to disclose information about its financial contributions to the following entities.
Council
$million 2017 2016 Auckland War Memorial Museum 30 29 MOTAT 13 12 Auckland Regional Amenities Funding Board 16 15
Annual Report 2016/2017
Volume 3: Financial statements 23
Section A: Results of the year
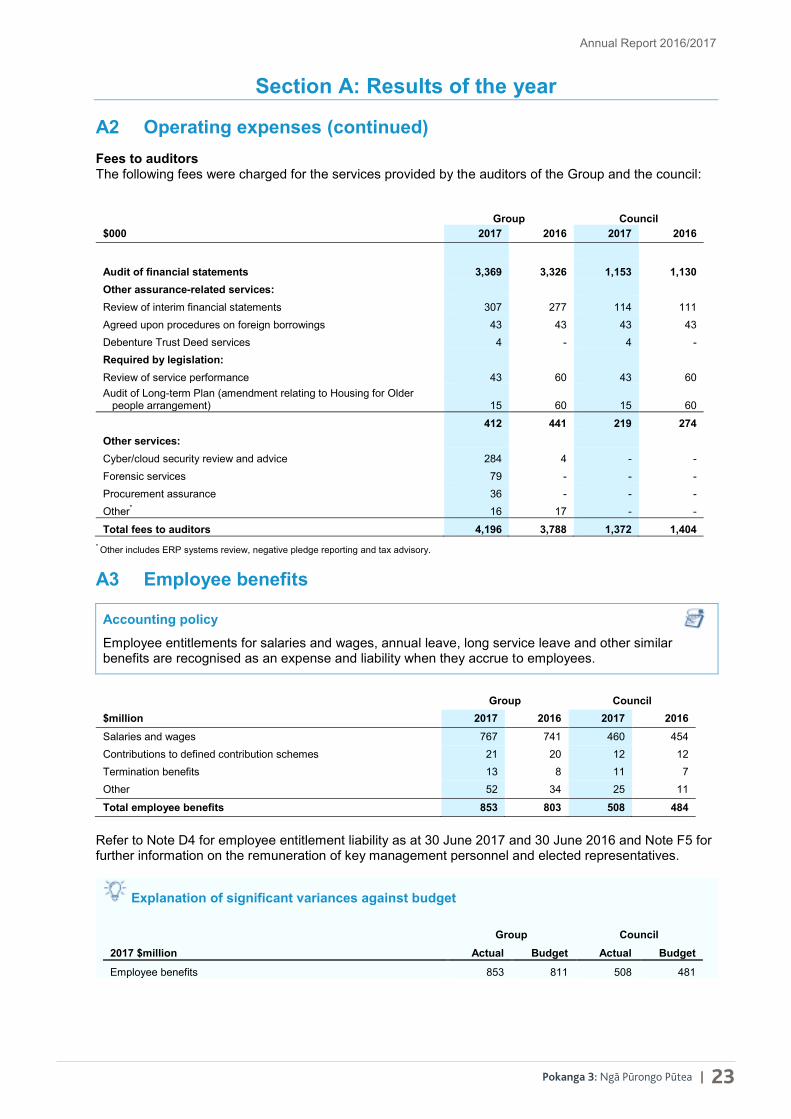
A2 Operating expenses (continued) Fees to auditors The following fees were charged for the services provided by the auditors of the Group and the council:
Group Council
$000 2017 2016 2017 2016
Audit of financial statements 3,369 3,326 1,153 1,130 Other assurance-related services:
Review of interim financial statements 307 277 114 111 Agreed upon procedures on foreign borrowings 43 43 43 43 Debenture Trust Deed services 4 - 4 - Required by legislation:
Review of service performance 43 60 43 60 Audit of Long-term Plan (amendment relating to Housing for Older people arrangement) 15 60 15 60
412 441 219 274
Other services:
Cyber/cloud security review and advice 284 4 - -
Forensic services 79 - - - Procurement assurance 36 - - - Other* 16 17 - -
Total fees to auditors 4,196 3,788 1,372 1,404 * Other includes ERP systems review, negative pledge reporting and tax advisory.
A3 Employee benefits
Accounting policy
Employee entitlements for salaries and wages, annual leave, long service leave and other similar benefits are recognised as an expense and liability when they accrue to employees.
Group Council
$million 2017 2016 2017 2016 Salaries and wages 767 741 460 454 Contributions to defined contribution schemes 21 20 12 12 Termination benefits 13 8 11 7 Other 52 34 25 11
Total employee benefits 853 803 508 484 Refer to Note D4 for employee entitlement liability as at 30 June 2017 and 30 June 2016 and Note F5 for further information on the remuneration of key management personnel and elected representatives.
Explanation of significant variances against budget
Group Council
2017 $million Actual Budget Actual Budget
Employee benefits 853 811 508 481

Auckland Council Annual Report 2016/2017
24 | Volume 3: Financial statements
Annual Report 2016/2017
24
Section A: Results of the year
A3 Employee benefits (continued)
Explanation of significant variances against budget (continued) Group Higher than budgeted employee benefits of $42 million is mainly driven by the following: leave entitlement provision recognised in compliance with the Holidays Act 2003 ($18 million) (refer
to Note D5); unbudgeted redundancy costs ($11 million) in the council as a result of restructuring across various
departments; and, unbudgeted labour costs and annual leave provision at RFA and POAL ($11 million). The remaining variance is driven by net unfavourable Group results which are not individually material. Council Employee benefits are higher than budgeted by $27 million mainly due to the following: leave entitlement provision recognised in compliance with the Holidays Act 2003 ($16 million) (refer
to Note D5); and, unbudgeted redundancy costs ($11 million) as a result of restructuring across various departments.
A4 Depreciation and amortisation
Accounting policy
Depreciation is provided on all property, plant and equipment except for land, works of art and specified cultural heritage assets. Depreciation is calculated to write down the cost or revalued amount of the assets on a straight line basis over their useful economic lives (Note B1).
Amortisation is provided on intangible assets, except rights to acquire, and is calculated to write down the cost of the assets on a straight line basis over their useful economic lives (Note B2).
Local government disclosures Under the Local Government (Financial Reporting and Prudence) Regulations 2014, the council is required to disclose the Group’s depreciation and amortisation by group of activities.
$million 2017 2016 Regional planning 2 2 Waterfront development 9 9 Economic growth and visitor economy 1 1 Regional facilities 27 25 Regulation 2 2 Solid waste and environmental services 4 3 Stormwater management 55 56 Investment 24 24 Organisational support 103 94 Regional community services 20 17 Local community services 1 1 Regional parks, sport and recreation 67 54 Local parks, sport and recreation 1 10 Public transport and travel demand management 75 72 Roads and footpaths 247 235 Parking and enforcement 9 8 Water supply 101 96 Wastewater treatment and disposal 126 119 Total depreciation and amortisation (Notes B1 and B2) 874 828

Te Rīpoata ā-Tau 2016/2017 o Te Kaunihera
o Tāmaki Makaurau
Pokanga 3: Ngā Pūrongo Pūtea | 25
Annual Report 2016/2017
24
Section A: Results of the year
A3 Employee benefits (continued)
Explanation of significant variances against budget (continued) Group Higher than budgeted employee benefits of $42 million is mainly driven by the following: leave entitlement provision recognised in compliance with the Holidays Act 2003 ($18 million) (refer
to Note D5); unbudgeted redundancy costs ($11 million) in the council as a result of restructuring across various
departments; and, unbudgeted labour costs and annual leave provision at RFA and POAL ($11 million). The remaining variance is driven by net unfavourable Group results which are not individually material. Council Employee benefits are higher than budgeted by $27 million mainly due to the following: leave entitlement provision recognised in compliance with the Holidays Act 2003 ($16 million) (refer
to Note D5); and, unbudgeted redundancy costs ($11 million) as a result of restructuring across various departments.
A4 Depreciation and amortisation
Accounting policy
Depreciation is provided on all property, plant and equipment except for land, works of art and specified cultural heritage assets. Depreciation is calculated to write down the cost or revalued amount of the assets on a straight line basis over their useful economic lives (Note B1).
Amortisation is provided on intangible assets, except rights to acquire, and is calculated to write down the cost of the assets on a straight line basis over their useful economic lives (Note B2).
Local government disclosures Under the Local Government (Financial Reporting and Prudence) Regulations 2014, the council is required to disclose the Group’s depreciation and amortisation by group of activities.
$million 2017 2016 Regional planning 2 2 Waterfront development 9 9 Economic growth and visitor economy 1 1 Regional facilities 27 25 Regulation 2 2 Solid waste and environmental services 4 3 Stormwater management 55 56 Investment 24 24 Organisational support 103 94 Regional community services 20 17 Local community services 1 1 Regional parks, sport and recreation 67 54 Local parks, sport and recreation 1 10 Public transport and travel demand management 75 72 Roads and footpaths 247 235 Parking and enforcement 9 8 Water supply 101 96 Wastewater treatment and disposal 126 119 Total depreciation and amortisation (Notes B1 and B2) 874 828
Annual Report 2016/2017
Volume 3: Financial statements 25
Section A: Results of the year
A4 Depreciation and amortisation (continued)
Explanation of significant variances against budget
Group Council
2017 $million Actual Budget Actual Budget
Depreciation and amortisation 874 886 256 256 Group The favourable depreciation variance of $12 million is largely driven by Auckland Transport’s lower than budgeted depreciation rates for intangible assets and capital projects being behind budget.
A5 Finance costs
Accounting policy
Finance costs include interest expense, the unwinding of discounts on provisions and financial assets; and net realised losses on the early close-out of derivatives. Interest expense is recognised using the effective interest rate method. Interest expense includes the amortisation of borrowing costs recognised over the borrowing term.
Group Council
$million 2017 2016 2017 2016 Interest 422 398 364 345 Interest expense on provisions due to change in discount rate (refer Note D5) 36 - 36 -
Interest expense on provisions due to discount unwind (refer Note D5) 8 12 8 12
Net loss on early close-out of swaps 3 5 3 2 Other 2 2 2 1 Total finance costs 471 417 413 360
Refer to Note E2 for information about interest rate risk and interest rate risk management.
Explanation of significant variances against budget
Group Council
2017 $million Actual Budget Actual Budget
Finance costs 471 465 413 415 Group The variance of $6 million is mainly driven by: impact of discount rate changes on weathertightness and contaminated land provisions ($36
million) (refer to Note D5); and offset by favourable variance on interest from borrowings ($28 million) driven by lower average cost of
funding. The remaining variance is driven by net favourable Group results which are not individually material. Council The favourable variance on finance expenses of the council is consistent with the Group due to the impact of discount rate changes with higher favourable variance on borrowing costs.
Auckland Council Annual Report 2016/2017
26 | Volume 3: Financial statements
Annual Report 2016/2017
26
Section A: Results of the year
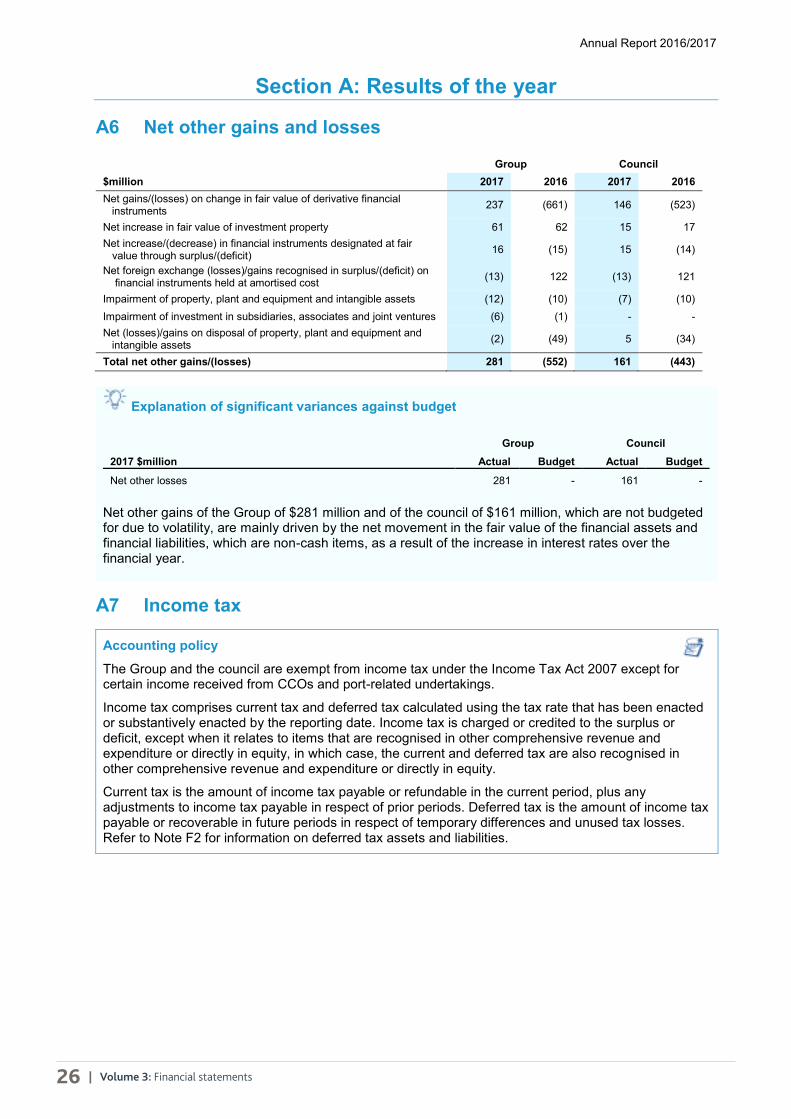
A6 Net other gains and losses
Group Council
$million 2017 2016 2017 2016 Net gains/(losses) on change in fair value of derivative financial instruments 237 (661) 146 (523)
Net increase in fair value of investment property 61 62 15 17 Net increase/(decrease) in financial instruments designated at fair value through surplus/(deficit) 16 (15) 15 (14)
Net foreign exchange (losses)/gains recognised in surplus/(deficit) on financial instruments held at amortised cost (13) 122 (13) 121
Impairment of property, plant and equipment and intangible assets (12) (10) (7) (10) Impairment of investment in subsidiaries, associates and joint ventures (6) (1) - - Net (losses)/gains on disposal of property, plant and equipment and intangible assets (2) (49) 5 (34)
Total net other gains/(losses) 281 (552) 161 (443)
Explanation of significant variances against budget
Group Council
2017 $million Actual Budget Actual Budget
Net other losses 281 - 161 - Net other gains of the Group of $281 million and of the council of $161 million, which are not budgeted for due to volatility, are mainly driven by the net movement in the fair value of the financial assets and financial liabilities, which are non-cash items, as a result of the increase in interest rates over the financial year.
A7 Income tax
Accounting policy
The Group and the council are exempt from income tax under the Income Tax Act 2007 except for certain income received from CCOs and port-related undertakings.
Income tax comprises current tax and deferred tax calculated using the tax rate that has been enacted or substantively enacted by the reporting date. Income tax is charged or credited to the surplus or deficit, except when it relates to items that are recognised in other comprehensive revenue and expenditure or directly in equity, in which case, the current and deferred tax are also recognised in other comprehensive revenue and expenditure or directly in equity.
Current tax is the amount of income tax payable or refundable in the current period, plus any adjustments to income tax payable in respect of prior periods. Deferred tax is the amount of income tax payable or recoverable in future periods in respect of temporary differences and unused tax losses. Refer to Note F2 for information on deferred tax assets and liabilities.

Te Rīpoata ā-Tau 2016/2017 o Te Kaunihera
o Tāmaki Makaurau
Pokanga 3: Ngā Pūrongo Pūtea | 27
Annual Report 2016/2017
26
Section A: Results of the year
A6 Net other gains and losses
Group Council
$million 2017 2016 2017 2016 Net gains/(losses) on change in fair value of derivative financial instruments 237 (661) 146 (523)
Net increase in fair value of investment property 61 62 15 17 Net increase/(decrease) in financial instruments designated at fair value through surplus/(deficit) 16 (15) 15 (14)
Net foreign exchange (losses)/gains recognised in surplus/(deficit) on financial instruments held at amortised cost (13) 122 (13) 121
Impairment of property, plant and equipment and intangible assets (12) (10) (7) (10) Impairment of investment in subsidiaries, associates and joint ventures (6) (1) - - Net (losses)/gains on disposal of property, plant and equipment and intangible assets (2) (49) 5 (34)
Total net other gains/(losses) 281 (552) 161 (443)
Explanation of significant variances against budget
Group Council
2017 $million Actual Budget Actual Budget
Net other losses 281 - 161 - Net other gains of the Group of $281 million and of the council of $161 million, which are not budgeted for due to volatility, are mainly driven by the net movement in the fair value of the financial assets and financial liabilities, which are non-cash items, as a result of the increase in interest rates over the financial year.
A7 Income tax
Accounting policy
The Group and the council are exempt from income tax under the Income Tax Act 2007 except for certain income received from CCOs and port-related undertakings.
Income tax comprises current tax and deferred tax calculated using the tax rate that has been enacted or substantively enacted by the reporting date. Income tax is charged or credited to the surplus or deficit, except when it relates to items that are recognised in other comprehensive revenue and expenditure or directly in equity, in which case, the current and deferred tax are also recognised in other comprehensive revenue and expenditure or directly in equity.
Current tax is the amount of income tax payable or refundable in the current period, plus any adjustments to income tax payable in respect of prior periods. Deferred tax is the amount of income tax payable or recoverable in future periods in respect of temporary differences and unused tax losses. Refer to Note F2 for information on deferred tax assets and liabilities.
Annual Report 2016/2017
Volume 3: Financial statements 27
Section A: Results of the year
A7 Income tax (continued)
Group Council $million 2017 2016 2017 2016 Components of income tax (benefit)/expense Current tax - 6 - - Deferred tax 56 (14) - -
Total income tax (benefit)/expense 56 (8) - -
Relationship between income tax and accounting surplus/(deficit) Net deficit/(surplus) before tax 696 (239) (193) (636) (Deficit)/surplus from non-taxable activities (419) 613 193 636
Taxable surplus 277 374 - - Prima facie income tax at 28% (2016: 28%) 77 105 - - Prior period adjustment 1 - - - Tax effect of permanent differences 33 (91) - - Associates' income net of tax (20) (18) - Loss offset net of group losses utilised 4 9 - - De-recognition of deferred tax assets - 1 - - Tax credits (21) (14) - - Reversal of tax liability for prior year tax loss offsets (16) (9) - - Other adjustments (2) 10 - -
Total income tax expense/(benefit) 56 (8) - - Imputation credit
Group Council $million 2017 2016 2017 2016 Imputation credits available for use in subsequent reporting periods 53 105 - -
A consolidated income tax group was formed from 1 July 2013. Significant entities in the Group are included with the exception of Watercare. The $53 million (2016: $105 million) of imputation credits relates to the consolidated financial group. The total imputation credit available for use by each of the members of the consolidated income tax group is $23 million (2016: $75 million).

Auckland Council Annual Report 2016/2017
28 | Volume 3: Financial statements
Annual Report 2016/2017
28
Section B: Long-term assets
This section provides information about the investments the Group and the council have made in long-term assets to provide services and facilities to the people of Auckland. The long-term assets include physical assets such as infrastructure, land and buildings, parks and reserves and non-physical assets such as computer software.
The notes in this section are as follows:
B1 Property, plant and equipment
B2 Intangible assets
B3 Investment property

Te Rīpoata ā-Tau 2016/2017 o Te Kaunihera
o Tāmaki Makaurau
Pokanga 3: Ngā Pūrongo Pūtea | 29
Annual Report 2016/2017
28
Section B: Long-term assets
This section provides information about the investments the Group and the council have made in long-term assets to provide services and facilities to the people of Auckland. The long-term assets include physical assets such as infrastructure, land and buildings, parks and reserves and non-physical assets such as computer software.
The notes in this section are as follows:
B1 Property, plant and equipment
B2 Intangible assets
B3 Investment property
Annual Report 2016/2017
Volume 3: Financial statements 29
Section B: Long-term assets
B1 Property, plant and equipment
Accounting policy
The property, plant and equipment of the Group and the council are classified into three categories:
Infrastructure assets include land under roads and systems and networks integral to the city’s infrastructure and intended to be maintained indefinitely, even if individual assets or components are replaced or upgraded;
Operational assets include property, plant and equipment used to provide core council services, either for administration, as a community service or as a business activity. Other operational assets include landfills, motor vehicles, office equipment, library books and furniture and fittings; and,
Restricted assets include property and improvement where the use or transfer of title outside of the Group and the council is legally restricted.
Initial recognition and subsequent measurement
Property, plant and equipment is recognised initially at cost, unless acquired through a non-exchange transaction, in which case the asset is recognised at fair value at the date of acquisition. Subsequent costs that extend or expand the asset’s future economic benefits and service potential are capitalised. After initial recognition, certain classes of property, plant and equipment are revalued. Capital work in progress is recognised at cost less impairment and is not depreciated.
Useful lives
The useful lives used to calculate the depreciation of property, plant and equipment are as follows:
Asset class Estimated useful
life (years) Asset class Estimated useful life
(years) Infrastructure Operational (continued) Land Indefinite Marina structures 40-100 Roads 10-120 Rolling stock 2-35 Water and wastewater 3-200 Wharves 2-100 Machinery 3-200 Works of art Indefinite Storm water 10-200 Other operational 1-100 Other infrastructure 10-120 Restricted Operational Parks and reserves Indefinite Land Indefinite Buildings 5-90 Buildings 1-101 Improvements 3-100 Train stations 5-99 Specified and cultural
heritage Indefinite Bus stations and shelters 10-99
Disposals
Gains and losses on disposal of property, plant and equipment are recognised in surplus or deficit. Any amounts included in the asset revaluation reserve in respect of the disposed assets are transferred to accumulated funds.

Auckland Council Annual Report 2016/2017
30 | Volume 3: Financial statements
Ann
ual R
epor
t 201
6/20
17
30
Sect
ion
B: L
ong-
term
ass
ets
B1
Prop
erty
, pla
nt a
nd e
quip
men
t (co
ntin
ued)
O
peni
ng b
alan
ce
Cur
rent
yea
r mov
emen
ts
Clo
sing
bal
ance
Cos
t/ va
luat
ion
Accu
mul
ated
de
prec
iatio
n an
d im
pairm
ent
Car
ryin
g am
ount
Tran
sfer
s fr
om c
apita
l w
ork
in
prog
ress
Ad
ditio
ns
Dep
reci
atio
n (N
ote
A4)
Impa
irmen
t D
ispo
sals
Tr
ansf
ers*
Rev
alua
tions
, ne
t of
accu
mul
ated
de
prec
iatio
n C
ost/
valu
atio
n
Accu
mul
ated
de
prec
iatio
n an
d im
pairm
ent
Car
ryin
g am
ount
G
roup
201
7 $m
illio
n $m
illio
n $m
illio
n $m
illio
n $m
illio
n $m
illio
n $m
illio
n $m
illio
n $m
illio
n $m
illio
n $m
illio
n $m
illio
n $m
illio
n In
fras
truc
ture
Roa
ds
8,49
6 (4
59)
8,03
7 50
1 -
(244
) -
- 3
1,38
5 9,
690
(8)
9,68
2 W
ater
and
was
te
wat
er
7,05
4 (1
50)
6,90
4 23
1 -
(162
) -
(5)
- -
7,27
8 (3
10)
6,96
8 M
achi
nery
97
9 (5
1)
928
48
- (4
8)
- (3
) -
- 1,
023
(98)
92
5 S
torm
wat
er
4,25
3 (4
6)
4,20
7 13
1 -
(47)
-
(1)
- -
4,38
3 (9
3)
4,29
0 La
nd
6,29
9 -
6,29
9 18
9 -
- -
(7)
(9)
- 6,
472
- 6,
472
Wor
k in
pro
gres
s 85
0 -
850
(1,1
04)
1,11
9 -
- -
- -
865
- 86
5 O
ther
3
- 3
4 -
- -
- (2
) -
5 -
5
27
,934
(7
06)
27,2
28
- 1,
119
(501
) -
(16)
(8
) 1,
385
29,7
16
(509
) 29
,207
O
pera
tiona
l
Land
and
build
ings
5,
213
(14)
5,
199
166
- (8
1)
(4)
(45)
(7
5)
- 5,
254
(94)
5,
160
Trai
n st
atio
ns
548
(23)
52
5 14
-
(22)
-
- -
62
579
- 57
9 B
us s
tatio
ns
and
she
lters
68
(9
) 59
21
-
(4)
- -
- 4
80
- 80
M
arin
a st
ruct
ures
13
5 (1
3)
122
- -
(2)
- -
(61)
4
65
(2)
63
Rol
ling
stoc
k 48
7 (3
9)
448
5 -
(15)
-
(2)
- -
490
(54)
43
6 W
harv
es
385
(9)
376
48
- (9
) -
- (8
) -
425
(18)
40
7 W
orks
of a
rt 27
1 -
271
7 -
- -
- 1
13
293
(1)
292
Wor
k in
pro
gres
s 37
9 -
379
(362
) 56
7 -
- -
(150
) -
434
- 43
4 O
ther
87
6 (3
98)
478
101
- (9
4)
- (6
) 53
-
1,01
9 (4
87)
532
8,
362
(505
) 7,
857
- 56
7 (2
27)
(4)
(53)
(2
40)
83
8,63
9 (6
56)
7,98
3 R
estr
icte
d
Par
ks, r
eser
ves
a
nd b
uild
ings
4,
962
- 4,
962
66
- (3
) (1
) (4
) 7
- 5,
030
(3)
5,02
7 Im
prov
emen
ts
1,09
9 (2
26)
873
82
- (5
5)
- -
1 -
1,18
3 (2
82)
901
Spe
cifie
d cu
ltura
l a
nd h
erita
ge
150
- 15
0 -
- -
- -
- -
150
- 15
0 W
ork
in p
rogr
ess
86
- 86
(1
48)
155
- -
- -
- 93
-
93
6,
297
(226
) 6,
071
- 15
5 (5
8)
(1)
(4)
8 -
6,45
6 (2
85)
6,17
1 To
tal g
roup
42
,593
(1
,437
) 41
,156
-
1,84
1 (7
86)
(5)
(73)
(2
40)
1,46
8 44
,811
(1
,450
) 43
,361
*in
clud
es tr
ansf
ers
betw
een
asse
t cla
sses
with
in p
rope
rty, p
lant
and
equ
ipm
ent,
as w
ell a
s be
twee
n pr
oper
ty, p
lant
and
equ
ipm
ent,
inta
ngib
les,
inve
stm
ent p
rope
rty a
nd a
sset
s he
ld-fo
r-sa
le.

Te Rīpoata ā-Tau 2016/2017 o Te Kaunihera
o Tāmaki Makaurau
Pokanga 3: Ngā Pūrongo Pūtea | 31
Ann
ual R
epor
t 201
6/20
17
30
Sect
ion
B: L
ong-
term
ass
ets
B1
Prop
erty
, pla
nt a
nd e
quip
men
t (co
ntin
ued)
O
peni
ng b
alan
ce
Cur
rent
yea
r mov
emen
ts
Clo
sing
bal
ance
Cos
t/ va
luat
ion
Accu
mul
ated
de
prec
iatio
n an
d im
pairm
ent
Car
ryin
g am
ount
Tran
sfer
s fr
om c
apita
l w
ork
in
prog
ress
Ad
ditio
ns
Dep
reci
atio
n (N
ote
A4)
Impa
irmen
t D
ispo
sals
Tr
ansf
ers*
Rev
alua
tions
, ne
t of
accu
mul
ated
de
prec
iatio
n C
ost/
valu
atio
n
Accu
mul
ated
de
prec
iatio
n an
d im
pairm
ent
Car
ryin
g am
ount
G
roup
201
7 $m
illio
n $m
illio
n $m
illio
n $m
illio
n $m
illio
n $m
illio
n $m
illio
n $m
illio
n $m
illio
n $m
illio
n $m
illio
n $m
illio
n $m
illio
n In
fras
truc
ture
Roa
ds
8,49
6 (4
59)
8,03
7 50
1 -
(244
) -
- 3
1,38
5 9,
690
(8)
9,68
2 W
ater
and
was
te
wat
er
7,05
4 (1
50)
6,90
4 23
1 -
(162
) -
(5)
- -
7,27
8 (3
10)
6,96
8 M
achi
nery
97
9 (5
1)
928
48
- (4
8)
- (3
) -
- 1,
023
(98)
92
5 S
torm
wat
er
4,25
3 (4
6)
4,20
7 13
1 -
(47)
-
(1)
- -
4,38
3 (9
3)
4,29
0 La
nd
6,29
9 -
6,29
9 18
9 -
- -
(7)
(9)
- 6,
472
- 6,
472
Wor
k in
pro
gres
s 85
0 -
850
(1,1
04)
1,11
9 -
- -
- -
865
- 86
5 O
ther
3
- 3
4 -
- -
- (2
) -
5 -
5
27
,934
(7
06)
27,2
28
- 1,
119
(501
) -
(16)
(8
) 1,
385
29,7
16
(509
) 29
,207
O
pera
tiona
l
Land
and
build
ings
5,
213
(14)
5,
199
166
- (8
1)
(4)
(45)
(7
5)
- 5,
254
(94)
5,
160
Trai
n st
atio
ns
548
(23)
52
5 14
-
(22)
-
- -
62
579
- 57
9 B
us s
tatio
ns
and
she
lters
68
(9
) 59
21
-
(4)
- -
- 4
80
- 80
M
arin
a st
ruct
ures
13
5 (1
3)
122
- -
(2)
- -
(61)
4
65
(2)
63
Rol
ling
stoc
k 48
7 (3
9)
448
5 -
(15)
-
(2)
- -
490
(54)
43
6 W
harv
es
385
(9)
376
48
- (9
) -
- (8
) -
425
(18)
40
7 W
orks
of a
rt 27
1 -
271
7 -
- -
- 1
13
293
(1)
292
Wor
k in
pro
gres
s 37
9 -
379
(362
) 56
7 -
- -
(150
) -
434
- 43
4 O
ther
87
6 (3
98)
478
101
- (9
4)
- (6
) 53
-
1,01
9 (4
87)
532
8,
362
(505
) 7,
857
- 56
7 (2
27)
(4)
(53)
(2
40)
83
8,63
9 (6
56)
7,98
3 R
estr
icte
d
Par
ks, r
eser
ves
a
nd b
uild
ings
4,
962
- 4,
962
66
- (3
) (1
) (4
) 7
- 5,
030
(3)
5,02
7 Im
prov
emen
ts
1,09
9 (2
26)
873
82
- (5
5)
- -
1 -
1,18
3 (2
82)
901
Spe
cifie
d cu
ltura
l a
nd h
erita
ge
150
- 15
0 -
- -
- -
- -
150
- 15
0 W
ork
in p
rogr
ess
86
- 86
(1
48)
155
- -
- -
- 93
-
93
6,
297
(226
) 6,
071
- 15
5 (5
8)
(1)
(4)
8 -
6,45
6 (2
85)
6,17
1 To
tal g
roup
42
,593
(1
,437
) 41
,156
-
1,84
1 (7
86)
(5)
(73)
(2
40)
1,46
8 44
,811
(1
,450
) 43
,361
*in
clud
es tr
ansf
ers
betw
een
asse
t cla
sses
with
in p
rope
rty, p
lant
and
equ
ipm
ent,
as w
ell a
s be
twee
n pr
oper
ty, p
lant
and
equ
ipm
ent,
inta
ngib
les,
inve
stm
ent p
rope
rty a
nd a
sset
s he
ld-fo
r-sa
le.
Ann
ual R
epor
t 201
6/20
17
Vol
ume
3: F
inan
cial
sta
tem
ents
3
1
Sect
ion
B: L
ong-
term
ass
ets
B1
Prop
erty
, pla
nt a
nd e
quip
men
t (co
ntin
ued)
O
peni
ng b
alan
ce
Cur
rent
yea
r mov
emen
ts
Clo
sing
bal
ance
Cos
t/ va
luat
ion
Accu
mul
ated
de
prec
iatio
n an
d im
pairm
ent
Car
ryin
g am
ount
Tran
sfer
s fr
om c
apita
l w
ork
in
prog
ress
Ad
ditio
ns
Dep
reci
atio
n (N
ote
A4)
Impa
irmen
t D
ispo
sals
Tr
ansf
ers*
Rev
alua
tions
, ne
t of
accu
mul
ated
de
prec
iatio
n C
ost/
valu
atio
n
Accu
mul
ated
de
prec
iatio
n an
d im
pairm
ent
Car
ryin
g am
ount
G
roup
201
6 $m
illio
n $m
illio
n $m
illio
n $m
illio
n $m
illio
n $m
illio
n $m
illio
n $m
illio
n $m
illio
n $m
illio
n $m
illio
n $m
illio
n $m
illio
n In
fras
truc
ture
Roa
ds
8,18
4 (2
24)
7,96
0 30
2 -
(235
) -
- 10
-
8,49
6 (4
59)
8,03
7 W
ater
and
was
te
wat
er
6,87
2 (1
) 6,
871
189
- (1
49)
- (7
) -
- 7,
054
(150
) 6,
904
Mac
hine
ry
945
(1)
944
37
- (4
9)
- (1
) (3
) -
979
(51)
92
8 S
torm
wat
er
4,14
9 -
4,14
9 10
5 -
(45)
-
(2)
- -
4,25
3 (4
6)
4,20
7 La
nd
5,88
9 -
5,88
9 11
4 -
- -
- 29
6 -
6,29
9 -
6,29
9 W
ork
in p
rogr
ess
714
- 71
4 (7
60)
896
- -
- -
- 85
0 -
850
Oth
er
3 -
3 13
-
- -
(2)
(11)
-
3 -
3
26
,756
(2
26)
26,5
30
- 89
6 (4
78)
- (1
2)
292
- 27
,934
(7
06)
27,2
28
Ope
ratio
nal
La
nd a
nd
bu
ildin
gs
4,67
9 (9
3)
4,58
6 15
7 -
(75)
-
(45)
(3
09)
885
5,21
3 (1
4)
5,19
9 Tr
ain
stat
ions
53
2 (4
1)
491
3 -
(22)
-
- 2
51
548
(23)
52
5 B
us s
tatio
ns
and
she
lters
51
(2
) 49
2
- (3
) -
- 11
-
68
(9)
59
Mar
ina
stru
ctur
es
136
(9)
127
3 -
(3)
- -
(5)
- 13
5 (1
3)
122
Rol
ling
stoc
k 43
4 (2
2)
412
54
- (1
7)
- (2
) 1
- 48
7 (3
9)
448
Wha
rves
34
0 -
340
27
- (9
) -
(1)
19
- 38
5 (9
) 37
6 W
orks
of a
rt 26
7 -
267
3 -
- -
(1)
2 -
271
- 27
1 W
ork
in p
rogr
ess
351
- 35
1 (3
48)
376
- -
- -
- 37
9 -
379
Oth
er
826
(333
) 49
3 99
-
(86)
-
(7)
(21)
-
876
(398
) 47
8
7,
616
(500
) 7,
116
- 37
6 (2
15)
- (5
6)
(300
) 93
6 8,
362
(505
) 7,
857
Res
tric
ted
P
arks
, res
erve
s
and
bui
ldin
gs
4,16
2 (2
) 4,
160
115
- (3
) -
- -
690
4,96
2 -
4,96
2 Im
prov
emen
ts
982
(177
) 80
5 11
7 -
(51)
-
- 2
- 1,
099
(226
) 87
3 S
peci
fied
cultu
ral
and
her
itage
15
1 -
151
- -
- -
- (1
) -
150
- 15
0 W
ork
in p
rogr
ess
135
- 13
5 (2
32)
183
- -
- -
- 86
-
86
5,
430
(179
) 5,
251
- 18
3 (5
4)
- -
1 69
0 6,
297
(226
) 6,
071
Tota
l gro
up
39,8
02
(905
) 38
,897
-
1,45
5 (7
47)
- (6
8)
(7)
1,62
6 42
,593
(1
,437
) 41
,156
*in
clud
es tr
ansf
ers
betw
een
asse
t cla
sses
with
in p
rope
rty, p
lant
and
equ
ipm
ent,
as w
ell a
s be
twee
n pr
oper
ty, p
lant
and
equ
ipm
ent,
inta
ngib
les,
inve
stm
ent p
rope
rty a
nd a
sset
s he
ld-fo
r-sa
le.

Auckland Council Annual Report 2016/2017
32 | Volume 3: Financial statements
Ann
ual R
epor
t 201
6/20
17
32
Sec
tion
B: L
ong-
term
ass
ets
B1
Prop
erty
, pla
nt a
nd e
quip
men
t (co
ntin
ued)
O
peni
ng b
alan
ce
Cur
rent
yea
r mov
emen
ts
Clo
sing
bal
ance
Cos
t/ va
luat
ion
Accu
mul
ated
de
prec
iatio
n an
d im
pairm
ent
Car
ryin
g am
ount
Tran
sfer
s fr
om
capi
tal
wor
k in
pr
ogre
ss
Addi
tions
D
epre
ciat
ion
Im
pairm
ent
Dis
posa
ls
Tran
sfer
s*
Rev
alua
tions
, ne
t of
accu
mul
ated
de
prec
iatio
n C
ost/
valu
atio
n
Accu
mul
ated
de
prec
iatio
n an
d im
pairm
ent
Car
ryin
g am
ount
C
ounc
il 20
17
$mill
ion
$mill
ion
$mill
ion
$mill
ion
$mill
ion
$mill
ion
$mill
ion
$mill
ion
$mill
ion
$mill
ion
$mill
ion
$mill
ion
$mill
ion
Infr
astr
uctu
re
S
torm
wat
er
4,24
7 (4
6)
4,20
1 13
1 -
(47)
-
(1)
- -
4,37
7 (9
3)
4,28
4 W
ork
in p
rogr
ess
91
- 91
(1
36)
146
- -
- -
- 10
1 -
101
Oth
er
3 -
3 5
- -
- (5
) 3
- 6
- 6
4,
341
(46)
4,
295
- 14
6 (4
7)
- (6
) 3
- 4,
484
(93)
4,
391
Ope
ratio
nal
La
nd a
nd b
uild
ings
2,
750
(1)
2,74
9 99
27
(4
9)
(1)
(20)
(3
5)
- 2,
819
(49)
2,
770
Wor
ks o
f art
10
- 10
2
1 -
- -
- -
13
- 13
W
ork
in p
rogr
ess
129
- 12
9 (1
38)
179
- -
- -
- 17
0 -
170
Oth
er
380
(217
) 16
3 37
7
(47)
-
(6)
(4)
- 40
9 (2
59)
150
3,
269
(218
) 3,
051
- 21
4 (9
6)
(1)
(26)
(3
9)
- 3,
411
(308
) 3,
103
Res
tric
ted
P
arks
, res
erve
s
and
bui
ldin
gs
4,95
3 -
4,95
3 66
1
(3)
(1)
(4)
9 -
5,02
4 (3
) 5,
021
Impr
ovem
ents
1,
099
(226
) 87
3 82
1
(55)
-
(1)
- -
1,18
2 (2
82)
900
Spe
cifie
d cu
ltura
l a
nd h
erita
ge
151
- 15
1 -
- -
- -
- -
151
- 15
1 W
ork
in p
rogr
ess
87
- 87
(1
48)
154
- -
- -
- 93
-
93
6,
290
(226
) 6,
064
- 15
6 (5
8)
(1)
(5)
9 -
6,45
0 (2
85)
6,16
5 To
tal c
ounc
il
13,9
00
(490
) 13
,410
-
516
(201
) (2
) (3
7)
(27)
-
14,3
45
(686
) 13
,659
*in
clud
es tr
ansf
ers
betw
een
asse
t cla
sses
with
in p
rope
rty, p
lant
and
equ
ipm
ent,
as w
ell a
s be
twee
n pr
oper
ty, p
lant
and
equ
ipm
ent,
inta
ngib
les,
inve
stm
ent p
rope
rty a
nd a
sset
s he
ld-fo
r-sa
le.

Te Rīpoata ā-Tau 2016/2017 o Te Kaunihera
o Tāmaki Makaurau
Pokanga 3: Ngā Pūrongo Pūtea | 33
Ann
ual R
epor
t 201
6/20
17
32
Sec
tion
B: L
ong-
term
ass
ets
B1
Prop
erty
, pla
nt a
nd e
quip
men
t (co
ntin
ued)
O
peni
ng b
alan
ce
Cur
rent
yea
r mov
emen
ts
Clo
sing
bal
ance
Cos
t/ va
luat
ion
Accu
mul
ated
de
prec
iatio
n an
d im
pairm
ent
Car
ryin
g am
ount
Tran
sfer
s fr
om
capi
tal
wor
k in
pr
ogre
ss
Addi
tions
D
epre
ciat
ion
Im
pairm
ent
Dis
posa
ls
Tran
sfer
s*
Rev
alua
tions
, ne
t of
accu
mul
ated
de
prec
iatio
n C
ost/
valu
atio
n
Accu
mul
ated
de
prec
iatio
n an
d im
pairm
ent
Car
ryin
g am
ount
C
ounc
il 20
17
$mill
ion
$mill
ion
$mill
ion
$mill
ion
$mill
ion
$mill
ion
$mill
ion
$mill
ion
$mill
ion
$mill
ion
$mill
ion
$mill
ion
$mill
ion
Infr
astr
uctu
re
S
torm
wat
er
4,24
7 (4
6)
4,20
1 13
1 -
(47)
-
(1)
- -
4,37
7 (9
3)
4,28
4 W
ork
in p
rogr
ess
91
- 91
(1
36)
146
- -
- -
- 10
1 -
101
Oth
er
3 -
3 5
- -
- (5
) 3
- 6
- 6
4,
341
(46)
4,
295
- 14
6 (4
7)
- (6
) 3
- 4,
484
(93)
4,
391
Ope
ratio
nal
La
nd a
nd b
uild
ings
2,
750
(1)
2,74
9 99
27
(4
9)
(1)
(20)
(3
5)
- 2,
819
(49)
2,
770
Wor
ks o
f art
10
- 10
2
1 -
- -
- -
13
- 13
W
ork
in p
rogr
ess
129
- 12
9 (1
38)
179
- -
- -
- 17
0 -
170
Oth
er
380
(217
) 16
3 37
7
(47)
-
(6)
(4)
- 40
9 (2
59)
150
3,
269
(218
) 3,
051
- 21
4 (9
6)
(1)
(26)
(3
9)
- 3,
411
(308
) 3,
103
Res
tric
ted
P
arks
, res
erve
s
and
bui
ldin
gs
4,95
3 -
4,95
3 66
1
(3)
(1)
(4)
9 -
5,02
4 (3
) 5,
021
Impr
ovem
ents
1,
099
(226
) 87
3 82
1
(55)
-
(1)
- -
1,18
2 (2
82)
900
Spe
cifie
d cu
ltura
l a
nd h
erita
ge
151
- 15
1 -
- -
- -
- -
151
- 15
1 W
ork
in p
rogr
ess
87
- 87
(1
48)
154
- -
- -
- 93
-
93
6,
290
(226
) 6,
064
- 15
6 (5
8)
(1)
(5)
9 -
6,45
0 (2
85)
6,16
5 To
tal c
ounc
il
13,9
00
(490
) 13
,410
-
516
(201
) (2
) (3
7)
(27)
-
14,3
45
(686
) 13
,659
*in
clud
es tr
ansf
ers
betw
een
asse
t cla
sses
with
in p
rope
rty, p
lant
and
equ
ipm
ent,
as w
ell a
s be
twee
n pr
oper
ty, p
lant
and
equ
ipm
ent,
inta
ngib
les,
inve
stm
ent p
rope
rty a
nd a
sset
s he
ld-fo
r-sa
le.
Ann
ual R
epor
t 201
6/20
17
Vol
ume
3: F
inan
cial
sta
tem
ents
3
3
Sect
ion
B: L
ong-
term
ass
ets
B1
Prop
erty
, pla
nt a
nd e
quip
men
t (co
ntin
ued)
O
peni
ng b
alan
ce
Cur
rent
yea
r mov
emen
ts
Clo
sing
bal
ance
Cos
t/ va
luat
ion
Accu
mul
ated
de
prec
iatio
n an
d im
pairm
ent
Car
ryin
g am
ount
Tran
sfer
s fr
om
capi
tal
wor
k in
pr
ogre
ss
Addi
tions
D
epre
ciat
ion
Im
pairm
ent
Dis
posa
ls
Tran
sfer
s*
Rev
alua
tions
, ne
t of
accu
mul
ated
de
prec
iatio
n C
ost/
valu
atio
n
Accu
mul
ated
de
prec
iatio
n an
d im
pairm
ent
Car
ryin
g am
ount
C
ounc
il 20
16
$mill
ion
$mill
ion
$mill
ion
$mill
ion
$mill
ion
$mill
ion
$mill
ion
$mill
ion
$mill
ion
$mill
ion
$mill
ion
$mill
ion
$mill
ion
Infr
astr
uctu
re
S
torm
wat
er
4,14
4 -
4,14
4 10
5 -
(46)
-
(2)
- -
4,24
7 (4
6)
4,20
1 W
ork
in p
rogr
ess
90
- 90
(1
18)
119
- -
- -
- 91
-
91
Oth
er
4 (1
) 3
13
- -
- (2
) (1
1)
- 3
- 3
4,
238
(1)
4,23
7 -
119
(46)
-
(4)
(11)
-
4,34
1 (4
6)
4,29
5 O
pera
tiona
l
Land
and
bui
ldin
gs
2,30
8 (4
5)
2,26
3 10
1 -
(46)
-
(43)
8
466
2,75
0 (1
) 2,
749
Wor
ks o
f art
6 -
6 2
- -
- -
2 -
10
- 10
W
ork
in p
rogr
ess
160
- 16
0 (1
54)
123
- -
- -
- 12
9 -
129
Oth
er
336
(180
) 15
6 51
-
(39)
-
(7)
2 -
380
(217
) 16
3
2,
810
(225
) 2,
585
- 12
3 (8
5)
- (5
0)
12
466
3,26
9 (2
18)
3,05
1 R
estr
icte
d
Par
ks, r
eser
ves
a
nd b
uild
ings
4,
153
(2)
4,15
1 11
5 -
(3)
- (5
) 5
690
4,95
3 -
4,95
3 Im
prov
emen
ts
982
(177
) 80
5 11
7 -
(51)
-
- 2
- 1,
099
(226
) 87
3 S
peci
fied
cultu
ral
and
her
itage
15
1 -
151
- -
- -
- -
- 15
1 -
151
Wor
k in
pro
gres
s 13
5 -
135
(232
) 18
4 -
- -
- -
87
- 87
5,
421
(179
) 5,
242
- 18
4 (5
4)
- (5
) 7
690
6,29
0 (2
26)
6,06
4 To
tal c
ounc
il
12,4
69
(405
) 12
,064
-
426
(185
) -
(59)
8
1,15
6 13
,900
(4
90)
13,4
10
*incl
udes
tran
sfer
s be
twee
n as
set c
lass
es w
ithin
pro
perty
, pla
nt a
nd e
quip
men
t, as
wel
l as
betw
een
prop
erty
, pla
nt a
nd e
quip
men
t, in
tang
ible
s, in
vest
men
t pro
perty
and
ass
ets
held
-for-
sale
.

Auckland Council Annual Report 2016/2017
34 | Volume 3: Financial statements
Ann
ual R
epor
t 201
6/20
17
34
Sect
ion
B: L
ong-
term
ass
ets
B1
Prop
erty
, pla
nt a
nd e
quip
men
t (co
ntin
ued)
Wor
k in
pro
gres
s by
ass
et c
lass
Infr
astr
uctu
re
O
pera
tiona
l
Res
tric
ted
$mill
ion
Roa
ds
Wat
er a
nd
was
tew
ater
St
orm
wat
er
La
nd a
nd
build
ings
Tr
ain
stat
ions
R
ollin
g st
ock
Wha
rves
W
orks
of
art
Oth
ers
Park
s,
rese
rves
an
d bu
ildin
gs
Impr
ovem
ents
To
tal
Gro
up
2017
30
9
455
10
1
129
15
0
1
3
3
14
8
12
8
1
1,
392
2016
34
5
412
93
119
18
7
3
4
3
63
6
80
1,31
5
Cou
ncil
2017
-
-
101
102
-
-
-
4
64
12
8
1
364
2016
-
-
91
83
-
-
-
3
43
6
81
30
7
Rev
alua
tion
Acc
ount
ing
polic
y
Infra
stru
ctur
e as
sets
(exc
ept l
and)
, res
trict
ed a
sset
s (e
xcep
t im
prov
emen
ts a
nd s
peci
fied
cultu
ral a
nd h
erita
ge a
sset
s) a
nd o
pera
tiona
l ass
ets
(exc
ept o
ther
ope
ratio
nal a
sset
s)
are
reva
lued
with
suf
ficie
nt re
gula
rity,
and
at l
east
eve
ry th
ree
year
s to
ens
ure
that
thei
r car
ryin
g am
ount
s do
not
diff
er m
ater
ially
from
fair
valu
e. T
he c
arry
ing
valu
es o
f re
valu
ed a
sset
s ar
e as
sess
ed a
nnua
lly to
ens
ure
that
they
do
not d
iffer
mat
eria
lly fr
om th
e as
sets
’ fai
r val
ues.
If th
ere
is a
mat
eria
l diff
eren
ce, t
hen
the
off-c
ycle
ass
et c
lass
es
are
reva
lued
. Rev
alua
tions
are
acc
ount
ed fo
r on
an a
sset
cla
ss b
asis
.
Net
reva
luat
ion
gain
s ar
e re
cogn
ised
in o
ther
com
preh
ensi
ve re
venu
e an
d ex
pend
iture
and
are
acc
umul
ated
to th
e as
set r
eval
uatio
n re
serv
e in
equ
ity fo
r tha
t cla
ss o
f ass
et.
Rev
alua
tion
loss
that
resu
lts in
a d
ebit
bala
nce
in th
e as
set r
eval
uatio
n re
serv
e is
reco
gnis
ed in
sur
plus
or d
efic
it. A
ny s
ubse
quen
t gai
n on
reva
luat
ion
is re
cogn
ised
firs
t in
the
surp
lus
or d
efic
it up
to th
e am
ount
pre
viou
sly
expe
nsed
and
then
reco
gnis
ed in
oth
er c
ompr
ehen
sive
reve
nue
and
expe
nditu
re.

Te Rīpoata ā-Tau 2016/2017 o Te Kaunihera
o Tāmaki Makaurau
Pokanga 3: Ngā Pūrongo Pūtea | 35
Ann
ual R
epor
t 201
6/20
17
34
Sect
ion
B: L
ong-
term
ass
ets
B1
Prop
erty
, pla
nt a
nd e
quip
men
t (co
ntin
ued)
Wor
k in
pro
gres
s by
ass
et c
lass
Infr
astr
uctu
re
O
pera
tiona
l
Res
tric
ted
$mill
ion
Roa
ds
Wat
er a
nd
was
tew
ater
St
orm
wat
er
La
nd a
nd
build
ings
Tr
ain
stat
ions
R
ollin
g st
ock
Wha
rves
W
orks
of
art
Oth
ers
Park
s,
rese
rves
an
d bu
ildin
gs
Impr
ovem
ents
To
tal
Gro
up
2017
30
9
455
10
1
129
15
0
1
3
3
14
8
12
8
1
1,
392
2016
34
5
412
93
119
18
7
3
4
3
63
6
80
1,31
5
Cou
ncil
2017
-
-
101
102
-
-
-
4
64
12
8
1
364
2016
-
-
91
83
-
-
-
3
43
6
81
30
7
Rev
alua
tion
Acc
ount
ing
polic
y
Infra
stru
ctur
e as
sets
(exc
ept l
and)
, res
trict
ed a
sset
s (e
xcep
t im
prov
emen
ts a
nd s
peci
fied
cultu
ral a
nd h
erita
ge a
sset
s) a
nd o
pera
tiona
l ass
ets
(exc
ept o
ther
ope
ratio
nal a
sset
s)
are
reva
lued
with
suf
ficie
nt re
gula
rity,
and
at l
east
eve
ry th
ree
year
s to
ens
ure
that
thei
r car
ryin
g am
ount
s do
not
diff
er m
ater
ially
from
fair
valu
e. T
he c
arry
ing
valu
es o
f re
valu
ed a
sset
s ar
e as
sess
ed a
nnua
lly to
ens
ure
that
they
do
not d
iffer
mat
eria
lly fr
om th
e as
sets
’ fai
r val
ues.
If th
ere
is a
mat
eria
l diff
eren
ce, t
hen
the
off-c
ycle
ass
et c
lass
es
are
reva
lued
. Rev
alua
tions
are
acc
ount
ed fo
r on
an a
sset
cla
ss b
asis
.
Net
reva
luat
ion
gain
s ar
e re
cogn
ised
in o
ther
com
preh
ensi
ve re
venu
e an
d ex
pend
iture
and
are
acc
umul
ated
to th
e as
set r
eval
uatio
n re
serv
e in
equ
ity fo
r tha
t cla
ss o
f ass
et.
Rev
alua
tion
loss
that
resu
lts in
a d
ebit
bala
nce
in th
e as
set r
eval
uatio
n re
serv
e is
reco
gnis
ed in
sur
plus
or d
efic
it. A
ny s
ubse
quen
t gai
n on
reva
luat
ion
is re
cogn
ised
firs
t in
the
surp
lus
or d
efic
it up
to th
e am
ount
pre
viou
sly
expe
nsed
and
then
reco
gnis
ed in
oth
er c
ompr
ehen
sive
reve
nue
and
expe
nditu
re.
Ann
ual R
epor
t 201
6/20
17
Vol
ume
3: F
inan
cial
sta
tem
ents
3
5
Sect
ion
B: L
ong-
term
ass
ets
B1
Prop
erty
, pla
nt a
nd e
quip
men
t (co
ntin
ued)
Sign
ifica
nt ju
dgem
ents
and
est
imat
es
The
met
hod
used
by
the
Gro
up a
nd th
e co
unci
l in
reva
luin
g its
pro
perty
, pla
nt a
nd e
quip
men
t, ou
tline
d be
low
, is
depr
ecia
ted
repl
acem
ent c
ost (
DR
C),
exce
pt fo
r ope
ratio
nal l
and
and
build
ings
and
wor
ks o
f art.
DR
C is
cal
cula
ted
base
d on
the
repl
acem
ent c
ost o
f the
pro
perty
, pla
nt a
nd e
quip
men
t dep
reci
ated
ove
r the
ir us
eful
live
s. T
his
met
hod
take
s in
to a
ccou
nt th
e ag
e an
d co
nditi
on
of th
e as
sets
, est
imat
ed o
ptim
isat
ion
rate
s an
d es
timat
ed re
mai
ning
use
ful l
ives
of t
hose
ass
ets.
The
reva
luat
ion
proc
ess
invo
lves
phy
sica
l ins
pect
ion
of s
elec
ted
asse
ts a
t va
rious
site
s to
not
e as
pect
s su
ch a
s co
nditi
on, u
tilis
atio
n, re
plac
emen
t tim
ing
and
asse
t opt
imis
atio
n.
It is
ass
umed
that
all
asse
t cla
sses
hav
e a
zero
resi
dual
val
ue a
t the
end
of t
heir
usef
ul li
ves.
Ope
ratio
nal l
and
and
build
ings
and
wor
ks o
f art
are
reva
lued
bas
ed o
n av
aila
ble
mar
ket i
nfor
mat
ion
rela
ting
to th
ese
asse
ts.
Asse
t cla
ss
Last
reva
lued
da
te
Asse
t rev
alua
tion
rese
rve
Net
cha
nge
for t
he
perio
d In
depe
nden
t val
uer a
nd k
ey a
ssum
ptio
ns
(in $
mill
ion)
(in
$ m
illio
n)
Gro
up
Cou
ncil
2017
20
16
2017
20
16
Gro
up
Cou
ncil
Infr
astr
uctu
re
Wat
er a
nd
was
tew
ater
30
Jun
e 20
15
655
65
7
- -
(2)
- In
depe
nden
t val
uer:
Bec
a P
roje
cts
NZ
Ltd.
Th
e m
achi
nery
of t
he G
roup
is c
ompo
sed
of e
ngin
es a
nd tu
rbin
es in
stal
led
at th
e w
ater
and
was
tew
ater
pu
mp
stat
ions
. The
se a
re re
valu
ed to
geth
er w
ith th
e w
ater
and
was
tew
ater
ass
ets.
The
key
ass
umpt
ions
us
ed fo
r bot
h cl
asse
s ar
e:
• con
stru
ctio
n co
sts
dete
rmin
ed w
ith re
fere
nce
to re
cent
con
stru
ctio
n co
ntra
cts
and
the
unit
rate
s re
flect
the
c
osts
of r
epla
cing
ass
ets
• use
ful l
ives
of a
sset
s ca
lcul
ated
as
the
less
er o
f the
ir ph
ysic
al li
fe o
r the
poi
nt w
here
the
asse
t is
to b
e r
epla
ced
for e
cono
mic
reas
ons.
Con
ditio
n in
form
atio
n an
d ag
e ar
e ta
ken
into
acc
ount
• t
he c
apita
l goo
ds p
rice
inde
x (C
GP
I) w
hich
has
bee
n us
ed w
here
inde
xatio
n is
app
ropr
iate
. CG
PI r
ate
rep
rese
nt e
stim
ated
sta
ndar
d re
plac
emen
t cos
ts fo
r ass
et c
ompo
nent
s in
acc
orda
nce
with
the
mod
ern
equ
ival
ent a
sset
(ME
A) a
ppro
ach.
At t
he ti
me
of v
alua
tion
the
CG
PI w
as a
vaila
ble
to th
e M
arch
201
5 q
uarte
r ext
rapo
late
d to
Jun
e 20
15.
Mac
hine
ry
30 J
une
2015
86
87
-
- (1
) -
Sto
rmw
ater
30
Jun
e 20
15
715
71
5
711
71
1
- -
Inde
pend
ent v
alue
r: G
HD
Ltd
who
per
form
ed a
pee
r-re
view
of i
n-ho
use
valu
atio
n.
Key
ass
umpt
ions
: • U
nit r
ates
for r
epla
cem
ent h
ave
been
app
lied
to th
e as
sets
bas
ed o
n si
ze, m
ater
ial,
dept
h an
d lo
catio
n.
Uni
t rat
es h
ave
been
der
ived
from
sto
rmw
ater
phy
sica
l wor
ks c
ontra
ct c
osts
. Th
ese
are
then
inde
xed
usi
ng S
tatis
tics
NZ
Cap
ital G
oods
Pric
e In
dex
for c
ivil
cons
truct
ions
to c
onve
rt th
em to
cur
rent
dol
lar v
alue
. • C
ondi
tion
info
rmat
ion
and
age
have
bee
n us
ed to
det
erm
ine
rem
aini
ng u
sefu
l liv
es.

Auckland Council Annual Report 2016/2017
36 | Volume 3: Financial statements
Ann
ual R
epor
t 201
6/20
17
36
Sec
tion
B: L
ong-
term
ass
ets
B1
Prop
erty
, pla
nt a
nd e
quip
men
t (co
ntin
ued)
As
set c
lass
La
st re
valu
ed
date
Asse
t rev
alua
tion
rese
rve
Net
cha
nge
for t
he
perio
d In
depe
nden
t val
uer a
nd k
ey a
ssum
ptio
ns
(in $
mill
ion)
(in
$ m
illio
n)
Gro
up
Cou
ncil
2017
20
16
2017
20
16
Gro
up
Cou
ncil
Infr
astr
uctu
re
R
oads
30
Jun
e 20
17
3,01
0
1,62
5
- -
1,38
5
- In
depe
nden
t val
uer:
AN
A G
roup
Ltd
. K
ey a
ssum
ptio
ns:
• Uni
t rat
e fo
r roa
d co
nstru
ctio
n ba
sed
on th
e m
ost c
urre
nt c
ontra
cted
rate
s ap
plic
able
to th
e G
roup
. Whe
re
the
re is
no
curre
nt c
ontra
cted
uni
t rat
e in
form
atio
n av
aila
ble,
the
mos
t rec
ent r
ates
are
use
d in
dexe
d
for
the
impa
ct o
f inf
latio
n. T
he u
nit r
ate
appl
ied
to th
e pa
vem
ent d
epth
s ha
s ch
ange
d fro
m 3
50 m
illim
etre
s (
mm
) in
2014
to 6
00m
m in
201
7.
• Rem
aini
ng u
sefu
l life
of t
he a
sset
con
side
ring
the
age,
con
ditio
n in
form
atio
n he
ld o
n th
ese
asse
ts a
nd th
e a
sset
’s fu
ture
ser
vice
pot
entia
l. Th
ese
assu
mpt
ions
can
be
affe
cted
by
loca
l con
ditio
ns s
uch
as g
roun
d t
ype,
wea
ther
pat
tern
s an
d ro
ad u
sage
.
Ope
ratio
nal
Land
and
bu
ildin
gs
30 J
une
2016
1,
391
1,
414
78
7
794
(2
3)
(7)
Inde
pend
ent v
alue
rs: B
ayle
ys V
alua
tion
Ltd,
Bec
a P
roje
cts
NZ
Ltd,
Quo
tabl
e V
alue
Ltd
, Jon
es L
ang
LaS
alle
Lt
d an
d S
eage
r and
Par
tner
s K
ey a
ssum
ptio
ns:
• Mar
ket v
alue
bas
ed o
n re
cent
equ
ival
ent s
ales
info
rmat
ion
• DR
C is
use
d w
here
no
mar
ket e
xist
s fo
r ope
ratio
nal b
uild
ings
with
allo
wan
ce fo
r age
and
con
ditio
n of
b
uild
ing,
and
con
figur
atio
n.
Trai
n st
atio
ns
30 J
une
2017
27
3
211
-
- 62
-
Inde
pend
ent v
alue
r: O
pus
Inte
rnat
iona
l Con
sulta
nts
Ltd.
K
ey a
ssum
ptio
ns:
• Opt
imis
ed re
plac
emen
t cos
t to
the
exte
nt th
at o
ptim
isat
ion
can
occu
r in
the
norm
al c
ours
e of
bus
ines
s u
sing
com
mer
cial
ly a
vaila
ble
tech
nolo
gy
• Ass
ets
with
unl
imite
d en
gine
erin
g liv
es a
re a
djus
ted
to h
ave
a ty
pica
l use
ful l
ife o
f 60
year
s or
less
r
efle
ctin
g th
e ra
te o
f cha
nge
and
obso
lesc
ence
in th
e en
viro
nmen
t for
eac
h el
emen
tal v
alue
.
Bus
sta
tions
an
d sh
elte
rs
30 J
une
2017
14
10
-
- 4
-
Inde
pend
ent v
alue
r: A
NA
Gro
up L
td.
Key
ass
umpt
ions
: • O
ptim
ised
repl
acem
ent c
ost t
o th
e ex
tent
that
opt
imis
atio
n ca
n oc
cur i
n th
e no
rmal
cou
rse
of b
usin
ess
usi
ng c
omm
erci
ally
ava
ilabl
e te
chno
logy
• R
emai
ning
use
ful l
ife o
f the
ass
et b
ased
on
the
age,
con
ditio
n an
d th
e as
set’s
futu
re s
ervi
ce p
oten
tial.
Mar
ina
stru
ctur
es
30 J
une
2017
30
26
-
- 4
-
Inde
pend
ent v
alue
rs: S
eaga
r & P
artn
ers
Key
ass
umpt
ions
: • D
isco
unte
d ca
sh fl
ow c
alcu
latio
n us
ing
mar
ket e
stim
ates
of t
he c
ash
flow
abl
e to
be
gene
rate
d by
the
asse
t di
scou
nted
at a
mar
ket b
ased
rate
of r
etur
n.

Te Rīpoata ā-Tau 2016/2017 o Te Kaunihera
o Tāmaki Makaurau
Pokanga 3: Ngā Pūrongo Pūtea | 37
Ann
ual R
epor
t 201
6/20
17
36
Sec
tion
B: L
ong-
term
ass
ets
B1
Prop
erty
, pla
nt a
nd e
quip
men
t (co
ntin
ued)
As
set c
lass
La
st re
valu
ed
date
Asse
t rev
alua
tion
rese
rve
Net
cha
nge
for t
he
perio
d In
depe
nden
t val
uer a
nd k
ey a
ssum
ptio
ns
(in $
mill
ion)
(in
$ m
illio
n)
Gro
up
Cou
ncil
2017
20
16
2017
20
16
Gro
up
Cou
ncil
Infr
astr
uctu
re
R
oads
30
Jun
e 20
17
3,01
0
1,62
5
- -
1,38
5
- In
depe
nden
t val
uer:
AN
A G
roup
Ltd
. K
ey a
ssum
ptio
ns:
• Uni
t rat
e fo
r roa
d co
nstru
ctio
n ba
sed
on th
e m
ost c
urre
nt c
ontra
cted
rate
s ap
plic
able
to th
e G
roup
. Whe
re
the
re is
no
curre
nt c
ontra
cted
uni
t rat
e in
form
atio
n av
aila
ble,
the
mos
t rec
ent r
ates
are
use
d in
dexe
d
for
the
impa
ct o
f inf
latio
n. T
he u
nit r
ate
appl
ied
to th
e pa
vem
ent d
epth
s ha
s ch
ange
d fro
m 3
50 m
illim
etre
s (
mm
) in
2014
to 6
00m
m in
201
7.
• Rem
aini
ng u
sefu
l life
of t
he a
sset
con
side
ring
the
age,
con
ditio
n in
form
atio
n he
ld o
n th
ese
asse
ts a
nd th
e a
sset
’s fu
ture
ser
vice
pot
entia
l. Th
ese
assu
mpt
ions
can
be
affe
cted
by
loca
l con
ditio
ns s
uch
as g
roun
d t
ype,
wea
ther
pat
tern
s an
d ro
ad u
sage
.
Ope
ratio
nal
Land
and
bu
ildin
gs
30 J
une
2016
1,
391
1,
414
78
7
794
(2
3)
(7)
Inde
pend
ent v
alue
rs: B
ayle
ys V
alua
tion
Ltd,
Bec
a P
roje
cts
NZ
Ltd,
Quo
tabl
e V
alue
Ltd
, Jon
es L
ang
LaS
alle
Lt
d an
d S
eage
r and
Par
tner
s K
ey a
ssum
ptio
ns:
• Mar
ket v
alue
bas
ed o
n re
cent
equ
ival
ent s
ales
info
rmat
ion
• DR
C is
use
d w
here
no
mar
ket e
xist
s fo
r ope
ratio
nal b
uild
ings
with
allo
wan
ce fo
r age
and
con
ditio
n of
b
uild
ing,
and
con
figur
atio
n.
Trai
n st
atio
ns
30 J
une
2017
27
3
211
-
- 62
-
Inde
pend
ent v
alue
r: O
pus
Inte
rnat
iona
l Con
sulta
nts
Ltd.
K
ey a
ssum
ptio
ns:
• Opt
imis
ed re
plac
emen
t cos
t to
the
exte
nt th
at o
ptim
isat
ion
can
occu
r in
the
norm
al c
ours
e of
bus
ines
s u
sing
com
mer
cial
ly a
vaila
ble
tech
nolo
gy
• Ass
ets
with
unl
imite
d en
gine
erin
g liv
es a
re a
djus
ted
to h
ave
a ty
pica
l use
ful l
ife o
f 60
year
s or
less
r
efle
ctin
g th
e ra
te o
f cha
nge
and
obso
lesc
ence
in th
e en
viro
nmen
t for
eac
h el
emen
tal v
alue
.
Bus
sta
tions
an
d sh
elte
rs
30 J
une
2017
14
10
-
- 4
-
Inde
pend
ent v
alue
r: A
NA
Gro
up L
td.
Key
ass
umpt
ions
: • O
ptim
ised
repl
acem
ent c
ost t
o th
e ex
tent
that
opt
imis
atio
n ca
n oc
cur i
n th
e no
rmal
cou
rse
of b
usin
ess
usi
ng c
omm
erci
ally
ava
ilabl
e te
chno
logy
• R
emai
ning
use
ful l
ife o
f the
ass
et b
ased
on
the
age,
con
ditio
n an
d th
e as
set’s
futu
re s
ervi
ce p
oten
tial.
Mar
ina
stru
ctur
es
30 J
une
2017
30
26
-
- 4
-
Inde
pend
ent v
alue
rs: S
eaga
r & P
artn
ers
Key
ass
umpt
ions
: • D
isco
unte
d ca
sh fl
ow c
alcu
latio
n us
ing
mar
ket e
stim
ates
of t
he c
ash
flow
abl
e to
be
gene
rate
d by
the
asse
t di
scou
nted
at a
mar
ket b
ased
rate
of r
etur
n.
Ann
ual R
epor
t 201
6/20
17
Vol
ume
3: F
inan
cial
sta
tem
ents
3
7
Sect
ion
B: L
ong-
term
ass
ets
B1
Prop
erty
, pla
nt a
nd e
quip
men
t (co
ntin
ued)
As
set c
lass
La
st re
valu
ed
date
Asse
t rev
alua
tion
rese
rve
Net
cha
nge
for t
he
perio
d In
depe
nden
t val
uer a
nd k
ey a
ssum
ptio
ns
(in $
mill
ion)
(in
$ m
illio
n)
Gro
up
Cou
ncil
2017
20
16
2017
20
16
Gro
up
Cou
ncil
Ope
ratio
nal
Rol
ling
stoc
k
n/a
n/
a
n/a
n/
a
n/a
n/
a
n/a
Th
e ro
lling
sto
ck o
f the
Gro
up p
erta
ins
to th
e ne
wly
acq
uire
d el
ectri
c m
ultip
le u
nits
(EM
U) w
hich
will
be
reva
lued
in 2
018.
Wha
rves
30
Jun
e 20
15
70
70
- -
- -
Inde
pend
ent v
alue
r: O
pus
Inte
rnat
iona
l Con
sulta
nts
Ltd,
Bec
a P
roje
cts
NZ
Ltd,
Jon
es L
ang
Lasa
lle L
td a
nd
NA
I Har
cour
ts V
alua
tions
. K
ey a
ssum
ptio
ns:
• Opt
imis
ed re
plac
emen
t cos
t to
the
exte
nt th
at o
ptim
isat
ion
can
occu
r in
the
norm
al c
ours
e of
bus
ines
s u
sing
com
mer
cial
ly a
vaila
ble
tech
nolo
gy
• Use
ful l
ives
are
est
imat
ed a
t 100
yea
rs o
r les
s at
an
elem
ent l
evel
, ref
lect
ing
the
mar
ine
envi
ronm
ent,
rate
o
f cha
nge
and
obso
lesc
ence
, loa
ding
s an
d th
e pr
edom
inan
ce o
f con
cret
e an
d st
eel s
truct
ural
ele
men
ts.
Wor
ks o
f art
30 J
une
2017
19
6
-
- 13
-
Inde
pend
ent v
alue
r: S
othe
by's
(Lon
don)
and
Mos
sgre
en-W
ebb’
s (A
uckl
and)
K
ey a
ssum
ptio
ns:
• The
fair
valu
es o
f artw
orks
are
det
erm
ined
by
refe
renc
e to
obs
erva
ble
pric
es in
an
activ
e m
arke
t and
rece
nt
trans
actio
ns o
n ar
m's
-leng
th te
rms,
with
rega
rds
to c
ondi
tion.
Res
tric
ted
Par
ks,
rese
rves
and
bu
ildin
gs
30 J
une
2016
1,
282
1,
282
1,
282
1,
282
-
- In
depe
nden
t val
uer:
Quo
tabl
e V
alue
Ltd
. K
ey a
ssum
ptio
ns:
• Lar
ge re
serv
es a
re v
alue
d ba
sed
on a
rura
l lan
d va
lue
plus
loca
tiona
l adj
ustm
ent t
aken
into
con
side
ratio
n a
ctiv
e/pa
ssiv
e zo
ne d
iffer
entia
ls w
hich
are
bas
ed o
n th
e va
luer
s' p
rofe
ssio
nal e
xper
tise
and
judg
emen
ts
• Bui
ldin
gs a
re b
ased
on
DR
C d
eter
min
ed w
ith re
fere
nce
to re
cent
con
stru
ctio
n co
ntra
cts
and
rece
nt c
ostin
g o
btai
ned
from
con
stru
ctio
n de
tails
and
Pro
perty
Inst
itute
of N
ew Z
eala
nd’s
cos
t inf
orm
atio
n.
Tota
l
7,54
5
6,10
3
2,78
0
2,78
7
1,44
2
(7)
N
et c
hang
e fo
r the
per
iod
on W
ater
and
was
tew
ater
, Mac
hine
ry a
nd O
pera
tiona
l lan
d an
d bu
ildin
gs p
erta
ins
to tr
ansf
er to
acc
umul
ated
fund
s dr
iven
by
the
dere
cogn
ition
of a
sset
s.
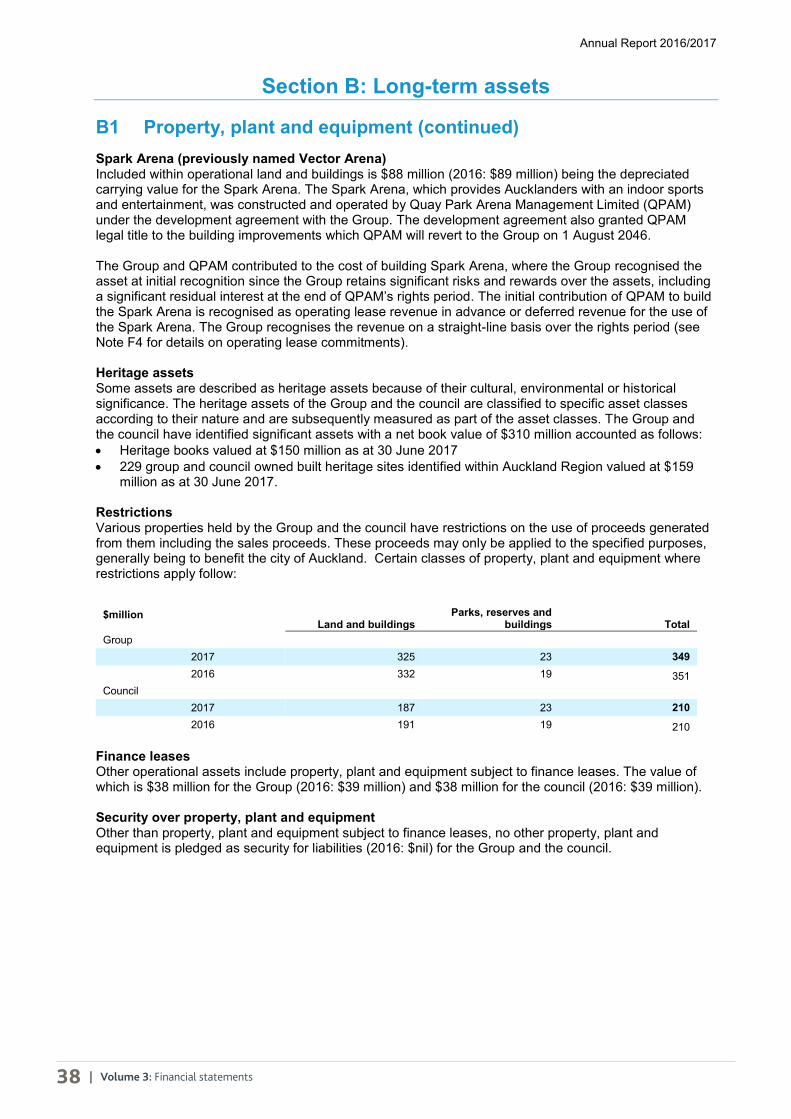
Auckland Council Annual Report 2016/2017
38 | Volume 3: Financial statements
Annual Report 2016/2017
38
Section B: Long-term assets
B1 Property, plant and equipment (continued) Spark Arena (previously named Vector Arena) Included within operational land and buildings is $88 million (2016: $89 million) being the depreciated carrying value for the Spark Arena. The Spark Arena, which provides Aucklanders with an indoor sports and entertainment, was constructed and operated by Quay Park Arena Management Limited (QPAM) under the development agreement with the Group. The development agreement also granted QPAM legal title to the building improvements which QPAM will revert to the Group on 1 August 2046. The Group and QPAM contributed to the cost of building Spark Arena, where the Group recognised the asset at initial recognition since the Group retains significant risks and rewards over the assets, including a significant residual interest at the end of QPAM’s rights period. The initial contribution of QPAM to build the Spark Arena is recognised as operating lease revenue in advance or deferred revenue for the use of the Spark Arena. The Group recognises the revenue on a straight-line basis over the rights period (see Note F4 for details on operating lease commitments). Heritage assets Some assets are described as heritage assets because of their cultural, environmental or historical significance. The heritage assets of the Group and the council are classified to specific asset classes according to their nature and are subsequently measured as part of the asset classes. The Group and the council have identified significant assets with a net book value of $310 million accounted as follows: Heritage books valued at $150 million as at 30 June 2017 229 group and council owned built heritage sites identified within Auckland Region valued at $159
million as at 30 June 2017. Restrictions Various properties held by the Group and the council have restrictions on the use of proceeds generated from them including the sales proceeds. These proceeds may only be applied to the specified purposes, generally being to benefit the city of Auckland. Certain classes of property, plant and equipment where restrictions apply follow:
$million Land and buildings Parks, reserves and
buildings Total Group
2017 325 23 349 2016 332 19 351
Council 2017 187 23 210
2016 191 19 210 Finance leases Other operational assets include property, plant and equipment subject to finance leases. The value of which is $38 million for the Group (2016: $39 million) and $38 million for the council (2016: $39 million). Security over property, plant and equipment Other than property, plant and equipment subject to finance leases, no other property, plant and equipment is pledged as security for liabilities (2016: $nil) for the Group and the council.

Te Rīpoata ā-Tau 2016/2017 o Te Kaunihera
o Tāmaki Makaurau
Pokanga 3: Ngā Pūrongo Pūtea | 39
Annual Report 2016/2017
38
Section B: Long-term assets
B1 Property, plant and equipment (continued) Spark Arena (previously named Vector Arena) Included within operational land and buildings is $88 million (2016: $89 million) being the depreciated carrying value for the Spark Arena. The Spark Arena, which provides Aucklanders with an indoor sports and entertainment, was constructed and operated by Quay Park Arena Management Limited (QPAM) under the development agreement with the Group. The development agreement also granted QPAM legal title to the building improvements which QPAM will revert to the Group on 1 August 2046. The Group and QPAM contributed to the cost of building Spark Arena, where the Group recognised the asset at initial recognition since the Group retains significant risks and rewards over the assets, including a significant residual interest at the end of QPAM’s rights period. The initial contribution of QPAM to build the Spark Arena is recognised as operating lease revenue in advance or deferred revenue for the use of the Spark Arena. The Group recognises the revenue on a straight-line basis over the rights period (see Note F4 for details on operating lease commitments). Heritage assets Some assets are described as heritage assets because of their cultural, environmental or historical significance. The heritage assets of the Group and the council are classified to specific asset classes according to their nature and are subsequently measured as part of the asset classes. The Group and the council have identified significant assets with a net book value of $310 million accounted as follows: Heritage books valued at $150 million as at 30 June 2017 229 group and council owned built heritage sites identified within Auckland Region valued at $159
million as at 30 June 2017. Restrictions Various properties held by the Group and the council have restrictions on the use of proceeds generated from them including the sales proceeds. These proceeds may only be applied to the specified purposes, generally being to benefit the city of Auckland. Certain classes of property, plant and equipment where restrictions apply follow:
$million Land and buildings Parks, reserves and
buildings Total Group
2017 325 23 349 2016 332 19 351
Council 2017 187 23 210
2016 191 19 210 Finance leases Other operational assets include property, plant and equipment subject to finance leases. The value of which is $38 million for the Group (2016: $39 million) and $38 million for the council (2016: $39 million). Security over property, plant and equipment Other than property, plant and equipment subject to finance leases, no other property, plant and equipment is pledged as security for liabilities (2016: $nil) for the Group and the council.
Annual Report 2016/2017
Volume 3: Financial statements 39
Section B: Long-term assets
B1 Property, plant and equipment (continued) Service concession assets For definition of service concession arrangement and assets, please see Glossary on page 113. The Group’s service concession assets are infrastructure assets owned by Watercare and operated by Veolia Water Services (ANZ) Pty Limited (Veolia) for the provision of water and wastewater services in the Papakura district. The franchise agreement stipulates the services Veolia must provide, to whom it must provide them and regulates the price. Veolia is responsible for upgrading and maintaining the entire network in Papakura so that at the end of the contract period (initial term of 30 years ending on 30 June 2027 with a 20-year right of renewal), the network shall be in a better overall condition than that which existed at the time the contract was commenced in 1997. The Group retains ownership of the assets and the assets will be returned for use by the Group after the contract expires. A one-off fee of $13 million was received at the commencement of the agreement that covers the right to use the assets for a 50-year period and is recognized as revenue evenly over the term of the agreement. Revenue received in advance as at 30 June 2017 is $8 million ($8 million as at 30 June 2016). Where the Group recognises an asset for the upgrades made by Veolia to the existing service concession assets and, where material, the Group also recognises a liability at the same amount as the asset. The liability so recognised is reduced over the remaining period of the service concession arrangement. The carrying value of service concession asset under water and wastewater asset class amounted to $161 million as at 30 June 2017 ($157 million as at 30 June 2016). No new service concession arrangements were entered into by the Group and council in 2017 and 2016. Housing for older people (HfOP) Included within operational land and buildings is $288 million of HfOP portfolio which pertains to the council’s social housing stock used to provide social rental housing primarily for older people in Auckland. The council has entered into an agreement with Haumaru Housing Limited Partnership (Haumaru) effective 1 July 2017 wherein Haumaru has agreed to manage the HfOP portfolio in accordance with the property management and tenancy management requirements referred to in the agreement. Haumaru, on behalf of the council will provide rental services to the elderly tenants and manage improvements and renewals to the HfOP portfolio.

Auckland Council Annual Report 2016/2017
40 | Volume 3: Financial statements
Annual Report 2016/2017
40
Section B: Long-term assets
B1 Property, plant and equipment (continued)
Local government disclosures Core assets Under the Local Government (Financial Reporting and Prudence) Regulations 2014, the council is required to disclose information about the Group’s core assets.
Included within the infrastructure assets are the following core assets:
$million
Water supply
treatment plants
and facilities
Water supply
other assets
Sewerage treatment
plants and facilities
Sewerage other assets
Storm water drainage
Flood protection and control works
Roads and footpaths
2017 Assets constructed 28 57 86 102 74 9 429
Assets transferred - 22 6 35 62 2 18 Closing book value 877 2,683 942 3,391 4,229 61 9,682 Estimated replacement cost 1,435 4,725 1,427 6,276 5,579 91 14,331
2016 Assets constructed 15 111 99 53 74 14 318
Assets transferred - 9 - 22 31 - 37 Closing book value 888 2,581 945 3,418 4,158 49 8,037 Estimated replacement cost 1,406 4,494 1,355 6,162 5,445 80 8,456
Insurance of assets Under the LGA 2002, the council is required to disclose the following information on insurance of the Group’s assets as at 30 June 2017:
$million Book value
Insured value
Replacement value of self-
insured assets
Commentary
Roads 9,682 - 14,331 Uninsured. However, subject to meeting defined criteria, the cost associated with the immediate response, reopening and/or restoration of these assets as a result of a short natural event such as earthquake, tsunami, could be subsidised by the New Zealand Transport Agency.
Water & wastewater & machinery
7,893 3,200 4,251 Above ground infrastructure such as water and wastewater pump stations are insured to a value of $3.2 billion with a maximum coverage of $200 million per event. For below-ground infrastructure, currently central government funds 60% of the cost of replacing water & wastewater networks damaged in a natural disaster. No provision is made for the self-insured portion (40%) of the replacement cost. Subsequent to year end, the Group obtained insurance cover for the 40% self-insured portion.
Stormwater 4,290 5,511 - Above ground and below ground infrastructure including pump stations are insured. For below-ground infrastructure, currently central government funds 60% of the cost of replacing stormwater networks damaged in a natural disaster. The Group and the council have a maximum coverage of $100 million per event and in aggregate in the period of insurance.
Buildings, wharves, and other above-ground structures
6,729 7,438 - For any natural disaster the Group has a maximum coverage of $500 million per event and in aggregate in the period of insurance.
Rolling stock 436 427 9 Insurance is for entire network and includes the electric trains. The Group has a maximum coverage of $100 million per event.
Land 14,232 - 14,232 All land (including restricted land) held by the Group and the council is not insured due to low risk of loss.
Total 43,262 16,576 32,823
A fund for the purpose of self-insurance is not maintained by the Group or the council.

Te Rīpoata ā-Tau 2016/2017 o Te Kaunihera
o Tāmaki Makaurau
Pokanga 3: Ngā Pūrongo Pūtea | 41
Annual Report 2016/2017
40
Section B: Long-term assets
B1 Property, plant and equipment (continued)
Local government disclosures Core assets Under the Local Government (Financial Reporting and Prudence) Regulations 2014, the council is required to disclose information about the Group’s core assets.
Included within the infrastructure assets are the following core assets:
$million
Water supply
treatment plants
and facilities
Water supply
other assets
Sewerage treatment
plants and facilities
Sewerage other assets
Storm water drainage
Flood protection and control works
Roads and footpaths
2017 Assets constructed 28 57 86 102 74 9 429
Assets transferred - 22 6 35 62 2 18 Closing book value 877 2,683 942 3,391 4,229 61 9,682 Estimated replacement cost 1,435 4,725 1,427 6,276 5,579 91 14,331
2016 Assets constructed 15 111 99 53 74 14 318
Assets transferred - 9 - 22 31 - 37 Closing book value 888 2,581 945 3,418 4,158 49 8,037 Estimated replacement cost 1,406 4,494 1,355 6,162 5,445 80 8,456
Insurance of assets Under the LGA 2002, the council is required to disclose the following information on insurance of the Group’s assets as at 30 June 2017:
$million Book value
Insured value
Replacement value of self-
insured assets
Commentary
Roads 9,682 - 14,331 Uninsured. However, subject to meeting defined criteria, the cost associated with the immediate response, reopening and/or restoration of these assets as a result of a short natural event such as earthquake, tsunami, could be subsidised by the New Zealand Transport Agency.
Water & wastewater & machinery
7,893 3,200 4,251 Above ground infrastructure such as water and wastewater pump stations are insured to a value of $3.2 billion with a maximum coverage of $200 million per event. For below-ground infrastructure, currently central government funds 60% of the cost of replacing water & wastewater networks damaged in a natural disaster. No provision is made for the self-insured portion (40%) of the replacement cost. Subsequent to year end, the Group obtained insurance cover for the 40% self-insured portion.
Stormwater 4,290 5,511 - Above ground and below ground infrastructure including pump stations are insured. For below-ground infrastructure, currently central government funds 60% of the cost of replacing stormwater networks damaged in a natural disaster. The Group and the council have a maximum coverage of $100 million per event and in aggregate in the period of insurance.
Buildings, wharves, and other above-ground structures
6,729 7,438 - For any natural disaster the Group has a maximum coverage of $500 million per event and in aggregate in the period of insurance.
Rolling stock 436 427 9 Insurance is for entire network and includes the electric trains. The Group has a maximum coverage of $100 million per event.
Land 14,232 - 14,232 All land (including restricted land) held by the Group and the council is not insured due to low risk of loss.
Total 43,262 16,576 32,823
A fund for the purpose of self-insurance is not maintained by the Group or the council.
Ann
ual R
epor
t 201
6/20
17
Vol
ume
3: F
inan
cial
sta
tem
ents
4
1
Sect
ion
B: L
ong-
term
ass
ets
B2
Inta
ngib
le a
sset
s
Acc
ount
ing
polic
y
Initi
al re
cogn
ition
and
sub
sequ
ent m
easu
rem
ent
Purc
hase
d in
tang
ible
ass
ets
are
initi
ally
reco
gnis
ed a
t cos
t. Fo
r int
erna
lly g
ener
ated
inta
ngib
le a
sset
s, th
e co
st in
clud
es d
irect
em
ploy
ee c
osts
, a re
ason
able
por
tion
of
over
head
and
oth
er d
irect
cos
ts th
at a
re in
curr
ed w
ithin
the
deve
lopm
ent p
hase
of t
he a
sset
onl
y. In
tang
ible
ass
ets
acqu
ired
at n
o co
st a
re in
itial
ly re
cogn
ised
at f
air v
alue
w
here
that
can
be
relia
bly
mea
sure
d. A
fter i
nitia
l rec
ogni
tion,
inta
ngib
le a
sset
s ar
e ca
rrie
d at
cos
t les
s an
y ac
cum
ulat
ed a
mor
tisat
ion
and
accu
mul
ated
impa
irmen
t los
ses.
Use
ful l
ives
Th
e us
eful
live
s us
ed to
cal
cula
te th
e am
ortis
atio
n of
inta
ngib
le a
sset
s ar
e as
follo
ws:
Cla
ss o
f int
angi
ble
asse
t Es
timat
ed u
sefu
l life
C
ompu
ter s
oftw
are
1-15
yea
rs
Inte
llect
ual p
rope
rty
4-35
yea
rs
Oth
er in
tang
ible
ass
ets
1-63
yea
rs
Dis
posa
ls
R
ealis
ed g
ains
and
loss
es fr
om th
e di
spos
al o
f int
angi
ble
asse
ts a
re re
cogn
ised
in s
urpl
us o
r def
icit.
Ope
ning
bal
ance
C
urre
nt y
ear m
ovem
ents
C
losi
ng b
alan
ce
C
ost/
valu
atio
n Ac
cum
ulat
ed
amor
tisat
ion
Car
ryin
g am
ount
Tran
sfer
s fr
om
wor
k in
pr
ogre
ss
Inte
rnal
ly
deve
lope
d Ac
quis
ition
Am
ortis
atio
n (N
ote
A4)
Impa
irmen
t los
s ch
arge
d to
su
rplu
s or
de
ficit/
w
rite-
offs
Dis
posa
ls
Tran
sfer
* C
ost/
valu
atio
n Ac
cum
ulat
ed
amor
tisat
ion
Car
ryin
g am
ount
Gro
up 2
017
$mill
ion
$mill
ion
$mill
ion
$mill
ion
$mill
ion
$mill
ion
$mill
ion
$mill
ion
$mill
ion
$mill
ion
$mill
ion
$mill
ion
$mill
ion
Com
pute
r sof
twar
e 56
2 (2
64)
298
107
- -
(77)
-
(3)
(1)
656
(332
) 32
4 R
ight
s to
acq
uire
11
-
11
- -
- -
- -
(1)
10
- 10
In
telle
ctua
l pro
perty
65
(4
1)
24
12
- -
(8)
- -
1 78
(4
9)
29
Oth
er
87
(17)
70
3
- -
(3)
- -
1 90
(1
9)
71
Wor
k in
pro
gres
s 75
-
75
(122
) 28
96
-
- -
- 77
-
77
Tota
l gro
up
800
(322
) 47
8 -
28
96
(88)
-
(3)
- 91
1 (4
00)
511
Gro
up 2
016
C
ompu
ter s
oftw
are
394
(194
) 20
0 16
9 -
- (6
8)
- (3
) -
562
(264
) 29
8 R
ight
s to
acq
uire
11
-
11
1 -
- -
- -
(1)
11
- 11
In
telle
ctua
l pro
perty
56
(3
8)
18
16
- -
(10)
-
- -
65
(41)
24
O
ther
85
(1
9)
66
7 -
- (3
) -
- -
87
(17)
70
W
ork
in p
rogr
ess
174
- 17
4 (1
93)
33
71
- (1
0)
- -
75
- 75
To
tal g
roup
72
0 (2
51)
469
- 33
71
(8
1)
(10)
(3
) (1
) 80
0 (3
22)
478
* Incl
udes
tran
sfer
s be
twee
n as
set c
lass
es w
ithin
inta
ngib
les,
as
wel
l as
betw
een
inta
ngib
les
and
prop
erty
, pla
nt a
nd e
quip
men
t.
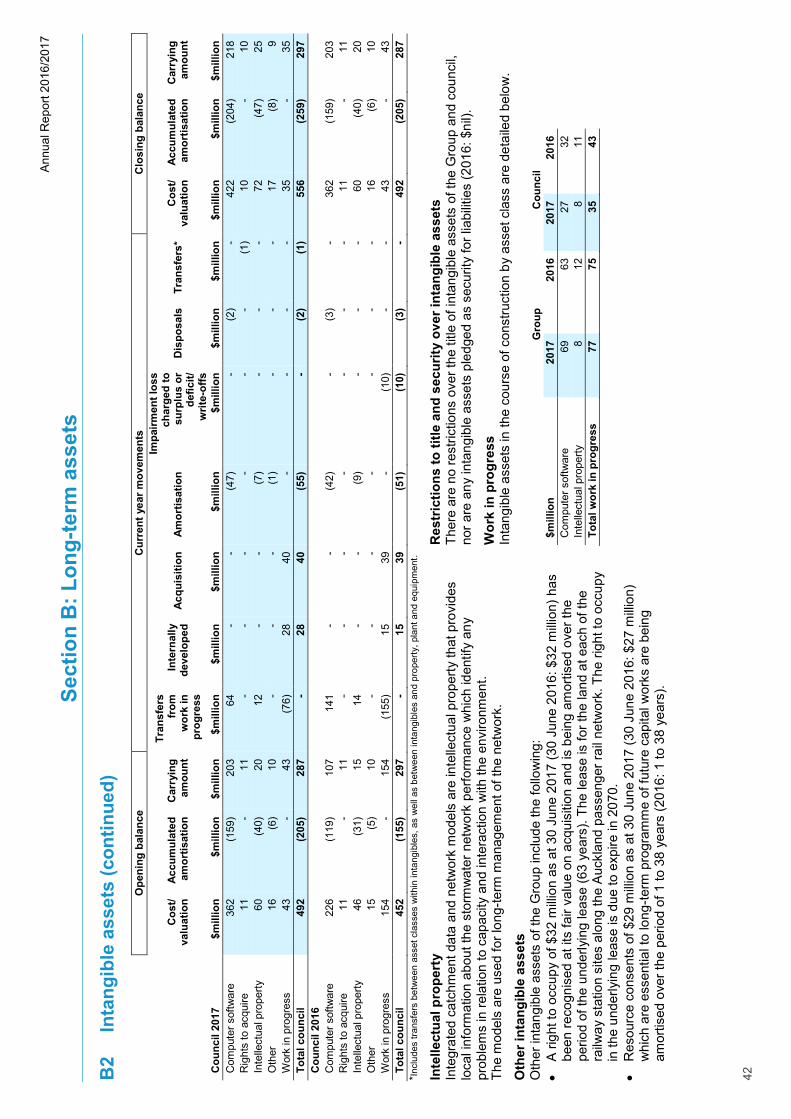
Auckland Council Annual Report 2016/2017
42 | Volume 3: Financial statements
Ann
ual R
epor
t 201
6/20
17
42
Sect
ion
B: L
ong-
term
ass
ets
B2
Inta
ngib
le a
sset
s (c
ontin
ued)
O
peni
ng b
alan
ce
Cur
rent
yea
r mov
emen
ts
Clo
sing
bal
ance
C
ost/
valu
atio
n Ac
cum
ulat
ed
amor
tisat
ion
Car
ryin
g am
ount
Tran
sfer
s fr
om
wor
k in
pr
ogre
ss
Inte
rnal
ly
deve
lope
d Ac
quis
ition
Am
ortis
atio
n
Impa
irmen
t los
s ch
arge
d to
su
rplu
s or
de
ficit/
w
rite-
offs
Dis
posa
ls
Tran
sfer
s*
Cos
t/ va
luat
ion
Accu
mul
ated
am
ortis
atio
n C
arry
ing
amou
nt
Cou
ncil
2017
$m
illio
n $m
illio
n $m
illio
n $m
illio
n $m
illio
n $m
illio
n $m
illio
n $m
illio
n $m
illio
n $m
illio
n $m
illio
n $m
illio
n $m
illio
n C
ompu
ter s
oftw
are
362
(159
) 20
3 64
-
- (4
7)
- (2
) -
422
(204
) 21
8 R
ight
s to
acq
uire
11
-
11
- -
- -
- -
(1)
10
- 10
In
telle
ctua
l pro
perty
60
(4
0)
20
12
- -
(7)
- -
- 72
(4
7)
25
Oth
er
16
(6)
10
- -
- (1
) -
- -
17
(8)
9 W
ork
in p
rogr
ess
43
- 43
(7
6)
28
40
- -
- -
35
- 35
To
tal c
ounc
il
492
(205
) 28
7 -
28
40
(55)
-
(2)
(1)
556
(259
) 29
7 C
ounc
il 20
16
C
ompu
ter s
oftw
are
226
(119
) 10
7 14
1 -
- (4
2)
- (3
) -
362
(159
) 20
3 R
ight
s to
acq
uire
11
-
11
- -
- -
- -
- 11
-
11
Inte
llect
ual p
rope
rty
46
(31)
15
14
-
- (9
) -
- -
60
(40)
20
O
ther
15
(5
) 10
-
- -
- -
- -
16
(6)
10
Wor
k in
pro
gres
s 15
4 -
154
(155
) 15
39
-
(10)
-
- 43
-
43
Tota
l cou
ncil
45
2 (1
55)
297
- 15
39
(5
1)
(10)
(3
) -
492
(205
) 28
7 *In
clud
es tr
ansf
ers
betw
een
asse
t cla
sses
with
in in
tang
ible
s, a
s w
ell a
s be
twee
n in
tang
ible
s an
d pr
oper
ty, p
lant
and
equ
ipm
ent.
Inte
llect
ual p
rope
rty
Inte
grat
ed c
atch
men
t dat
a an
d ne
twor
k m
odel
s ar
e in
telle
ctua
l pro
perty
that
pro
vide
s lo
cal i
nfor
mat
ion
abou
t the
sto
rmw
ater
net
wor
k pe
rform
ance
whi
ch id
entif
y an
y pr
oble
ms
in re
latio
n to
cap
acity
and
inte
ract
ion
with
the
envi
ronm
ent.
Th
e m
odel
s ar
e us
ed fo
r lon
g-te
rm m
anag
emen
t of t
he n
etw
ork.
Oth
er in
tang
ible
ass
ets
O
ther
inta
ngib
le a
sset
s of
the
Gro
up in
clud
e th
e fo
llow
ing:
A rig
ht to
occ
upy
of $
32 m
illion
as
at 3
0 Ju
ne 2
017
(30
June
201
6: $
32 m
illion
) has
be
en re
cogn
ised
at i
ts fa
ir va
lue
on a
cqui
sitio
n an
d is
bei
ng a
mor
tised
ove
r the
pe
riod
of th
e un
derly
ing
leas
e (6
3 ye
ars)
. The
leas
e is
for t
he la
nd a
t eac
h of
the
railw
ay s
tatio
n si
tes
alon
g th
e A
uckl
and
pass
enge
r rai
l net
wor
k. T
he ri
ght t
o oc
cupy
in
the
unde
rlyin
g le
ase
is d
ue to
exp
ire in
207
0.
R
esou
rce
cons
ents
of $
29 m
illion
as
at 3
0 Ju
ne 2
017
(30
June
201
6: $
27 m
illion
) w
hich
are
ess
entia
l to
long
-term
pro
gram
me
of fu
ture
cap
ital w
orks
are
bei
ng
amor
tised
ove
r the
per
iod
of 1
to 3
8 ye
ars
(201
6 : 1
to 3
8 ye
ars)
.
Res
tric
tions
to ti
tle a
nd s
ecur
ity o
ver i
ntan
gibl
e as
sets
Th
ere
are
no re
stric
tions
ove
r the
title
of i
ntan
gibl
e as
sets
of t
he G
roup
and
cou
ncil,
no
r are
any
inta
ngib
le a
sset
s pl
edge
d as
sec
urity
for l
iabi
litie
s (2
016:
$ni
l).
Wor
k in
pro
gres
s In
tang
ible
ass
ets
in th
e co
urse
of c
onst
ruct
ion
by a
sset
cla
ss a
re d
etai
led
belo
w.
G
roup
C
ounc
il $m
illio
n 20
17
2016
20
17
2016
C
ompu
ter s
oftw
are
69
63
27
32
Inte
llect
ual p
rope
rty
8 12
8
11
Tota
l wor
k in
pro
gres
s 77
75
35
43

Te Rīpoata ā-Tau 2016/2017 o Te Kaunihera
o Tāmaki Makaurau
Pokanga 3: Ngā Pūrongo Pūtea | 43
Ann
ual R
epor
t 201
6/20
17
42
Sect
ion
B: L
ong-
term
ass
ets
B2
Inta
ngib
le a
sset
s (c
ontin
ued)
O
peni
ng b
alan
ce
Cur
rent
yea
r mov
emen
ts
Clo
sing
bal
ance
C
ost/
valu
atio
n Ac
cum
ulat
ed
amor
tisat
ion
Car
ryin
g am
ount
Tran
sfer
s fr
om
wor
k in
pr
ogre
ss
Inte
rnal
ly
deve
lope
d Ac
quis
ition
Am
ortis
atio
n
Impa
irmen
t los
s ch
arge
d to
su
rplu
s or
de
ficit/
w
rite-
offs
Dis
posa
ls
Tran
sfer
s*
Cos
t/ va
luat
ion
Accu
mul
ated
am
ortis
atio
n C
arry
ing
amou
nt
Cou
ncil
2017
$m
illio
n $m
illio
n $m
illio
n $m
illio
n $m
illio
n $m
illio
n $m
illio
n $m
illio
n $m
illio
n $m
illio
n $m
illio
n $m
illio
n $m
illio
n C
ompu
ter s
oftw
are
362
(159
) 20
3 64
-
- (4
7)
- (2
) -
422
(204
) 21
8 R
ight
s to
acq
uire
11
-
11
- -
- -
- -
(1)
10
- 10
In
telle
ctua
l pro
perty
60
(4
0)
20
12
- -
(7)
- -
- 72
(4
7)
25
Oth
er
16
(6)
10
- -
- (1
) -
- -
17
(8)
9 W
ork
in p
rogr
ess
43
- 43
(7
6)
28
40
- -
- -
35
- 35
To
tal c
ounc
il
492
(205
) 28
7 -
28
40
(55)
-
(2)
(1)
556
(259
) 29
7 C
ounc
il 20
16
C
ompu
ter s
oftw
are
226
(119
) 10
7 14
1 -
- (4
2)
- (3
) -
362
(159
) 20
3 R
ight
s to
acq
uire
11
-
11
- -
- -
- -
- 11
-
11
Inte
llect
ual p
rope
rty
46
(31)
15
14
-
- (9
) -
- -
60
(40)
20
O
ther
15
(5
) 10
-
- -
- -
- -
16
(6)
10
Wor
k in
pro
gres
s 15
4 -
154
(155
) 15
39
-
(10)
-
- 43
-
43
Tota
l cou
ncil
45
2 (1
55)
297
- 15
39
(5
1)
(10)
(3
) -
492
(205
) 28
7 *In
clud
es tr
ansf
ers
betw
een
asse
t cla
sses
with
in in
tang
ible
s, a
s w
ell a
s be
twee
n in
tang
ible
s an
d pr
oper
ty, p
lant
and
equ
ipm
ent.
Inte
llect
ual p
rope
rty
Inte
grat
ed c
atch
men
t dat
a an
d ne
twor
k m
odel
s ar
e in
telle
ctua
l pro
perty
that
pro
vide
s lo
cal i
nfor
mat
ion
abou
t the
sto
rmw
ater
net
wor
k pe
rform
ance
whi
ch id
entif
y an
y pr
oble
ms
in re
latio
n to
cap
acity
and
inte
ract
ion
with
the
envi
ronm
ent.
Th
e m
odel
s ar
e us
ed fo
r lon
g-te
rm m
anag
emen
t of t
he n
etw
ork.
Oth
er in
tang
ible
ass
ets
O
ther
inta
ngib
le a
sset
s of
the
Gro
up in
clud
e th
e fo
llow
ing:
A rig
ht to
occ
upy
of $
32 m
illion
as
at 3
0 Ju
ne 2
017
(30
June
201
6: $
32 m
illion
) has
be
en re
cogn
ised
at i
ts fa
ir va
lue
on a
cqui
sitio
n an
d is
bei
ng a
mor
tised
ove
r the
pe
riod
of th
e un
derly
ing
leas
e (6
3 ye
ars)
. The
leas
e is
for t
he la
nd a
t eac
h of
the
railw
ay s
tatio
n si
tes
alon
g th
e A
uckl
and
pass
enge
r rai
l net
wor
k. T
he ri
ght t
o oc
cupy
in
the
unde
rlyin
g le
ase
is d
ue to
exp
ire in
207
0.
R
esou
rce
cons
ents
of $
29 m
illion
as
at 3
0 Ju
ne 2
017
(30
June
201
6: $
27 m
illion
) w
hich
are
ess
entia
l to
long
-term
pro
gram
me
of fu
ture
cap
ital w
orks
are
bei
ng
amor
tised
ove
r the
per
iod
of 1
to 3
8 ye
ars
(201
6: 1
to 3
8 ye
ars)
.
Res
tric
tions
to ti
tle a
nd s
ecur
ity o
ver i
ntan
gibl
e as
sets
Th
ere
are
no re
stric
tions
ove
r the
title
of i
ntan
gibl
e as
sets
of t
he G
roup
and
cou
ncil,
no
r are
any
inta
ngib
le a
sset
s pl
edge
d as
sec
urity
for l
iabi
litie
s (2
016:
$ni
l).
Wor
k in
pro
gres
s In
tang
ible
ass
ets
in th
e co
urse
of c
onst
ruct
ion
by a
sset
cla
ss a
re d
etai
led
belo
w.
G
roup
C
ounc
il $m
illio
n 20
17
2016
20
17
2016
C
ompu
ter s
oftw
are
69
63
27
32
Inte
llect
ual p
rope
rty
8 12
8
11
Tota
l wor
k in
pro
gres
s 77
75
35
43
Annual Report 2016/2017
Volume 3: Financial statements 43
Section B: Long-term assets
B3 Investment property
Accounting policy
Investment property includes land, commercial buildings and water space licences held to generate income. Investment property is initially recognised at cost and subsequently measured at fair value, determined annually by independent registered valuers with appropriate recognised professional qualifications and recent experience in Auckland and in investment properties. Gains or losses arising from fair value changes are included in surplus or deficit. Investment properties are valued individually and not depreciated.
Investment property
Valuation Method and Assumptions Used
Land Valued as vacant under freehold or leasehold tenure Land value rates applied in the valuations are:
city centre properties $680 to $1,370 per square metre (m2) (2016: $415 to $1,755 per m2) suburban properties $100 to $630 per m2 (2016: $100 to $991 per m2).
Valuations consider the size, contour, quality, location, zoning, designation and current and potential use.
Commercial property
Based on indicative yields derived from current prices of comparable property in an active market.
Water space licence
Using the discounted cash flow method based on yields of 6% (2016: 6%) considers the future rental revenue from existing and anticipated new tenants, any residual value of the Group's interest in the investment.
The movement in investment property is as follows:
Group Council
$million 2017 2016 2017 2016 Opening balance 681 560 121 102 Net increase in fair value of investment property 61 62 15 17 Additions from acquisition 53 40 29 - Disposals (5) - - - Transfers (to)/from property, plant and equipment and non-current assets held for sale (55) 19 (3) 2
Closing balance 735 681 162 121 Rental income and expenses relating to investment property are as follows:
Group Council
$million 2017 2016 2017 2016 Rental income 28 23 7 5 Expenses 5 5 1 -
The Group and the council have no investment property pledged as security for liabilities during the year (2016: $nil).

Auckland Council Annual Report 2016/2017
44 | Volume 3: Financial statements
Annual Report 2016/2017
44
Section C: Borrowings and financial instruments
This section provides details of the borrowings of the Group and council - a major source of funding used to deliver services to the people of Auckland, and information about financial instruments such as derivatives acquired to mitigate some of the risks arising from borrowings.
The notes included in this section are as follows:
C1 Borrowings
C2 Derivative financial instruments
C3 Other financial assets
C4 Fair value and classification of financial instruments

Te Rīpoata ā-Tau 2016/2017 o Te Kaunihera
o Tāmaki Makaurau
Pokanga 3: Ngā Pūrongo Pūtea | 45
Annual Report 2016/2017
44
Section C: Borrowings and financial instruments
This section provides details of the borrowings of the Group and council - a major source of funding used to deliver services to the people of Auckland, and information about financial instruments such as derivatives acquired to mitigate some of the risks arising from borrowings.
The notes included in this section are as follows:
C1 Borrowings
C2 Derivative financial instruments
C3 Other financial assets
C4 Fair value and classification of financial instruments
Annual Report 2016/2017
Volume 3: Financial statements 45
Section C: Borrowings and financial instruments
C1 Borrowings
Accounting policy
Borrowings are initially recognised at face value plus transaction costs and are subsequently measured at amortised cost using the effective interest rate method.
Foreign currency borrowings are translated into NZD using the spot rates at the balance date. Foreign exchange gains and losses resulting from the settlement of borrowings and from translation are recognised in the surplus or deficit.
Group Council
$million 2017 2016 2017 2016 Current Secured borrowings 975 1,148 975 1,148 Unsecured borrowings 150 299 - 21 Total current borrowings 1,125 1,447 975 1,169 Non-current Secured borrowings 6,729 5,772 6,729 5,772 Unsecured borrowings 446 392 - - Total non-current borrowings 7,175 6,164 6,729 5,772 Total borrowings 8,300 7,611 7,704 6,941 Fixed/floating rate split
Fixed rate borrowings 2,655 3,079 2,530 2,973 Floating rate borrowings 5,645 4,532 5,174 3,968
Total borrowings 8,300 7,611 7,704 6,941 Borrowings occur through domestic retail and wholesale debt issuance, LGFA, and via foreign debt markets under a secured medium-term note programme and an Australian dollar programme. The foreign denominated debt of the Group and the council amounting to $2,661 million as at 30 June 2017 ($1,471 million as at 30 June 2016) is hedged to mitigate foreign exchange risk. Refer to Note E1 for further information. Covenants The council’s borrowings are secured by a charge over current and future rates revenue. Entities within the Group can also borrow under negative pledge arrangements, being arrangements, which do not permit these entities to grant any security interest over their assets. Financial ratios are set as requirements in these arrangements which are in place for both 2016 and 2017. Default or breach of covenants There were no defaults or breaches by the Group and the council on any borrowing arrangement during the current year (2016: nil). Interest rates The weighted average cost of funds for the Group’s borrowings including interest rate hedging instruments as at 30 June 2017 is 5.3% (2016: 5.2%). Refer to notes A5 and E2 for the net finance costs during the period and the interest rate risk analysis, respectively. Continuous disclosure The Group and the council have retail bonds under secured borrowings issued on the New Zealand Stock Exchange (NZX). A requirement under the listing rules is for the Group and the council to meet the continuous disclosure requirements of the NZX and to ensure compliance with the FMCA 2013.
The Group and the council have adopted a continuous disclosure policy that established a continuous disclosure committee of key staff members including the Chief Executive, Group Chief Financial Officer, Director Legal and Risk, Treasurer and Head of Risk. This committee maintains the disclosure register which is used to record any disclosures made from within council and the CCOs that may be material for the purposes of reporting to the NZX to ensure ongoing compliance with the listing rules.

Auckland Council Annual Report 2016/2017
46 | Volume 3: Financial statements
Annual Report 2016/2017
46
Section C: Borrowings and financial instruments
C1 Borrowings (continued)
Local government disclosures Internal borrowings In relation to each group of activities, the council has incurred no internal borrowings during the financial year to 30 June 2017. The Group and the council maintain sufficient cash balances at all times. Credit ratings Auckland Council has a Standard & Poor’s credit rating of AA (stable) and Moody’s credit rating of Aa2. Both ratings were reaffirmed in October 2016.
C2 Derivative financial instruments
Accounting policy
The Group and the council do not hold or issue derivative financial instruments for trading purposes. The Group and the council use derivative financial instruments, such as forward foreign currency contracts and interest rate swaps to mitigate risks associated with foreign currency and interest rate fluctuations. Such derivative financial instruments are initially recognised at fair value on the date on which a derivative contract is entered into and are subsequently remeasured to fair value. Any gains or losses arising from changes in the fair value of derivatives are taken directly to surplus or deficit, except for the effective portion of derivatives designated in cash flow hedges.
Derivatives are carried as assets when their fair value is positive and as liabilities when their fair value is negative.
Derivative assets and derivative liabilities are classified as current when the remaining maturity is 12 months or less, or as non-current when the remaining maturity is more than 12 months.
Cash flow hedges
The effective portion of changes in the fair value of derivatives that are designated and qualified as cash flow hedges are recognised directly in other comprehensive revenue and expenditure. The gain or loss relating to the ineffective portion is recognised immediately in the surplus or deficit. On derecognition, amounts accumulated in cash flow hedge reserve are transferred to surplus or deficit.
When a hedging instrument expires or is sold, or when a hedge no longer meets the criteria for hedge accounting, any cumulative gain or loss existing in cash flow hedge reserve at that time remains in equity and is recognised when the forecast transaction occurs.
When a forecast transaction is no longer expected to occur, the cumulative gain or loss that was reported in cash flow hedge reserve is recognised immediately in the surplus or deficit.
When a hedge of a forecast transaction subsequently results in the recognition of a non-financial asset or a non-financial liability, the associated gains and losses that were recognised in other comprehensive revenue and expenditure are transferred to the initial cost of carrying amount of the asset or liability.
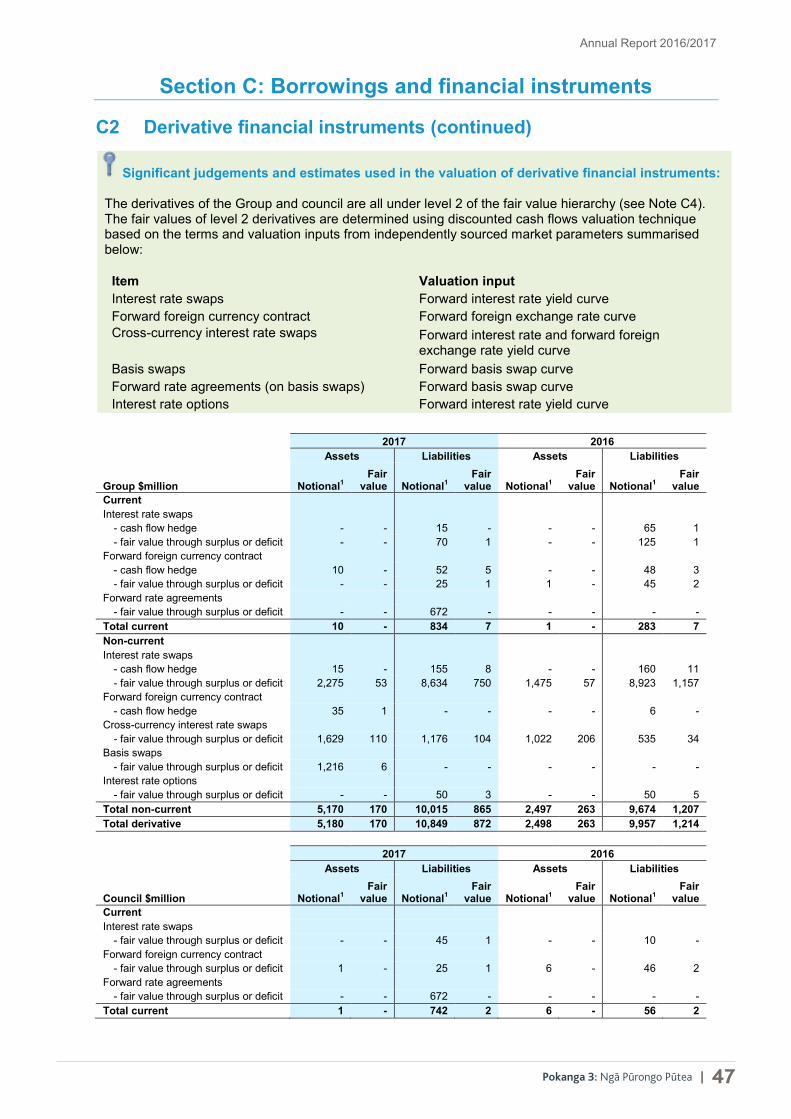
Te Rīpoata ā-Tau 2016/2017 o Te Kaunihera
o Tāmaki Makaurau
Pokanga 3: Ngā Pūrongo Pūtea | 47
Annual Report 2016/2017
46
Section C: Borrowings and financial instruments
C1 Borrowings (continued)
Local government disclosures Internal borrowings In relation to each group of activities, the council has incurred no internal borrowings during the financial year to 30 June 2017. The Group and the council maintain sufficient cash balances at all times. Credit ratings Auckland Council has a Standard & Poor’s credit rating of AA (stable) and Moody’s credit rating of Aa2. Both ratings were reaffirmed in October 2016.
C2 Derivative financial instruments
Accounting policy
The Group and the council do not hold or issue derivative financial instruments for trading purposes. The Group and the council use derivative financial instruments, such as forward foreign currency contracts and interest rate swaps to mitigate risks associated with foreign currency and interest rate fluctuations. Such derivative financial instruments are initially recognised at fair value on the date on which a derivative contract is entered into and are subsequently remeasured to fair value. Any gains or losses arising from changes in the fair value of derivatives are taken directly to surplus or deficit, except for the effective portion of derivatives designated in cash flow hedges.
Derivatives are carried as assets when their fair value is positive and as liabilities when their fair value is negative.
Derivative assets and derivative liabilities are classified as current when the remaining maturity is 12 months or less, or as non-current when the remaining maturity is more than 12 months.
Cash flow hedges
The effective portion of changes in the fair value of derivatives that are designated and qualified as cash flow hedges are recognised directly in other comprehensive revenue and expenditure. The gain or loss relating to the ineffective portion is recognised immediately in the surplus or deficit. On derecognition, amounts accumulated in cash flow hedge reserve are transferred to surplus or deficit.
When a hedging instrument expires or is sold, or when a hedge no longer meets the criteria for hedge accounting, any cumulative gain or loss existing in cash flow hedge reserve at that time remains in equity and is recognised when the forecast transaction occurs.
When a forecast transaction is no longer expected to occur, the cumulative gain or loss that was reported in cash flow hedge reserve is recognised immediately in the surplus or deficit.
When a hedge of a forecast transaction subsequently results in the recognition of a non-financial asset or a non-financial liability, the associated gains and losses that were recognised in other comprehensive revenue and expenditure are transferred to the initial cost of carrying amount of the asset or liability.
Annual Report 2016/2017
Volume 3: Financial statements 47
Section C: Borrowings and financial instruments
C2 Derivative financial instruments (continued)
Significant judgements and estimates used in the valuation of derivative financial instruments: The derivatives of the Group and council are all under level 2 of the fair value hierarchy (see Note C4). The fair values of level 2 derivatives are determined using discounted cash flows valuation technique based on the terms and valuation inputs from independently sourced market parameters summarised below: Item Valuation input Interest rate swaps Forward interest rate yield curve Forward foreign currency contract Forward foreign exchange rate curve Cross-currency interest rate swaps Forward interest rate and forward foreign
exchange rate yield curve Basis swaps Forward basis swap curve Forward rate agreements (on basis swaps) Forward basis swap curve Interest rate options Forward interest rate yield curve
2017 2016 Assets Liabilities Assets Liabilities
Group $million Notional1 Fair
value Notional1 Fair
value Notional1 Fair
value Notional1 Fair
value Current Interest rate swaps
- cash flow hedge - - 15 - - - 65 1 - fair value through surplus or deficit - - 70 1 - - 125 1
Forward foreign currency contract - cash flow hedge 10 - 52 5 - - 48 3 - fair value through surplus or deficit - - 25 1 1 - 45 2
Forward rate agreements - fair value through surplus or deficit - - 672 - - - - -
Total current 10 - 834 7 1 - 283 7 Non-current Interest rate swaps
- cash flow hedge 15 - 155 8 - - 160 11 - fair value through surplus or deficit 2,275 53 8,634 750 1,475 57 8,923 1,157
Forward foreign currency contract - cash flow hedge 35 1 - - - - 6 -
Cross-currency interest rate swaps - fair value through surplus or deficit 1,629 110 1,176 104 1,022 206 535 34
Basis swaps - fair value through surplus or deficit 1,216 6 - - - - - -
Interest rate options - fair value through surplus or deficit - - 50 3 - - 50 5
Total non-current 5,170 170 10,015 865 2,497 263 9,674 1,207 Total derivative 5,180 170 10,849 872 2,498 263 9,957 1,214
2017 2016 Assets Liabilities Assets Liabilities
Council $million Notional1 Fair
value Notional1 Fair
value Notional1 Fair
value Notional1 Fair
value Current Interest rate swaps
- fair value through surplus or deficit - - 45 1 - - 10 - Forward foreign currency contract
- fair value through surplus or deficit 1 - 25 1 6 - 46 2 Forward rate agreements
- fair value through surplus or deficit - - 672 - - - - - Total current 1 - 742 2 6 - 56 2

Auckland Council Annual Report 2016/2017
48 | Volume 3: Financial statements
Annual Report 2016/2017
48
Section C: Borrowings and financial instruments
C2 Derivative financial instruments (continued)
2017 2016 Assets Liabilities Assets Liabilities
Council $million Notional1 Fair
value Notional1 Fair
value Notional1 Fair
value Notional1 Fair
value Non-current Interest rate swaps
- fair value through surplus or deficit 2,070 45 7,044 549 1,288 49 7,328 867 Forward foreign currency contract
- fair value through surplus or deficit - - - - 1 - 1 - Cross-currency interest rate swaps
- fair value through surplus or deficit 1,629 110 1,176 104 1,022 206 535 34 Basis swaps
- fair value through surplus or deficit 1,216 6 - - - - - - Total non-current 4,915 161 8,220 653 2,311 255 7,864 901 Total derivative 4,916 161 8,962 655 2,317 255 7,920 903
1 The notional principal amounts presented for the Group and the council reflects only transactions with third parties. The council’s position includes both external and intra-group derivatives.
C3 Other financial assets
Accounting policy
The Group and the council’s other financial assets are initially recognised at fair value plus transaction costs unless they are carried at fair value through surplus or deficit in which case the transaction costs are recognised in the surplus or deficit.
Other financial assets of the Group and the council include unit trusts, loans to related parties, credit support annex, bonds, borrower notes, community loans and listed and unlisted shares.
The accounting policies on classification of these financial assets for the purpose of measurement are outlined in Note C4.
Group Council
$million 2017 2016 2017 2016 Current Unit trusts 217 270 217 270 Short-term deposits 17 67 16 64 Loans to related parties - - 87 87 Borrowers notes 5 - 5 - Listed shares 19 44 19 44 Other 18 8 17 8 Total current 276 389 361 473 Non-current Loans to related parties 3 4 1,724 1,566 Borrowers notes 33 34 33 34 Listed shares 36 25 - - Other 69 65 57 53 Total non-current 141 128 1,814 1,653 Total other financial assets 417 517 2,175 2,126
Unit trusts Unit trusts are recognised at fair value using market information and are designated as fair value through surplus or deficit. They are classified as current as they are held for liquidity purposes. Refer to Note E4 for further information.

Te Rīpoata ā-Tau 2016/2017 o Te Kaunihera
o Tāmaki Makaurau
Pokanga 3: Ngā Pūrongo Pūtea | 49
Annual Report 2016/2017
48
Section C: Borrowings and financial instruments
C2 Derivative financial instruments (continued)
2017 2016 Assets Liabilities Assets Liabilities
Council $million Notional1 Fair
value Notional1 Fair
value Notional1 Fair
value Notional1 Fair
value Non-current Interest rate swaps
- fair value through surplus or deficit 2,070 45 7,044 549 1,288 49 7,328 867 Forward foreign currency contract
- fair value through surplus or deficit - - - - 1 - 1 - Cross-currency interest rate swaps
- fair value through surplus or deficit 1,629 110 1,176 104 1,022 206 535 34 Basis swaps
- fair value through surplus or deficit 1,216 6 - - - - - - Total non-current 4,915 161 8,220 653 2,311 255 7,864 901 Total derivative 4,916 161 8,962 655 2,317 255 7,920 903
1 The notional principal amounts presented for the Group and the council reflects only transactions with third parties. The council’s position includes both external and intra-group derivatives.
C3 Other financial assets
Accounting policy
The Group and the council’s other financial assets are initially recognised at fair value plus transaction costs unless they are carried at fair value through surplus or deficit in which case the transaction costs are recognised in the surplus or deficit.
Other financial assets of the Group and the council include unit trusts, loans to related parties, credit support annex, bonds, borrower notes, community loans and listed and unlisted shares.
The accounting policies on classification of these financial assets for the purpose of measurement are outlined in Note C4.
Group Council
$million 2017 2016 2017 2016 Current Unit trusts 217 270 217 270 Short-term deposits 17 67 16 64 Loans to related parties - - 87 87 Borrowers notes 5 - 5 - Listed shares 19 44 19 44 Other 18 8 17 8 Total current 276 389 361 473 Non-current Loans to related parties 3 4 1,724 1,566 Borrowers notes 33 34 33 34 Listed shares 36 25 - - Other 69 65 57 53 Total non-current 141 128 1,814 1,653 Total other financial assets 417 517 2,175 2,126
Unit trusts Unit trusts are recognised at fair value using market information and are designated as fair value through surplus or deficit. They are classified as current as they are held for liquidity purposes. Refer to Note E4 for further information.
Annual Report 2016/2017
Volume 3: Financial statements 49
Section C: Borrowings and financial instruments
C3 Other financial assets (continued)
Loans to related parties Loans to related parties are interest bearing at market rates. Interest rates for the year ended 30 June 2017 range from 2.4% to 6.6% (2016: range from 2.5% to 6.2%). Read Note A2 for details of other financial contributions provided by council. Listed shares The Group has $36 million (2016: $25 million) of listed shares classified as non-current which are designated as available-for-sale financial assets. In addition, the Group and council have $19 million (2016: $44 million) of listed shares which are designated as fair value through surplus or deficit. They are classified as current as they are held for liquidity purposes. Refer to the note E4 for further information. The fair values of listed shares are determined by reference to published current bid price quotations in an active market. Borrower notes Borrower notes are subordinated convertible debt instruments which each council that borrows from LGFA subscribes for in an amount equal to 1.6% of the total borrowing from LGFA by that council. LGFA will redeem Borrower notes when the council’s related borrowings are repaid or no longer owed to LGFA. Other Significant items included within Other are as follows: Bonds The Group and the council hold $18 million of bonds which are carried at amortised cost (2016: $20 million). Credit Support Annex (CSA) The Group and the council are exposed to counterparty credit risk through its derivative contracts. This risk is mitigated by entering into CSA’s with counterparties that collateralise derivative exposures. The Group and the council have CSA’s with Citibank and the Hong Kong and Shanghai Banking Corporation (HSBC). As at 30 June 2017, the Group and the council had both an obligation for repayment of cash collateral received from Citibank (2017: a liability of $23 million, 2016: a liability of $38 million, refer to Note D3) and an amount receivable for cash collateral pledged to HSBC (2017: an asset of $12 million, 2016: nil). Unlisted shares The Group and the council have $7 million (2016: $6 million) investments in LGFA and Civic Financial Services Ltd. The fair values are determined by reference to the council’s share of net asset backing in these companies as there is no market information on the value of the company’s shares.
C4 Fair value and classification of financial instruments
Accounting policy
For those financial instruments recognised at fair value in the statement of financial position, fair values are determined according to the following hierarchy:
Level 1- Quoted prices (unadjusted) in active markets for identical assets or liabilities. The quoted market price used for financial assets held by the Group and the council is the bid price at reporting date.
Level 2- Inputs other than quoted prices included within level 1 using observable market inputs for the asset or liability, either directly or indirectly.
Level 3- Inputs for the asset or liability that are not based on observable market data.
Refer to Note C2 and C3 for the valuation techniques used to value derivative financial instruments and other financial assets, respectively.

Auckland Council Annual Report 2016/2017
50 | Volume 3: Financial statements
Annual Report 2016/2017
50
Section C: Borrowings and financial instruments
C4 Fair value and classification of financial instruments (continued) The fair value hierarchy for the Group and the council are as follows:
Group Council $million Level 2017 2016 2017 2016 Financial assets through surplus or deficit Unit trusts 1 217 270 217 270 Listed shares 1 19 44 19 44 Available for sale financial assets Listed shares 1 36 25 - - Other financial assets 1 10 10 - - Unlisted shares 3 7 6 7 6 Derivative assets 2 170 263 161 255 Total financial assets 459 618 404 575
Derivative liabilities 2 872 1,214 655 903 Total financial liabilities 872 1,214 655 903
There were no transfers between the different levels of the fair value hierarchy during the year (2016: $nil).
Accounting policy
For the purpose of measurement, the Group and the council’s financial assets and liabilities are classified into categories. The classification depends on the purpose for which the financial assets and liabilities are held. Management determines the classification of financial assets and liabilities and recognised these at fair value at initial recognition. Subsequent measurement and the treatment of gains and losses are presented below:
Categories Subsequent measurement Treatment of gains and losses
Fair value through surplus or deficit Fair value Surplus or deficit
Loans and receivables Amortised cost less provision for impairment Surplus or deficit
Available for sale financial assets Fair value Other comprehensive revenue and expenditure
Financial liabilities at amortised cost Amortised cost Surplus or deficit
Held to maturity financial assets Amortised cost less provision for impairment Surplus or deficit
The Group and the council do not have financial assets for purposes of trading. The Group and the council have listed shares and unit trusts that are designated on initial recognition at fair value through surplus or deficit. This is because the performance of these groups of assets is managed and performance evaluated, on a fair value basis, in accordance with the council’s investment management policy. This is consistent with the information that is provided internally to the Finance and Performance Committee.
Derivatives are, by their nature, categorised as held for trading unless they are designated into a hedge relationship for which hedge accounting is applied.
Financial assets and liabilities are offset and the net amount reported in the statement of financial position when offset is legally enforceable and there is an intention to settle on a net basis. Revenue and expenses arising as a result of financial instrument earnings or fair value adjustments are recognised as a net result for like items.

Te Rīpoata ā-Tau 2016/2017 o Te Kaunihera
o Tāmaki Makaurau
Pokanga 3: Ngā Pūrongo Pūtea | 51
Annual Report 2016/2017
50
Section C: Borrowings and financial instruments
C4 Fair value and classification of financial instruments (continued) The fair value hierarchy for the Group and the council are as follows:
Group Council $million Level 2017 2016 2017 2016 Financial assets through surplus or deficit Unit trusts 1 217 270 217 270 Listed shares 1 19 44 19 44 Available for sale financial assets Listed shares 1 36 25 - - Other financial assets 1 10 10 - - Unlisted shares 3 7 6 7 6 Derivative assets 2 170 263 161 255 Total financial assets 459 618 404 575
Derivative liabilities 2 872 1,214 655 903 Total financial liabilities 872 1,214 655 903
There were no transfers between the different levels of the fair value hierarchy during the year (2016: $nil).
Accounting policy
For the purpose of measurement, the Group and the council’s financial assets and liabilities are classified into categories. The classification depends on the purpose for which the financial assets and liabilities are held. Management determines the classification of financial assets and liabilities and recognised these at fair value at initial recognition. Subsequent measurement and the treatment of gains and losses are presented below:
Categories Subsequent measurement Treatment of gains and losses
Fair value through surplus or deficit Fair value Surplus or deficit
Loans and receivables Amortised cost less provision for impairment Surplus or deficit
Available for sale financial assets Fair value Other comprehensive revenue and expenditure
Financial liabilities at amortised cost Amortised cost Surplus or deficit
Held to maturity financial assets Amortised cost less provision for impairment Surplus or deficit
The Group and the council do not have financial assets for purposes of trading. The Group and the council have listed shares and unit trusts that are designated on initial recognition at fair value through surplus or deficit. This is because the performance of these groups of assets is managed and performance evaluated, on a fair value basis, in accordance with the council’s investment management policy. This is consistent with the information that is provided internally to the Finance and Performance Committee.
Derivatives are, by their nature, categorised as held for trading unless they are designated into a hedge relationship for which hedge accounting is applied.
Financial assets and liabilities are offset and the net amount reported in the statement of financial position when offset is legally enforceable and there is an intention to settle on a net basis. Revenue and expenses arising as a result of financial instrument earnings or fair value adjustments are recognised as a net result for like items.
Annual Report 2016/2017
Volume 3: Financial statements 51
Section C: Borrowings and financial instruments
C4 Fair value and classification of financial instruments (continued) The category and the comparison of carrying amount and fair value of the Group and the council’s financial instruments are as follows:
Group Council
Carrying amount
Fair value
Carrying amount
Fair value
Carrying amount
Fair value
Carrying amount
Fair value
$million 2017 2017 2016 2016 2017 2017 2016 2016 Assets
Financial assets through surplus or deficit
Unit trusts 217 217 270 270 217 217 270 270 Listed shares 19 19 44 44 19 19 44 44 Derivative assets 168 168 263 263 161 161 255 255 Total 404 404 577 577 397 397 569 569 Available for sale financial assets
Listed shares 36 36 25 25 - - - - Unlisted shares 7 7 6 6 7 7 6 6 Other financial assets 10 10 10 10 - - - - Total 53 53 41 41 7 7 6 6 Loans and receivables
Cash and cash equivalents 337 337 137 137 279 279 103 103 Receivables (exclude GST receivables and prepayments) 331 331 278 278 256 256 170 170 Loans to related parties 3 3 4 3 1,811 1,881 1,653 1,750 Other financial assets 107 111 138 142 104 108 134 138 Total 778 782 557 560 2,450 2,524 2,060 2,161 Held to maturity financial assets
Bonds (under "Other financial assets") 18 18 20 20 18 18 20 20 Derivative in hedge relationships Derivative assets 2 2 - - - - - - Total assets 1,255 1,259 1,195 1,198 2,872 2,946 2,655 2,756 Liabilities
Financial liabilities through surplus or deficit
Derivative liabilities 859 859 1,199 1,199 655 655 903 903 Financial liabilities at amortised cost
Bank overdraft 6 6 9 9 - - - - Borrowings 8,300 8,589 7,611 8,231 7,704 7,987 6,941 7,551 Payables and accruals (exclude income received in advance) 656 656 573 573 653 653 519 519 Total 8,962 9,251 8,193 8,814 8,357 8,640 7,460 8,070 Derivative in hedge relationships
Derivative liabilities 13 13 15 12 - - - - Total liabilities 9,834 10,123 9,407 10,025 9,012 9,295 8,363 8,973
Auckland Council Annual Report 2016/2017
52 | Volume 3: Financial statements
Annual Report 2016/2017
52
Section D: Working capital and equity
This section provides information about the operating assets and liabilities available to the Group and the council’s day-to-day activities. This section also contains analysis of the net assets of the Group and the council, accumulated funds and restricted reserves.
The notes included in the following section are as follows:
D1 Cash and cash equivalents
D2 Receivables and prepayments
D3 Payables and accruals
D4 Employee entitlements
D5 Provisions
D6 Ratepayer equity

Te Rīpoata ā-Tau 2016/2017 o Te Kaunihera
o Tāmaki Makaurau
Pokanga 3: Ngā Pūrongo Pūtea | 53
Annual Report 2016/2017
52
Section D: Working capital and equity
This section provides information about the operating assets and liabilities available to the Group and the council’s day-to-day activities. This section also contains analysis of the net assets of the Group and the council, accumulated funds and restricted reserves.
The notes included in the following section are as follows:
D1 Cash and cash equivalents
D2 Receivables and prepayments
D3 Payables and accruals
D4 Employee entitlements
D5 Provisions
D6 Ratepayer equity
Annual Report 2016/2017
Volume 3: Financial statements 53
Section D: Working capital and equity
D1 Cash and cash equivalents
Accounting policy Cash and cash equivalents are made up of cash on hand, on-demand deposits and other short-term highly liquid investments, net of bank overdraft classified under current liabilities. The carrying value of cash at bank and short-term deposits with original maturities less than three months approximates their fair value.
Group Council $million 2017 2016 2017 2016 Short-term deposits 260 94 254 90 Cash on hand and on-demand bank deposits 77 43 25 13 Cash and cash equivalents 337 137 279 103 Bank overdraft (6) (9) - - Net cash and cash equivalents 331 128 279 103
Unspent funds held by the Group and the council that are subject to restrictions were:
$million 2017 2016 Group
31 18
Council
- 5 These unspent funds relate to trusts and bequests received, and other funds received with restrictions where the spending of the funds is separately monitored.
D2 Receivables and prepayments
Accounting policy Receivables are initially recognised at fair value and subsequently measured at amortised cost using the effective interest method, less provision for impairment.
Group Council
$million 2017 2016 2017 2016 Current
Trade receivables
211 176 95 65 Less provision for impairment
(34) (33) (18) (18)
Rates receivables
55 42 56 41 Related party receivables - - 106 59 Net receivables
232 185 239 147
Accrued income
87 70 10 6 GST receivable
5 - 19 16
Insurance recoveries
3 1 3 1 Prepayments
15 18 8 11
Other
3 1 - - Total current 345 275 279 181 Receivables from exchange transactions
166 147 92 50
Receivables from non-exchange transactions 179 128 187 131
Non-current
Rates
3 2 3 2
Insurance recoveries
1 2 1 2 Prepayments
3 3 - -
Other
2 17 - 12 Total non-current 9 24 4 16 Receivables from exchange transactions
6 21 1 14
Receivables from non-exchange transactions 3 3 3 2 Total receivables and prepayments 354 299 283 197
Most receivables are non-interest bearing and the carrying value approximates fair value. Ratepayers can apply for payment plan options in special circumstances.
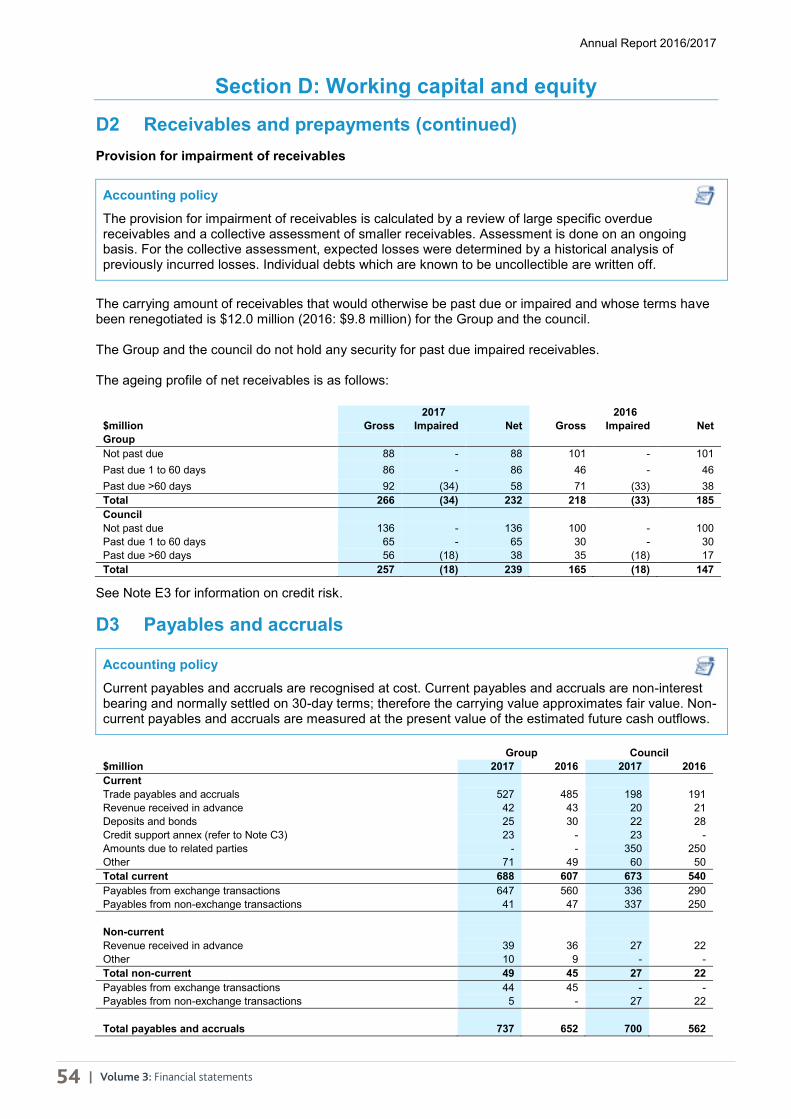
Auckland Council Annual Report 2016/2017
54 | Volume 3: Financial statements
Annual Report 2016/2017
54
Section D: Working capital and equity
D2 Receivables and prepayments (continued) Provision for impairment of receivables
Accounting policy
The provision for impairment of receivables is calculated by a review of large specific overdue receivables and a collective assessment of smaller receivables. Assessment is done on an ongoing basis. For the collective assessment, expected losses were determined by a historical analysis of previously incurred losses. Individual debts which are known to be uncollectible are written off.
The carrying amount of receivables that would otherwise be past due or impaired and whose terms have been renegotiated is $12.0 million (2016: $9.8 million) for the Group and the council. The Group and the council do not hold any security for past due impaired receivables. The ageing profile of net receivables is as follows:
2017 2016
$million Gross Impaired Net Gross Impaired Net Group Not past due 88 - 88 101 - 101 Past due 1 to 60 days 86 - 86 46 - 46 Past due >60 days 92 (34) 58 71 (33) 38 Total 266 (34) 232 218 (33) 185 Council Not past due 136 - 136 100 - 100 Past due 1 to 60 days 65 - 65 30 - 30 Past due >60 days 56 (18) 38 35 (18) 17 Total 257 (18) 239 165 (18) 147
See Note E3 for information on credit risk.
D3 Payables and accruals
Accounting policy
Current payables and accruals are recognised at cost. Current payables and accruals are non-interest bearing and normally settled on 30-day terms; therefore the carrying value approximates fair value. Non-current payables and accruals are measured at the present value of the estimated future cash outflows.
Group Council
$million 2017 2016 2017 2016 Current Trade payables and accruals 527 485 198 191 Revenue received in advance 42 43 20 21 Deposits and bonds 25 30 22 28 Credit support annex (refer to Note C3) 23 - 23 - Amounts due to related parties - - 350 250 Other 71 49 60 50 Total current 688 607 673 540 Payables from exchange transactions 647 560 336 290 Payables from non-exchange transactions 41 47 337 250
Non-current Revenue received in advance 39 36 27 22 Other 10 9 - - Total non-current 49 45 27 22 Payables from exchange transactions 44 45 - - Payables from non-exchange transactions 5 - 27 22
Total payables and accruals 737 652 700 562

Te Rīpoata ā-Tau 2016/2017 o Te Kaunihera
o Tāmaki Makaurau
Pokanga 3: Ngā Pūrongo Pūtea | 55
Annual Report 2016/2017
54
Section D: Working capital and equity
D2 Receivables and prepayments (continued) Provision for impairment of receivables
Accounting policy
The provision for impairment of receivables is calculated by a review of large specific overdue receivables and a collective assessment of smaller receivables. Assessment is done on an ongoing basis. For the collective assessment, expected losses were determined by a historical analysis of previously incurred losses. Individual debts which are known to be uncollectible are written off.
The carrying amount of receivables that would otherwise be past due or impaired and whose terms have been renegotiated is $12.0 million (2016: $9.8 million) for the Group and the council. The Group and the council do not hold any security for past due impaired receivables. The ageing profile of net receivables is as follows:
2017 2016
$million Gross Impaired Net Gross Impaired Net Group Not past due 88 - 88 101 - 101 Past due 1 to 60 days 86 - 86 46 - 46 Past due >60 days 92 (34) 58 71 (33) 38 Total 266 (34) 232 218 (33) 185 Council Not past due 136 - 136 100 - 100 Past due 1 to 60 days 65 - 65 30 - 30 Past due >60 days 56 (18) 38 35 (18) 17 Total 257 (18) 239 165 (18) 147
See Note E3 for information on credit risk.
D3 Payables and accruals
Accounting policy
Current payables and accruals are recognised at cost. Current payables and accruals are non-interest bearing and normally settled on 30-day terms; therefore the carrying value approximates fair value. Non-current payables and accruals are measured at the present value of the estimated future cash outflows.
Group Council
$million 2017 2016 2017 2016 Current Trade payables and accruals 527 485 198 191 Revenue received in advance 42 43 20 21 Deposits and bonds 25 30 22 28 Credit support annex (refer to Note C3) 23 - 23 - Amounts due to related parties - - 350 250 Other 71 49 60 50 Total current 688 607 673 540 Payables from exchange transactions 647 560 336 290 Payables from non-exchange transactions 41 47 337 250
Non-current Revenue received in advance 39 36 27 22 Other 10 9 - - Total non-current 49 45 27 22 Payables from exchange transactions 44 45 - - Payables from non-exchange transactions 5 - 27 22
Total payables and accruals 737 652 700 562
Annual Report 2016/2017
Volume 3: Financial statements 55
Section D: Working capital and equity
D3 Payables and accruals (continued) The council’s non-current payables and accruals balance includes an obligation for council to give Watercare unrestricted and sole access to land on Puketutu Island until the earlier of 2066 or until such time that Watercare surrenders its lease over the island. The balance of the deferred revenue as at 30 June 2017 amounted to $21.7 million (2016: $22.2 million) and is amortised on a straight-line basis over the lease period (70 years), which is 55 years with one right of renewal of 15 years. The lease period is longer than the resource consent period of 35 years as the land will be used beyond the consent period for aftercare. Payables and accruals as at 30 June 2017 included $20.5 million relating to the City Rail Link project (CRL), which will be included in the settlement between the Group and City Rail Link Limited (CRLL) as and from 1 July 2017. The Group and the council’s credit support annex of $38 million and the council’s related party borrowings of $21 million as at 30 June 2016 were classified under Borrowings.
D4 Employee entitlements
Accounting policy
Employee entitlements to be settled within 12 months are reported at the amount expected to be paid. The liability for long-term employee entitlements is reported at the present value of estimated future cash outflows.
Group Council $million 2017 2016 2017 2016 Current Short-term employee benefits 90 86 50 50 Other 5 4 2 3 Total current 95 90 52 53 Non-current Other 5 5 2 2 Total non-current 5 5 2 2 Total employee entitlements 100 95 54 55
Employee entitlements as at 30 June 2017 included $0.5 million relating to the CRL, which will be included in the settlement between the Group and CRLL as and from 1 July 2017.
D5 Provisions
Accounting policy
Provisions are recognised in the statement of financial position only where the Group and the council have a present legal or constructive obligation as a result of past event, it is probable that an outflow of resources will be required to settle the obligation and the amount can be estimated reliably.
Provisions are measured at the present value of the expected future cash outflows required to settle the obligation. The increase in the provision due to the passage of time is recognised as finance cost in surplus or deficit.
Discount rate The present value of these cash flows is calculated using a discount rate equivalent to the appropriate risk-free rate relevant for the timing of cash flows, published by New Zealand Treasury as the government bond rate (2.0% to 4.0%). The Group and the council determined that risk-free rates, as opposed to council’s cost of funding rate, appropriately represented the risks specifically related to time value of money (2016: 5.7%).

Auckland Council Annual Report 2016/2017
56 | Volume 3: Financial statements
Annual Report 2016/2017
56
Section D: Working capital and equity
D5 Provisions (continued)
Group $million Weather- tightness
Contaminated land and closed
landfills Financial
guarantees Other Total Opening balance 257 88 15 31 391 Additional provisions and increases to existing provisions 30 9 27 32 98 Amounts used (53) (5) - (8) (66) Reversal of previously recognised provisions - - - (11) (11) Change in discount rate 21 14 - 1 36 Discount unwind 10 - - (2) 8 Balance as at 30 June 2017 265 106 42 43 456 Current 44 8 - 30 82 Non-current 221 98 42 13 374
Opening balance 276 85 15 32 408 Additional provisions and increases to existing provisions 15 7 - 13 35 Amounts used (46) (4) - (13) (63) Reversal of previously recognised provisions - - - (1) (1) Discount unwind 12 - - - 12 Balance as at 30 June 2016 257 88 15 31 391 Current 73 8 - 20 101 Non-current 184 80 15 11 290
Council $million Weather- tightness
Contaminated land and closed
landfills Financial
guarantees Other Total Opening balance 257 84 15 28 384 Additional provisions and increases to existing provisions 30 7 27 27 91 Amounts used (53) (4) - (7) (64) Reversal of previously recognised provisions - - - (11) (11) Change in discount rate 21 14 - 1 36 Discount unwind 10 - - (2) 8 Balance as at 30 June 2017 265 101 42 36 444 Current 44 8 - 25 77 Non-current 221 93 42 11 367
Opening balance 276 81 15 27 399 Additional provisions and increases to existing provisions 15 6 - 10 31 Amounts used (46) (3) - (8) (57) Reversal of previously recognised provisions - - - (1) (1) Discount unwind 12 - - - 12 Balance as at 30 June 2016 257 84 15 28 384 Current 73 8 - 18 99 Non-current 184 76 15 10 285
Provision for weathertightness The Group and the council are required to make provision in its accounts for weathertightness claims covering Active, Reported and Unreported claims. The provision comprises of:
Weathertightness disclosure $million Multi-unit buildings Single buildings Total
Active provision 161 4 165 Reported provision 17 14 31 Unreported provision 59 10 69
Balance as at 30 June 2017 237 28 265
Active provision 140 6 146 Reported provision 30 19 49 Unreported provision 44 18 62
Balance as at 30 June 2016 214 43 257

Te Rīpoata ā-Tau 2016/2017 o Te Kaunihera
o Tāmaki Makaurau
Pokanga 3: Ngā Pūrongo Pūtea | 57
Annual Report 2016/2017
56
Section D: Working capital and equity
D5 Provisions (continued)
Group $million Weather- tightness
Contaminated land and closed
landfills Financial
guarantees Other Total Opening balance 257 88 15 31 391 Additional provisions and increases to existing provisions 30 9 27 32 98 Amounts used (53) (5) - (8) (66) Reversal of previously recognised provisions - - - (11) (11) Change in discount rate 21 14 - 1 36 Discount unwind 10 - - (2) 8 Balance as at 30 June 2017 265 106 42 43 456 Current 44 8 - 30 82 Non-current 221 98 42 13 374
Opening balance 276 85 15 32 408 Additional provisions and increases to existing provisions 15 7 - 13 35 Amounts used (46) (4) - (13) (63) Reversal of previously recognised provisions - - - (1) (1) Discount unwind 12 - - - 12 Balance as at 30 June 2016 257 88 15 31 391 Current 73 8 - 20 101 Non-current 184 80 15 11 290
Council $million Weather- tightness
Contaminated land and closed
landfills Financial
guarantees Other Total Opening balance 257 84 15 28 384 Additional provisions and increases to existing provisions 30 7 27 27 91 Amounts used (53) (4) - (7) (64) Reversal of previously recognised provisions - - - (11) (11) Change in discount rate 21 14 - 1 36 Discount unwind 10 - - (2) 8 Balance as at 30 June 2017 265 101 42 36 444 Current 44 8 - 25 77 Non-current 221 93 42 11 367
Opening balance 276 81 15 27 399 Additional provisions and increases to existing provisions 15 6 - 10 31 Amounts used (46) (3) - (8) (57) Reversal of previously recognised provisions - - - (1) (1) Discount unwind 12 - - - 12 Balance as at 30 June 2016 257 84 15 28 384 Current 73 8 - 18 99 Non-current 184 76 15 10 285
Provision for weathertightness The Group and the council are required to make provision in its accounts for weathertightness claims covering Active, Reported and Unreported claims. The provision comprises of:
Weathertightness disclosure $million Multi-unit buildings Single buildings Total
Active provision 161 4 165 Reported provision 17 14 31 Unreported provision 59 10 69
Balance as at 30 June 2017 237 28 265
Active provision 140 6 146 Reported provision 30 19 49 Unreported provision 44 18 62
Balance as at 30 June 2016 214 43 257
Annual Report 2016/2017
Volume 3: Financial statements 57
Section D: Working capital and equity
D5 Provisions (continued) Active claims are those which have been lodged with the council, have a loss and a cost reserve, and are progressing through the resolution process. There is a higher degree of certainty over estimates for active claims. The provision for reported and unreported is based on calculations provided by independent actuaries. Reported claims are those that have been lodged but are not yet progressing through the resolution process. Unreported claims are those which the council may be liable for but have not yet been reported or identified. Due to the significant degree of estimation included, the Group and the council may be subject to further liability that is considered as unquantifiable contingencies (refer to Note F4).
Significant judgements and estimates1 used in calculating provision for weathertightness are: The significant assumptions used to determine the reported and unreported claims are based on single units and multi-units dwelling types, as follows: Reported claims There are 641 dwellings that are currently reported (489 multi and 152 single) with a discontinuance
rate then applied (10% multi and 30% single) Unreported claims Prevalence rates indicate there is an estimated 834 dwellings (770 multi and 64 single) that will notify
in the future with a discontinuance rate then applied (10% multi and 30% single) Reported and Unreported claims The assessed quantum for repair which differs between multi and single Assumed settlement of the assessed quantum is 55% for a multi and 60% for a single Contribution by the council toward the settlement is 66% for multi and 73% for a single Timing of claim payments which is assumed to follow historical trends 1These key inputs are provided by the independent actuaries who performed calculations as the basis of the reported provisions. The expected discounted cash outflow of weathertightness provision is as follows:
2018 2019 2020 2021 2022 2023 2024 2025 2026 2027 Total
$million 44 91 59 19 12 12 12 8 6 2 265 The significant assumptions above that are most sensitive on surplus or deficit are as follows:
2017 2016
10% -10% 10% -10% $million Effect on surplus or deficit Effect on surplus or deficit Amount claimed (26) 26 (25) 25 Council contribution to settlement (26) 26 (25) 25 Settlement level award (26) 26 (25) 25 Discontinuance rate (12) 12 (15) 15
Provision for contaminated land and closed landfills The Group and the council have provided for sites only where contamination has actually been identified and the existing land-use requires remediation. No provision has been made for sites where contamination is not confirmed. This is on the basis that the level of contamination, if any, is unknown and costs cannot be reliably estimated. Due to the significant degree of estimation included, the Group and the council may be subject to further liability that is considered as unquantifiable contingencies (refer to Note F4).

Auckland Council Annual Report 2016/2017
58 | Volume 3: Financial statements
Annual Report 2016/2017
58
Section D: Working capital and equity
D5 Provisions (continued)
Significant judgements and estimates1 used in calculating provision for contaminated land and closed landfills are:
Identified sites where the Group and the council hold resource consent. The provision does not include property with unidentified contamination issues or where the current land-use does not require monitoring or remediation.
Expected future costs based on the expected level of work required to meet each issued resource consent and the current cost of identified monitoring remediation work.
Expected future costs are inflated using the CPI assumptions provided by New Zealand Treasury. Estimated costs are assessed over 30 years, being the average of the resource consent periods. The provision assumes there is no change in land use and discharges complying with consent
conditions. 1These key inputs are provided to the independent actuaries who performed calculations as the basis of the reported provision. Financial guarantees The council is listed as a guarantor to loan arrangements for Eden Park Trust Board and a number of community organisations where in the event of default council is obligated to make loan payments. Until the long-term future of Eden Park is determined, including through ongoing consultation with stakeholders, for the purposes of the calculation of the provision it is assumed the joint security interest held in relation to the guarantee has no determinable value. The Group and the council have fully provided the financial guarantee of $40 million. Other provisions Leave entitlement Included within other provisions is $18 million for the Group and $16 million for the council. This is a provision arising from leave entitlement calculation issues under the Holidays Act 2003 which was disclosed as a contingent liability as at 31 December 2016. Legal claims The Group and the council are subject to certain legal claims. For each claim the likelihood of payment has been assessed and provision recognised where it is probable that the Group and the council will be found liable and costs can be reliably estimated. Provisions are based on assessed costs by legal counsel taking into account claims experience. Legal claims that are not recognised as provisions are disclosed as contingent liabilities in Note F4.
D6 Ratepayer equity
Accounting policy
Ratepayer equity is the Auckland community’s interest in the Group and the council. Ratepayer equity has been classified into various components to identify those portions of equity held for specific purposes. Contributed equity is the net asset and liability position excluding restricted reserves at the time the council was formed.
Group Council
$million 2017 2016 2017 2016 Contributed equity 26,728 26,728 26,569 26,569 Accumulated funds 951 290 (824) (633) Reserves -Asset revaluation reserves
Opening balance 6,103 4,488 2,787 1,631 Transferred from/(to) accumulated funds (26) (7) (7) - Change in fair value recognised during the year 1,468 1,622 - 1,156 Closing balance 7,545 6,103 2,780 2,787

Te Rīpoata ā-Tau 2016/2017 o Te Kaunihera
o Tāmaki Makaurau
Pokanga 3: Ngā Pūrongo Pūtea | 59
Annual Report 2016/2017
58
Section D: Working capital and equity
D5 Provisions (continued)
Significant judgements and estimates1 used in calculating provision for contaminated land and closed landfills are:
Identified sites where the Group and the council hold resource consent. The provision does not include property with unidentified contamination issues or where the current land-use does not require monitoring or remediation.
Expected future costs based on the expected level of work required to meet each issued resource consent and the current cost of identified monitoring remediation work.
Expected future costs are inflated using the CPI assumptions provided by New Zealand Treasury. Estimated costs are assessed over 30 years, being the average of the resource consent periods. The provision assumes there is no change in land use and discharges complying with consent
conditions. 1These key inputs are provided to the independent actuaries who performed calculations as the basis of the reported provision. Financial guarantees The council is listed as a guarantor to loan arrangements for Eden Park Trust Board and a number of community organisations where in the event of default council is obligated to make loan payments. Until the long-term future of Eden Park is determined, including through ongoing consultation with stakeholders, for the purposes of the calculation of the provision it is assumed the joint security interest held in relation to the guarantee has no determinable value. The Group and the council have fully provided the financial guarantee of $40 million. Other provisions Leave entitlement Included within other provisions is $18 million for the Group and $16 million for the council. This is a provision arising from leave entitlement calculation issues under the Holidays Act 2003 which was disclosed as a contingent liability as at 31 December 2016. Legal claims The Group and the council are subject to certain legal claims. For each claim the likelihood of payment has been assessed and provision recognised where it is probable that the Group and the council will be found liable and costs can be reliably estimated. Provisions are based on assessed costs by legal counsel taking into account claims experience. Legal claims that are not recognised as provisions are disclosed as contingent liabilities in Note F4.
D6 Ratepayer equity
Accounting policy
Ratepayer equity is the Auckland community’s interest in the Group and the council. Ratepayer equity has been classified into various components to identify those portions of equity held for specific purposes. Contributed equity is the net asset and liability position excluding restricted reserves at the time the council was formed.
Group Council
$million 2017 2016 2017 2016 Contributed equity 26,728 26,728 26,569 26,569 Accumulated funds 951 290 (824) (633) Reserves -Asset revaluation reserves
Opening balance 6,103 4,488 2,787 1,631 Transferred from/(to) accumulated funds (26) (7) (7) - Change in fair value recognised during the year 1,468 1,622 - 1,156 Closing balance 7,545 6,103 2,780 2,787
Annual Report 2016/2017
Volume 3: Financial statements 59
Section D: Working capital and equity
D6 Ratepayer equity (continued)
Group Council
2017 2016 2017 2016 Reserves -Restricted equity and targeted rates
Opening balance 71 52 67 50 Transfer in/(out) during the year 5 19 5 17 Closing balance 76 71 72 67
-Share of associates’ reserves Opening balance 451 280 - - Change in fair value recognised during the year 2 171 - - Closing balance 453 451 - -
-Available for sale investment revaluation reserve Opening balance 12 10 - - Change in fair value recognised during the year 11 2 - - Closing balance 23 12 - -
-Cash flow hedge reserve Opening balance (3) 4 - - Recycled through surplus or deficit - (6) - - Change in fair value recognised during the year 3 (1) - - Closing balance - (3) - -
Total reserves 8,097 6,634 2,852 2,854 Total ratepayer equity 35,776 33,652 28,597 28,790
Capital management For the purpose of the Group and the council’s capital management, the Group and the council's capital is its ratepayer equity, which comprises contributed equity, reserves and accumulated funds. Equity is represented by net assets. The LGA 2002 (the Act) requires the council to manage the Group’s revenue, expenses, assets, liabilities and general financial dealings prudently and in a manner that promotes the current and future interests of the community. Ratepayer equity is largely managed as a by-product of managing revenue, expenses, assets, liabilities and general financial dealings. In addition, the Local Government (Financial Reporting and Prudence) Regulations 2014 sets out a number of benchmarks for assessing whether the council is managing the Group’s revenue, expenses, assets and liabilities prudently. Refer to Section G for the financial reporting and prudence benchmarks of the Group for the year ended 30 June 2017. The objective of managing the Group and the council’s capital is to achieve intergenerational equity, which is a principle promoted in the Act and applied by the Group and the council. Intergenerational equity requires today's ratepayers to meet the cost of using the Group and council's assets and not expecting them to meet the full cost of long-term assets that will benefit ratepayers in future generations. In order to achieve this objective, the Group and the council also have in place asset management plans for major classes of assets detailing renewal and maintenance programmes to minimise the likelihood of ratepayers in future generations being required to meet the costs of deferred renewals and maintenance. An additional objective of capital management is to ensure that the expenditure needs identified in the Long-term Plan 2015-2025 (LTP) and Annual Budget are met in the manner set out in these plans. The Act requires the council to make adequate and effective provision in the LTP and Annual Budget to meet the expenditure needs identified in those plans. The Act sets out factors that the council is required to consider when determining the most appropriate sources of funding for each of the Group and the council’s activities. The sources and levels of funding are set out in the funding and financial policies of the LTP. The Group and the council monitor actual expenditure incurred against the LTP and Annual Budget. No changes were made in the objectives, policies or processes for managing capital of the Group and the council during the years ended 30 June 2017 and 30 June 2016.

Auckland Council Annual Report 2016/2017
60 | Volume 3: Financial statements
Annual Report 2016/2017
60
Section D: Working capital and equity
D6 Ratepayer equity (continued)
Local government disclosures Restricted equity includes targeted rates and reserves, where use of the funds is specified by statute, trust deed or contract. The reserves funds held by the Group and the council during the year are as follows:
$million Activity Opening balance
Transfers to
reserve
Transfers from
reserve Closing balance Purpose
Trusts and bequests Leys Institute Trust
Capital Local community services 1 - - 1
Libraries equipment and operation
Trusts related to art activities
Regional community services 1 - - 1
Purchase of works of art for the Auckland Art Gallery
Total trusts and bequests 2 - - 2 Reserves and targeted rates
Araparera Forest Reserve Roads and footpaths 3 - - 3
Roading development in the Rodney area
Central City Targeted Rate
Local planning and development 26 22 (17) 31
Development and revitalisation of the city centre
Community Recreation and Sport Fund
Local parks, sports and recreation 3 - - 3
Sport and recreational group initiatives
Financial Assistance Targeted Rates
Roads and footpaths, stormwater and wastewater (1) - - (1)
Financial assistance to the local community
Greenmount Park Development Reserve - ARC
Local parks, sports and recreation 3 - - 3
Conversion of land into a public park and recreation ground
Greenmount Park Development Reserve - AC
Local parks, sports and recreation 9 - - 9
Development of the Styak-Lushington park
Harbourview / Orangihina UAC reserve
Local parks, sports and recreation 1 - - 1
Develop the Harbourview-Orangihina Park
Hobsonville Domain Compensation Reserve
Local parks, sports and recreation 2 - - 2
Hobsonville Domain Replacement project
Manukau Harbour Related Recreational Facilities
Local parks, sports and recreation 2 - - 2
Improvement of costal recreation opportunities
North Shore Holdings Reserve Fund
Regional parks, sports and recreation and local planning and development 4 - (1) 3
Projects approved by Auckland Transition Agency and the legacy North Shore City Council
Off Street Parking Funds
Parking and enforcement 10 - - 10 Off- street parking initiatives
Papakura Golf Course Reserve
Regional parks, sports and recreation - 3 - 3
Development of Papakura Golf course
Targeted Rates Open Spaces/Volcanic Cones
Regional parks, sports and recreation 3 - (1) 2
Purchase of open spaces and maintenance and enhancement of volcanic cones
Waste Minimisation Reserve
Solid waste and environmental services 4 - (1) 3
Ministry for the Environment levies for waste minimisation initiatives
Total reserves and targeted rates 69 25 (20) 74 Total reserve funds 71 25 (20) 76

Te Rīpoata ā-Tau 2016/2017 o Te Kaunihera
o Tāmaki Makaurau
Pokanga 3: Ngā Pūrongo Pūtea | 61
Annual Report 2016/2017
60
Section D: Working capital and equity
D6 Ratepayer equity (continued)
Local government disclosures Restricted equity includes targeted rates and reserves, where use of the funds is specified by statute, trust deed or contract. The reserves funds held by the Group and the council during the year are as follows:
$million Activity Opening balance
Transfers to
reserve
Transfers from
reserve Closing balance Purpose
Trusts and bequests Leys Institute Trust
Capital Local community services 1 - - 1
Libraries equipment and operation
Trusts related to art activities
Regional community services 1 - - 1
Purchase of works of art for the Auckland Art Gallery
Total trusts and bequests 2 - - 2 Reserves and targeted rates
Araparera Forest Reserve Roads and footpaths 3 - - 3
Roading development in the Rodney area
Central City Targeted Rate
Local planning and development 26 22 (17) 31
Development and revitalisation of the city centre
Community Recreation and Sport Fund
Local parks, sports and recreation 3 - - 3
Sport and recreational group initiatives
Financial Assistance Targeted Rates
Roads and footpaths, stormwater and wastewater (1) - - (1)
Financial assistance to the local community
Greenmount Park Development Reserve - ARC
Local parks, sports and recreation 3 - - 3
Conversion of land into a public park and recreation ground
Greenmount Park Development Reserve - AC
Local parks, sports and recreation 9 - - 9
Development of the Styak-Lushington park
Harbourview / Orangihina UAC reserve
Local parks, sports and recreation 1 - - 1
Develop the Harbourview-Orangihina Park
Hobsonville Domain Compensation Reserve
Local parks, sports and recreation 2 - - 2
Hobsonville Domain Replacement project
Manukau Harbour Related Recreational Facilities
Local parks, sports and recreation 2 - - 2
Improvement of costal recreation opportunities
North Shore Holdings Reserve Fund
Regional parks, sports and recreation and local planning and development 4 - (1) 3
Projects approved by Auckland Transition Agency and the legacy North Shore City Council
Off Street Parking Funds
Parking and enforcement 10 - - 10 Off- street parking initiatives
Papakura Golf Course Reserve
Regional parks, sports and recreation - 3 - 3
Development of Papakura Golf course
Targeted Rates Open Spaces/Volcanic Cones
Regional parks, sports and recreation 3 - (1) 2
Purchase of open spaces and maintenance and enhancement of volcanic cones
Waste Minimisation Reserve
Solid waste and environmental services 4 - (1) 3
Ministry for the Environment levies for waste minimisation initiatives
Total reserves and targeted rates 69 25 (20) 74 Total reserve funds 71 25 (20) 76
Annual Report 2016/2017
Volume 3: Financial statements 61
Section E: Financial risk management
This section provides information on how the Group and the council is exposed to a variety of financial risks and how these risks are managed under the treasury management policies.
The risk management of the Group and the council focuses on financial market uncertainty and seeks to minimise potential adverse effects on the financial performance of the Group and the council.
The following are the financial risks significant to the Group and the council:
E1 Foreign exchange risk
E2 Interest rate risk
E3 Credit risk
E4 Liquidity risk

Auckland Council Annual Report 2016/2017
62 | Volume 3: Financial statements
Annual Report 2016/2017
62
Section E: Financial risk management
E1 Foreign exchange risk Risk exposure Foreign exchange risk arises as a result of the Group and the council’s transactions that are denominated in a currency other than NZD. The NZD may deteriorate against the relevant foreign currency from the period between when the transaction was entered and when foreign currency payments are made. The council has two offshore borrowing programmes that are exposed to foreign exchange risk with foreign denominated borrowings of $2,661 million at 30 June 2017 (30 June 2016: $1,471 million). Approximately 40% is in Euro (30 June 2016: 19%), 25% in Australian dollar (30 June 2016: 30%), 20% in Swiss franc (30 June 2016: 32%), and 15% in Norwegian krone (30 June 2016: 19%). Refer to Note C1 for the total foreign currency denominated borrowings of the Group and the council. Risk management The council manages foreign currency risk of the Group apart from Watercare and POAL. Foreign exchange risk of all entities under the Group is managed through derivative financial instruments. The risk is mitigated by entering into forward foreign currency exchange contracts where the threshold is set by the treasury management policies. The risk on offshore borrowings is offset by cross-currency interest rate swaps over the life of the borrowings. Refer to Note C2 for the derivative financial instruments. Measurement of risk At 30 June 2017, the Group and the council do not have remaining material exposure to foreign exchange risk since all foreign currency denominated borrowings and material purchases are hedged (30 June 2016: none).
E2 Interest rate risk Risk exposure Interest rate risk is the risk that the Group and the council are exposed to adverse changes in interest rates which will result in net financing costs exceeding Annual Budget or LTP forecasts. The Group and the council are exposed to interest rate risk on all debt obligations and cash investments. Risk management The council manages the interest rate risk of the Group apart from Watercare and POAL. The objective of interest rate risk management is to reduce uncertainty around net finance costs as interest rates change. Mechanisms used are: matching the interest rate risk profile of the Group and the council’s financial assets and liabilities; fixing rates through fixed rate borrowings or interest rate hedging instruments to fix rates on floating
rate borrowings; and forward-starting fixed interest rate swaps to hedge the base rate on anticipated borrowings. As at 30 June 2017, the Group and the council have the following forward start swaps:
Group $million Financial year Effective start date 2018 2019 2020 2021 2022 2023 2024 Term 2 years - 10 - - - - - 4 years 55 - - - - - - 5 years - - 150 15 50 50 205 7 years 325 375 150 200 300 450 200 8 years 20 - - - - - - 9 years 20 - - - 30 - - 10 years 150 115 100 50 80 - - Total 570 500 400 265 460 500 405 Average rate 4.81% 4.27% 4.15% 3.87% 4.17% 3.60% 3.80%

Te Rīpoata ā-Tau 2016/2017 o Te Kaunihera
o Tāmaki Makaurau
Pokanga 3: Ngā Pūrongo Pūtea | 63
Annual Report 2016/2017
62
Section E: Financial risk management
E1 Foreign exchange risk Risk exposure Foreign exchange risk arises as a result of the Group and the council’s transactions that are denominated in a currency other than NZD. The NZD may deteriorate against the relevant foreign currency from the period between when the transaction was entered and when foreign currency payments are made. The council has two offshore borrowing programmes that are exposed to foreign exchange risk with foreign denominated borrowings of $2,661 million at 30 June 2017 (30 June 2016: $1,471 million). Approximately 40% is in Euro (30 June 2016: 19%), 25% in Australian dollar (30 June 2016: 30%), 20% in Swiss franc (30 June 2016: 32%), and 15% in Norwegian krone (30 June 2016: 19%). Refer to Note C1 for the total foreign currency denominated borrowings of the Group and the council. Risk management The council manages foreign currency risk of the Group apart from Watercare and POAL. Foreign exchange risk of all entities under the Group is managed through derivative financial instruments. The risk is mitigated by entering into forward foreign currency exchange contracts where the threshold is set by the treasury management policies. The risk on offshore borrowings is offset by cross-currency interest rate swaps over the life of the borrowings. Refer to Note C2 for the derivative financial instruments. Measurement of risk At 30 June 2017, the Group and the council do not have remaining material exposure to foreign exchange risk since all foreign currency denominated borrowings and material purchases are hedged (30 June 2016: none).
E2 Interest rate risk Risk exposure Interest rate risk is the risk that the Group and the council are exposed to adverse changes in interest rates which will result in net financing costs exceeding Annual Budget or LTP forecasts. The Group and the council are exposed to interest rate risk on all debt obligations and cash investments. Risk management The council manages the interest rate risk of the Group apart from Watercare and POAL. The objective of interest rate risk management is to reduce uncertainty around net finance costs as interest rates change. Mechanisms used are: matching the interest rate risk profile of the Group and the council’s financial assets and liabilities; fixing rates through fixed rate borrowings or interest rate hedging instruments to fix rates on floating
rate borrowings; and forward-starting fixed interest rate swaps to hedge the base rate on anticipated borrowings. As at 30 June 2017, the Group and the council have the following forward start swaps:
Group $million Financial year Effective start date 2018 2019 2020 2021 2022 2023 2024 Term 2 years - 10 - - - - - 4 years 55 - - - - - - 5 years - - 150 15 50 50 205 7 years 325 375 150 200 300 450 200 8 years 20 - - - - - - 9 years 20 - - - 30 - - 10 years 150 115 100 50 80 - - Total 570 500 400 265 460 500 405 Average rate 4.81% 4.27% 4.15% 3.87% 4.17% 3.60% 3.80%
Annual Report 2016/2017
Volume 3: Financial statements 63
Section E: Financial risk management
E2 Interest rate risk (continued) Council $million Financial year Effective start date 2018 2019 2020 2021 2022 2023 2024 Term 5 years - - 150 - 50 50 205 7 years 325 375 150 200 300 450 200 10 years 150 75 100 50 - - - Total 475 450 400 250 350 500 405 Average rate 4.74% 4.19% 4.15% 3.76% 3.98% 3.60% 3.80%
The tables above outline the notional values of forward-start swaps the Group and the council entered into, the financial year in which they become effective and the terms from the start date. As at 30 June 2017, the Group has the following interest rate options:
$million 2017
2016 Interest rate options
Notional value Cap rate Floor rate Notional
value Cap rate Floor rate
4 to 5 years 50 5.25% 4.35% - - - Beyond 5 years - - - 50 5.25% 4.35%
Risk measurement The council’s Treasury Management Policy contains the interest rate exposure policy giving the basis for how compliance is measured. The Group and the council measure the risk through sensitivity analysis which is based on possible movement in interest rates, with all other variables held constant, measured as a basis points (bps) movement. The impact on potential surplus or deficit and equity (excluding accumulated funds) calculated using the Group and the council’s financial instrument exposures at balance date are as follows:
Group Council
-100bps/-1% +100bps/+1% -100bps/-1% +100bps/+1%
$million Surplus/ (deficit) Equity
Surplus/ (deficit) Equity
Surplus/ (deficit) Equity
Surplus/ (deficit) Equity
2017 Cash and cash equivalents and term deposits (3) - 3 - (3) - 3 -
Derivative financial instruments1 (292) (6) 254 6 (211) - 179 - Loans to related parties - - - - (12) - 12 - Fixed rate borrowings (repricing within next 12 months) 5 - (5) - 5 - (5) -
Floating rate borrowings 30 - (30) - 25 - (25) - Other financial assets (1) - 1 (1) - 1 - Total sensitivity to interest rate risk (261) (6) 223 6 (197) - 165 -
2016 Cash and cash equivalents and term deposits (1) - 1 - (1) - 1 -
Derivative financial instruments1 (390) (6) 352 6 (290) - 261 - Loans to related parties - - - - (10) - 10 - Fixed rate borrowings (repricing within next 12 months) 5 - (5) - 2 - (2) -
Floating rate borrowings 28 - (28) - 25 - (25) - Other financial assets (1) - 1 - (1) - 1 -
Total sensitivity to interest rate risk (359) (6) 321 6 (275) - 246 -
1 The sensitivity for derivatives (excluding basis swaps) has been calculated using a derivative valuation model based on a parallel shift in interest rates of plus and minus 100 basis points.
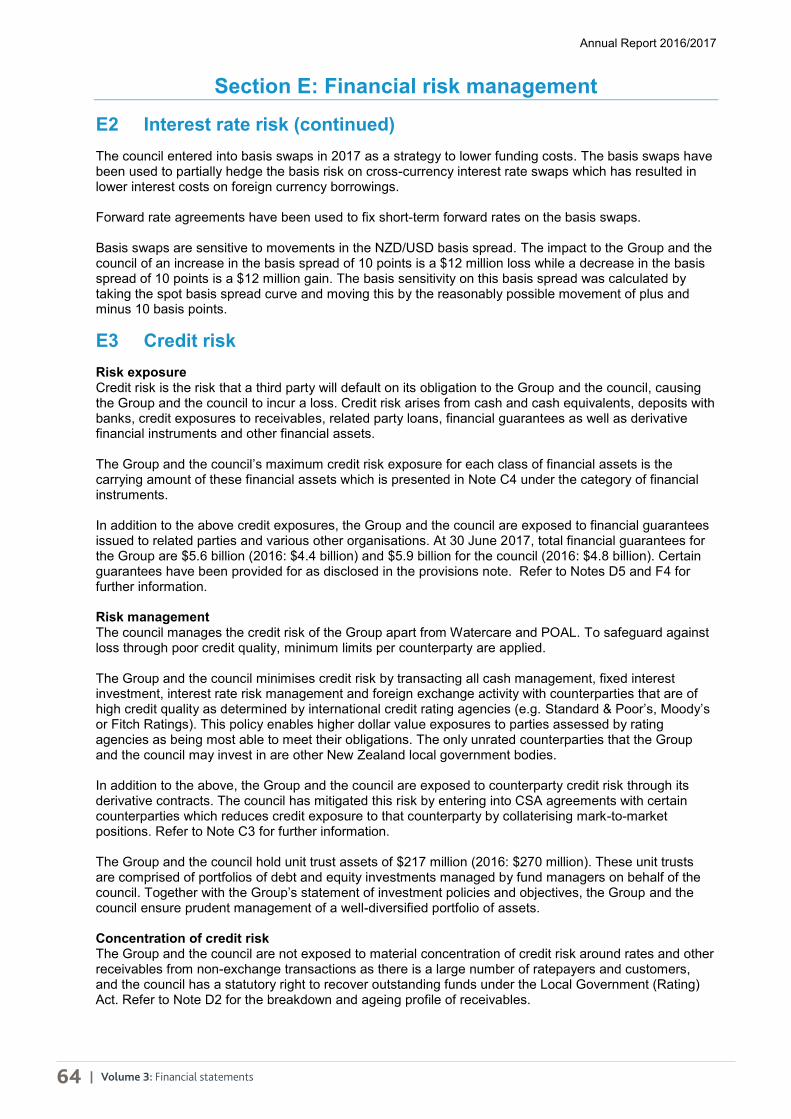
Auckland Council Annual Report 2016/2017
64 | Volume 3: Financial statements
Annual Report 2016/2017
64
Section E: Financial risk management
E2 Interest rate risk (continued)
The council entered into basis swaps in 2017 as a strategy to lower funding costs. The basis swaps have been used to partially hedge the basis risk on cross-currency interest rate swaps which has resulted in lower interest costs on foreign currency borrowings. Forward rate agreements have been used to fix short-term forward rates on the basis swaps. Basis swaps are sensitive to movements in the NZD/USD basis spread. The impact to the Group and the council of an increase in the basis spread of 10 points is a $12 million loss while a decrease in the basis spread of 10 points is a $12 million gain. The basis sensitivity on this basis spread was calculated by taking the spot basis spread curve and moving this by the reasonably possible movement of plus and minus 10 basis points.
E3 Credit risk Risk exposure Credit risk is the risk that a third party will default on its obligation to the Group and the council, causing the Group and the council to incur a loss. Credit risk arises from cash and cash equivalents, deposits with banks, credit exposures to receivables, related party loans, financial guarantees as well as derivative financial instruments and other financial assets. The Group and the council’s maximum credit risk exposure for each class of financial assets is the carrying amount of these financial assets which is presented in Note C4 under the category of financial instruments. In addition to the above credit exposures, the Group and the council are exposed to financial guarantees issued to related parties and various other organisations. At 30 June 2017, total financial guarantees for the Group are $5.6 billion (2016: $4.4 billion) and $5.9 billion for the council (2016: $4.8 billion). Certain guarantees have been provided for as disclosed in the provisions note. Refer to Notes D5 and F4 for further information. Risk management The council manages the credit risk of the Group apart from Watercare and POAL. To safeguard against loss through poor credit quality, minimum limits per counterparty are applied. The Group and the council minimises credit risk by transacting all cash management, fixed interest investment, interest rate risk management and foreign exchange activity with counterparties that are of high credit quality as determined by international credit rating agencies (e.g. Standard & Poor’s, Moody’s or Fitch Ratings). This policy enables higher dollar value exposures to parties assessed by rating agencies as being most able to meet their obligations. The only unrated counterparties that the Group and the council may invest in are other New Zealand local government bodies. In addition to the above, the Group and the council are exposed to counterparty credit risk through its derivative contracts. The council has mitigated this risk by entering into CSA agreements with certain counterparties which reduces credit exposure to that counterparty by collaterising mark-to-market positions. Refer to Note C3 for further information. The Group and the council hold unit trust assets of $217 million (2016: $270 million). These unit trusts are comprised of portfolios of debt and equity investments managed by fund managers on behalf of the council. Together with the Group’s statement of investment policies and objectives, the Group and the council ensure prudent management of a well-diversified portfolio of assets. Concentration of credit risk The Group and the council are not exposed to material concentration of credit risk around rates and other receivables from non-exchange transactions as there is a large number of ratepayers and customers, and the council has a statutory right to recover outstanding funds under the Local Government (Rating) Act. Refer to Note D2 for the breakdown and ageing profile of receivables.

Te Rīpoata ā-Tau 2016/2017 o Te Kaunihera
o Tāmaki Makaurau
Pokanga 3: Ngā Pūrongo Pūtea | 65
Annual Report 2016/2017
64
Section E: Financial risk management
E2 Interest rate risk (continued)
The council entered into basis swaps in 2017 as a strategy to lower funding costs. The basis swaps have been used to partially hedge the basis risk on cross-currency interest rate swaps which has resulted in lower interest costs on foreign currency borrowings. Forward rate agreements have been used to fix short-term forward rates on the basis swaps. Basis swaps are sensitive to movements in the NZD/USD basis spread. The impact to the Group and the council of an increase in the basis spread of 10 points is a $12 million loss while a decrease in the basis spread of 10 points is a $12 million gain. The basis sensitivity on this basis spread was calculated by taking the spot basis spread curve and moving this by the reasonably possible movement of plus and minus 10 basis points.
E3 Credit risk Risk exposure Credit risk is the risk that a third party will default on its obligation to the Group and the council, causing the Group and the council to incur a loss. Credit risk arises from cash and cash equivalents, deposits with banks, credit exposures to receivables, related party loans, financial guarantees as well as derivative financial instruments and other financial assets. The Group and the council’s maximum credit risk exposure for each class of financial assets is the carrying amount of these financial assets which is presented in Note C4 under the category of financial instruments. In addition to the above credit exposures, the Group and the council are exposed to financial guarantees issued to related parties and various other organisations. At 30 June 2017, total financial guarantees for the Group are $5.6 billion (2016: $4.4 billion) and $5.9 billion for the council (2016: $4.8 billion). Certain guarantees have been provided for as disclosed in the provisions note. Refer to Notes D5 and F4 for further information. Risk management The council manages the credit risk of the Group apart from Watercare and POAL. To safeguard against loss through poor credit quality, minimum limits per counterparty are applied. The Group and the council minimises credit risk by transacting all cash management, fixed interest investment, interest rate risk management and foreign exchange activity with counterparties that are of high credit quality as determined by international credit rating agencies (e.g. Standard & Poor’s, Moody’s or Fitch Ratings). This policy enables higher dollar value exposures to parties assessed by rating agencies as being most able to meet their obligations. The only unrated counterparties that the Group and the council may invest in are other New Zealand local government bodies. In addition to the above, the Group and the council are exposed to counterparty credit risk through its derivative contracts. The council has mitigated this risk by entering into CSA agreements with certain counterparties which reduces credit exposure to that counterparty by collaterising mark-to-market positions. Refer to Note C3 for further information. The Group and the council hold unit trust assets of $217 million (2016: $270 million). These unit trusts are comprised of portfolios of debt and equity investments managed by fund managers on behalf of the council. Together with the Group’s statement of investment policies and objectives, the Group and the council ensure prudent management of a well-diversified portfolio of assets. Concentration of credit risk The Group and the council are not exposed to material concentration of credit risk around rates and other receivables from non-exchange transactions as there is a large number of ratepayers and customers, and the council has a statutory right to recover outstanding funds under the Local Government (Rating) Act. Refer to Note D2 for the breakdown and ageing profile of receivables.
Annual Report 2016/2017
Volume 3: Financial statements 65
Section E: Financial risk management
E3 Credit risk (continued) The council identifies concentration risk in relation to loans to related parties based on the capital programme of the related parties driven by the LTP. Loans to Auckland Transport and Watercare amounted to $509 million and $1,302 million, respectively (2016: $496 million and $1,133 million). Risk measurement Rated counterparties At balance date, $591 million (2016: $514 million) of assets with credit risk held by the Group and $1.8 billion (2016: $1.6 billion) of assets with credit risk held by the council have a Standard & Poor’s rating (or equivalent) of single A or better. There have been no defaults by any of the Group and the council’s rated counterparties. Unrated counterparties Unrated counterparties that the Group and the council may invest in are other New Zealand local government bodies. The council’s unit trust holdings do not have credit ratings at a portfolio level; however, the management of the unit trust assets are subject to internal operational investment policies and an objectives document. This document details the investment strategy, liquidity rules, performance goals and responsibilities of participants. No unrated counterparties have defaulted in the past with the exception of certain community loans within other financial assets. In the year to 30 June 2017 the Group and the council have no community loan counterparties that defaulted (2016: nil). Rates and other receivables Receivables mainly arise from the Group and the council’s statutory functions, therefore there are no procedures in place to monitor or report the credit quality of receivables with reference to internal and external credit ratings.
E4 Liquidity risk Risk exposure Liquidity risk is the risk that the Group and the council will encounter difficulty raising funds to meet commitments as they fall due. Risk management The council manages the liquidity risk of the Group except for POAL and certain aspects relating to Watercare. Where the council has a long-term or ongoing need for core borrowings, lengthy borrowing terms are attractive as they eliminate short-term liquidity risk (the risk of not being able to roll over short-term debt as it matures). Borrowings are maintained in accordance with treasury policies including liability management policies. The diversification of borrowings and limits on the level of debt maturing at any point in time mitigates exposure to both concentration and refinancing risks. The Group and the council also use committed bank facilities and set-off arrangements to manage its liquidity risk. Overdraft facilities of $12 million (2016: $22 million) and undrawn bank facilities of $1.5 billion (2016: $1.1 billion) will mature between July 2018 and July 2020. The undrawn bank facilities include council’s syndicated committed cash advance facility of $1.0 billion (2016: $800 million) which can be drawn at any time. Contractual maturity analysis The tables on the following pages summarise the maturity profile of the Group and the council’s financial liabilities which shows the timing of the cash outflows and the maturity profile of financial assets held by the Group and the council which are readily saleable or expected to generate cash inflows to meet the cash outflows of the financial liabilities. The amounts disclosed are undiscounted contractual cash flows which include interest payable.

Auckland Council Annual Report 2016/2017
66 | Volume 3: Financial statements
Ann
ual R
epor
t 201
6/20
17
66
Sect
ion
E: F
inan
cial
risk
man
agem
ent
E4
Liqu
idity
risk
(con
tinue
d)
Gro
up
2017
20
16
$mill
ion
Car
ryin
g am
ount
O
n de
man
d <1
ye
ar
1-2
year
s 2-
5 ye
ars
5-10
ye
ars
>10
year
s To
tal
cont
ract
ual
cash
flow
s C
arry
ing
amou
nt
On
dem
and
<1
year
1-
2 ye
ars
2-5
year
s 5-
10
year
s >1
0 ye
ars
Tota
l co
ntra
ctua
l ca
sh fl
ows
Non
-der
ivat
ive
finan
cial
ass
ets
Cas
h an
d ca
sh e
quiv
alen
ts
337
332
6 -
- -
- 33
8 13
7 13
2 5
- -
- -
137
Rec
eiva
bles
(exc
ludi
ng p
repa
ymen
ts)
331
35
294
3 -
- -
332
279
21
237
21
- -
- 27
9 O
ther
fina
ncia
l ass
ets
417
275
42
22
38
37
22
436
517
349
77
18
46
20
19
529
Tota
l Non
-der
ivat
ive
finan
cial
ass
ets
1,08
5 64
2 34
2 25
38
37
22
1,
106
933
502
319
39
46
20
19
945
Der
ivat
ive
finan
cial
ass
ets
Der
ivat
ive
finan
cial
ass
ets
net s
ettle
d 59
-
20
13
13
17
14
77
57
- 14
16
31
9
- 70
D
eriv
ativ
e fin
anci
al a
sset
s gr
oss
settl
ed1
111
- (3
0)
(38)
(1
49)
(169
) (8
4)
(470
) 20
6 -
(10)
(1
0)
(34)
(2
7)
(66)
(1
47)
Inflo
ws
-
35
60
72
1,50
2 33
2 2,
001
-
25
24
73
864
263
1,24
9 O
utflo
ws
-
(65)
(9
8)
(221
) (1
,671
) (4
16)
(2,4
71)
-
(35)
(3
4)
(107
) (8
91)
(329
) (1
,396
) To
tal d
eriv
ativ
e fin
anci
al a
sset
s 17
0 -
(10)
(2
5)
(136
) (1
52)
(70)
(3
93)
263
- 4
6 (3
) (1
8)
(66)
(7
7)
Tota
l fin
anci
al a
sset
s 1,
255
642
332
- (9
8)
(115
) (4
8)
713
1,19
6 50
2 32
3 45
43
2
(47)
86
8 N
on-d
eriv
ativ
e fin
anci
al li
abili
ties
Ban
k ov
erdr
aft
6 6
- -
- -
- 6
9 9
- -
- -
- 9
Pay
able
s an
d ac
crua
ls (e
xclu
ding
inco
me
re
ceiv
ed in
adv
ance
) 65
6 76
57
8 2
- -
- 65
6 57
3 40
53
2 1
- -
- 57
3
Sec
ured
bor
row
ings
7,
704
- 1,
206
782
2,51
4 3,
758
961
9,22
1 6,
919
- 1,
389
883
2,62
5 2,
258
1,03
6 8,
191
Uns
ecur
ed b
orro
win
gs
596
- 16
5 28
2 17
4 -
- 62
1 69
1 -
318
64
347
- -
729
Fina
ncia
l gua
rant
ees2
42
5,58
0 -
- -
- -
5,58
0 16
4,
369
- -
- -
- 4,
369
Tota
l non
-der
ivat
ive
finan
cial
liab
ilitie
s 9,
004
5,66
2 1,
949
1,06
6 2,
688
3,75
8 96
1 16
,084
8,
208
4,41
8 2,
239
948
2,97
2 2,
258
1,03
6 13
,871
D
eriv
ativ
e fin
anci
al li
abili
ties
Der
ivat
ive
finan
cial
liab
ilitie
s ne
t set
tled
762
- 17
0 14
9 32
1 24
4 45
92
9 1,
175
1 11
9 16
5 50
0 50
9 99
1,
393
Der
ivat
ive
finan
cial
liab
ilitie
s gr
oss
settl
ed1
110
- 3
5 82
96
10
2 28
8 40
(2
) (5
) 1
7 74
72
14
7 In
flow
s
- (1
85)
(39)
(3
33)
(356
) (6
39)
(1,5
52)
(3
3)
(95)
(2
5)
(58)
(3
03)
(339
) (8
53)
Out
flow
s
- 18
8 44
41
5 45
2 74
1 1,
840
31
90
26
65
37
7 41
1 1,
000
Tota
l der
ivat
ive
finan
cial
liab
ilitie
s 87
2 -
173
154
403
340
147
1,21
7 1,
215
(1)
114
166
507
583
171
1,54
0 To
tal f
inan
cial
liab
ilitie
s 9,
876
5,66
2 2,
122
1,22
0 3,
091
4,09
8 1,
108
17,3
01
9,42
3 4,
417
2,35
3 1,
114
3,47
9 2,
841
1,20
7 15
,411
N
et c
ontr
actu
al c
ash
flow
s (8
,621
) (5
,020
) (1
,790
) (1
,220
) (3
,189
) (4
,213
) (1
,156
) (1
6,58
8)
(8,2
27)
(3,9
15)
(2,0
30)
(1,0
69)
(3,4
36)
(2,8
39)
(1,2
54)
(14,
543)
1 In
clud
es b
oth
forw
ard
fore
ign
exch
ange
con
tract
s an
d cr
oss-
curr
ency
inte
rest
rate
sw
aps;
the
fore
ign
curre
ncy
leg
of th
e ca
sh fl
ows
is tr
ansl
ated
at t
he s
pot r
ate
as a
t 30
June
.
2 Ba
sed
on th
e m
atur
ity p
rofil
es a
bove
, the
cou
ncil
is a
lso
expo
sed
to li
quid
ity ri
sk a
s a
guar
anto
r of a
ll of
the
LGFA
’s b
orro
win
gs. T
he in
form
atio
n on
the
LGFA
bor
row
ings
is d
iscl
osed
in n
ote
F4. T
his
guar
ante
e be
com
es c
alla
ble
in th
e ev
ent
of t
he L
GFA
faili
ng to
pay
its
borr
owin
gs w
hen
they
fall
due.
How
ever
, thi
s is
not
con
side
red
a si
gnifi
cant
risk
as
it is
not
ant
icip
ated
that
the
guar
ante
e w
ill b
ecom
e pa
yabl
e.
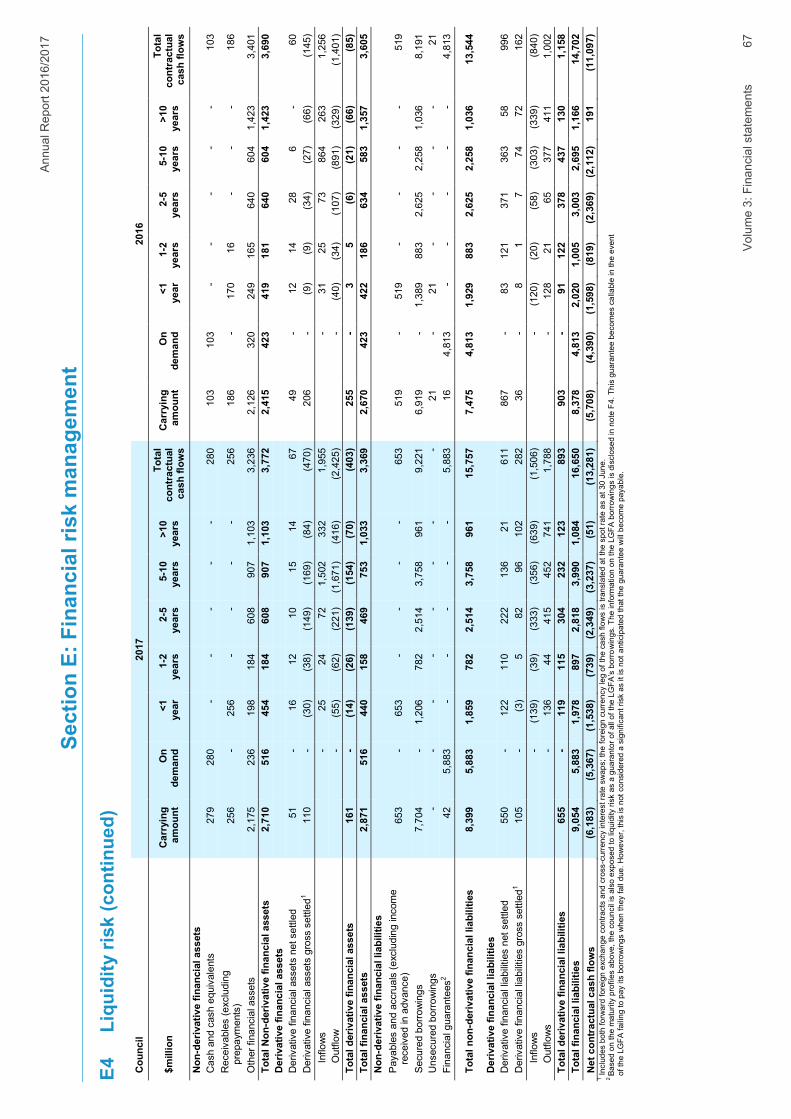
Te Rīpoata ā-Tau 2016/2017 o Te Kaunihera
o Tāmaki Makaurau
Pokanga 3: Ngā Pūrongo Pūtea | 67
Ann
ual R
epor
t 201
6/20
17
66
Sect
ion
E: F
inan
cial
risk
man
agem
ent
E4
Liqu
idity
risk
(con
tinue
d)
Gro
up
2017
20
16
$mill
ion
Car
ryin
g am
ount
O
n de
man
d <1
ye
ar
1-2
year
s 2-
5 ye
ars
5-10
ye
ars
>10
year
s To
tal
cont
ract
ual
cash
flow
s C
arry
ing
amou
nt
On
dem
and
<1
year
1-
2 ye
ars
2-5
year
s 5-
10
year
s >1
0 ye
ars
Tota
l co
ntra
ctua
l ca
sh fl
ows
Non
-der
ivat
ive
finan
cial
ass
ets
Cas
h an
d ca
sh e
quiv
alen
ts
337
332
6 -
- -
- 33
8 13
7 13
2 5
- -
- -
137
Rec
eiva
bles
(exc
ludi
ng p
repa
ymen
ts)
331
35
294
3 -
- -
332
279
21
237
21
- -
- 27
9 O
ther
fina
ncia
l ass
ets
417
275
42
22
38
37
22
436
517
349
77
18
46
20
19
529
Tota
l Non
-der
ivat
ive
finan
cial
ass
ets
1,08
5 64
2 34
2 25
38
37
22
1,
106
933
502
319
39
46
20
19
945
Der
ivat
ive
finan
cial
ass
ets
Der
ivat
ive
finan
cial
ass
ets
net s
ettle
d 59
-
20
13
13
17
14
77
57
- 14
16
31
9
- 70
D
eriv
ativ
e fin
anci
al a
sset
s gr
oss
settl
ed1
111
- (3
0)
(38)
(1
49)
(169
) (8
4)
(470
) 20
6 -
(10)
(1
0)
(34)
(2
7)
(66)
(1
47)
Inflo
ws
-
35
60
72
1,50
2 33
2 2,
001
-
25
24
73
864
263
1,24
9 O
utflo
ws
-
(65)
(9
8)
(221
) (1
,671
) (4
16)
(2,4
71)
-
(35)
(3
4)
(107
) (8
91)
(329
) (1
,396
) To
tal d
eriv
ativ
e fin
anci
al a
sset
s 17
0 -
(10)
(2
5)
(136
) (1
52)
(70)
(3
93)
263
- 4
6 (3
) (1
8)
(66)
(7
7)
Tota
l fin
anci
al a
sset
s 1,
255
642
332
- (9
8)
(115
) (4
8)
713
1,19
6 50
2 32
3 45
43
2
(47)
86
8 N
on-d
eriv
ativ
e fin
anci
al li
abili
ties
Ban
k ov
erdr
aft
6 6
- -
- -
- 6
9 9
- -
- -
- 9
Pay
able
s an
d ac
crua
ls (e
xclu
ding
inco
me
re
ceiv
ed in
adv
ance
) 65
6 76
57
8 2
- -
- 65
6 57
3 40
53
2 1
- -
- 57
3
Sec
ured
bor
row
ings
7,
704
- 1,
206
782
2,51
4 3,
758
961
9,22
1 6,
919
- 1,
389
883
2,62
5 2,
258
1,03
6 8,
191
Uns
ecur
ed b
orro
win
gs
596
- 16
5 28
2 17
4 -
- 62
1 69
1 -
318
64
347
- -
729
Fina
ncia
l gua
rant
ees2
42
5,58
0 -
- -
- -
5,58
0 16
4,
369
- -
- -
- 4,
369
Tota
l non
-der
ivat
ive
finan
cial
liab
ilitie
s 9,
004
5,66
2 1,
949
1,06
6 2,
688
3,75
8 96
1 16
,084
8,
208
4,41
8 2,
239
948
2,97
2 2,
258
1,03
6 13
,871
D
eriv
ativ
e fin
anci
al li
abili
ties
Der
ivat
ive
finan
cial
liab
ilitie
s ne
t set
tled
762
- 17
0 14
9 32
1 24
4 45
92
9 1,
175
1 11
9 16
5 50
0 50
9 99
1,
393
Der
ivat
ive
finan
cial
liab
ilitie
s gr
oss
settl
ed1
110
- 3
5 82
96
10
2 28
8 40
(2
) (5
) 1
7 74
72
14
7 In
flow
s
- (1
85)
(39)
(3
33)
(356
) (6
39)
(1,5
52)
(3
3)
(95)
(2
5)
(58)
(3
03)
(339
) (8
53)
Out
flow
s
- 18
8 44
41
5 45
2 74
1 1,
840
31
90
26
65
37
7 41
1 1,
000
Tota
l der
ivat
ive
finan
cial
liab
ilitie
s 87
2 -
173
154
403
340
147
1,21
7 1,
215
(1)
114
166
507
583
171
1,54
0 To
tal f
inan
cial
liab
ilitie
s 9,
876
5,66
2 2,
122
1,22
0 3,
091
4,09
8 1,
108
17,3
01
9,42
3 4,
417
2,35
3 1,
114
3,47
9 2,
841
1,20
7 15
,411
N
et c
ontr
actu
al c
ash
flow
s (8
,621
) (5
,020
) (1
,790
) (1
,220
) (3
,189
) (4
,213
) (1
,156
) (1
6,58
8)
(8,2
27)
(3,9
15)
(2,0
30)
(1,0
69)
(3,4
36)
(2,8
39)
(1,2
54)
(14,
543)
1 In
clud
es b
oth
forw
ard
fore
ign
exch
ange
con
tract
s an
d cr
oss-
curr
ency
inte
rest
rate
sw
aps;
the
fore
ign
curre
ncy
leg
of th
e ca
sh fl
ows
is tr
ansl
ated
at t
he s
pot r
ate
as a
t 30
June
.
2 Ba
sed
on th
e m
atur
ity p
rofil
es a
bove
, the
cou
ncil
is a
lso
expo
sed
to li
quid
ity ri
sk a
s a
guar
anto
r of a
ll of
the
LGFA
’s b
orro
win
gs. T
he in
form
atio
n on
the
LGFA
bor
row
ings
is d
iscl
osed
in n
ote
F4. T
his
guar
ante
e be
com
es c
alla
ble
in th
e ev
ent
of t
he L
GFA
faili
ng to
pay
its
borr
owin
gs w
hen
they
fall
due.
How
ever
, thi
s is
not
con
side
red
a si
gnifi
cant
risk
as
it is
not
ant
icip
ated
that
the
guar
ante
e w
ill b
ecom
e pa
yabl
e.
Ann
ual R
epor
t 201
6/20
17
Vol
ume
3: F
inan
cial
sta
tem
ents
6
7
Sect
ion
E: F
inan
cial
risk
man
agem
ent
E4
Liqu
idity
risk
(con
tinue
d)
Cou
ncil
2017
20
16
$mill
ion
Car
ryin
g am
ount
O
n de
man
d <1
ye
ar
1-2
year
s 2-
5 ye
ars
5-10
ye
ars
>10
year
s To
tal
cont
ract
ual
cash
flow
s C
arry
ing
amou
nt
On
dem
and
<1
year
1-
2 ye
ars
2-5
year
s 5-
10
year
s >1
0 ye
ars
Tota
l co
ntra
ctua
l ca
sh fl
ows
Non
-der
ivat
ive
finan
cial
ass
ets
Cas
h an
d ca
sh e
quiv
alen
ts
279
280
- -
- -
- 28
0 10
3 10
3 -
- -
- -
103
Rec
eiva
bles
(exc
ludi
ng
pr
epay
men
ts)
256
- 25
6 -
- -
- 25
6 18
6 -
170
16
- -
- 18
6
Oth
er fi
nanc
ial a
sset
s 2,
175
236
198
184
608
907
1,10
3 3,
236
2,12
6 32
0 24
9 16
5 64
0 60
4 1,
423
3,40
1 To
tal N
on-d
eriv
ativ
e fin
anci
al a
sset
s 2,
710
516
454
184
608
907
1,10
3 3,
772
2,41
5 42
3 41
9 18
1 64
0 60
4 1,
423
3,69
0 D
eriv
ativ
e fin
anci
al a
sset
s
D
eriv
ativ
e fin
anci
al a
sset
s ne
t set
tled
51
- 16
12
10
15
14
67
49
-
12
14
28
6 -
60
Der
ivat
ive
finan
cial
ass
ets
gros
s se
ttled
1 11
0 -
(30)
(3
8)
(149
) (1
69)
(84)
(4
70)
206
- (9
) (9
) (3
4)
(27)
(6
6)
(145
) In
flow
s
- 25
24
72
1,
502
332
1,95
5
- 31
25
73
86
4 26
3 1,
256
Out
flow
- (5
5)
(62)
(2
21)
(1,6
71)
(416
) (2
,425
)
- (4
0)
(34)
(1
07)
(891
) (3
29)
(1,4
01)
Tota
l der
ivat
ive
finan
cial
ass
ets
161
- (1
4)
(26)
(1
39)
(154
) (7
0)
(403
) 25
5 -
3 5
(6)
(21)
(6
6)
(85)
To
tal f
inan
cial
ass
ets
2,87
1 51
6 44
0 15
8 46
9 75
3 1,
033
3,36
9 2,
670
423
422
186
634
583
1,35
7 3,
605
Non
-der
ivat
ive
finan
cial
liab
ilitie
s
P
ayab
les
and
accr
uals
(exc
ludi
ng in
com
e
rece
ived
in a
dvan
ce)
653
- 65
3 -
- -
- 65
3 51
9 -
519
- -
- -
519
Sec
ured
bor
row
ings
7,
704
- 1,
206
782
2,51
4 3,
758
961
9,22
1 6,
919
- 1,
389
883
2,62
5 2,
258
1,03
6 8,
191
Uns
ecur
ed b
orro
win
gs
- -
- -
- -
- -
21
- 21
-
- -
- 21
Fi
nanc
ial g
uara
ntee
s2 42
5,
883
- -
- -
- 5,
883
16
4,81
3 -
- -
- -
4,81
3
Tota
l non
-der
ivat
ive
finan
cial
liab
ilitie
s 8,
399
5,88
3 1,
859
782
2,51
4 3,
758
961
15,7
57
7,47
5 4,
813
1,92
9 88
3 2,
625
2,25
8 1,
036
13,5
44
Der
ivat
ive
finan
cial
liab
ilitie
s
D
eriv
ativ
e fin
anci
al li
abilit
ies
net s
ettle
d 55
0 -
122
110
222
136
21
611
867
- 83
12
1 37
1 36
3 58
99
6 D
eriv
ativ
e fin
anci
al li
abilit
ies
gros
s se
ttled
1 10
5 -
(3)
5 82
96
10
2 28
2 36
-
8 1
7 74
72
16
2 In
flow
s
- (1
39)
(39)
(3
33)
(356
) (6
39)
(1,5
06)
-
(120
) (2
0)
(58)
(3
03)
(339
) (8
40)
Out
flow
s
- 13
6 44
41
5 45
2 74
1 1,
788
-
128
21
65
377
411
1,00
2 To
tal d
eriv
ativ
e fin
anci
al li
abili
ties
655
- 11
9 11
5 30
4 23
2 12
3 89
3 90
3 -
91
122
378
437
130
1,15
8 To
tal f
inan
cial
liab
ilitie
s 9,
054
5,88
3 1,
978
897
2,81
8 3,
990
1,08
4 16
,650
8,
378
4,81
3 2,
020
1,00
5 3,
003
2,69
5 1,
166
14,7
02
Net
con
trac
tual
cas
h flo
ws
(6,1
83)
(5,3
67)
(1,5
38)
(739
) (2
,349
) (3
,237
) (5
1)
(13,
281)
(5
,708
) (4
,390
) (1
,598
) (8
19)
(2,3
69)
(2,1
12)
191
(11,
097)
1 In
clud
es b
oth
forw
ard
fore
ign
exch
ange
con
tract
s an
d cr
oss-
curr
ency
inte
rest
rate
sw
aps;
the
fore
ign
curre
ncy
leg
of th
e ca
sh fl
ows
is tr
ansl
ated
at t
he s
pot r
ate
as a
t 30
June
.
2 Ba
sed
on th
e m
atur
ity p
rofil
es a
bove
, the
cou
ncil
is a
lso
expo
sed
to li
quid
ity ri
sk a
s a
guar
anto
r of a
ll of
the
LGFA
’s b
orro
win
gs. T
he in
form
atio
n on
the
LGFA
bor
row
ings
is d
iscl
osed
in n
ote
F4. T
his
guar
ante
e be
com
es c
alla
ble
in th
e ev
ent
of t
he L
GFA
faili
ng to
pay
its
borr
owin
gs w
hen
they
fall
due.
How
ever
, thi
s is
not
con
side
red
a si
gnifi
cant
risk
as
it is
not
ant
icip
ated
that
the
guar
ante
e w
ill b
ecom
e pa
yabl
e.

Auckland Council Annual Report 2016/2017
68 | Volume 3: Financial statements
Annual Report 2016/2017
68
Section F: Other disclosures
This section provides other financial information that will enhance clarity and understanding of this financial report. Required disclosures such as the remuneration of Auckland’s mayor, councillors and local board members are presented under “related parties’ transactions”.
The notes included in this section are as follows:
F1 Non-current assets held for sale
F2 Deferred tax assets and liabilities
F3 Investment in other entities
F4 Contingencies, commitments and subsequent events
F5 Related party transactions
F6 Reconciliation of surplus/ (deficit) after income tax to net cash inflow from operating activities
F7 City Rail Link project

Te Rīpoata ā-Tau 2016/2017 o Te Kaunihera
o Tāmaki Makaurau
Pokanga 3: Ngā Pūrongo Pūtea | 69
Annual Report 2016/2017
68
Section F: Other disclosures
This section provides other financial information that will enhance clarity and understanding of this financial report. Required disclosures such as the remuneration of Auckland’s mayor, councillors and local board members are presented under “related parties’ transactions”.
The notes included in this section are as follows:
F1 Non-current assets held for sale
F2 Deferred tax assets and liabilities
F3 Investment in other entities
F4 Contingencies, commitments and subsequent events
F5 Related party transactions
F6 Reconciliation of surplus/ (deficit) after income tax to net cash inflow from operating activities
F7 City Rail Link project
Annual Report 2016/2017
Volume 3: Financial statements 69
Section F: Other disclosures
F1 Non-current assets held for sale
Accounting policy
Non-current assets are classified as held for sale if their carrying amount will be recovered principally through a sale transaction rather than through continuing use. They are measured at the lower of their carrying amount and fair value less costs to sell. Any impairment losses for write-downs are recognised in the surplus or deficit. Any increases in fair value (less costs to sell) are recognised up to the level of any impairment losses that have been previously recognised. Non-current assets are not depreciated or amortised while they are classified as held for sale.
Group Council
$million 2017 2016 2017 2016
CRL project assets (Note F7) 217 - - - Land and buildings 99 37 39 32 Other 16 6 1 -
Non-current assets held for sale 332 43 40 32
Land and buildings include a property previously classified as investment property by POAL, that was transferred to non-current assets held for sale, as it is subject to a sale and purchase agreement. POAL has received notices from NZTA to acquire the Port of Onehunga and Pikes Point properties under the Public Works Act 1981 for use in the construction of East-West Link.
An impairment loss of $5.2 million for the Group and $4.7 million for the council in 2017 was recognised under “net other gains and losses” for write-down of land and buildings and other assets.
F2 Deferred tax assets and liabilities Certain deferred tax assets and liabilities have been offset. The following is the analysis of the deferred tax balances (after offset) for financial reporting purposes:
Group Council
$million 2017 2016 2017 2016 Deferred tax assets -to be recovered >12 months 12 8 - - -to be recovered within 12 months 5 3 - - Deferred tax liabilities -to be recovered >12 months (1,129) (1,066) - - -to be recovered within 12 months - - - - Net deferred tax liabilities (1,112) (1,055) - -
The movement in the Group’s deferred tax assets/liabilities is as follows:
$million Property, plant and
equipment Intangible
assets Other
Tax losses carried
forward Total Opening balance (1,370) (2) 76 241 (1,055) Credited/(charged) to surplus/(deficit) (41) (1) (26) 12 (56) Credited/(charged) to other comprehensive revenue - - (1) - (1) Balance at 30 June 2017 (1,411) (3) 49 253 (1,112) Opening balance (1,323) - 41 215 (1,067) Credited/(charged) to surplus/(deficit) (43) (2) 33 26 14 Credited/(charged) to other comprehensive revenue (4) - 2 - (2) Balance at 30 June 2016 (1,370) (2) 76 241 (1,055)

Auckland Council Annual Report 2016/2017
70 | Volume 3: Financial statements
Annual Report 2016/2017
70
Section F: Other disclosures
F3 Investment in other entities
Group Council
$million 2017 2016 2017 2016 Investment in subsidiaries - - 21,068 21,080 Investment in associates 1,080 1,056 2 1 Investment in joint ventures 16 18 14 13 Total Investment in other entities 1,096 1,074 21,084 21,094
Investment in subsidiaries Investment in subsidiaries includes the investment in CCOs (refer to section H for list of CCOs). Ports of Auckland, port owner and operator and is 100% owned by the council. Investment in joint ventures and associates
Accounting policy
Investment in associates and joint ventures is accounted for using the equity method in the Group and council financial statements. The investment is initially recognised at cost and the carrying amount is increased or decreased to recognise the share of the surplus or deficit of the associate or joint venture after the date of acquisition. Distributions received reduce the carrying amount of the investment. Where necessary, adjustments are made to the financial statements of associates and joint ventures to bring their accounting policies in line with the Group.
The Group and council hold investment in the following joint ventures and associates as at 30 June 2017:
Interest Entity Held
by Relationship 2017 2016 Nature
North Tugz Ltd Group Joint venture 50.00% 50.00% Towage and pilotage services
PortConnect Ltd Group Joint venture 50.00% 50.00% Online Cargo management system
Longburn Intermodal Freight Hub Ltd Group Associate 33.30% 33.30% Inland Freight distribution hub
Auckland International Airport Ltd (AIAL)
Group Associate 22.33% 22.38% Airport
City Rail Link Limited (Note F7) Council Jointly controlled entity
50.00% - Design and construction of CRL
Waste Disposal Services Ltd Council Joint venture 50.00% 50.00% Landfill business
Haumaru Housing Limited Partnership (Haumaru)
Council Joint venture 49.00% - Social rental housing for older people in Auckland
New Zealand Food Innovation Auckland Ltd
Council Joint venture 33.30% 33.30% Science and Technology Resources centre
New Lynn Central Ltd Partnership Council Associate 42.00% 42.00% Property development
Tamaki Redevelopment Company Ltd
Council Associate 41.00% 41.00% Property development
All associates and joint ventures have a balance date of 30 June and are resident in New Zealand. The council has signed a funding agreement with Haumaru effective 1 July 2017, whereby the council will provide a total funding of $30 million. This funding will be provided in annual allocations up to 30 June 2025. The funding provided will be used by Haumaru solely for capital renewals of the HfOP portfolio.

Te Rīpoata ā-Tau 2016/2017 o Te Kaunihera
o Tāmaki Makaurau
Pokanga 3: Ngā Pūrongo Pūtea | 71
Annual Report 2016/2017
70
Section F: Other disclosures
F3 Investment in other entities
Group Council
$million 2017 2016 2017 2016 Investment in subsidiaries - - 21,068 21,080 Investment in associates 1,080 1,056 2 1 Investment in joint ventures 16 18 14 13 Total Investment in other entities 1,096 1,074 21,084 21,094
Investment in subsidiaries Investment in subsidiaries includes the investment in CCOs (refer to section H for list of CCOs). Ports of Auckland, port owner and operator and is 100% owned by the council. Investment in joint ventures and associates
Accounting policy
Investment in associates and joint ventures is accounted for using the equity method in the Group and council financial statements. The investment is initially recognised at cost and the carrying amount is increased or decreased to recognise the share of the surplus or deficit of the associate or joint venture after the date of acquisition. Distributions received reduce the carrying amount of the investment. Where necessary, adjustments are made to the financial statements of associates and joint ventures to bring their accounting policies in line with the Group.
The Group and council hold investment in the following joint ventures and associates as at 30 June 2017:
Interest Entity Held
by Relationship 2017 2016 Nature
North Tugz Ltd Group Joint venture 50.00% 50.00% Towage and pilotage services
PortConnect Ltd Group Joint venture 50.00% 50.00% Online Cargo management system
Longburn Intermodal Freight Hub Ltd Group Associate 33.30% 33.30% Inland Freight distribution hub
Auckland International Airport Ltd (AIAL)
Group Associate 22.33% 22.38% Airport
City Rail Link Limited (Note F7) Council Jointly controlled entity
50.00% - Design and construction of CRL
Waste Disposal Services Ltd Council Joint venture 50.00% 50.00% Landfill business
Haumaru Housing Limited Partnership (Haumaru)
Council Joint venture 49.00% - Social rental housing for older people in Auckland
New Zealand Food Innovation Auckland Ltd
Council Joint venture 33.30% 33.30% Science and Technology Resources centre
New Lynn Central Ltd Partnership Council Associate 42.00% 42.00% Property development
Tamaki Redevelopment Company Ltd
Council Associate 41.00% 41.00% Property development
All associates and joint ventures have a balance date of 30 June and are resident in New Zealand. The council has signed a funding agreement with Haumaru effective 1 July 2017, whereby the council will provide a total funding of $30 million. This funding will be provided in annual allocations up to 30 June 2025. The funding provided will be used by Haumaru solely for capital renewals of the HfOP portfolio.
Annual Report 2016/2017
Volume 3: Financial statements 71
Section F: Other disclosures
F3 Investment in other entities (continued) The Group’s significant associate is AIAL and its key financial information is as follows:
$million Total
assets Total
liabilities Gross
revenue Net profit
after tax Percentage of
interest held As at 30 June 2017
Auckland International Airport Ltd 6,504 2,475 629 333 22.33% As at 30 June 2016
Auckland International Airport Ltd 6,142 2,261 574 262 22.38% The fair value of the Group’s investment in AIAL is $1.9 billion (2016: $1.7 billion). The amounts presented are gross amounts taken directly from AIAL’s financial statements. No adjustments have been made for differences in accounting policies adopted by the Group and the council. Contingent liabilities of associates and joint ventures Contingent liabilities of the Group and the council’s associates and joint ventures are not significant to the Group and the council.
F4 Contingencies, commitments and subsequent events CONTINGENCIES
Accounting policy
The Group and the council do not recognise contingent liabilities and contingent assets in the financial statements due to their uncertainty or the fact that they cannot be reliably measured. Disclosures are provided for as follows:
Contingent liabilities are disclosed unless the possibility that these will crystallise is remote. Contingent assets are only disclosed when the possibility that these will crystallise is probable.
Contingent liabilities and assets are assessed continually to ensure that developments are appropriately reflected in the financial statements.
Quantifiable contingent liabilities
Group Council
$million 2017 2016 2017 2016 Guarantees and indemnities 5,538 4,353 5,841 4,797 Uncalled capital 2 2 2 2 Legal proceedings and disputes 3 8 3 8 Total quantifiable contingent liabilities 5,543 4,363 5,846 4,807
a. Guarantees and indemnities
New Zealand Local Government Funding Agency (LGFA)
The council is a shareholder and guarantor of the LGFA. The LGFA was incorporated in December 2011 with the purpose of providing debt funding to local authorities in New Zealand and it has a current credit rating from Standard & Poor’s of AA+ (stable). As a guarantor The council is one of 44 local authority guarantors of the LGFA. The LGFA’s loans to local authorities are $7.9 billion (2016: $6.5 billion), of which the Group and the council have borrowed $2.4 billion (2016: $2.1 billion). As a result, the Group and the council’s cross-guarantee on LGFA’s loans to other local authorities is $5.5 billion (2016: $4.4 billion).

Auckland Council Annual Report 2016/2017
72 | Volume 3: Financial statements
Annual Report 2016/2017
72
Section F: Other disclosures
F4 Contingencies, commitments and subsequent events (continued)
Quantifiable contingent liabilities (continued)
PBE Accounting Standards require the Group and the council to recognise the guarantee liability at fair value. However, the Group and the council have been unable to determine a sufficiently reliable fair value for the guarantee, and therefore has not recognised a liability. The Group and the council consider the risk of the LGFA defaulting on repayment of interest or capital to be very low on the basis that: the council is not aware of any local authority debt default events in New
Zealand local government legislation would enable local authorities to levy rate to
recover sufficient funds to meet any debt obligations if further funds were required.
Watercare Services Ltd Watercare Services Ltd
The council has provided a guarantee for certain Watercare borrowings. At 30 June 2017, the borrowings for which this guarantee is provided totalled $303 million (2016: $444 million).
b. Uncalled capital LGFA The council is one of 31 shareholders of the LGFA. In that regard it has uncalled capital of $2 million (2016: $2 million). When aggregated with the uncalled capital of other shareholders, $20 million is available in the event that an imminent default is identified.
c. Legal proceedings
and disputes Legal claims against the Group and the council exist for contract
challenges, building defects, land issues, consents, flooding damage, valuations and other sundry disputes.
Where it is assessed that the likelihood of having to make a payment under the claim is more than remote the Group and the council have shown the amount claimed or the maximum potential cost. It does not represent either an admission that the claim is valid or an estimation of the possible amount of any award against the Group and the council.
Amounts shown do not include any interest or costs that may be claimed if these cases were decided against the Group and the council.
A provision is provided on legal claims that meet the recognition criteria as disclosed in Note D5.
Unquantifiable contingent liabilities Contaminated land It is likely that further sites will be identified over time and should testing
confirm contamination, the Group and the council will be obliged to undertake remedial action.
A significant degree of estimation has been involved to calculate the provision; as a result the Group and the council may be subject to further liability that is not currently recognised.
Provision on contaminated land is provided in Note D5. Weathertightness A significant degree of estimation has been involved to calculate the
provision. As a result the Group and the council may be subject to further liability that is not currently recognised
Provision on weathertightness is provided in Note D5. Carter Colt Harvey (CHH)
In April 2013, the Ministry of Education (MOE) initiated High Court proceedings against Carter Holt Harvey (CHH) and others alleging inherent defects in the cladding sheets and cladding systems manufactured and

Te Rīpoata ā-Tau 2016/2017 o Te Kaunihera
o Tāmaki Makaurau
Pokanga 3: Ngā Pūrongo Pūtea | 73
Annual Report 2016/2017
72
Section F: Other disclosures
F4 Contingencies, commitments and subsequent events (continued)
Quantifiable contingent liabilities (continued)
PBE Accounting Standards require the Group and the council to recognise the guarantee liability at fair value. However, the Group and the council have been unable to determine a sufficiently reliable fair value for the guarantee, and therefore has not recognised a liability. The Group and the council consider the risk of the LGFA defaulting on repayment of interest or capital to be very low on the basis that: the council is not aware of any local authority debt default events in New
Zealand local government legislation would enable local authorities to levy rate to
recover sufficient funds to meet any debt obligations if further funds were required.
Watercare Services Ltd Watercare Services Ltd
The council has provided a guarantee for certain Watercare borrowings. At 30 June 2017, the borrowings for which this guarantee is provided totalled $303 million (2016: $444 million).
b. Uncalled capital LGFA The council is one of 31 shareholders of the LGFA. In that regard it has uncalled capital of $2 million (2016: $2 million). When aggregated with the uncalled capital of other shareholders, $20 million is available in the event that an imminent default is identified.
c. Legal proceedings
and disputes Legal claims against the Group and the council exist for contract
challenges, building defects, land issues, consents, flooding damage, valuations and other sundry disputes.
Where it is assessed that the likelihood of having to make a payment under the claim is more than remote the Group and the council have shown the amount claimed or the maximum potential cost. It does not represent either an admission that the claim is valid or an estimation of the possible amount of any award against the Group and the council.
Amounts shown do not include any interest or costs that may be claimed if these cases were decided against the Group and the council.
A provision is provided on legal claims that meet the recognition criteria as disclosed in Note D5.
Unquantifiable contingent liabilities Contaminated land It is likely that further sites will be identified over time and should testing
confirm contamination, the Group and the council will be obliged to undertake remedial action.
A significant degree of estimation has been involved to calculate the provision; as a result the Group and the council may be subject to further liability that is not currently recognised.
Provision on contaminated land is provided in Note D5. Weathertightness A significant degree of estimation has been involved to calculate the
provision. As a result the Group and the council may be subject to further liability that is not currently recognised
Provision on weathertightness is provided in Note D5. Carter Colt Harvey (CHH)
In April 2013, the Ministry of Education (MOE) initiated High Court proceedings against Carter Holt Harvey (CHH) and others alleging inherent defects in the cladding sheets and cladding systems manufactured and
Annual Report 2016/2017
Volume 3: Financial statements 73
Section F: Other disclosures
F4 Contingencies, commitments and subsequent events (continued)
Unquantifiable contingent liabilities (continued) Carter Colt Harvey (CHH) (continued)
prepared by CHH. Subsequently, in December 2016, CHH commenced third party proceedings against 48 Councils, including the council alleging a breach of duty in the processing of building consents, undertaking building inspections and issuing Code Compliance Certificates. The Councils have applied for orders setting aside and striking out CHH’s claims against them. The MOE’s claim against CHH is for 833 school buildings, 44 of which are located within Auckland, and at present there is insufficient information to conclude on potential liability and claim quantum, if any.
Snapper Services Ltd
Auckland Transport has been advised of a potential claim by Snapper Services Ltd against Auckland Transport in relation to the Auckland Integrated Fare System. Auckland Transport has prepared a claim against Snapper. Legal proceedings have not been issued by either party.
Legal proceedings and disputes
The council is in negotiations with a rate payer who has brought judicial review proceedings challenging the validity of the rates assessments and setting of penalties for its properties for the ratings years 2009/2010 to 2017/2018. In addition to challenging the ratings differentials applied to assess the rates, the plaintiff seeks an order quashing all penalties for each rating year on the basis that the penalties resolutions do not comply with the statutory requirements. The council has filed a statement of defence. The first Case Management Conference is scheduled for 28 September. The parties are continuing settlement discussions.
Contingent and future assets Repurchase of heritage buildings
In June 2004, one of the former councils sold a number of heritage buildings that form part of the Britomart precinct.
The council has a right to repurchase these buildings for $1 after 150 years (June 2154). No estimate has been made of the financial effect of this transaction due to the long period involved. The council anticipates that an estimate will be established 20 years before this repurchase occurs.
Entrust (previously named Auckland Energy Consumer Trust)
The council is currently Capital Beneficiary of the Auckland Energy Consumer Trust (AECT) when the Trust terminates on 27 August 2073.
As at 30 June 2017 the Group and the council are not able to reliably estimate the value of any future benefit that may result from this arrangement.
Robertson art donation A binding agreement was established in 2009 by Julian and Josie Robertson
(the donors) to donate certain works of art owned by them to the Group for display in the Auckland Art Gallery. The donors currently hold the works of art for their own and others’ enjoyment, therefore the Group will only gain possession of the artworks on the contribution date specified in the agreement. At this point, the Group is unable to measure the right to receive assets reliably due to the uncertainty in the timing of the donation and certain restrictions set out in the agreement.
Shared Responsibility Scheme assets
The council's Shared Responsibility Scheme was created to assist clubs with the construction of facilities on council-owned land.
Under the scheme, the clubs will control the use of the asset constructed and the council will gain control of the asset if the club vacates the facility.

Auckland Council Annual Report 2016/2017
74 | Volume 3: Financial statements
Annual Report 2016/2017
74
Section F: Other disclosures
F4 Contingencies, commitments and subsequent events (continued)
COMMITMENTS Capital commitments Capital commitments relate to obligations which the Group and council have committed to. This specifically relates to work that is yet to commence and the expenditure that is yet to be incurred. The Group and council capital commitments are as follows:
Group Council $million 2017 2016 2017 2016 Property, plant and equipment CRL project (Note F7) 324 185 - - Roading networks 218 414 - - Water and wastewater 211 221 - - Operational land and buildings 115 68 96 44 Other operational assets 105 82 52 29 Rolling stock - 15 - - Restricted improvements 38 33 38 33 Stormwater 54 47 69 50 Restricted parks, reserves and buildings 5 6 5 6 Wharves 5 1 - - Marina structures - 1 - - Total property, plant and equipment 1,075 1,073 260 162 Intangible assets 17 36 8 11 Total capital commitments 1,092 1,109 268 173
135 Albert Street recladding The main contractor has completed enabling works and re-cladding works are now progressing. The project is running on time and is due to be completed in the first quarter of 2019. No lost time or serious harm injuries have occurred on the project. Operating lease commitments The Group and the council as lessee
Accounting policy
The Group and the council lease property, plant and equipment from third parties in the normal course of business with lease terms varying from 1 month to 70 years (2016: 1 month to 70 years). Payments made under operating leases (net of any incentives received from the lessor) are expensed on a straight-line basis over the lease term.
The future aggregate minimum lease payments payable under non-cancellable operating leases are as follows:
Group Council
$million 2017 2016 2017 2016 Minimum operating lease payments payable Not later than one year 58 24 11 10 Later than one year and not later than five years 203 65 28 29 Later than five years 208 36 4 3 Total minimum operating lease payments payable 469 125 43 42
Leases can be renewed at the Group and the council's discretion, with rents set by reference to current market rates for items of equivalent age and condition. In some circumstances, the Group and the council have the option to purchase the asset at the end of the lease term.

Te Rīpoata ā-Tau 2016/2017 o Te Kaunihera
o Tāmaki Makaurau
Pokanga 3: Ngā Pūrongo Pūtea | 75
Annual Report 2016/2017
74
Section F: Other disclosures
F4 Contingencies, commitments and subsequent events (continued)
COMMITMENTS Capital commitments Capital commitments relate to obligations which the Group and council have committed to. This specifically relates to work that is yet to commence and the expenditure that is yet to be incurred. The Group and council capital commitments are as follows:
Group Council $million 2017 2016 2017 2016 Property, plant and equipment CRL project (Note F7) 324 185 - - Roading networks 218 414 - - Water and wastewater 211 221 - - Operational land and buildings 115 68 96 44 Other operational assets 105 82 52 29 Rolling stock - 15 - - Restricted improvements 38 33 38 33 Stormwater 54 47 69 50 Restricted parks, reserves and buildings 5 6 5 6 Wharves 5 1 - - Marina structures - 1 - - Total property, plant and equipment 1,075 1,073 260 162 Intangible assets 17 36 8 11 Total capital commitments 1,092 1,109 268 173
135 Albert Street recladding The main contractor has completed enabling works and re-cladding works are now progressing. The project is running on time and is due to be completed in the first quarter of 2019. No lost time or serious harm injuries have occurred on the project. Operating lease commitments The Group and the council as lessee
Accounting policy
The Group and the council lease property, plant and equipment from third parties in the normal course of business with lease terms varying from 1 month to 70 years (2016: 1 month to 70 years). Payments made under operating leases (net of any incentives received from the lessor) are expensed on a straight-line basis over the lease term.
The future aggregate minimum lease payments payable under non-cancellable operating leases are as follows:
Group Council
$million 2017 2016 2017 2016 Minimum operating lease payments payable Not later than one year 58 24 11 10 Later than one year and not later than five years 203 65 28 29 Later than five years 208 36 4 3 Total minimum operating lease payments payable 469 125 43 42
Leases can be renewed at the Group and the council's discretion, with rents set by reference to current market rates for items of equivalent age and condition. In some circumstances, the Group and the council have the option to purchase the asset at the end of the lease term.
Annual Report 2016/2017
Volume 3: Financial statements 75
Section F: Other disclosures
F4 Contingencies, commitments and subsequent events (continued)
Contingent rents of $2 million have been recognised during the year for the Group and the council (2016: $2 million). The total future sublease payments expected to be received under non-cancellable subleases at balance date is $4 million for the Group and the council (2016: $5 million). The Group and the council as lessor
Accounting policy
The Group and the council lease certain property, plant and equipment to third parties including land and buildings and some commercial and residential property. The leases have non-cancellable periods ranging from 1 month to 100 years (2016: 1 month to 100 years) with subsequent renewals negotiated with the lessee. Rental revenue (net of any incentives given to lessees) is recognised as revenue on a straight-line basis over the lease term.
Future aggregate minimum lease payments to be collected under non-cancellable operating leases are as follows:
Group Council
$million 2017 2016 2017 2016 Minimum operating lease payments receivable Not later than one year 42 43 14 17 Later than one year and not later than five years 107 100 33 39 Later than five years 226 247 181 190 Total minimum operating lease payments receivable 375 390 228 246
Contingent rent recognised during the year amounted to $0.3 million (2016: $0.6 million) for the Group and the council. SUBSEQUENT EVENTS Housing Infrastructure Fund In July 2017, the Crown announced $300 million of new funding through the Housing Infrastructure Fund (HIF) that will unlock new housing development in Auckland’s north-west through investment in transport, wastewater and stormwater projects earmarked as priority, fast-track initiatives. The Crown subsequently announced $600 million network infrastructure for housing developments through Crown Infrastructure Partners, previously Crown Fibre holdings, with a purpose of setting up special purpose companies to build and own new trunk infrastructure for housing developments, Two of the earliest projects to be assessed by Crown Infrastructure Partners for investment will be the Auckland North and Auckland South projects previously submitted by the council through HIF bid submission process. The impact of the Crown’s announcement on housing infrastructure to the Group and the council’s results and financial position is dependent on finalising the terms of agreements. City Rail Link Project Subsequent to balance sheet date, City Rail Link Limited (CRLL) obtained the necessary authority to assume responsibility of the CRL project and the Crown’s commitments came into effect (refer to Note F7). There were no other material events after reporting date which would require adjustment or disclosure for the Group and the council.

Auckland Council Annual Report 2016/2017
76 | Volume 3: Financial statements
Annual Report 2016/2017
76
Section F: Other disclosures
F5 Related party transactions
Accounting policy
Related parties include subsidiaries, associates, joint ventures, key management personnel, the elected representatives of the council and their close family members and entities controlled by them. Close family members include spouses or domestic partners, children and dependants.
Transactions with related parties that are on an arm’s length basis are not disclosed. All transactions with related parties were made on an arm’s length basis in the current and prior financial years.
Transactions were entered into and year end balances arose from transactions with related parties include key management remuneration. Key management personnel remuneration Key management remuneration comprises of the total remuneration paid to the mayor, councillors, chief executive and executive leadership team.
Council
$ 2017 2016 Mayor and councillors Remuneration 2,515,781 2,537,190 Total Mayor and councillors 2,515,781 2,537,190 Payments during the year to the chief executive -Salary and other short-term employee benefits 669,903 636,744 -Post-employment benefit (Kiwi saver contributions) 20,097 19,102 Total chief executive remuneration 690,000 655,846 Executive leadership team -Salary and other short-term employee benefits 3,944,887 3,731,878 -Post-employment benefit (Kiwi saver contributions) 108,840 93,081 -Termination benefits 405,739 - Total executive leadership team remuneration 4,459,466 3,824,959 Total key management personnel remuneration 7,665,247 7,017,995
Key management personnel comprise 40 individuals. With the Local Government election held on 8 October 2016, the 21 full time equivalent (FTE) elected members have changed. Thus, from 1 July 2016 to 30 June 2017, the total number of elected members is 27, with 6 new elected members, and 6 elected members leaving during the financial year. Also included are 13 executive leaders with two executive leaders leaving during the financial year and one new executive leader being appointed during the financial year (12 FTE).
Local government disclosures Employee numbers and remuneration bands
Group Council
Full-time equivalent 2017 2016 2017 2016 Full-time employees 8,927 8,743 5,299 5,302 Part time employees (full-time equivalent) 1,136 1,127 792 800 Total full-time equivalent 10,063 9,870 6,091 6,102
The numbers of employees who were employed at 30 June are detailed below. Those receiving remuneration of $60,000 or more are grouped into $20,000 bands. If there are less than six employees in the band, they are combined upwards with the next banding as stipulated in the LGA 2002.

Te Rīpoata ā-Tau 2016/2017 o Te Kaunihera
o Tāmaki Makaurau
Pokanga 3: Ngā Pūrongo Pūtea | 77
Annual Report 2016/2017
76
Section F: Other disclosures
F5 Related party transactions
Accounting policy
Related parties include subsidiaries, associates, joint ventures, key management personnel, the elected representatives of the council and their close family members and entities controlled by them. Close family members include spouses or domestic partners, children and dependants.
Transactions with related parties that are on an arm’s length basis are not disclosed. All transactions with related parties were made on an arm’s length basis in the current and prior financial years.
Transactions were entered into and year end balances arose from transactions with related parties include key management remuneration. Key management personnel remuneration Key management remuneration comprises of the total remuneration paid to the mayor, councillors, chief executive and executive leadership team.
Council
$ 2017 2016 Mayor and councillors Remuneration 2,515,781 2,537,190 Total Mayor and councillors 2,515,781 2,537,190 Payments during the year to the chief executive -Salary and other short-term employee benefits 669,903 636,744 -Post-employment benefit (Kiwi saver contributions) 20,097 19,102 Total chief executive remuneration 690,000 655,846 Executive leadership team -Salary and other short-term employee benefits 3,944,887 3,731,878 -Post-employment benefit (Kiwi saver contributions) 108,840 93,081 -Termination benefits 405,739 - Total executive leadership team remuneration 4,459,466 3,824,959 Total key management personnel remuneration 7,665,247 7,017,995
Key management personnel comprise 40 individuals. With the Local Government election held on 8 October 2016, the 21 full time equivalent (FTE) elected members have changed. Thus, from 1 July 2016 to 30 June 2017, the total number of elected members is 27, with 6 new elected members, and 6 elected members leaving during the financial year. Also included are 13 executive leaders with two executive leaders leaving during the financial year and one new executive leader being appointed during the financial year (12 FTE).
Local government disclosures Employee numbers and remuneration bands
Group Council
Full-time equivalent 2017 2016 2017 2016 Full-time employees 8,927 8,743 5,299 5,302 Part time employees (full-time equivalent) 1,136 1,127 792 800 Total full-time equivalent 10,063 9,870 6,091 6,102
The numbers of employees who were employed at 30 June are detailed below. Those receiving remuneration of $60,000 or more are grouped into $20,000 bands. If there are less than six employees in the band, they are combined upwards with the next banding as stipulated in the LGA 2002.
Annual Report 2016/2017
Volume 3: Financial statements 77
Section F: Other disclosures
F5 Related party transactions (continued)
Local government disclosures (continued) Employee numbers and remuneration bands (continued)
Group Number of employees 2017 Number of employees 2016
<$60,000 5,399 <$60,000 5,279 $60,000-$79,999 2,380 $60,000-$79,999 2,474 $80,000-$99,999 1,864 $80,000-$99,999 1,790 $100,000-$119,999 1,022 $100,000-$119,999 965 $120,000-$139,999 556 $120,000-$139,999 484 $140,000-$159,999 261 $140,000-$159,999 242 $160,000-$179,999 132 $160,000-$179,999 121 $180,000-$199,999 85 $180,000-$199,999 81 $200,000-$219,999 54 $200,000-$219,999 43 $220,000-$239,999 43 $220,000-$239,999 24 $240,000-$259,999 28 $240,000-$259,999 19 $260,000-$279,999 9 $260,000-$279,999 14 $280,000-$299,999 21 $280,000-$299,999 19 $300,000-$319,999 8 $300,000-$319,999 10 $320,000-$339,999 7 $320,000-$339,999 8 $340,000-$359,999 6 $340,000-$399,999 6 $360,000-$419,999 7 $400,000-$459,999 6 $420,000-$479,999 6 $460,000-$819,999 6 $480,000-$899,999 5
Total number of employees 11,893 11,591
Council
Number of employees 2017 Number of employees 2016 <$60,000 3,412 <$60,000 3,394 $60,000-$79,999 1,494 $60,000-$79,999 1,601 $80,000-$99,999 1,163 $80,000-$99,999 1,134 $100,000-$119,999 566 $100,000-$119,999 550 $120,000-$139,999 277 $120,000-$139,999 231 $140,000-$159,999 128 $140,000-$159,999 120 $160,000-$179,999 67 $160,000-$179,999 65 $180,000-$199,999 40 $180,000-$199,999 34 $200,000-$219,999 20 $200,000-$219,999 16 $220,000-$239,999 17 $220,000-$239,999 10 $240,000-$259,999 12 $240,000-$259,999 6 $260,000-$299,999 12 $260,000-$299,999 11 $300,000-$339,999 6 $300,000-$339,999 6 $340,000-$699,999 6 $340,000-$699,999 6
Total number of employees 7,220 7,184 Severance payments For the year ended 30 June 2017, the council made 28 severance payments to employees totalling $976,226 (30 June 2016: 17 payments totalling $726,910) The values of each severance payment were $405,739; $68,202; $58,266; $51,354; $43,691; $41,171; $33,053; $30,033; $25,701; $22,364; $18,000; $17,500; $16,146; $15,648; $15,000; $14,357; $12,608; $12,480; $10,224; $10,085; $10,000; $8,561; $7,949; $7,692; $6,902; $6,000; $4,500; $3,000.
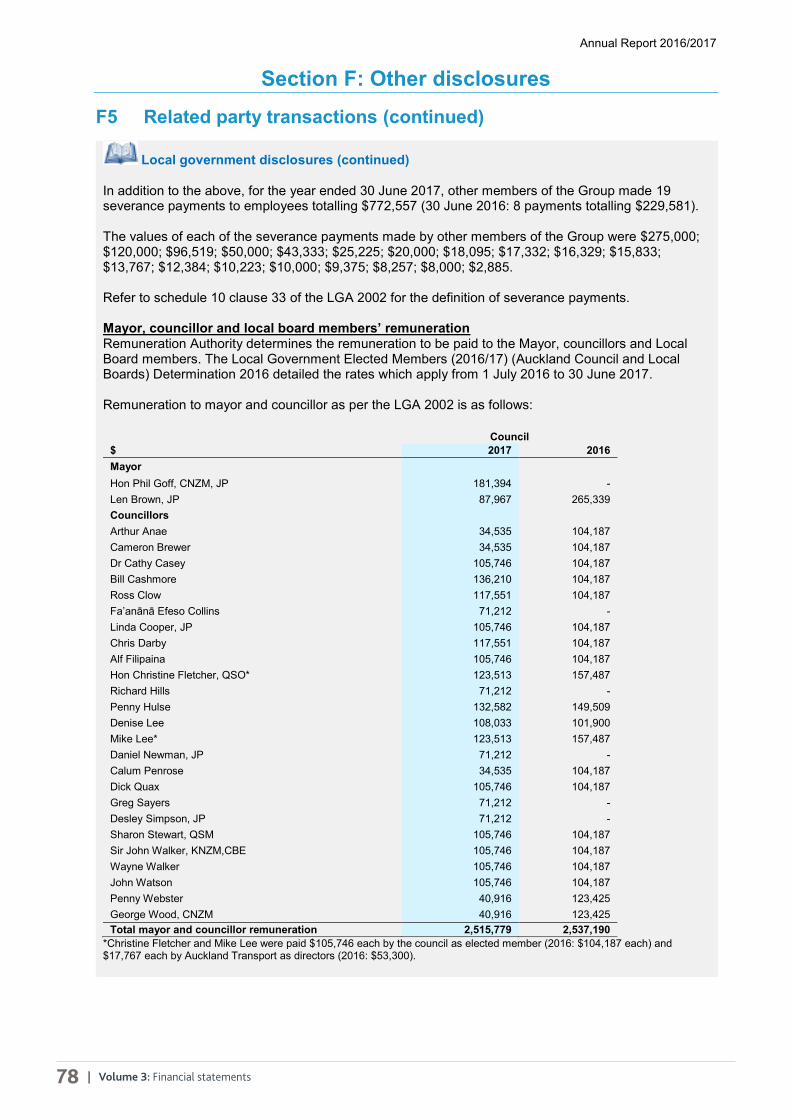
Auckland Council Annual Report 2016/2017
78 | Volume 3: Financial statements
Annual Report 2016/2017
78
Section F: Other disclosures
F5 Related party transactions (continued)
Local government disclosures (continued) In addition to the above, for the year ended 30 June 2017, other members of the Group made 19 severance payments to employees totalling $772,557 (30 June 2016: 8 payments totalling $229,581). The values of each of the severance payments made by other members of the Group were $275,000; $120,000; $96,519; $50,000; $43,333; $25,225; $20,000; $18,095; $17,332; $16,329; $15,833; $13,767; $12,384; $10,223; $10,000; $9,375; $8,257; $8,000; $2,885. Refer to schedule 10 clause 33 of the LGA 2002 for the definition of severance payments. Mayor, councillor and local board members’ remuneration Remuneration Authority determines the remuneration to be paid to the Mayor, councillors and Local Board members. The Local Government Elected Members (2016/17) (Auckland Council and Local Boards) Determination 2016 detailed the rates which apply from 1 July 2016 to 30 June 2017. Remuneration to mayor and councillor as per the LGA 2002 is as follows:
Council
$ 2017 2016 Mayor Hon Phil Goff, CNZM, JP 181,394 - Len Brown, JP 87,967 265,339 Councillors Arthur Anae 34,535 104,187 Cameron Brewer 34,535 104,187 Dr Cathy Casey 105,746 104,187 Bill Cashmore 136,210 104,187 Ross Clow 117,551 104,187 Fa’anānā Efeso Collins 71,212 - Linda Cooper, JP 105,746 104,187 Chris Darby 117,551 104,187 Alf Filipaina 105,746 104,187 Hon Christine Fletcher, QSO* 123,513 157,487 Richard Hills 71,212 - Penny Hulse 132,582 149,509 Denise Lee 108,033 101,900 Mike Lee* 123,513 157,487 Daniel Newman, JP 71,212 - Calum Penrose 34,535 104,187 Dick Quax 105,746 104,187 Greg Sayers 71,212 - Desley Simpson, JP 71,212 - Sharon Stewart, QSM 105,746 104,187 Sir John Walker, KNZM,CBE 105,746 104,187 Wayne Walker 105,746 104,187 John Watson 105,746 104,187 Penny Webster 40,916 123,425 George Wood, CNZM 40,916 123,425 Total mayor and councillor remuneration 2,515,779 2,537,190
*Christine Fletcher and Mike Lee were paid $105,746 each by the council as elected member (2016: $104,187 each) and $17,767 each by Auckland Transport as directors (2016: $53,300).

Te Rīpoata ā-Tau 2016/2017 o Te Kaunihera
o Tāmaki Makaurau
Pokanga 3: Ngā Pūrongo Pūtea | 79
Annual Report 2016/2017
78
Section F: Other disclosures
F5 Related party transactions (continued)
Local government disclosures (continued) In addition to the above, for the year ended 30 June 2017, other members of the Group made 19 severance payments to employees totalling $772,557 (30 June 2016: 8 payments totalling $229,581). The values of each of the severance payments made by other members of the Group were $275,000; $120,000; $96,519; $50,000; $43,333; $25,225; $20,000; $18,095; $17,332; $16,329; $15,833; $13,767; $12,384; $10,223; $10,000; $9,375; $8,257; $8,000; $2,885. Refer to schedule 10 clause 33 of the LGA 2002 for the definition of severance payments. Mayor, councillor and local board members’ remuneration Remuneration Authority determines the remuneration to be paid to the Mayor, councillors and Local Board members. The Local Government Elected Members (2016/17) (Auckland Council and Local Boards) Determination 2016 detailed the rates which apply from 1 July 2016 to 30 June 2017. Remuneration to mayor and councillor as per the LGA 2002 is as follows:
Council
$ 2017 2016 Mayor Hon Phil Goff, CNZM, JP 181,394 - Len Brown, JP 87,967 265,339 Councillors Arthur Anae 34,535 104,187 Cameron Brewer 34,535 104,187 Dr Cathy Casey 105,746 104,187 Bill Cashmore 136,210 104,187 Ross Clow 117,551 104,187 Fa’anānā Efeso Collins 71,212 - Linda Cooper, JP 105,746 104,187 Chris Darby 117,551 104,187 Alf Filipaina 105,746 104,187 Hon Christine Fletcher, QSO* 123,513 157,487 Richard Hills 71,212 - Penny Hulse 132,582 149,509 Denise Lee 108,033 101,900 Mike Lee* 123,513 157,487 Daniel Newman, JP 71,212 - Calum Penrose 34,535 104,187 Dick Quax 105,746 104,187 Greg Sayers 71,212 - Desley Simpson, JP 71,212 - Sharon Stewart, QSM 105,746 104,187 Sir John Walker, KNZM,CBE 105,746 104,187 Wayne Walker 105,746 104,187 John Watson 105,746 104,187 Penny Webster 40,916 123,425 George Wood, CNZM 40,916 123,425 Total mayor and councillor remuneration 2,515,779 2,537,190
*Christine Fletcher and Mike Lee were paid $105,746 each by the council as elected member (2016: $104,187 each) and $17,767 each by Auckland Transport as directors (2016: $53,300).
Annual Report 2016/2017
Volume 3: Financial statements 79
Section F: Other disclosures
F5 Related parties transactions (continued)
Local government disclosures (continued) Local board members’ remuneration Under the LGA 2002, the council is required to disclose remuneration to members of local boards as follows:
$ 2017 2016 $ 2017 2016 Albert-Eden Devonport- Takapuna Helga Arlington 13,953 42,054 Joseph Bergin 25,412 76,620 Lee Corrick 42,727 42,054 Mike Cohen, QSM, JP 41,779 41,146 Graeme Easte 42,727 44,214 Dr Grant Gillon 65,073 41,146 Glenda Fryer 49,995 51,754 Dianne Hale, QSO, JP 13,645 41,146 Peter Haynes 86,215 86,606 Jennifer McKenzie 28,135 - Rachel Langton 42,727 42,054 Jan O'Connor 41,779 41,146 Benjamin Lee 28,774 - Allison Roe, MBE 14,960 39,831 Jessica Rose 28,774 - Michael Sheehy 28,135 - Margi Watson 42,727 42,054 George Wood,CNZM 28,135 - Tim Woolfield 13,953 42,054 Total 392,572 392,844 Total 287,053 281,035 Franklin Great Barrier Andrew Baker 101,066 121,138 Jeff Cleave 23,338 22,979 Malcolm Bell 41,079 40,441 Luke Coles 15,716 - Alan Cole 41,079 40,441 Susan Daly 23,338 22,979 Brendon Crompton 41,079 40,441 Izzy Fordham 52,218 52,581 Sharlene Druyven 27,663 - Judy Gilbert 7,622 22,979 Angela Fulljames 65,407 40,441 Shirley Johnson 15,716 - Sarah Higgins 7,883 40,441 Christina Spence 7,622 22,979 Amanda Hopkins 27,663 - Murray Kay 41,079 47,401 Niko Kloeten 27,663 - Dr Lyn Murphy 13,416 40,441 Jill Naysmith 13,416 40,441 Total 448,493 451,626 Total 145,570 144,497 Henderson-Massey Hibiscus and Bays Paula Bold-Wilson 29,111 - Christina Bettany 28,572 - Brenda Brady, JP 48,789 47,490 David Cooper 42,427 41,751 Peter Chan, JP 43,227 42,560 Janet Fitzgerald, JP 43,707 46,371 Warren Flaunty, QSM 43,227 42,560 Gaye Harding-Kirikiri 13,855 41,751 Will Flavell 43,227 42,560 Gary Holmes 42,427 41,751 Matt Grey 29,111 - Julia Parfitt, JP 83,373 84,022 Shane Henderson 73,042 42,560 Lovisa Rasmussen 13,855 41,751 Tracy Kirkley 15,698 43,848 Greg Sayers 13,855 41,751 Vanessa Neeson, JP 58,847 89,675 Caitlin Watson 28,572 - Luke Wilson 14,117 42,560 Vicki Watson 28,572 -
Lisa Whyte 13,855 41,751
Mike Williamson 28,572 - Total 398,396 393,813 Total 381,642 380,899 Howick Kaipātiki Garry Boles 43,427 42,760 Dr Grant Gillion 13,775 41,552 Katrina Bungard 43,427 42,760 John Gillon 42,179 41,552 David Collings 92,754 93,901 Paula Gillon 28,404 - Jim Donald, JP 43,427 42,760 Danielle Grant 68,729 41,552 Lucy Schwaner 16,522 42,760 Ann Hartley, JP 42,179 41,552 John Spiller 43,427 42,760 Richard Hills 13,775 41,552 Mike Turinsky 13,703 - Kay McIntyre, QSM 56,002 83,203 Steve Udy 15,342 51,120 Lorene Pigg 13,775 41,552 Adele White 43,427 42,760 Anne-Elise Smithson 28,404 - Bob Wichman 43,427 42,760 Adrian Tyler 28,404 - Peter Young, JP 29,245 - Lindsay Waugh 42,179 41,552 Total 428,128 444,341 Total 377,805 374,067

Auckland Council Annual Report 2016/2017
80 | Volume 3: Financial statements
Annual Report 2016/2017
80
Section F: Other disclosures
F5 Related parties transactions (continued)
Local government disclosures (continued) Local board members’ remuneration (continued)
$ 2017 2016 $ 2017 2016 Māngere-Ōtāhuhu Manurewa Tauanu'u Nick Bakulich 42,328 41,652 Joseph Allan 28,505 - Carrol Elliot, JP 42,328 41,652 Michael Bailey 13,823 41,652 Makalita Kolo 28,505 - Simeon Brown 39,070 41,652 Tafafuna'i Tasi Lauese, JP 42,328 41,652 Stella Cattle 28,505 - Christine O'Brien 42,328 41,652 Sarah Colcord 28,505 - Leau Peter Skelton 13,823 41,652 Angela Cunningham-Marino 42,328 41,652 Lemauga Lydia Sosene 81,522 81,315 Angela Dalton 83,083 83,723 Togiatolu Walter Togiamua 42,328 41,652 Hon George Hawkins, QSO 13,823 41,652
Danella McCormick 13,823 41,652
Rangi McLean 28,505 -
Ken Penney 42,328 41,652
Daryl Wrightson 13,823 41,652 Total 335,490 331,227 Total 376,121 375,287 Maungakiekie-Tāmaki Orākei Don Allan 28,337 - Ken Baguley 13,888 41,852 Josephine Bartley 66,878 41,449 Troy Churton 42,528 41,852 Debbie Burrows 28,337 - Carmel Claridge 28,639 - Brett Clark 13,743 41,449 Kate Cooke, JP 13,888 41,852 Bernie Diver 28,337 - Colin Davis, JP 68,416 41,852 Bridget Graham, QSM 13,743 41,449 Toni Millar, QSM, JP 28,639 - Nerissa Henry 28,337 - Kit Parkinson 42,528 41,852 Chris Makoare 42,079 41,449 Ros Rundle 28,639 - Simon Randall 26,733 80,600 Desley Simpson, JP 27,451 82,764 Obed Unasa 13,743 41,449 Mark Thomas 13,888 41,852 Alan Verrall 42,079 41,449 David Wong 28,639 - Debbie Burrows 332,346 329,294 Total 337,143 333,876 Ōtara-Papatoetoe Papakura Apulu Reece Autagavaia 28,639 - Felicity Auva'a 27,731 - Dr Ashraf Choudhary, QSO, JP 28,639 - Stuart Britnell 13,449 40,544 Fa’anānā Efeso Collins 27,353 82,454 Brent Catchpole 63,528 42,158 Lotu Fuli 68,705 41,852 Hon George Hawkins, QSO 27,731 - Stephen Grey 13,888 41,852 Bill McEntee 52,048 73,288 Mary Gush 42,528 41,852 Graham Purdy 13,449 40,544 Donna Lee 42,528 41,852 Michael Turner 41,179 40,544 John McCracken 13,888 41,852 Katrina Winn 41,179 40,544 Ross Robertson, QSO, JP 42,528 41,852 Dawn Trenberth 28,639 - Total 337,335 333,566 Total 280,294 277,622 Puketāpapa Rodney Anne-Marie Coury 28,135 - Brent Bailey 27,394 - Harry Doig 64,806 41,146 Tessa Berger 27,394 - Julie Fairey 53,481 76,410 Cameron Brewer 27,394 - David Holm 41,779 41,146 James Colville 13,285 40,038 Shail Kaushal 28,135 - Warren Flaunty, QSM 13,285 40,038 Ella Kumar, JP 41,779 41,146 Steven Garner 13,285 40,038 Nigel Turnbull 13,645 41,146 Thomas Grace 13,285 40,038 Michael Wood 13,645 41,146 Beth Houlbrooke 63,553 40,038
Louise Johnston 27,394 -
John McLean 13,285 40,038
Phelan Pirrie 42,679 42,518
Allison Roe, MBE 27,394 -
Greg Sayers 13,285 40,038
Colin Smith 27,394 -
Brenda Steele 52,235 74,884 Total 285,405 282,140 Total 402,541 397,668

Te Rīpoata ā-Tau 2016/2017 o Te Kaunihera
o Tāmaki Makaurau
Pokanga 3: Ngā Pūrongo Pūtea | 81
Annual Report 2016/2017
80
Section F: Other disclosures
F5 Related parties transactions (continued)
Local government disclosures (continued) Local board members’ remuneration (continued)
$ 2017 2016 $ 2017 2016 Māngere-Ōtāhuhu Manurewa Tauanu'u Nick Bakulich 42,328 41,652 Joseph Allan 28,505 - Carrol Elliot, JP 42,328 41,652 Michael Bailey 13,823 41,652 Makalita Kolo 28,505 - Simeon Brown 39,070 41,652 Tafafuna'i Tasi Lauese, JP 42,328 41,652 Stella Cattle 28,505 - Christine O'Brien 42,328 41,652 Sarah Colcord 28,505 - Leau Peter Skelton 13,823 41,652 Angela Cunningham-Marino 42,328 41,652 Lemauga Lydia Sosene 81,522 81,315 Angela Dalton 83,083 83,723 Togiatolu Walter Togiamua 42,328 41,652 Hon George Hawkins, QSO 13,823 41,652
Danella McCormick 13,823 41,652
Rangi McLean 28,505 -
Ken Penney 42,328 41,652
Daryl Wrightson 13,823 41,652 Total 335,490 331,227 Total 376,121 375,287 Maungakiekie-Tāmaki Orākei Don Allan 28,337 - Ken Baguley 13,888 41,852 Josephine Bartley 66,878 41,449 Troy Churton 42,528 41,852 Debbie Burrows 28,337 - Carmel Claridge 28,639 - Brett Clark 13,743 41,449 Kate Cooke, JP 13,888 41,852 Bernie Diver 28,337 - Colin Davis, JP 68,416 41,852 Bridget Graham, QSM 13,743 41,449 Toni Millar, QSM, JP 28,639 - Nerissa Henry 28,337 - Kit Parkinson 42,528 41,852 Chris Makoare 42,079 41,449 Ros Rundle 28,639 - Simon Randall 26,733 80,600 Desley Simpson, JP 27,451 82,764 Obed Unasa 13,743 41,449 Mark Thomas 13,888 41,852 Alan Verrall 42,079 41,449 David Wong 28,639 - Debbie Burrows 332,346 329,294 Total 337,143 333,876 Ōtara-Papatoetoe Papakura Apulu Reece Autagavaia 28,639 - Felicity Auva'a 27,731 - Dr Ashraf Choudhary, QSO, JP 28,639 - Stuart Britnell 13,449 40,544 Fa’anānā Efeso Collins 27,353 82,454 Brent Catchpole 63,528 42,158 Lotu Fuli 68,705 41,852 Hon George Hawkins, QSO 27,731 - Stephen Grey 13,888 41,852 Bill McEntee 52,048 73,288 Mary Gush 42,528 41,852 Graham Purdy 13,449 40,544 Donna Lee 42,528 41,852 Michael Turner 41,179 40,544 John McCracken 13,888 41,852 Katrina Winn 41,179 40,544 Ross Robertson, QSO, JP 42,528 41,852 Dawn Trenberth 28,639 - Total 337,335 333,566 Total 280,294 277,622 Puketāpapa Rodney Anne-Marie Coury 28,135 - Brent Bailey 27,394 - Harry Doig 64,806 41,146 Tessa Berger 27,394 - Julie Fairey 53,481 76,410 Cameron Brewer 27,394 - David Holm 41,779 41,146 James Colville 13,285 40,038 Shail Kaushal 28,135 - Warren Flaunty, QSM 13,285 40,038 Ella Kumar, JP 41,779 41,146 Steven Garner 13,285 40,038 Nigel Turnbull 13,645 41,146 Thomas Grace 13,285 40,038 Michael Wood 13,645 41,146 Beth Houlbrooke 63,553 40,038
Louise Johnston 27,394 -
John McLean 13,285 40,038
Phelan Pirrie 42,679 42,518
Allison Roe, MBE 27,394 -
Greg Sayers 13,285 40,038
Colin Smith 27,394 -
Brenda Steele 52,235 74,884 Total 285,405 282,140 Total 402,541 397,668
Annual Report 2016/2017
Volume 3: Financial statements 81
Section F: Other disclosures
F5 Related parties transactions (continued)
Local government disclosures (continued) Local board members’ remuneration (continued)
$ 2017 2016 $ 2017 2016 Upper Harbour Waiheke Uzra Casuri Balouch, JP 27,933 - Becs Ballard 8,145 24,568 Callum Blair 14,774 39,616 Shirin Brown 24,938 24,568 Nicholas Mayne 27,933 - Cath Handley 16,793 - John McLean 41,479 40,844 John Meeuwsen 24,938 24,568 Margaret Miles, JP 83,248 72,651 Beatle Treadwell 8,145 24,568 Brian Neeson, JP 43,953 43,190 Bob Upchurch 16,793 - Christine Rankin-MacIntyre 13,547 40,844 Paul Walden 58,092 58,483 Lisa Whyte 74,490 74,632 Total 327,357 311,777 Total 157,844 156,755 $ 2017 2016 $ 2017 2016 Waitākere Ranges Waitematā Sandra Coney, QSO 52,559 74,437 Shale Chambers 54,560 79,461 Neil Henderson 41,379 40,743 Adriana Avendario Christie 28,202 - Greg Presland 63,378 40,743 Pippa Coom 66,833 41,249 Steve Tollestrup 41,379 40,743 Mark Davy 28,202 - Saffron Toms 41,379 40,743 Christopher Dempsey 13,677 42,009 Denise Yates, JP 41,379 40,743 Greg Moyle 13,677 41,249
Richard Northey, ONZM 28,202 -
Vernon Tava 50,559 41,249
Rob Thomas 41,879 41,249
Deborah Yates 13,677 41,249 Total 281,453 278,152 Total 339,468 327,715 Whau Derek Battersby,QSM, JP 42,328 41,652 Ami Chand, JP 13,823 41,652 Catherine Farmer 55,482 81,315 Duncan Macdonald, JP 42,328 41,652 Ruby Manukia-Schaumkel 13,823 41,652 Simon Matafai 13,823 41,652 Te'eva Matafai 28,505 - Tracy Mulholland 53,770 - David Whitley 28,505 - Susan Zhu 42,328 41,652 Total 334,715 331,227
The total local board remuneration as at 30 June 2017 is $6,987,171 (2016: $6,929,428).

Auckland Council Annual Report 2016/2017
82 | Volume 3: Financial statements
Annual Report 2016/2017
82
Section F: Other disclosures
F6 Reconciliation of surplus/ (deficit) after income tax to net cash inflow from operating activities
Group Council
$million 2017 2016 2017 2016 Surplus/(deficit) after income tax 640 (231) (193) (636) Add/(less) non-cash items Depreciation and amortisation 874 829 256 237 Vested assets (374) (247) (106) (64) Net change in fair value of financial instruments (240) 554 (147) 416 Net increase in fair value of investment property (61) (62) (15) (17) Time value adjustments 46 13 44 13 Impairment of property, plant and equipment, receivables and other assets 28 28 14 11
Net loss/(gain) on disposal of property, plant and equipment and intangible assets 2 49 (5) 34 Share of surplus in associates and jointly-controlled entities (net of dividends received) (22) (18) (4) -
Other non-cash revenue (8) (22) (8) (22) Less items classified as investing or financing activities (76) (58) (33) (60) Add/(less) movements in working capital items 5 (64) (9) 13 Net cash inflow from operating activities 814 771 (206) (75)
F7 City Rail Link project (CRL project) The CRL is an underground rail line that will link Britomart and the city centre with the existing western line near Mt. Eden. The CRL project is a significant infrastructure project to enhance the capacity and performance of Auckland rail services and improve transport outcomes in Auckland. The Crown and the council (the Sponsors) have, through a Sponsors Agreement signed on 30 June 2017, agreed in principle to equally co-fund the development and delivery of CRL over the life of the project. The Sponsors have incorporated City Rail Link Limited (CRLL) which assumed the responsibility from Auckland Transport for the design and construction of the CRL from 1 July 2017 pursuant to the Project Delivery Agreement. The expected costs of the project are $3.4 billion which will be confirmed once all the contracts are finalised. The maximum funding limits for the project agreed by the Sponsors totals $3.6 billion. In line with the LTP 2015-2025, the council’s funding limit is $1.8 billion, inclusive of 50% of the costs already incurred by Auckland Transport. CRLL will make funding requests over the life of the project which is expected to be completed in 2023. The Group has assessed that the council and the Crown jointly control CRLL since the Sponsors have a binding agreement to share control in the governance of CRLL. The Sponsors have created a joint sponsors’ forum which is responsible for the top-level oversight of the CRL project and where the Sponsors approve major project decisions, which are key relevant activities of CRLL. To facilitate the transfer of responsibility for the CRL project from Auckland Transport to CRLL, existing project assets are being transferred from the council Group to CRLL as and from 1 July 2017 pursuant to the Asset Transfer Agreement. Subsequent to balance sheet date, CRLL obtained the necessary authority to assume responsibility of the CRL project and the Crown’s commitments came into effect. Non-current assets held for sale At 30 June 2017, Auckland Transport has reclassified the CRL assets of $435 million to non-current assets held for transfer, previously under property, plant and equipment since CRLL has assumed responsibility to complete the CRL project effective 1 July 2017.
Te Rīpoata ā-Tau 2016/2017 o Te Kaunihera
o Tāmaki Makaurau
Pokanga 3: Ngā Pūrongo Pūtea | 83
Annual Report 2016/2017
Volume 3: Financial statements 83
Section F: Other disclosures
F7 City Rail Link project (CRL project) (continued) The Group will contribute 100% of the CRL assets to get a 50% share of CRLL. The Crown will reimburse the Group in the form of cash paid to the council equal to 50% of the costs incurred by the Group in respect of the CRL project to date for its 50% share in CRLL. This will establish the new co-funded go-forward position for the CRL project. At a group level, since the council will retain 50% control of CRL assets as a co-sponsor in funding CRLL, at 30 June 2017, the Group classified 50% of CRL assets to non-current assets held for sale from property, plant and equipment’s operational land and buildings and work in progress. The carrying value of 50% of CRL assets held for sale as at 30 June 2017 amounted to $217 million. No impairment loss was recognised upon the reclassification of the 50% CRL assets. Refer to Notes D3 and D4 for liabilities in relation to CRL project. Capital commitments The capital commitments under Note F4 include Auckland Transport’s commitments in respect of the CRL project of $324 million as at 30 June 2017 (30 June 2016: $185 million).

Auckland Council Annual Report 2016/2017
84 | Volume 3: Financial statements
Annual Report 2016/2017
84
Section G: Financial reporting and prudence benchmarks Annual report disclosure statement for the year ended 30 June 2017 What is the purpose of this statement? The purpose of this statement is to disclose the Group’s financial performance in relation to various benchmarks to enable the assessment of whether the Group and the council are prudently managing their revenues, expenses, assets, liabilities, and general financial dealings. The council is required to include this statement in its annual report in accordance with the Local Government (Financial Reporting and Prudence) Regulations 2014 (the regulations). Refer to the regulations for more information, including definitions of some of the terms used in this statement. The benchmarks have been prepared for the full Auckland Council Group including Watercare Services Ltd, Auckland Transport and Ports of Auckland Ltd with the exception of the debt affordability section which excludes Watercare Services Ltd and other specified debt. Watercare is excluded from the calculation of prudential ratios as it is not reliant on the council to fund its operation. Unless prescribed by the regulations, the quantified limit for each benchmark is calculated using financial information disclosed in the LTP including the prospective financial statements. Rates affordability benchmark The Group meets the rates affordability benchmark if:
its actual rates income equals or is less than each quantified limit on rates, and its actual rates increase equals or is less than each quantified limit on rates increases.
Rates (income) affordability The following graph compares the Group’s general rates income including growth in the rating base with the quantified limit contained in the LTP.
Rate (increases) affordability The following graph compares the year-on-year actual and the LTP percentage increase in the group's rates income. The quantified limit is calculated using the increase in rates income, exclusive of growth in the rating base. Due to the unavailability of the general rates number for 2012, the movements for the June 2013 year has not been disclosed.
1,260 1,334
1,417 1,434 1,507
1,224 1,282 1,338 1,426 1,487
-
200
400
600
800
1,000
1,200
1,400
1,600
30 Jun 2013 30 Jun 2014 30 Jun 2015 30 Jun 2016 30 Jun 2017
Rat
es in
com
e ($
mill
ion)
Quantified limit on rates income
Actual rates income (at or within limit)
Actual rates income (exceeds limit)
4.90% 4.90%
3.50% 3.50% 3.67% 3.31%
2.32% 2.57%
0.00%
1.00%
2.00%
3.00%
4.00%
5.00%
6.00%
30 Jun 2014 30 Jun 2015 30 Jun 2016 30 Jun 2017
Rat
es in
ceas
e (%
) Quantified limit on rates increase
Actual rates increase (at or within limit)
Actual rates incease (exceeds limit)
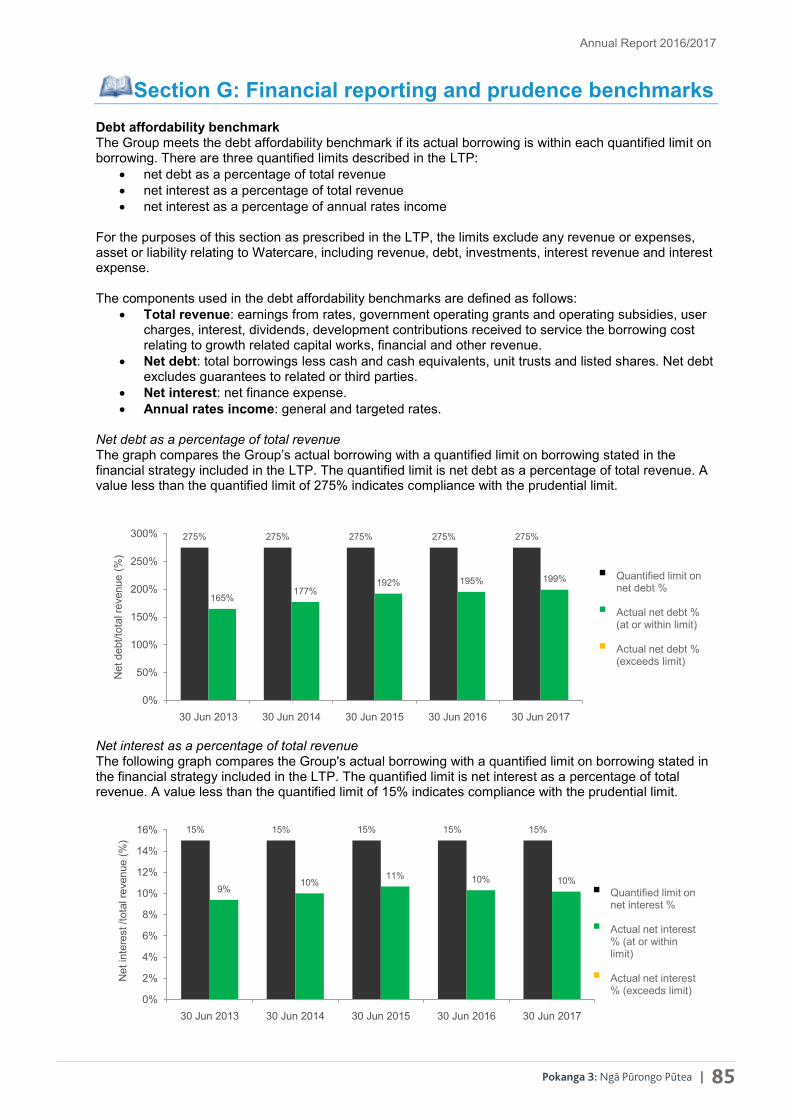
Te Rīpoata ā-Tau 2016/2017 o Te Kaunihera
o Tāmaki Makaurau
Pokanga 3: Ngā Pūrongo Pūtea | 85
Annual Report 2016/2017
84
Section G: Financial reporting and prudence benchmarks Annual report disclosure statement for the year ended 30 June 2017 What is the purpose of this statement? The purpose of this statement is to disclose the Group’s financial performance in relation to various benchmarks to enable the assessment of whether the Group and the council are prudently managing their revenues, expenses, assets, liabilities, and general financial dealings. The council is required to include this statement in its annual report in accordance with the Local Government (Financial Reporting and Prudence) Regulations 2014 (the regulations). Refer to the regulations for more information, including definitions of some of the terms used in this statement. The benchmarks have been prepared for the full Auckland Council Group including Watercare Services Ltd, Auckland Transport and Ports of Auckland Ltd with the exception of the debt affordability section which excludes Watercare Services Ltd and other specified debt. Watercare is excluded from the calculation of prudential ratios as it is not reliant on the council to fund its operation. Unless prescribed by the regulations, the quantified limit for each benchmark is calculated using financial information disclosed in the LTP including the prospective financial statements. Rates affordability benchmark The Group meets the rates affordability benchmark if:
its actual rates income equals or is less than each quantified limit on rates, and its actual rates increase equals or is less than each quantified limit on rates increases.
Rates (income) affordability The following graph compares the Group’s general rates income including growth in the rating base with the quantified limit contained in the LTP.
Rate (increases) affordability The following graph compares the year-on-year actual and the LTP percentage increase in the group's rates income. The quantified limit is calculated using the increase in rates income, exclusive of growth in the rating base. Due to the unavailability of the general rates number for 2012, the movements for the June 2013 year has not been disclosed.
1,260 1,334
1,417 1,434 1,507
1,224 1,282 1,338 1,426 1,487
-
200
400
600
800
1,000
1,200
1,400
1,600
30 Jun 2013 30 Jun 2014 30 Jun 2015 30 Jun 2016 30 Jun 2017
Rat
es in
com
e ($
mill
ion)
Quantified limit on rates income
Actual rates income (at or within limit)
Actual rates income (exceeds limit)
4.90% 4.90%
3.50% 3.50% 3.67% 3.31%
2.32% 2.57%
0.00%
1.00%
2.00%
3.00%
4.00%
5.00%
6.00%
30 Jun 2014 30 Jun 2015 30 Jun 2016 30 Jun 2017
Rat
es in
ceas
e (%
) Quantified limit on rates increase
Actual rates increase (at or within limit)
Actual rates incease (exceeds limit)
Annual Report 2016/2017
Volume 3: Financial statements 85
Section G: Financial reporting and prudence benchmarks Debt affordability benchmark The Group meets the debt affordability benchmark if its actual borrowing is within each quantified limit on borrowing. There are three quantified limits described in the LTP:
net debt as a percentage of total revenue net interest as a percentage of total revenue net interest as a percentage of annual rates income
For the purposes of this section as prescribed in the LTP, the limits exclude any revenue or expenses, asset or liability relating to Watercare, including revenue, debt, investments, interest revenue and interest expense. The components used in the debt affordability benchmarks are defined as follows:
Total revenue: earnings from rates, government operating grants and operating subsidies, user charges, interest, dividends, development contributions received to service the borrowing cost relating to growth related capital works, financial and other revenue.
Net debt: total borrowings less cash and cash equivalents, unit trusts and listed shares. Net debt excludes guarantees to related or third parties.
Net interest: net finance expense. Annual rates income: general and targeted rates.
Net debt as a percentage of total revenue The graph compares the Group’s actual borrowing with a quantified limit on borrowing stated in the financial strategy included in the LTP. The quantified limit is net debt as a percentage of total revenue. A value less than the quantified limit of 275% indicates compliance with the prudential limit.
Net interest as a percentage of total revenue The following graph compares the Group's actual borrowing with a quantified limit on borrowing stated in the financial strategy included in the LTP. The quantified limit is net interest as a percentage of total revenue. A value less than the quantified limit of 15% indicates compliance with the prudential limit.
275% 275% 275% 275% 275%
165% 177%
192% 195% 199%
0%
50%
100%
150%
200%
250%
300%
30 Jun 2013 30 Jun 2014 30 Jun 2015 30 Jun 2016 30 Jun 2017
Net
deb
t/tot
al re
venu
e (%
)
Quantified limit on net debt %
Actual net debt % (at or within limit)
Actual net debt % (exceeds limit)
15% 15% 15% 15% 15%
9% 10%
11% 10% 10%
0%
2%
4%
6%
8%
10%
12%
14%
16%
30 Jun 2013 30 Jun 2014 30 Jun 2015 30 Jun 2016 30 Jun 2017
Net
inte
rest
/tot
al re
venu
e (%
)
Quantified limit on net interest %
Actual net interest % (at or within limit)
Actual net interest % (exceeds limit)

Auckland Council Annual Report 2016/2017
86 | Volume 3: Financial statements
Annual Report 2016/2017
86
Section G: Financial reporting and prudence benchmarks Debt affordability benchmark (continued) Net interest as a percentage of annual rates income The graph compares the Group's actual borrowing with a quantified limit on borrowing stated in the financial strategy included in the Group's LTP. The quantified limit is net interest as a percentage of annual rates income. A value less than the quantified limit of 25% indicates compliance with the prudential limit.
Balanced budget benchmark The graph displays the Group’s revenue (excluding development contributions, financial contributions, vested assets, gains on derivatives financial instruments, and revaluations of property, plant, or equipment) as a proportion of operating expenses (excluding losses on derivative financial instruments and revaluations of property, plant, or equipment). The Group meets this benchmark if its revenue equals or is greater than its operating expenses. For the purpose of the balanced budget benchmark, movements in derivative financial instruments have been excluded in accordance with the disclosure requirement. The Group has entered into derivative transactions to mitigate any foreign currency exposure from its offshore borrowings as required by its risk management policies, therefore FX volatility has been included in this benchmark even though it has been fully mitigated. The results do not reflect the full economic substance of the transaction. Refer to note E1 for further details of the council’s risk management policies on foreign exchange risk. The adjusted revenue was lower than the adjusted operating expenses in 2015 and 2017, mainly due to expenses incurred being greater than budget. Please see section A of this volume for the variance analysis on the "Results of Operations".
25% 25% 25% 25% 25%
16% 17% 19% 18% 18%
0%
5%
10%
15%
20%
25%
30%
30 Jun 2013 30 Jun 2014 30 Jun 2015 30 Jun 2016 30 Jun 2017Net
inte
rest
/ann
ual r
ates
inco
me
(%)
Quantified limit on net interest %
Actual net interest % (at or within limit)
Actual net interest % (exceeds limit)
100% 101% 91% 101% 98%
0%
20%
40%
60%
80%
100%
120%
30 Jun 2013 30 Jun 2014 30 Jun 2015 30 Jun 2016 30 Jun 2017
Rev
enue
/exp
endi
ture
(%)
Benchmark met
Benchmark not met

Te Rīpoata ā-Tau 2016/2017 o Te Kaunihera
o Tāmaki Makaurau
Pokanga 3: Ngā Pūrongo Pūtea | 87
Annual Report 2016/2017
86
Section G: Financial reporting and prudence benchmarks Debt affordability benchmark (continued) Net interest as a percentage of annual rates income The graph compares the Group's actual borrowing with a quantified limit on borrowing stated in the financial strategy included in the Group's LTP. The quantified limit is net interest as a percentage of annual rates income. A value less than the quantified limit of 25% indicates compliance with the prudential limit.
Balanced budget benchmark The graph displays the Group’s revenue (excluding development contributions, financial contributions, vested assets, gains on derivatives financial instruments, and revaluations of property, plant, or equipment) as a proportion of operating expenses (excluding losses on derivative financial instruments and revaluations of property, plant, or equipment). The Group meets this benchmark if its revenue equals or is greater than its operating expenses. For the purpose of the balanced budget benchmark, movements in derivative financial instruments have been excluded in accordance with the disclosure requirement. The Group has entered into derivative transactions to mitigate any foreign currency exposure from its offshore borrowings as required by its risk management policies, therefore FX volatility has been included in this benchmark even though it has been fully mitigated. The results do not reflect the full economic substance of the transaction. Refer to note E1 for further details of the council’s risk management policies on foreign exchange risk. The adjusted revenue was lower than the adjusted operating expenses in 2015 and 2017, mainly due to expenses incurred being greater than budget. Please see section A of this volume for the variance analysis on the "Results of Operations".
25% 25% 25% 25% 25%
16% 17% 19% 18% 18%
0%
5%
10%
15%
20%
25%
30%
30 Jun 2013 30 Jun 2014 30 Jun 2015 30 Jun 2016 30 Jun 2017Net
inte
rest
/ann
ual r
ates
inco
me
(%)
Quantified limit on net interest %
Actual net interest % (at or within limit)
Actual net interest % (exceeds limit)
100% 101% 91% 101% 98%
0%
20%
40%
60%
80%
100%
120%
30 Jun 2013 30 Jun 2014 30 Jun 2015 30 Jun 2016 30 Jun 2017
Rev
enue
/exp
endi
ture
(%)
Benchmark met
Benchmark not met
Annual Report 2016/2017
Volume 3: Financial statements 87
Section G: Financial reporting and prudence benchmarks Essential services benchmark The graph displays the Group’s capital expenditure on network services as a proportion of depreciation on network services. The Group meets this benchmark if its capital expenditure on network services equals or is greater than depreciation on network services.
Debt servicing benchmark The graph displays the Group’s borrowing costs as a proportion of revenue (excluding development contributions, financial contributions, vested assets, gains on derivative financial instruments, and revaluations of property, plant, or equipment). Because Statistics New Zealand projects the council’s population will grow as fast as, or faster than, the national population growth rate, it meets the debt servicing benchmark if its borrowing costs equal or are less than 15% of its revenue.
Debt control benchmark The graph displays the Group’s actual net debt as a proportion of planned net debt. In this statement, net debt means financial liabilities less financial assets (excluding trade and other receivables). The Group meets the debt control benchmark if its actual net debt equals or is less than its planned net debt. The 2016 net debt was adversely impacted by derivatives which were higher than planned as a result of the volatility in interest rates during the financial year which was not budgeted (refer to note C2). Also included in net debt is borrowings that were lower than planned (refer to note C1).
186% 176%
148% 142% 158%
0%20%40%60%80%
100%120%140%160%180%200%
30 Jun 2013 30 Jun 2014 30 Jun 2015 30 Jun 2016 30 Jun 2017
Cap
ital e
xpen
ditu
re/d
epre
ciat
ion
(%)
Benchmark met
Benchmark not met
10.7% 11.0% 11.8% 11.1% 11.4%
0.0%
5.0%
10.0%
15.0%
20.0%
30 Jun 2013 30 Jun 2014 30 Jun 2015 30 Jun 2016 30 Jun 2017
Bor
row
ing
cost
s/re
venu
e (%
)
Benchmark met
Benchmark not met
96% 92% 95% 104% 99%
0%
20%
40%
60%
80%
100%
120%
30 Jun 2013 30 Jun 2014 30 Jun 2015 30 Jun 2016 30 Jun 2017
Act
ual/b
udge
ted
net d
ebt (
%)
Benchmark met
Benchmark not met

Auckland Council Annual Report 2016/2017
88 | Volume 3: Financial statements
Annual Report 2016/2017
88
Section G: Financial reporting and prudence benchmarks Operations control benchmark This graph displays the Group’s actual net cash flow from operations as a proportion of its planned net cash flow from operations in the LTP. The Group meets the operations control benchmark if its actual net cash flow from operations equals or is greater than its planned net cash flow from operations. The 2013 actual cash flow was less than planned due to lower than expected cash receipts from rates and other fees. The 2016 and 2017 actual cashflows was less than planned due to higher than expected cash outflows for delivery of council services and maintenance of council assets (refer to Section A for the variance analysis on the "Results of Operations").
84%
134%
103% 91%
79%
0%
20%
40%
60%
80%
100%
120%
140%
160%
30 Jun 2013 30 Jun 2014 30 Jun 2015 30 Jun 2016 30 Jun 2017
Act
ual/b
udge
t net
cas
h flo
w fr
om
oper
atio
ns (%
)
Benchmark met
Benchmark not met
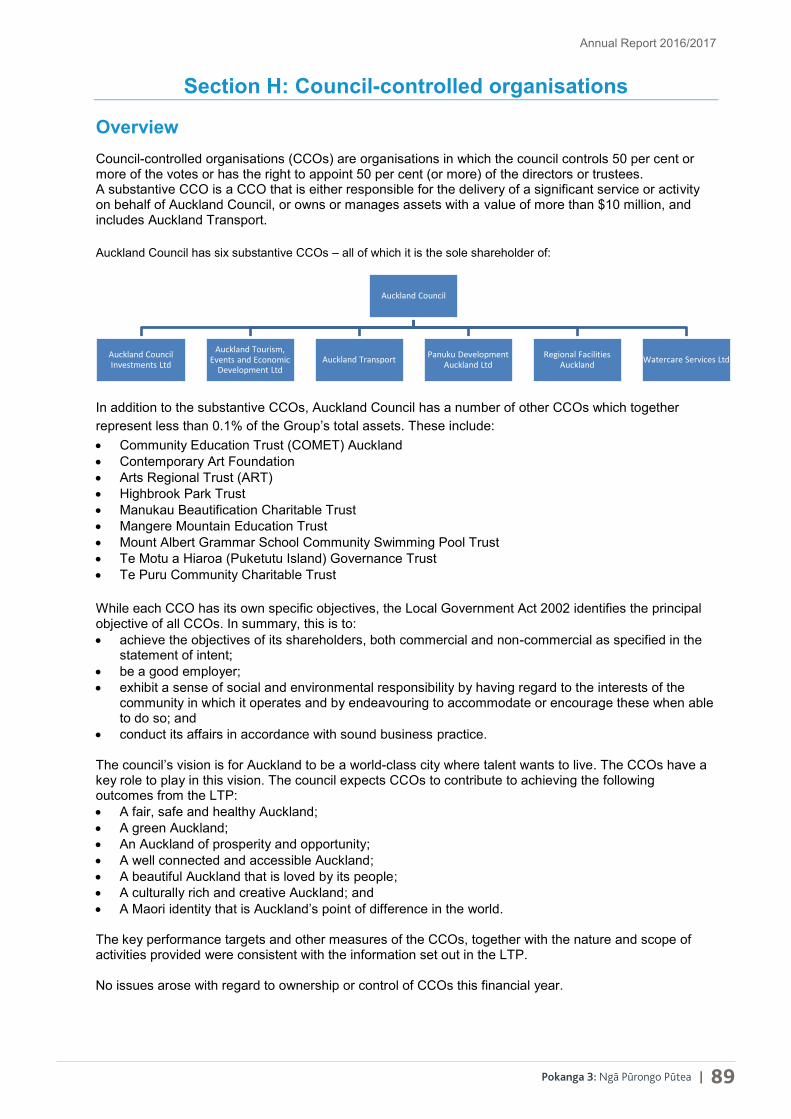
Te Rīpoata ā-Tau 2016/2017 o Te Kaunihera
o Tāmaki Makaurau
Pokanga 3: Ngā Pūrongo Pūtea | 89
Annual Report 2016/2017
88
Section G: Financial reporting and prudence benchmarks Operations control benchmark This graph displays the Group’s actual net cash flow from operations as a proportion of its planned net cash flow from operations in the LTP. The Group meets the operations control benchmark if its actual net cash flow from operations equals or is greater than its planned net cash flow from operations. The 2013 actual cash flow was less than planned due to lower than expected cash receipts from rates and other fees. The 2016 and 2017 actual cashflows was less than planned due to higher than expected cash outflows for delivery of council services and maintenance of council assets (refer to Section A for the variance analysis on the "Results of Operations").
84%
134%
103% 91%
79%
0%
20%
40%
60%
80%
100%
120%
140%
160%
30 Jun 2013 30 Jun 2014 30 Jun 2015 30 Jun 2016 30 Jun 2017
Act
ual/b
udge
t net
cas
h flo
w fr
om
oper
atio
ns (%
)
Benchmark met
Benchmark not met
Annual Report 2016/2017
Volume 3: Financial statements 89
Section H: Council-controlled organisations
Overview Council-controlled organisations (CCOs) are organisations in which the council controls 50 per cent or more of the votes or has the right to appoint 50 per cent (or more) of the directors or trustees. A substantive CCO is a CCO that is either responsible for the delivery of a significant service or activity on behalf of Auckland Council, or owns or manages assets with a value of more than $10 million, and includes Auckland Transport. Auckland Council has six substantive CCOs – all of which it is the sole shareholder of:
In addition to the substantive CCOs, Auckland Council has a number of other CCOs which together represent less than 0.1% of the Group’s total assets. These include: Community Education Trust (COMET) Auckland Contemporary Art Foundation Arts Regional Trust (ART) Highbrook Park Trust Manukau Beautification Charitable Trust Mangere Mountain Education Trust Mount Albert Grammar School Community Swimming Pool Trust Te Motu a Hiaroa (Puketutu Island) Governance Trust Te Puru Community Charitable Trust While each CCO has its own specific objectives, the Local Government Act 2002 identifies the principal objective of all CCOs. In summary, this is to: achieve the objectives of its shareholders, both commercial and non-commercial as specified in the
statement of intent; be a good employer; exhibit a sense of social and environmental responsibility by having regard to the interests of the
community in which it operates and by endeavouring to accommodate or encourage these when able to do so; and
conduct its affairs in accordance with sound business practice. The council’s vision is for Auckland to be a world-class city where talent wants to live. The CCOs have a key role to play in this vision. The council expects CCOs to contribute to achieving the following outcomes from the LTP: A fair, safe and healthy Auckland; A green Auckland; An Auckland of prosperity and opportunity; A well connected and accessible Auckland; A beautiful Auckland that is loved by its people; A culturally rich and creative Auckland; and A Maori identity that is Auckland’s point of difference in the world. The key performance targets and other measures of the CCOs, together with the nature and scope of activities provided were consistent with the information set out in the LTP. No issues arose with regard to ownership or control of CCOs this financial year.
Auckland Council
Auckland Council Investments Ltd
Auckland Tourism, Events and Economic
Development Ltd Auckland Transport Panuku Development
Auckland Ltd Regional Facilities
Auckland Watercare Services Ltd

Auckland Council Annual Report 2016/2017
90 | Volume 3: Financial statements
Annual Report 2016/2017
90
Section H: Council-controlled organisations
Overview Auckland Council Investments Ltd (ACIL) owns on behalf of the people of Auckland, Ports of Auckland Ltd (POAL), Auckland Film Studios Ltd (AFSL), and a large equity holding in Auckland International Airport Ltd (AIAL). The purpose of ACIL is to support the council’s vision and to bring a strong commercial and strategic focus to the ownership and management of the council’s investments in POAL, AIAL and AFSL. ACIL’s role is to maximise the contribution of these assets to the Auckland economy and provide substantial financial returns, which are financially sustainable in the long run. The council’s Finance and Performance Committee approved on 26 July 2017 the distribution of AFSL’s assets and liabilities to the council. Objectives and contribution to LTP ACIL holds equity interests in POAL, AIAL, AFSL. These assets contribute to the council’s delivery of Auckland Plan outcomes by: • Providing strong governance and commercial
focus to the ownership of the council’s major equity investments;
• Keeping strategic assets in public ownership; • Managing assets including POAL and AIAL
shares strategically and prudently to optimise their long-term benefit for the region.
Activities ACIL’s activities include: • Commercial focus on the ownership and
management of Council’s investments; • Maximise contribution to Auckland economy and
provide substantial financial returns, which are sustainable in the long term.
For information on the above activities, actual performance, key performance targets and other measures set out in the LTP see Governance and support theme in volume 1 of this annual report.
Directors • Keith Taylor
(Chairperson)
• Hinerangi Raumati
• Linda Robertson

Te Rīpoata ā-Tau 2016/2017 o Te Kaunihera
o Tāmaki Makaurau
Pokanga 3: Ngā Pūrongo Pūtea | 91
Annual Report 2016/2017
90
Section H: Council-controlled organisations
Overview Auckland Council Investments Ltd (ACIL) owns on behalf of the people of Auckland, Ports of Auckland Ltd (POAL), Auckland Film Studios Ltd (AFSL), and a large equity holding in Auckland International Airport Ltd (AIAL). The purpose of ACIL is to support the council’s vision and to bring a strong commercial and strategic focus to the ownership and management of the council’s investments in POAL, AIAL and AFSL. ACIL’s role is to maximise the contribution of these assets to the Auckland economy and provide substantial financial returns, which are financially sustainable in the long run. The council’s Finance and Performance Committee approved on 26 July 2017 the distribution of AFSL’s assets and liabilities to the council. Objectives and contribution to LTP ACIL holds equity interests in POAL, AIAL, AFSL. These assets contribute to the council’s delivery of Auckland Plan outcomes by: • Providing strong governance and commercial
focus to the ownership of the council’s major equity investments;
• Keeping strategic assets in public ownership; • Managing assets including POAL and AIAL
shares strategically and prudently to optimise their long-term benefit for the region.
Activities ACIL’s activities include: • Commercial focus on the ownership and
management of Council’s investments; • Maximise contribution to Auckland economy and
provide substantial financial returns, which are sustainable in the long term.
For information on the above activities, actual performance, key performance targets and other measures set out in the LTP see Governance and support theme in volume 1 of this annual report.
Directors • Keith Taylor
(Chairperson)
• Hinerangi Raumati
• Linda Robertson
Annual Report 2016/2017
Volume 3: Financial statements 91
Section H: Council-controlled organisations
Overview Auckland Tourism, Events and Economic Development Ltd’s (ATEED’s) role is to support the Council’s vision of creating the world’s most liveable city and deliver great value for money by supporting the growth of a vibrant and competitive economy, with a particular focus on facilitating new smart money and high value jobs for Auckland. Objectives and contribution to LTP ATEED is to contribute to the following priorities from the Auckland Plan and the Auckland Council Economic Development Strategy: • Develop an ‘innovation hub of the Asia-Pacific
region’; • An ‘internationally connected and export driven
city’; • Develop ‘a business friendly and well-functioning
city’; • Invest in ‘people to grow skills and local
workforce’; • Creating ‘a vibrant, creative international city’. ATEED is to help support and enhance the performance of the Auckland region as a growth engine in the New Zealand economy. ATEED is to recognise the Government as a strategic partner and align with policy and funding for economic development, events and tourism that is targeted at the regional level.
Activities ATEED’s activities focus on economic growth, growing the visitor economy, and include the following: • Grow the Auckland economy by creating an
environment that attracts both new residents, visitors, new business and investment;
• Working with the private sector and government partners:
• to stimulate innovation and entrepreneurship; • to attract new business investment; • to grow a skilled workforce; • to enable education and talent; • to grow the visitor economy; • to build Auckland’s brand and identity; • Continuing to expand Auckland as a world-leading
events city through attracting, delivering and/or supporting an annual portfolio of more than 30 major events, including the World Masters Game 2017;
• Developing the potential of the region’s Māori economy, particularly in tourism, innovation and information communications technology;
• Delivering the Aroha Auckland programme that provides post-investment support for multi-national companies and international investors;
• Developing GridAKL and The FoodBowl to stimulate innovation;
• Develop export markets for Auckland companies.
For information on the above activities, actual performance, key performance targets and other measures set out in the LTP see Economic and cultural development theme in volume 1 of this annual report.
Directors • David McConnell
(Chairperson) • Danny Chan
• Norman Thompson (Deputy Chairperson)
• Professor Stuart McCutcheon
• Franceska Banga • Helen Robinson • Mike Taitoko

Auckland Council Annual Report 2016/2017
92 | Volume 3: Financial statements
Annual Report 2016/2017
92
Section H: Council-controlled organisations
Overview Auckland Transport is responsible for managing the region’s transport system. It provides all of Auckland’s transport requirements (except state highways and Auckland motorways) ranging from roads and footpaths to traffic signals, and managing bus and train services and street parking. Auckland Transport was legally constituted under part 4 of the Local Government (Auckland Council) Act 2009 on 1 November 2010. Auckland Transport is a body corporate with perpetual succession. For the purposes of the Local Government Act 2002, the council must be treated as if it were the sole shareholder of Auckland Transport. Objectives and contribution to LTP Auckland Transport is to contribute to an efficient, sustainable, energy saving and cost effective land transport system to support Auckland’s social, economic, environmental and cultural well-being. Auckland Transport is to create better connections and accessibility within Auckland by:
• Managing Auckland’s transport as a single system; • Integrating transport planning with land use
development; • Prioritising and optimising investment across
transport modes; • Implementing new transport funding
mechanisms. Auckland Transport is to deliver infrastructure and services to support a transformational shift towards greater use of passenger transport. Auckland Transport should have regards to: • Building resilience to natural hazards; • Auckland Plan urban design principles; • Realising a quality compact city.
Activities The activities of Auckland Transport are centred on delivering transport services, such as: • Construction and maintenance of roads, footpaths,
and streetscape amenities; • Providing public transport facilities and services,
including bus, rail and ferry services, and their associated infrastructure;
• Operating traffic signal networks; • Providing parking facilities and enforcement; • Establishing and promoting road safety and school
travel initiatives. For information on the above activities, actual performance, key performance targets and other measures set out in the LTP see Transport theme in volume 1 of this annual report.
Directors • Dr Lester Levy (Chairperson) • Sir Michael Cullen • Mark Gilbert • Ernst Zőllner
• Wayne Donnelly (Deputy Chairperson)
• Rabin Rabindran
• Kylie Clegg • Mary-Jane Daly • Dame Paula Rebstock

Te Rīpoata ā-Tau 2016/2017 o Te Kaunihera
o Tāmaki Makaurau
Pokanga 3: Ngā Pūrongo Pūtea | 93
Annual Report 2016/2017
92
Section H: Council-controlled organisations
Overview Auckland Transport is responsible for managing the region’s transport system. It provides all of Auckland’s transport requirements (except state highways and Auckland motorways) ranging from roads and footpaths to traffic signals, and managing bus and train services and street parking. Auckland Transport was legally constituted under part 4 of the Local Government (Auckland Council) Act 2009 on 1 November 2010. Auckland Transport is a body corporate with perpetual succession. For the purposes of the Local Government Act 2002, the council must be treated as if it were the sole shareholder of Auckland Transport. Objectives and contribution to LTP Auckland Transport is to contribute to an efficient, sustainable, energy saving and cost effective land transport system to support Auckland’s social, economic, environmental and cultural well-being. Auckland Transport is to create better connections and accessibility within Auckland by:
• Managing Auckland’s transport as a single system; • Integrating transport planning with land use
development; • Prioritising and optimising investment across
transport modes; • Implementing new transport funding
mechanisms. Auckland Transport is to deliver infrastructure and services to support a transformational shift towards greater use of passenger transport. Auckland Transport should have regards to: • Building resilience to natural hazards; • Auckland Plan urban design principles; • Realising a quality compact city.
Activities The activities of Auckland Transport are centred on delivering transport services, such as: • Construction and maintenance of roads, footpaths,
and streetscape amenities; • Providing public transport facilities and services,
including bus, rail and ferry services, and their associated infrastructure;
• Operating traffic signal networks; • Providing parking facilities and enforcement; • Establishing and promoting road safety and school
travel initiatives. For information on the above activities, actual performance, key performance targets and other measures set out in the LTP see Transport theme in volume 1 of this annual report.
Directors • Dr Lester Levy (Chairperson) • Sir Michael Cullen • Mark Gilbert • Ernst Zőllner
• Wayne Donnelly (Deputy Chairperson)
• Rabin Rabindran
• Kylie Clegg • Mary-Jane Daly • Dame Paula Rebstock
Annual Report 2016/2017
Volume 3: Financial statements 93
Section H: Council-controlled organisations
Overview Panuku Development Auckland Ltd, contributes to the implementation of the Auckland Plan and encourages economic development by facilitating the redevelopment of town centres that optimises and integrates good public transport outcomes, efficient and sustainable infrastructure and quality public services and amenities. Panuku Development Auckland also manages the council’s properties that are not immediately required for service delivery, and commercial properties owned by Auckland Transport and the council that are held to generate revenue. The aim of Panuku Development Auckland is to achieve an overall balance of commercial and strategic outcomes. Objectives and contribution to LTP The objectives of Panuku Development Auckland are to: • Facilitate redevelopment of urban locations
agreed to by council; • Accommodate residential and/or commercial
growth in those locations; • Redevelopment of Auckland’s waterfront; • Optimisation of council’s property portfolio; • Contribute to the management of council owned
properties which are currently not used for the delivery of council services.
Activities Panuku Development Auckland’s activities cover four broad areas: • Redevelopment of urban locations and council
owned land within the rural urban boundary; • Redevelopment of council non-service property and
where appropriate, review of council service property; • Management of council non-service property and a
range of other council owned commercial assets; • Other property related services such as property
advice, acquisition and disposals. For information on the above activities, actual performance, key performance targets and other measures set out in the LTP see Auckland development theme in volume 1 of this annual report.
Directors • Richard Aitken
(Chairperson) • Richard Leggat • Mike Pohio
• Anne Blackburn • Susan Macken • Martin Udale
• Evan Davies • Paul Majurey

Auckland Council Annual Report 2016/2017
94 | Volume 3: Financial statements
Annual Report 2016/2017
94
Section H: Council-controlled organisations
Overview Regional Facilities Auckland (RFA) is responsible for providing a regional approach to running and developing Auckland’s arts, culture, heritage, leisure, sport and entertainment venues including ANZ Viaduct Events Centre, Aotea Centre, Aotea Square, Auckland Art Gallery Toi o Tāmaki, Auckland Town Hall, Auckland Zoo, Bruce Mason Centre, Mt Smart Stadium, The Civic, QBE Stadium and Western Springs Stadium. Objectives and contribution to LTP The objectives of RFA include: • To offer experiences to improve the cultural,
environmental and social wellbeing of residents and visitors;
• To contribute to the growth of the Auckland economy;
• To operate as a successful business utilising sound business practice and commercial acumen to make sure Aucklanders receive value for investment in regional facilities.
These objectives shall be facilitated through RFA’s management of assets and the funding decisions. RFA is to recognise Government as a strategic partner and align with policy and funding for arts, culture, heritage and cultural institutions that is targeted at the regional level.
Activities RFA’s activities include the following: • Acts as a regional voice for arts, culture, heritage,
leisure, sports and entertainment issues; • Advocates, co-ordinates and leads strategic thinking
for investing in new collections and arts, cultural, heritage, leisure, sport and entertainment facilities for Auckland;
• Develops, with a regional perspective, a range of fit-for-purpose arts, cultural, heritage, leisure, sport, entertainment and events venues that are attractive to the residents and businesses of the region, and to its visitors;
• Plans for and implements regionally identified projects;
• Nurtures region-wide arts, cultural and heritage activities and organisations;
• Secures Auckland-exclusive international musicals, rock concerts, sporting events and art exhibitions to drive out of town visitation and investment in Auckland’s economy.
For information on the above activities, actual performance, key performance targets and other measures set out in the LTP see Economic and cultural development theme in volume 1 of this annual report.
Directors • Sir Don McKinnon
(Chairperson) • Geoff Clews • John Robertson
• Joanna Perry (Deputy Chairperson)
• Andrew Collow • Rukumoana
Schaafhausen
• Lisa Bates • Fabian Partigliani • Gary Troup

Te Rīpoata ā-Tau 2016/2017 o Te Kaunihera
o Tāmaki Makaurau
Pokanga 3: Ngā Pūrongo Pūtea | 95
Annual Report 2016/2017
94
Section H: Council-controlled organisations
Overview Regional Facilities Auckland (RFA) is responsible for providing a regional approach to running and developing Auckland’s arts, culture, heritage, leisure, sport and entertainment venues including ANZ Viaduct Events Centre, Aotea Centre, Aotea Square, Auckland Art Gallery Toi o Tāmaki, Auckland Town Hall, Auckland Zoo, Bruce Mason Centre, Mt Smart Stadium, The Civic, QBE Stadium and Western Springs Stadium. Objectives and contribution to LTP The objectives of RFA include: • To offer experiences to improve the cultural,
environmental and social wellbeing of residents and visitors;
• To contribute to the growth of the Auckland economy;
• To operate as a successful business utilising sound business practice and commercial acumen to make sure Aucklanders receive value for investment in regional facilities.
These objectives shall be facilitated through RFA’s management of assets and the funding decisions. RFA is to recognise Government as a strategic partner and align with policy and funding for arts, culture, heritage and cultural institutions that is targeted at the regional level.
Activities RFA’s activities include the following: • Acts as a regional voice for arts, culture, heritage,
leisure, sports and entertainment issues; • Advocates, co-ordinates and leads strategic thinking
for investing in new collections and arts, cultural, heritage, leisure, sport and entertainment facilities for Auckland;
• Develops, with a regional perspective, a range of fit-for-purpose arts, cultural, heritage, leisure, sport, entertainment and events venues that are attractive to the residents and businesses of the region, and to its visitors;
• Plans for and implements regionally identified projects;
• Nurtures region-wide arts, cultural and heritage activities and organisations;
• Secures Auckland-exclusive international musicals, rock concerts, sporting events and art exhibitions to drive out of town visitation and investment in Auckland’s economy.
For information on the above activities, actual performance, key performance targets and other measures set out in the LTP see Economic and cultural development theme in volume 1 of this annual report.
Directors • Sir Don McKinnon
(Chairperson) • Geoff Clews • John Robertson
• Joanna Perry (Deputy Chairperson)
• Andrew Collow • Rukumoana
Schaafhausen
• Lisa Bates • Fabian Partigliani • Gary Troup
Annual Report 2016/2017
Volume 3: Financial statements 95
Section H: Council-controlled organisations
Overview Watercare Services Ltd (Watercare) is responsible for delivering outstanding water services for the people of Auckland, now and in the future. On 1 November 2010, the company absorbed the ownership and management of local networks and the retail functions from the previous local councils. The exception is Veolia Water Services (ANZ) Pty Ltd which manages the local networks and retailing of water and wastewater in the Papakura area under a franchise agreement while Watercare owns the assets. Objectives and contribution to LTP Watercare is to manage water resources and waste water systems to contribute to: • Building resilience to natural hazards; • Realising a compact city; • Optimize, integrate and align water service
provision and planning; • Treasuring our coastline, harbours, islands and
marine areas; • Sustainably managing natural resources; • Supporting rural settlements, living and
communities; • Improving the education, health and safety of
Aucklanders; • Growing a business friendly and well-functioning
city; • Enabling iwi to participate in the co-management
of natural resources; • Tackling climate change and increasing energy
resilience.
Activities Watercare’s activities include: • Collection, treatment and distribution of drinking
water to the people of Auckland; • Collection, treatment and disposal of wastewater for
the people of Auckland; • Transfer, treatment and disposal of trade waste; • Provision of laboratory services in support of
Watercare’s business activities and the business community.
For information on the above activities, actual performance, key performance targets and other measures set out in the LTP see Water supply and wastewater treatment and disposal theme in volume 1 of this annual report.
Directors • Margaret Devlin
(Chairperson) • Brendan Green • David Thomas
• Julia Hoare (Deputy Chairperson)
• Catherine Harland
• Dr Nicki Crauford • Tony Lanigan

Auckland Council Annual Report 2016/2017
96 | Volume 3: Financial statements
INDEPENDENT AUDITOR’S REPORT
TO THE READERS OF AUCKLAND COUNCIL’S ANNUAL REPORT
FOR THE YEAR ENDED 30 JUNE 2017
I am the auditor of Auckland Council and its subsidiaries and controlled entities (together referred to as the Group). I have used my staff and resources, and appointed auditors and their staff to report on the information in the Auckland Council’s annual report that I am required to audit under the Local Government Act 2002 (the Act). I refer to this information as “the audited information” in my report. I am also required to report on: whether the Auckland Council and the Group have complied with the requirements of
Schedule 10 of the Act that apply to the annual report; and
the completeness and accuracy of the Auckland Council and the Group’s disclosures about performance against benchmarks that are required by the Local Government (Financial Reporting and Prudence) Regulations 2014.
I refer to this information as “the disclosure requirements” in my report. Opinion on the audited information In my opinion: the financial statements in Volume 3 on pages 11 to 83 present fairly, in all material
respects, the financial position of the Auckland Council and the Group as at 30 June 2017, and the financial performance and cash flows for the year then ended, in accordance with Public Benefit Entity accounting standards;
the funding impact statement in Volume 1 on page 77, presents fairly, in all material respects, the amount of funds produced from each source of funding and how the funds were applied as compared to the information included in the Auckland Council Group’s annual plan;
the statement of service performance of the Auckland Council Group, in Volume 1 on pages 80 to 186 and in Volume 2 on pages 18 to 42:
presents fairly, in all material respects, the levels of service for each group of activities for the year ended 30 June 2017, including:
the levels of service achieved compared with the intended levels of service and whether any intended changes to levels of service were achieved; and
the reasons for any significant variation between the levels of service achieved and the intended levels of service; and
complies with generally accepted accounting practice in New Zealand;
Te Rīpoata ā-Tau 2016/2017 o Te Kaunihera
o Tāmaki Makaurau
Pokanga 3: Ngā Pūrongo Pūtea | 97
the statement about capital expenditure for each group of activities in Volume 1 on pages 80 to 186, and in Volume 2 on pages 18 to 42 presents fairly, in all material respects, actual capital expenditure as compared to the budgeted capital expenditure included in the Auckland Council Group’s long-term plan;
the funding impact statement for each group of activities in Volume 1 on pages 80 to 186 and in Volume 2 on pages 18 to 42, presents fairly, in all material respects, the amount of funds produced from each source of funding and how the funds were applied as compared to the information included in the Auckland Council Group’s long-term plan; and
the statements of service performance for local activities for each local board in Volume 2 on pages 43 to 245, present fairly, in all material respects:
the activities for each local board for the year ended 30 June 2017, including the level of service achieved for the activities compared with the performance target or targets for those activities as set out in the local board agreement for the year; and
the reasons for any significant variation between the levels of service achieved and the intended levels of service.
Report on the disclosure requirements In my opinion the Auckland Council and the Group have: complied with the requirements of schedule 10 of the Act that apply to the annual report; and
made the disclosures about performance against benchmarks that are required by the Local Government (Financial Reporting and Prudence) Regulations 2014 in Volume 3 on pages 84 to 88, which represent a complete list of required disclosures and accurately reflects the information drawn from the Auckland Council and the Group’s audited information and, where applicable, the Auckland Council Group’s long-term plan and annual plans.
Basis for opinion on the audited information I conducted my audit in accordance with the Auditor-General’s Auditing Standards, which incorporate the Professional and Ethical Standards and the International Standards on Auditing (New Zealand) issued by the New Zealand Auditing and Assurance Standards Board. My responsibilities under those standards are further described in the Responsibilities of the auditor for the audited information section of my report. I am independent of the Auckland Council and the Group in accordance with the Auditor-General’s Auditing Standards, which incorporate Professional and Ethical Standard 1 (Revised) Code of Ethics for Assurance Practitioners issued by the New Zealand Auditing and Assurance Standards Board, and I have fulfilled my other ethical responsibilities in accordance with these requirements. I believe that the audit evidence I have obtained is sufficient and appropriate to provide a basis for my opinion. In addition to my audit and my report on the disclosure requirements, my staff and appointed auditors and their staff have carried out a range of other assurance and consultancy engagements, which are compatible with those independence requirements. Other than these engagements, and in exercising functions and powers under the Public Audit Act 2001, I have no relationship with or interests in Auckland Council or any of its subsidiaries and controlled entities.
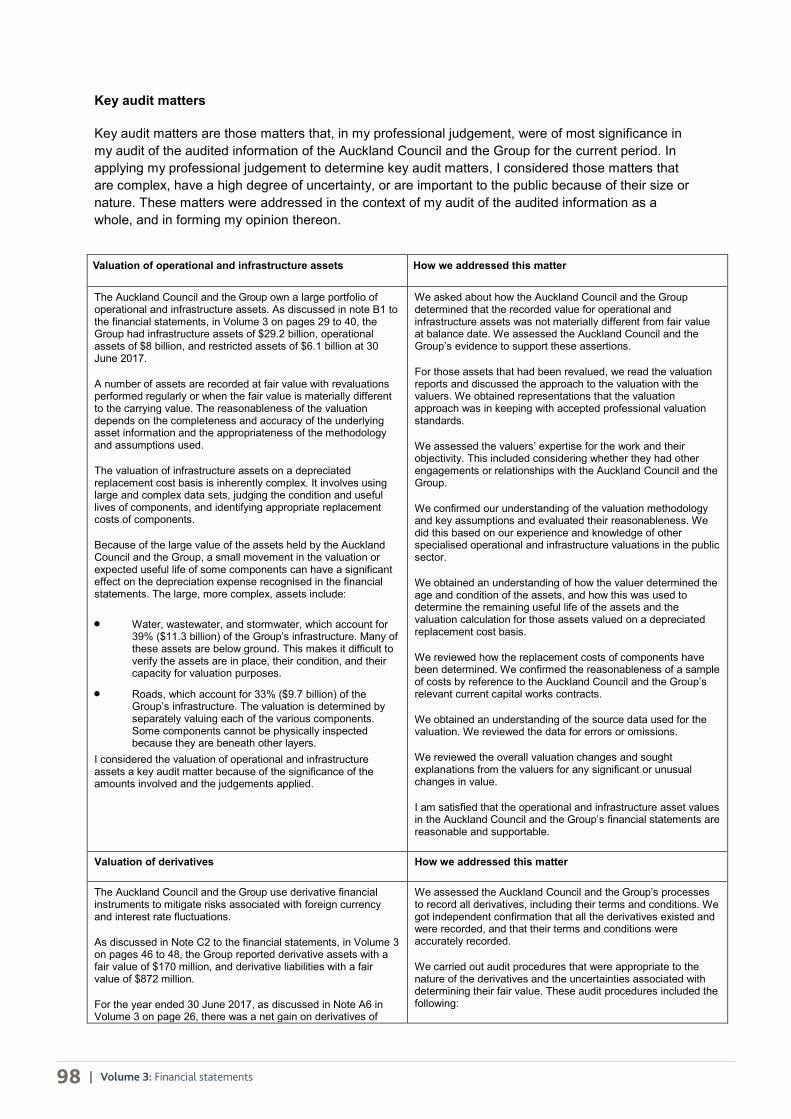
Auckland Council Annual Report 2016/2017
98 | Volume 3: Financial statements
Key audit matters
Key audit matters are those matters that, in my professional judgement, were of most significance in my audit of the audited information of the Auckland Council and the Group for the current period. In applying my professional judgement to determine key audit matters, I considered those matters that are complex, have a high degree of uncertainty, or are important to the public because of their size or nature. These matters were addressed in the context of my audit of the audited information as a whole, and in forming my opinion thereon.
Valuation of operational and infrastructure assets How we addressed this matter
The Auckland Council and the Group own a large portfolio of operational and infrastructure assets. As discussed in note B1 to the financial statements, in Volume 3 on pages 29 to 40, the Group had infrastructure assets of $29.2 billion, operational assets of $8 billion, and restricted assets of $6.1 billion at 30 June 2017.
A number of assets are recorded at fair value with revaluations performed regularly or when the fair value is materially different to the carrying value. The reasonableness of the valuation depends on the completeness and accuracy of the underlying asset information and the appropriateness of the methodology and assumptions used.
The valuation of infrastructure assets on a depreciated replacement cost basis is inherently complex. It involves using large and complex data sets, judging the condition and useful lives of components, and identifying appropriate replacement costs of components.
Because of the large value of the assets held by the Auckland Council and the Group, a small movement in the valuation or expected useful life of some components can have a significant effect on the depreciation expense recognised in the financial statements. The large, more complex, assets include:
Water, wastewater, and stormwater, which account for 39% ($11.3 billion) of the Group’s infrastructure. Many of these assets are below ground. This makes it difficult to verify the assets are in place, their condition, and their capacity for valuation purposes.
Roads, which account for 33% ($9.7 billion) of the Group’s infrastructure. The valuation is determined by separately valuing each of the various components. Some components cannot be physically inspected because they are beneath other layers.
I considered the valuation of operational and infrastructure assets a key audit matter because of the significance of the amounts involved and the judgements applied.
We asked about how the Auckland Council and the Group determined that the recorded value for operational and infrastructure assets was not materially different from fair value at balance date. We assessed the Auckland Council and the Group’s evidence to support these assertions.
For those assets that had been revalued, we read the valuation reports and discussed the approach to the valuation with the valuers. We obtained representations that the valuation approach was in keeping with accepted professional valuation standards.
We assessed the valuers’ expertise for the work and their objectivity. This included considering whether they had other engagements or relationships with the Auckland Council and the Group.
We confirmed our understanding of the valuation methodology and key assumptions and evaluated their reasonableness. We did this based on our experience and knowledge of other specialised operational and infrastructure valuations in the public sector.
We obtained an understanding of how the valuer determined the age and condition of the assets, and how this was used to determine the remaining useful life of the assets and the valuation calculation for those assets valued on a depreciated replacement cost basis.
We reviewed how the replacement costs of components have been determined. We confirmed the reasonableness of a sample of costs by reference to the Auckland Council and the Group’s relevant current capital works contracts.
We obtained an understanding of the source data used for the valuation. We reviewed the data for errors or omissions.
We reviewed the overall valuation changes and sought explanations from the valuers for any significant or unusual changes in value.
I am satisfied that the operational and infrastructure asset values in the Auckland Council and the Group’s financial statements are reasonable and supportable.
Valuation of derivatives How we addressed this matter
The Auckland Council and the Group use derivative financial instruments to mitigate risks associated with foreign currency and interest rate fluctuations.
As discussed in Note C2 to the financial statements, in Volume 3 on pages 46 to 48, the Group reported derivative assets with a fair value of $170 million, and derivative liabilities with a fair value of $872 million.
For the year ended 30 June 2017, as discussed in Note A6 in Volume 3 on page 26, there was a net gain on derivatives of
We assessed the Auckland Council and the Group’s processes to record all derivatives, including their terms and conditions. We got independent confirmation that all the derivatives existed and were recorded, and that their terms and conditions were accurately recorded.
We carried out audit procedures that were appropriate to the nature of the derivatives and the uncertainties associated with determining their fair value. These audit procedures included the following:
Valuation of operational and infrastructure assets How we addressed this matter
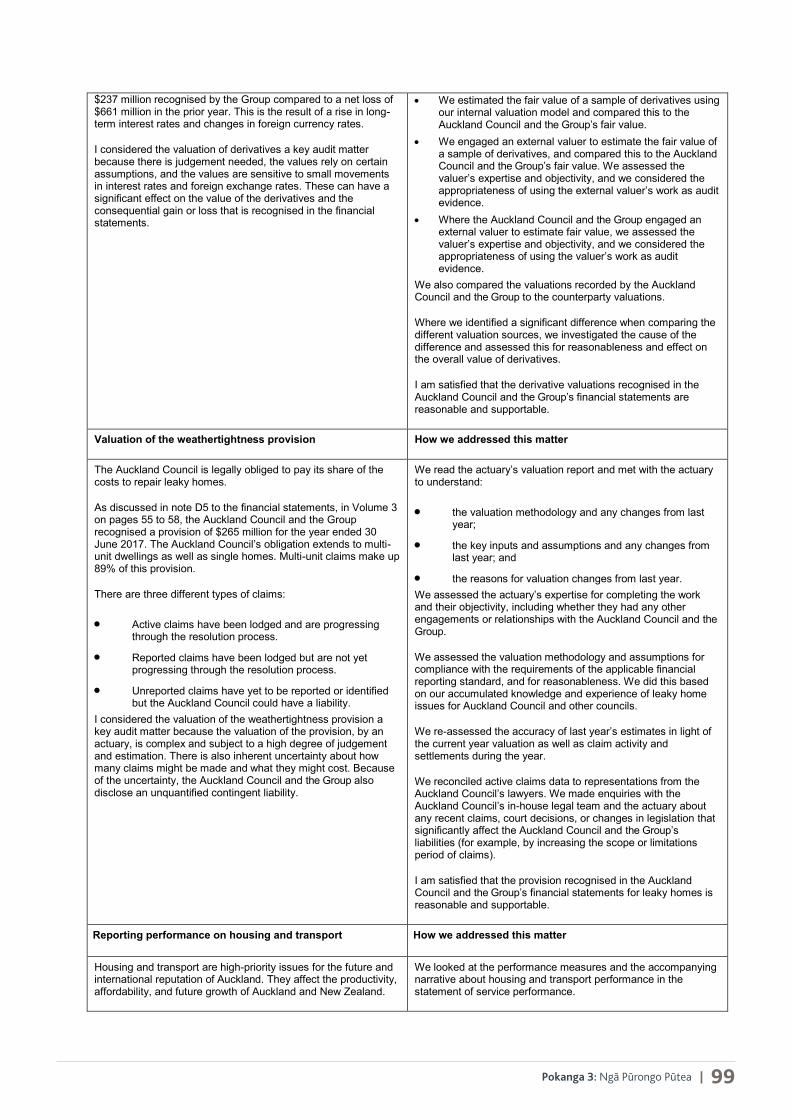
Te Rīpoata ā-Tau 2016/2017 o Te Kaunihera
o Tāmaki Makaurau
Pokanga 3: Ngā Pūrongo Pūtea | 99
$237 million recognised by the Group compared to a net loss of $661 million in the prior year. This is the result of a rise in long-term interest rates and changes in foreign currency rates.
I considered the valuation of derivatives a key audit matter because there is judgement needed, the values rely on certain assumptions, and the values are sensitive to small movements in interest rates and foreign exchange rates. These can have a significant effect on the value of the derivatives and the consequential gain or loss that is recognised in the financial statements.
We estimated the fair value of a sample of derivatives using our internal valuation model and compared this to the Auckland Council and the Group’s fair value.
We engaged an external valuer to estimate the fair value of a sample of derivatives, and compared this to the Auckland Council and the Group’s fair value. We assessed the valuer’s expertise and objectivity, and we considered the appropriateness of using the external valuer’s work as audit evidence.
Where the Auckland Council and the Group engaged an external valuer to estimate fair value, we assessed the valuer’s expertise and objectivity, and we considered the appropriateness of using the valuer’s work as audit evidence.
We also compared the valuations recorded by the Auckland Council and the Group to the counterparty valuations.
Where we identified a significant difference when comparing the different valuation sources, we investigated the cause of the difference and assessed this for reasonableness and effect on the overall value of derivatives.
I am satisfied that the derivative valuations recognised in the Auckland Council and the Group’s financial statements are reasonable and supportable.
Valuation of the weathertightness provision How we addressed this matter
The Auckland Council is legally obliged to pay its share of the costs to repair leaky homes.
As discussed in note D5 to the financial statements, in Volume 3 on pages 55 to 58, the Auckland Council and the Group recognised a provision of $265 million for the year ended 30 June 2017. The Auckland Council’s obligation extends to multi-unit dwellings as well as single homes. Multi-unit claims make up 89% of this provision.
There are three different types of claims:
Active claims have been lodged and are progressing through the resolution process.
Reported claims have been lodged but are not yet progressing through the resolution process.
Unreported claims have yet to be reported or identified but the Auckland Council could have a liability.
I considered the valuation of the weathertightness provision a key audit matter because the valuation of the provision, by an actuary, is complex and subject to a high degree of judgement and estimation. There is also inherent uncertainty about how many claims might be made and what they might cost. Because of the uncertainty, the Auckland Council and the Group also disclose an unquantified contingent liability.
We read the actuary’s valuation report and met with the actuary to understand:
the valuation methodology and any changes from last year;
the key inputs and assumptions and any changes from last year; and
the reasons for valuation changes from last year. We assessed the actuary’s expertise for completing the work and their objectivity, including whether they had any other engagements or relationships with the Auckland Council and the Group.
We assessed the valuation methodology and assumptions for compliance with the requirements of the applicable financial reporting standard, and for reasonableness. We did this based on our accumulated knowledge and experience of leaky home issues for Auckland Council and other councils.
We re-assessed the accuracy of last year’s estimates in light of the current year valuation as well as claim activity and settlements during the year.
We reconciled active claims data to representations from the Auckland Council’s lawyers. We made enquiries with the Auckland Council’s in-house legal team and the actuary about any recent claims, court decisions, or changes in legislation that significantly affect the Auckland Council and the Group’s liabilities (for example, by increasing the scope or limitations period of claims).
I am satisfied that the provision recognised in the Auckland Council and the Group’s financial statements for leaky homes is reasonable and supportable.
Reporting performance on housing and transport How we addressed this matter
Housing and transport are high-priority issues for the future and international reputation of Auckland. They affect the productivity, affordability, and future growth of Auckland and New Zealand.
We looked at the performance measures and the accompanying narrative about housing and transport performance in the statement of service performance.
Reporting performance on housing and transport How we addressed this matter

Auckland Council Annual Report 2016/2017
100 | Volume 3: Financial statements
The Auckland Council Group reports performance information on housing and transport in the statement of service performance in Volume 1 on pages 80 to 186.
The Auckland Council has been working with the Government to establish special housing areas to help address the city’s housing shortage and increase the availability of affordable homes. The Auckland Council contributes to the resolution of the housing issues through:
establishing the rules for development under the Unitary Plan;
issuing building consents and code of compliance certificates; and
working with developers to agree on the timely release of land for developments.
The Auckland Council Group has a key role in providing efficient and cost-effective transport around and through Auckland. Solutions to the current transport issues continue to evolve and include large projects requiring significant local and national funding over an extended period.
The complexity of the housing and transport issues requires innovative solutions and sustainable funding, including collaboration between key local stakeholders, council-controlled organisations, and the Government.
I considered this a key audit matter because of the significance of these issues to Aucklanders, and the importance of a balanced assessment of the Auckland Council Group’s performance on these issues.
We identified the aspects of performance that we consider to be material to readers of the Auckland Council’s annual report and focused our work on these aspects. This included material performance measures relevant to housing and transport. Our work included:
testing the effectiveness of relevant internal controls;
sample testing performance measures to supporting records; and
obtaining third-party confirmation of performance. Where information on the Auckland Council Group’s housing and transport activities was included in the annual report but outside the statement of service performance, we reviewed the information for consistency with the audited financial statements and statement of service performance, and our knowledge obtained in the audit of the Auckland Council and the Group. This knowledge included information from:
our review of relevant Auckland Council and Group reports, meeting minutes, and supporting evidence;
discussions with governing bodies and management of the Auckland Council and the Group; and
discussions with other public sector agencies involved in Auckland matters.
I am satisfied that the information presented in the statement of service performance about housing and transport is reasonable, and reflects both the role and performance of the Auckland Council Group in addressing the housing and transport issues identified.
Other information The Council is responsible for the other information included in the annual report. The other information comprises the information included in Volume 1 on pages 4 to 76, pages 78 to 79 and pages 187 to 196, Volume 2 pages 4 to 17 and Volume 3 pages 3 to 9 and 103 to 113, but does not include the audited information and the disclosure requirements. My opinion on the audited information and my report on the disclosure requirements do not cover the other information. My responsibility is to read the other information. In doing so, I consider whether the other information is materially inconsistent with the audited information and the disclosure requirements or the knowledge obtained during my work, or otherwise appears to be materially misstated. If, based on the work I conclude that there is a material misstatement of this other information, I am required to report that fact. I have nothing to report in this regard. Responsibilities of the Council The Council is responsible for meeting all legal requirements that apply to its annual report. The Council’s responsibilities include the preparation and fair presentation of the financial statements of the Auckland Council and the Group in accordance with Public Benefit Entity accounting standards. The Council is responsible for such internal control as it determines is necessary to enable it to prepare the information I audit that is free from material misstatements, whether due to fraud or error. In preparing the information I audit, the Council is responsible for assessing its ability to continue as a going concern. The Council is also responsible for disclosing, as applicable, matters related to going

Te Rīpoata ā-Tau 2016/2017 o Te Kaunihera
o Tāmaki Makaurau
Pokanga 3: Ngā Pūrongo Pūtea | 101
concern and using the going concern basis of accounting, unless there is an intention to amalgamate or cease the Auckland Council and the Group or there is no realistic alternative but to do so. The Council’s responsibilities arise under the Local Government Act 2002, the Local Government (Financial Reporting and Prudence) Regulations 2014 and the Financial Markets Conduct Act 2013. Responsibilities of the auditor for the audited information My objectives are to obtain reasonable assurance about whether the audited information, as a whole, is free from material misstatement, whether due to fraud or error, and to issue an audit report that includes my opinion. Reasonable assurance is a high level of assurance, but is not a guarantee that an audit conducted in accordance with the Auditor-General’s Auditing Standards will always detect a material misstatement when it exists. Misstatements are differences or omissions of amounts or disclosures, and can arise from fraud or error. Misstatements are considered material if, individually or in the aggregate, they could reasonably be expected to influence the decisions readers take on the basis of the audited information. For the budget information reported in the audited information, my procedures were limited to checking that the budget information agreed to the Auckland Council Group’s long-term plan. As part of an audit in accordance with the Auditor-General’s Auditing Standards, I exercise professional judgement and maintain professional scepticism throughout the audit. Also: I identify and assess the risks of material misstatement of the audited information, whether
due to fraud or error, design and perform audit procedures responsive to those risks, and obtain audit evidence that is sufficient and appropriate to provide a basis for my opinion. The risk of not detecting a material misstatement resulting from fraud is higher than for one resulting from error, as fraud may involve collusion, forgery, intentional omissions, misrepresentations, or the override of internal control.
I obtain an understanding of internal control relevant to the audit in order to design audit procedures that are appropriate in the circumstances, but not for the purpose of expressing an opinion on the effectiveness of the Auckland Council and the Group’s internal control.
I evaluate the appropriateness of accounting policies used and the reasonableness of accounting estimates and related disclosures made by the Auckland Council and the Group.
I determine the appropriateness of the reported intended levels of service in the statement of service performance of the Auckland Council Group and the statements of service performance for local activities for each local board, as a reasonable basis for assessing the levels of service achieved and reported.
I conclude on the appropriateness of the use of the going concern basis of accounting by the Auckland Council and the Group and, based on the audit evidence obtained, whether a material uncertainty exists related to events or conditions that may cast significant doubt on the Auckland Council and the Group’s ability to continue as a going concern. If I conclude that a material uncertainty exists, I am required to draw attention in my audit report to the related disclosures in the audited information or, if such disclosures are inadequate, to modify my opinion. My conclusions are based on the audit evidence obtained up to the date of my audit report. However, future events or conditions may cause the Auckland Council and the Group to cease to continue as a going concern.

Auckland Council Annual Report 2016/2017
102 | Volume 3: Financial statements
I evaluate the overall presentation, structure and content of the audited information, including the disclosures, and whether the audited information represents, where applicable, the underlying transactions and events in a manner that achieves fair presentation.
I obtain sufficient appropriate audit evidence regarding the entities or business activities within the Auckland Council and the Group to express an opinion on the consolidated audited information. I am responsible for the direction, supervision and performance of the Auckland Council and the Group audit. I remain solely responsible for my audit opinion.
I communicate with the Council regarding, among other matters, the planned scope and timing of the audit and significant audit findings, including any significant deficiencies in internal control that I identify during my audit.
I also provide the Council with a statement that I have complied with relevant ethical requirements regarding independence, and communicate with them all relationships and other matters that may reasonably be thought to bear on my independence, and where applicable, related safeguards.
From the matters communicated with the Council, I determine those matters that were of most significance in my audit and are therefore the key audit matters. I describe these matters in myauditor’s report unless law or regulation precludes public disclosure about the matter or when, in extremely rare circumstances, I determine that a matter should not be communicated in my report because the adverse consequences of doing so would reasonably be expected to outweigh the public interest benefits of such communication.
My responsibilities arise from the Public Audit Act 2001 and the Financial Markets Conduct Act 2013.
Greg Schollum Deputy Auditor-General Wellington, New Zealand 28 September 2017

Te Rīpoata ā-Tau 2016/2017 o Te Kaunihera
o Tāmaki Makaurau
Pokanga 3: Ngā Pūrongo Pūtea | 103
Annual Report 2016/2017
Volume 3: Financial statements 103
NZX and other exchange listing requirements This section provides information on waivers granted by NZX and other exchange listings Summary of waivers granted by NZX
For the purposes of NZX Listing Rule 10.4.5(f), Auckland Council (Council) discloses that, in the 12-month period preceding 30 June 2017, NZX has granted and published and Council has relied on the following waivers from Listing Rule 5.2.3: a waiver dated 15 March 2016 in respect of
its issue of $250 million of fixed rate bonds (AKC090 Bonds). A further waiver in respect of the AKC090 Bonds was granted by NZX on 29 September 2016.
a waiver dated 20 July 2016 in respect of its issue of $180 million of fixed rate bonds (AKC100 Bonds).
Listing Rule 5.2.3 Listing Rule 5.2.3, as modified by a ruling by NZX dated 29 September 2015, requires a class of debt securities to be held by at least 100 members of the public holding at least 25% of the number of securities of that class issued, with each member of the public holding at least a Minimum Holding (as defined in the NZX Main Board / Debt Market Listing Rules). In March 2016, NZX granted Council a waiver from Listing Rule 5.2.3 with respect to the AKC090 Bonds to allow Council to have fewer than 100 bondholders who are members of the public holding at least 25% of the AKC090 Bonds on issue for a period of six months from the quotation date of its initial offer of new bonds. In September 2016, NZX granted a further waiver from Listing Rule 5.2.3 with respect to the AKC090 Bonds for a period of twelve months from 30 September 2016. NZX granted the further waiver in respect of the AKC090 Bonds from Listing Rule 5.2.3 on the following conditions: Council must clearly and prominently
disclose the waiver, its conditions and its implications in its half-year report and its annual report, for the period that the waiver is relied upon;
Council must notify NZX as soon as practicable if there is a material reduction to the total number of members of the public holding at least a Minimum Holding of the AKC090 Bonds and/or the percentage of the AKC090 Bonds held by members of the public holding at least a Minimum Holding;
for the period of the waiver, the AKC090s must be held by at least 80 members of the public holding at least 15% of the AKC090
Bonds on issue, with each member of the public holding at least a Minimum Holding; and
Council must provide NZX with a written update of the total number of members of the public holding at least a Minimum Holding of the AKC090 Bonds and the percentage of the AKC090 Bonds held by members of the public holding at least a Minimum Holding following AKC’s financial year end. The update is to be provided to NZX within ten business days of the end of the financial year.
In July 2016, NZX granted Council a waiver from Listing Rule 5.2.3 with respect to the AKC100 Bonds to allow Council to have fewer than 100 bondholders who are members of the public holding at least 25% of the AKC100 Bonds on issue for a period of six months from the quotation date of its initial offer of new bonds. NZX granted Council the waiver in respect of the AKC100 Bonds from Listing Rule 5.2.3 on the following conditions: Council was required to clearly and
prominently disclose the waiver and its implications in the Series Notice for the AKC100 Bonds and any other offering document relating to an offer of the AKC100 Bonds made during the period of the waiver;
Council must clearly and prominently disclose the waiver, its conditions and its implications in its half-year report, and its annual report, for the period the waiver is relied on;
Council was required to disclose liquidity as a risk in the Series Notice for the AKC100 Bonds; and
Council must notify NZX as soon as practicable if there is a material reduction to the total number of members of the public holding at least a Minimum Holding of the AKC100 Bonds and/or the percentage of the AKC100 Bonds held by members of the public holding at least a Minimum Holding.
The effect of these waivers from Listing Rule 5.2.3 is that the AKC090 Bonds and the AKC100 Bonds may not be widely held and there may reduced liquidity in those bonds.
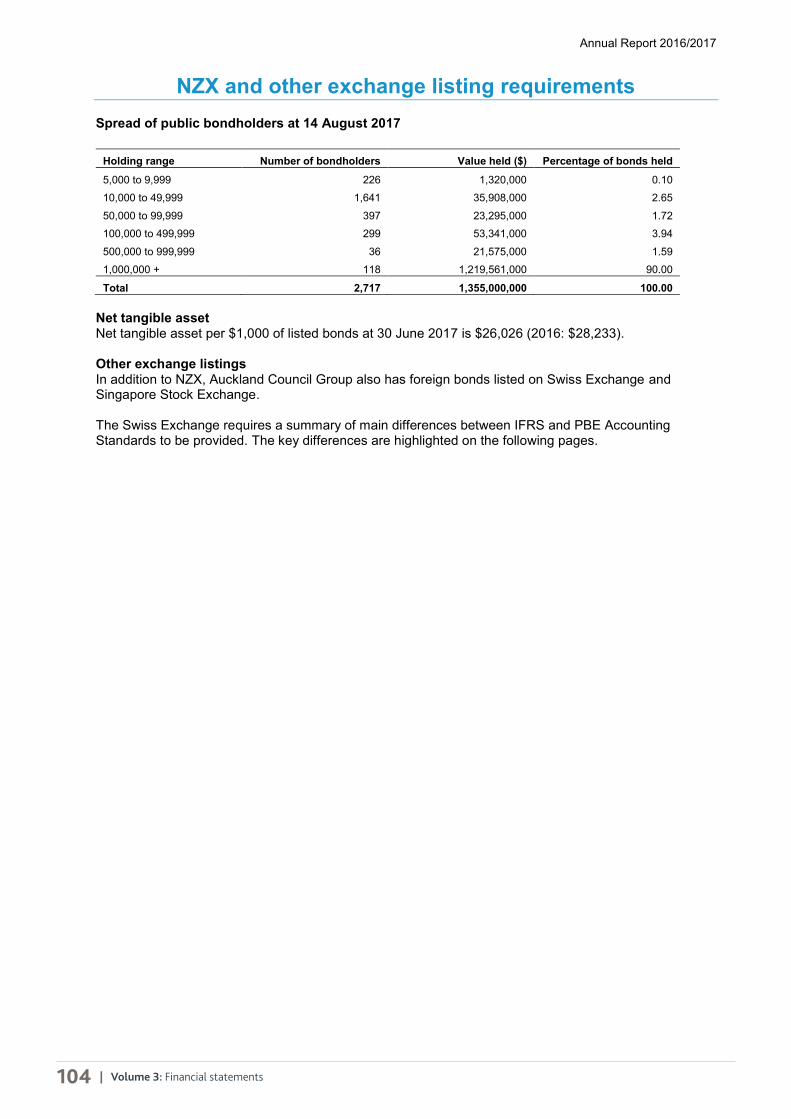
Auckland Council Annual Report 2016/2017
104 | Volume 3: Financial statements
Annual Report 2016/2017
104
NZX and other exchange listing requirements Spread of public bondholders at 14 August 2017
Holding range Number of bondholders Value held ($) Percentage of bonds held
5,000 to 9,999 226 1,320,000 0.10
10,000 to 49,999 1,641 35,908,000 2.65
50,000 to 99,999 397 23,295,000 1.72
100,000 to 499,999 299 53,341,000 3.94
500,000 to 999,999 36 21,575,000 1.59
1,000,000 + 118 1,219,561,000 90.00
Total 2,717 1,355,000,000 100.00 Net tangible asset Net tangible asset per $1,000 of listed bonds at 30 June 2017 is $26,026 (2016: $28,233). Other exchange listings In addition to NZX, Auckland Council Group also has foreign bonds listed on Swiss Exchange and Singapore Stock Exchange. The Swiss Exchange requires a summary of main differences between IFRS and PBE Accounting Standards to be provided. The key differences are highlighted on the following pages.

Te Rīpoata ā-Tau 2016/2017 o Te Kaunihera
o Tāmaki Makaurau
Pokanga 3: Ngā Pūrongo Pūtea | 105
Ann
ual R
epor
t 201
6/20
17
Vol
ume
3: F
inan
cial
sta
tem
ents
1
05
Mai
n di
ffere
nces
bet
wee
n IF
RS
and
PBE
Acc
ount
ing
Stan
dard
s In
trod
uctio
n U
nder
the
New
Zea
land
Acc
ount
ing
Stan
dard
s Fr
amew
ork,
pub
lic s
ecto
r pub
lic b
enef
it en
titie
s (P
BEs
) app
ly P
BE
Acco
untin
g St
anda
rds.
The
New
Zea
land
Acc
ount
ing
Stan
dard
s Fr
amew
ork
defin
es p
ublic
ben
efit
entit
ies
(PB
Es) a
s re
porti
ng e
ntiti
es “w
hose
prim
ary
obje
ctiv
e is
to p
rovi
de g
oods
or s
ervi
ces
for c
omm
unity
or s
ocia
l ben
efit
and
whe
re a
ny e
quity
has
bee
n pr
ovid
ed w
ith a
vie
w to
sup
porti
ng th
at p
rimar
y ob
ject
ive
rath
er th
an fo
r a fi
nanc
ial r
etur
n to
equ
ity h
olde
rs”.
Man
y pu
blic
sec
tor e
ntiti
es a
re c
lass
ified
as
PB
Es. A
uckl
and
Cou
ncil
Gro
up (t
he G
roup
) is
clas
sifie
d as
a p
ublic
sec
tor P
BE
for f
inan
cial
repo
rting
pur
pose
s an
d th
eref
ore
the
finan
cial
sta
tem
ents
of t
he G
roup
hav
e be
en
prep
ared
in a
ccor
danc
e w
ith P
BE A
ccou
ntin
g St
anda
rds.
Th
e G
roup
has
tran
sitio
ned
to th
e P
BE
Acco
untin
g S
tand
ards
for p
erio
ds b
egin
ning
on
or a
fter 1
Jul
y 20
14 w
ith c
ompa
rativ
e in
form
atio
n re
stat
ed a
s if
the
Gro
up h
ad a
lway
s ap
plie
d PB
E Ac
coun
ting
Stan
dard
s. P
rior t
o th
e tra
nsiti
on, t
he fi
nanc
ial s
tate
men
ts o
f the
Gro
up w
ere
prep
ared
in a
ccor
danc
e w
ith N
ew Z
eala
nd E
quiv
alen
ts to
Inte
rnat
iona
l Fi
nanc
ial R
epor
ting
Stan
dard
s (IF
RS)
as
appl
icab
le to
PB
Es (N
Z IF
RS
PBE
). N
Z IF
RS
PBE
wer
e ba
sed
on IR
FS w
ith m
odifi
catio
ns a
nd e
xem
ptio
ns fr
om c
erta
in re
quire
men
ts o
f IF
RS.
Th
e PB
E Ac
coun
ting
Stan
dard
s ar
e pr
imar
ily b
ased
on
Inte
rnat
iona
l Pub
lic S
ecto
r Acc
ount
ing
Stan
dard
s (IP
SAS
). IP
SAS
are
base
d on
IFR
S bu
t ada
pted
to a
pub
lic s
ecto
r co
ntex
t whe
re a
ppro
pria
te b
y us
ing
mor
e ap
prop
riate
term
inol
ogy
and
addi
tiona
l exp
lana
tion
whe
re re
quire
d. F
or e
xam
ple,
IPSA
S in
trodu
ces
the
conc
ept o
f ser
vice
pot
entia
l in
addi
tion
to e
cono
mic
ben
efits
in th
e as
set r
ecog
nitio
n ru
les,
and
pro
vide
s m
ore
publ
ic s
ecto
r spe
cific
gui
danc
e w
here
app
ropr
iate
. Thi
s is
in c
ontra
st w
ith IF
RS
that
are
writ
ten
for
the
for-
prof
it se
ctor
with
cap
ital m
arke
ts in
min
d.
Set o
ut b
elow
are
the
key
diffe
renc
es in
reco
gniti
on a
nd m
easu
rem
ent b
etw
een
PBE
Acc
ount
ing
Sta
ndar
ds a
pplic
able
to th
e G
roup
and
IFR
S (a
pplic
able
to a
nnua
l per
iods
be
ginn
ing
on o
r afte
r 1 J
uly
2016
). D
iffer
ence
s th
at im
pact
onl
y on
pre
sent
atio
n an
d di
sclo
sure
hav
e no
t bee
n id
entif
ied.
PB
E A
ccou
ntin
g St
anda
rds
with
com
para
ble
IFR
S eq
uiva
lent
PBE
IF
RS
Impa
ct
Form
atio
n of
Auc
klan
d C
ounc
il G
roup
P
BE
IFR
S 3
Bus
ines
s C
ombi
natio
ns c
onta
ins
a sc
ope
exem
ptio
n fo
r bus
ines
s co
mbi
natio
ns a
risin
g fro
m lo
cal
auth
ority
reor
gani
satio
ns. T
his
scop
e ex
empt
ion
is c
arrie
d fo
rwar
d fro
m N
Z IF
RS
3 (P
BE
) Bus
ines
s C
ombi
natio
ns, t
he
stan
dard
that
was
app
licab
le to
the
Gro
up a
t the
tim
e it
was
fo
rmed
on
1 N
ovem
ber 2
010
as a
resu
lt of
the
amal
gam
atio
n of
eig
ht p
rede
cess
or A
uckl
and
loca
l aut
horit
ies.
Und
er th
e ex
empt
ion,
all
asse
ts a
nd li
abilit
ies
of th
e pr
edec
esso
r loc
al
auth
oriti
es w
ere
reco
gnis
ed b
y th
e G
roup
usi
ng th
e pr
edec
esso
r val
ues
of th
ose
asse
ts a
nd li
abilit
ies.
The
initi
al
valu
e at
whi
ch th
ose
asse
ts a
nd li
abilit
ies
wer
e re
cogn
ised
by
the
Gro
up is
dee
med
to b
e th
eir c
ost f
or a
ccou
ntin
g pu
rpos
es.
With
out t
he s
cope
exe
mpt
ion,
the
diss
olut
ion
of th
e pr
edec
esso
r loc
al a
utho
ritie
s in
to th
e G
roup
wou
ld h
ave
been
acc
ount
ed fo
r as
a bu
sine
ss c
ombi
natio
n un
der I
FRS
3 a
pply
ing
the
acqu
isiti
on m
etho
d. U
nder
the
acqu
isiti
on
met
hod,
an
acqu
irer w
ould
hav
e be
en
iden
tifie
d an
d al
l of t
he id
entif
iabl
e as
sets
and
lia
bilit
ies
of th
e ac
quire
d pr
edec
esso
r loc
al
auth
oriti
es a
ssum
ed b
y th
e ac
quire
r wou
ld
have
bee
n re
cogn
ised
at f
air v
alue
as
at th
e da
te o
f acq
uisi
tion.
The
impa
ct o
f the
abo
ve a
ccou
ntin
g tre
atm
ent o
f th
e 20
10 lo
cal a
utho
rity
reor
gani
satio
n is
that
the
carr
ying
val
ue o
f the
ass
ets
and
liabi
litie
s re
ceiv
ed
as p
art o
f the
reor
gani
satio
n w
ere
not r
e-m
easu
red
to fa
ir va
lue
and
no a
dditi
onal
ass
ets
and
liabi
litie
s su
ch a
s go
odw
ill a
nd c
ontin
gent
lia
bilit
ies
wer
e re
cogn
ised
as
wou
ld h
ave
been
re
quire
d if
the
trans
actio
n is
acc
ount
ed fo
r as
a bu
sine
ss c
ombi
natio
n un
der I
FRS
3.
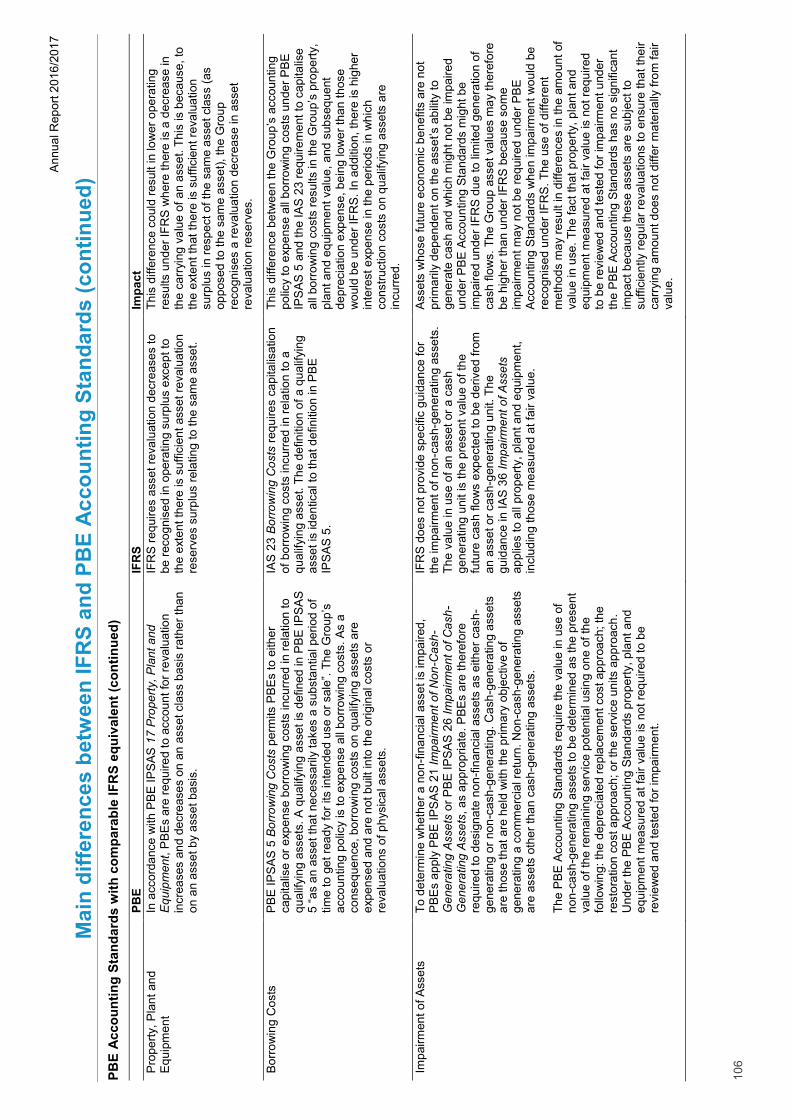
Auckland Council Annual Report 2016/2017
106 | Volume 3: Financial statements
Ann
ual R
epor
t 201
6/20
17
106
Mai
n di
ffere
nces
bet
wee
n IF
RS
and
PBE
Acc
ount
ing
Stan
dard
s (c
ontin
ued)
PB
E A
ccou
ntin
g St
anda
rds
with
com
para
ble
IFR
S eq
uiva
lent
(con
tinue
d)
PB
E
IFR
S Im
pact
P
rope
rty, P
lant
and
E
quip
men
t In
acc
orda
nce
with
PB
E IP
SAS
17
Pro
perty
, Pla
nt a
nd
Equ
ipm
ent,
PB
Es
are
requ
ired
to a
ccou
nt fo
r rev
alua
tion
incr
ease
s an
d de
crea
ses
on a
n as
set c
lass
bas
is ra
ther
than
on
an
asse
t by
asse
t bas
is.
IFR
S re
quire
s as
set r
eval
uatio
n de
crea
ses
to
be re
cogn
ised
in o
pera
ting
surp
lus
exce
pt to
th
e ex
tent
ther
e is
suf
ficie
nt a
sset
reva
luat
ion
rese
rves
sur
plus
rela
ting
to th
e sa
me
asse
t.
This
diff
eren
ce c
ould
resu
lt in
low
er o
pera
ting
resu
lts u
nder
IFR
S w
here
ther
e is
a d
ecre
ase
in
the
carr
ying
val
ue o
f an
asse
t. Th
is is
bec
ause
, to
the
exte
nt th
at th
ere
is s
uffic
ient
reva
luat
ion
surp
lus
in re
spec
t of t
he s
ame
asse
t cla
ss (a
s op
pose
d to
the
sam
e as
set),
the
Gro
up
reco
gnis
es a
reva
luat
ion
decr
ease
in a
sset
re
valu
atio
n re
serv
es.
Bor
row
ing
Cos
ts
PB
E IP
SA
S 5
Bor
row
ing
Cos
ts p
erm
its P
BE
s to
eith
er
capi
talis
e or
exp
ense
bor
row
ing
cost
s in
curr
ed in
rela
tion
to
qual
ifyin
g as
sets
. A q
ualif
ying
ass
et is
def
ined
in P
BE
IPS
AS
5 “a
s an
ass
et th
at n
eces
saril
y ta
kes
a su
bsta
ntia
l per
iod
of
time
to g
et re
ady
for i
ts in
tend
ed u
se o
r sal
e”. T
he G
roup
’s
acco
untin
g po
licy
is to
exp
ense
all
borr
owin
g co
sts.
As
a co
nseq
uenc
e, b
orro
win
g co
sts
on q
ualif
ying
ass
ets
are
expe
nsed
and
are
not
bui
lt in
to th
e or
igin
al c
osts
or
reva
luat
ions
of p
hysi
cal a
sset
s.
IAS
23
Bor
row
ing
Cos
ts re
quire
s ca
pita
lisat
ion
of b
orro
win
g co
sts
incu
rred
in re
latio
n to
a
qual
ifyin
g as
set.
The
defin
ition
of a
qua
lifyi
ng
asse
t is
iden
tical
to th
at d
efin
ition
in P
BE
IP
SA
S 5
.
This
diff
eren
ce b
etw
een
the
Gro
up’s
acc
ount
ing
polic
y to
exp
ense
all
borro
win
g co
sts
unde
r PB
E
IPS
AS
5 a
nd th
e IA
S 2
3 re
quire
men
t to
capi
talis
e al
l bor
row
ing
cost
s re
sults
in th
e G
roup
’s p
rope
rty,
plan
t and
equ
ipm
ent v
alue
, and
sub
sequ
ent
depr
ecia
tion
expe
nse,
bei
ng lo
wer
than
thos
e w
ould
be
unde
r IFR
S. I
n ad
ditio
n, th
ere
is h
ighe
r in
tere
st e
xpen
se in
the
perio
ds in
whi
ch
cons
truct
ion
cost
s on
qua
lifyi
ng a
sset
s ar
e in
curre
d.
Im
pairm
ent o
f Ass
ets
To d
eter
min
e w
heth
er a
non
-fina
ncia
l ass
et is
impa
ired,
P
BE
s ap
ply
PB
E IP
SA
S 2
1 Im
pairm
ent o
f Non
-Cas
h-G
ener
atin
g As
sets
or P
BE
IPSA
S 2
6 Im
pairm
ent o
f Cas
h-G
ener
atin
g As
sets
, as
appr
opria
te. P
BEs
are
ther
efor
e re
quire
d to
des
igna
te n
on-fi
nanc
ial a
sset
s as
eith
er c
ash-
gene
ratin
g or
non
-cas
h-ge
nera
ting.
Cas
h-ge
nera
ting
asse
ts
are
thos
e th
at a
re h
eld
with
the
prim
ary
obje
ctiv
e of
ge
nera
ting
a co
mm
erci
al re
turn
. Non
-cas
h-ge
nera
ting
asse
ts
are
asse
ts o
ther
than
cas
h-ge
nera
ting
asse
ts.
The
PB
E A
ccou
ntin
g S
tand
ards
requ
ire th
e va
lue
in u
se o
f no
n-ca
sh-g
ener
atin
g as
sets
to b
e de
term
ined
as
the
pres
ent
valu
e of
the
rem
aini
ng s
ervi
ce p
oten
tial u
sing
one
of t
he
follo
win
g: th
e de
prec
iate
d re
plac
emen
t cos
t app
roac
h; th
e re
stor
atio
n co
st a
ppro
ach;
or t
he s
ervi
ce u
nits
app
roac
h.
Und
er th
e P
BE
Acc
ount
ing
Sta
ndar
ds p
rope
rty, p
lant
and
eq
uipm
ent m
easu
red
at fa
ir va
lue
is n
ot re
quire
d to
be
revi
ewed
and
test
ed fo
r im
pairm
ent.
IFR
S d
oes
not p
rovi
de s
peci
fic g
uida
nce
for
the
impa
irmen
t of n
on-c
ash-
gene
ratin
g as
sets
. Th
e va
lue
in u
se o
f an
asse
t or a
cas
h ge
nera
ting
unit
is th
e pr
esen
t val
ue o
f the
fu
ture
cas
h flo
ws
expe
cted
to b
e de
rived
from
an
ass
et o
r cas
h-ge
nera
ting
unit.
The
gu
idan
ce in
IAS
36
Impa
irmen
t of A
sset
s ap
plie
s to
all
prop
erty
, pla
nt a
nd e
quip
men
t, in
clud
ing
thos
e m
easu
red
at fa
ir va
lue.
Ass
ets
who
se fu
ture
eco
nom
ic b
enef
its a
re n
ot
prim
arily
dep
ende
nt o
n th
e as
set’s
abi
lity
to
gene
rate
cas
h an
d w
hich
mig
ht n
ot b
e im
paire
d un
der P
BE
Acc
ount
ing
Stan
dard
s m
ight
be
impa
ired
unde
r IFR
S d
ue to
lim
ited
gene
ratio
n of
ca
sh fl
ows.
The
Gro
up a
sset
val
ues
may
ther
efor
e be
hig
her t
han
unde
r IFR
S b
ecau
se s
ome
impa
irmen
t may
not
be
requ
ired
unde
r PB
E
Acc
ount
ing
Sta
ndar
ds w
hen
impa
irmen
t wou
ld b
e re
cogn
ised
und
er IF
RS
. The
use
of d
iffer
ent
met
hods
may
resu
lt in
diff
eren
ces
in th
e am
ount
of
valu
e in
use
. The
fact
that
pro
perty
, pla
nt a
nd
equi
pmen
t mea
sure
d at
fair
valu
e is
not
requ
ired
to b
e re
view
ed a
nd te
sted
for i
mpa
irmen
t und
er
the
PB
E A
ccou
ntin
g S
tand
ards
has
no
sign
ifica
nt
impa
ct b
ecau
se th
ese
asse
ts a
re s
ubje
ct to
su
ffici
ently
regu
lar r
eval
uatio
ns to
ens
ure
that
thei
r ca
rryi
ng a
mou
nt d
oes
not d
iffer
mat
eria
lly fr
om fa
ir va
lue.

Te Rīpoata ā-Tau 2016/2017 o Te Kaunihera
o Tāmaki Makaurau
Pokanga 3: Ngā Pūrongo Pūtea | 107
Ann
ual R
epor
t 201
6/20
17
Vol
ume
3: F
inan
cial
sta
tem
ents
1
07
Mai
n di
ffere
nces
bet
wee
n IF
RS
and
PBE
Acc
ount
ing
Stan
dard
s (c
ontin
ued)
PB
E A
ccou
ntin
g St
anda
rds
with
com
para
ble
IFR
S eq
uiva
lent
(con
tinue
d)
PB
E IF
RS
Impa
ct
Rev
enue
from
non
-exc
hang
e tra
nsac
tions
Th
e P
BE
Acc
ount
ing
Sta
ndar
ds re
quire
reve
nue
to b
e cl
assi
fied
as re
venu
e fro
m e
xcha
nge
or n
on-e
xcha
nge
trans
actio
ns. E
xcha
nge
trans
actio
ns a
re tr
ansa
ctio
ns in
w
hich
one
ent
ity re
ceiv
es a
sset
s or
ser
vice
s, o
r has
lia
bilit
ies
extin
guis
hed,
and
dire
ctly
giv
es a
ppro
xim
atel
y eq
ual v
alue
(prim
arily
in th
e fo
rm o
f cas
h, g
oods
, se
rvic
es, o
r use
of a
sset
s) to
ano
ther
ent
ity in
exc
hang
e.
Non
-exc
hang
e tra
nsac
tions
are
tran
sact
ions
that
are
not
ex
chan
ge tr
ansa
ctio
ns.
PB
E IP
SA
S 2
3 R
even
ue fr
om N
on-E
xcha
nge
Tran
sact
ions
dea
ls w
ith re
venu
e fro
m n
on-e
xcha
nge
trans
actio
ns.
The
Gro
up’s
non
-exc
hang
e re
venu
e in
clud
es re
venu
e fro
m g
ener
al ra
tes
and
gran
ts a
nd
subs
idie
s re
ceiv
ed. F
ees
and
user
cha
rges
der
ived
from
ac
tiviti
es th
at a
re p
artia
lly fu
nded
by
gene
ral r
ates
are
al
so c
onsi
dere
d to
be
reve
nue
aris
ing
from
non
-ex
chan
ge tr
ansa
ctio
ns.
The
Gro
up re
cogn
ises
an
inflo
w o
f res
ourc
es fr
om a
no
n-ex
chan
ge tr
ansa
ctio
n as
reve
nue
exce
pt to
the
exte
nt th
at a
liab
ility
is a
lso
reco
gnis
ed in
resp
ect o
f the
sa
me
inflo
w. A
liab
ility
is re
cogn
ised
whe
n a
cond
ition
is
atta
ched
to th
e re
venu
e th
at re
quire
s th
at re
venu
e to
be
retu
rned
unl
ess
it is
con
sum
ed in
the
spec
ified
way
. As
the
cond
ition
s ar
e sa
tisfie
d, th
e lia
bilit
y is
redu
ced
and
reve
nue
is re
cogn
ised
.
IFR
S d
oes
not c
onta
in a
spe
cific
sta
ndar
d th
at
deal
s w
ith re
venu
e fro
m n
on-e
xcha
nge
trans
actio
ns. I
AS
20
Acc
ount
ing
for G
over
nmen
t G
rant
s an
d D
iscl
osur
e of
Gov
ernm
ent
Ass
ista
nce
cont
ains
gui
danc
e re
latin
g to
the
acco
untin
g fo
r gov
ernm
ent g
rant
s. U
nder
IAS
20
, gov
ernm
ent g
rant
s ar
e re
cogn
ised
in p
rofit
or
loss
on
a sy
stem
atic
bas
is o
ver t
he p
erio
ds in
w
hich
the
entit
y re
cogn
ises
exp
ense
s fo
r the
re
late
d co
sts
for w
hich
the
gran
ts a
re in
tend
ed to
co
mpe
nsat
e. In
the
case
of g
rant
s re
late
d to
as
sets
, IA
S 2
0 re
sults
in s
ettin
g up
the
gran
t as
defe
rred
inco
me
or d
educ
ting
it fro
m th
e ca
rryi
ng
amou
nt o
f the
ass
et.
Com
pare
d to
IAS
20,
the
Gro
up’s
acc
ount
ing
polic
y m
ay le
ad to
ear
lier r
ecog
nitio
n of
reve
nue
from
non
-exc
hang
e tra
nsac
tions
; and
may
als
o re
sult
in d
iffer
ence
s in
ass
et v
alue
s in
rela
tion
to
gran
ts re
late
d to
ass
ets.
A
s a
resu
lt of
ado
ptin
g P
BE
IPS
AS
23,
the
timin
g of
reco
gnis
ing
the
grou
p’s
rate
s re
venu
e ha
s ch
ange
d to
reco
gnis
e an
nual
gen
eral
rate
s re
venu
e as
at t
he d
ate
of is
suin
g th
e ra
ting
notic
es
for t
he a
nnua
l gen
eral
rate
cha
rge
resu
lting
in th
e en
tire
rate
s re
venu
e be
ing
reco
gnis
ed in
the
inte
rim fi
nanc
ial s
tate
men
ts o
f the
gro
up. T
his
is
cont
rary
to th
e gr
oup’
s pr
evio
us a
ccou
ntin
g po
licy
unde
r NZ
IFR
S P
BE
to re
cogn
ise
gene
ral r
ates
re
venu
e th
roug
hout
the
annu
al p
erio
d. T
he im
pact
of
this
diff
eren
ce in
crea
ses
the
repo
rted
gene
ral
rate
s re
venu
e an
d ne
t ass
ets
in th
e in
terim
fin
anci
al s
tate
men
ts o
f the
gro
up h
owev
er it
has
m
inim
al im
pact
on
the
reco
gniti
on o
f rev
enue
and
ne
t ass
ets
repo
rted
in th
e gr
oup’
s an
nual
fina
ncia
l st
atem
ents
.
Ser
vice
Con
cess
ion
Arr
ange
men
ts (a
lso
know
n as
P
ublic
Priv
ate
Par
tner
ship
A
rran
gem
ents
)
PB
E IP
SA
S 3
2 S
ervi
ce C
once
ssio
n A
rran
gem
ents
dea
ls
with
the
acco
untin
g fo
r ser
vice
con
cess
ion
arra
ngem
ents
from
the
gran
tor’s
per
spec
tive.
Ser
vice
co
nces
sion
arra
ngem
ents
are
mor
e co
mm
only
kno
wn
as P
ublic
Priv
ate
Par
tner
ship
(PP
P) a
rran
gem
ents
. B
road
ly, s
ervi
ce c
once
ssio
n ar
rang
emen
ts a
re
arra
ngem
ents
bet
wee
n th
e pu
blic
and
priv
ate
sect
ors
whe
reby
pub
lic s
ervi
ces
are
prov
ided
by
the
priv
ate
sect
or u
sing
pub
lic in
frast
ruct
ure
(ser
vice
con
cess
ion
asse
t).
IFR
S c
onta
ins
no s
peci
fic g
uida
nce
addr
essi
ng
the
acco
untin
g by
the
gran
tor (
publ
ic e
ntity
) in
a se
rvic
e co
nces
sion
arr
ange
men
t. H
owev
er IF
RS
co
ntai
ns g
uida
nce
for t
he o
pera
tor’s
acc
ount
ing
(priv
ate
entit
y) a
nd N
Z pr
actic
e ha
s be
en fo
r the
gr
anto
r (pu
blic
ent
ity) t
o ‘m
irror
’ the
acc
ount
ing
treat
men
t of t
he p
rivat
e en
tity.
App
lyin
g IF
RS
to s
ervi
ce c
once
ssio
n ar
rang
emen
ts w
ould
not
resu
lt in
a s
igni
fican
t im
pact
on
the
Gro
up’s
fina
ncia
l pos
ition
or
finan
cial
per
form
ance
as,
in a
bsen
ce o
f spe
cific
gu
idan
ce in
NZ
IFR
S, N
Z pr
actic
e ha
s be
en to
‘m
irror
’ the
acc
ount
ing
treat
men
t of t
he p
rivat
e en
tity
unde
r IFR
S w
hich
is c
onsi
sten
t with
the
requ
irem
ents
of t
he P
BE
Acc
ount
ing
Sta
ndar
ds.
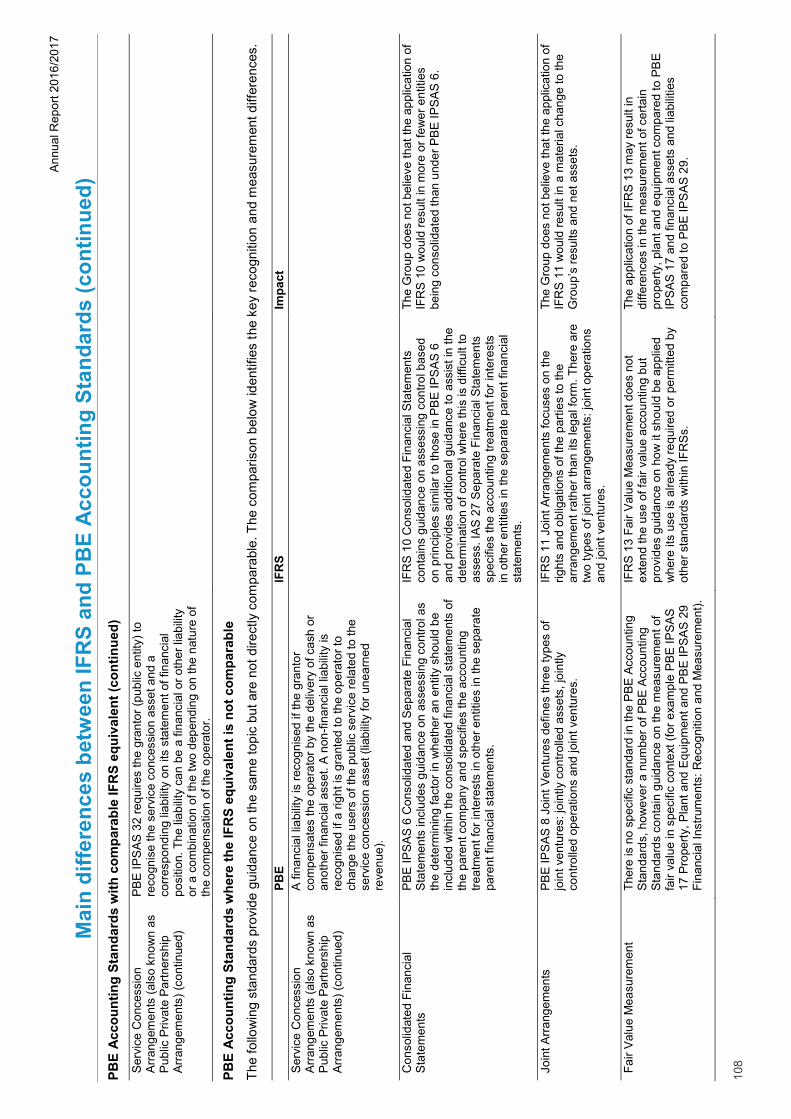
Auckland Council Annual Report 2016/2017
108 | Volume 3: Financial statements
Ann
ual R
epor
t 201
6/20
17
108
Mai
n di
ffere
nces
bet
wee
n IF
RS
and
PBE
Acc
ount
ing
Stan
dard
s (c
ontin
ued)
PB
E A
ccou
ntin
g St
anda
rds
with
com
para
ble
IFR
S eq
uiva
lent
(con
tinue
d)
Ser
vice
Con
cess
ion
Arr
ange
men
ts (a
lso
know
n as
P
ublic
Priv
ate
Par
tner
ship
A
rran
gem
ents
) (co
ntin
ued)
PB
E IP
SA
S 3
2 re
quire
s th
e gr
anto
r (pu
blic
ent
ity) t
o re
cogn
ise
the
serv
ice
conc
essi
on a
sset
and
a
corr
espo
ndin
g lia
bilit
y on
its
stat
emen
t of f
inan
cial
po
sitio
n. T
he li
abilit
y ca
n be
a fi
nanc
ial o
r oth
er li
abilit
y or
a c
ombi
natio
n of
the
two
depe
ndin
g on
the
natu
re o
f th
e co
mpe
nsat
ion
of th
e op
erat
or.
PBE
Acc
ount
ing
Stan
dard
s w
here
the
IFR
S eq
uiva
lent
is n
ot c
ompa
rabl
e
The
follo
win
g st
anda
rds
prov
ide
guid
ance
on
the
sam
e to
pic
but a
re n
ot d
irect
ly c
ompa
rabl
e. T
he c
ompa
rison
bel
ow id
entif
ies
the
key
reco
gniti
on a
nd m
easu
rem
ent d
iffer
ence
s.
PBE
IFR
S Im
pact
S
ervi
ce C
once
ssio
n A
rran
gem
ents
(als
o kn
own
as
Pub
lic P
rivat
e P
artn
ersh
ip
Arr
ange
men
ts) (
cont
inue
d)
A fi
nanc
ial l
iabi
lity
is re
cogn
ised
if th
e gr
anto
r co
mpe
nsat
es th
e op
erat
or b
y th
e de
liver
y of
cas
h or
an
othe
r fin
anci
al a
sset
. A n
on-fi
nanc
ial l
iabi
lity
is
reco
gnis
ed if
a ri
ght i
s gr
ante
d to
the
oper
ator
to
char
ge th
e us
ers
of th
e pu
blic
ser
vice
rela
ted
to th
e se
rvic
e co
nces
sion
ass
et (l
iabi
lity
for u
near
ned
reve
nue)
.
Con
solid
ated
Fin
anci
al
Sta
tem
ents
P
BE
IPS
AS
6 C
onso
lidat
ed a
nd S
epar
ate
Fina
ncia
l S
tate
men
ts in
clud
es g
uida
nce
on a
sses
sing
con
trol a
s th
e de
term
inin
g fa
ctor
in w
heth
er a
n en
tity
shou
ld b
e in
clud
ed w
ithin
the
cons
olid
ated
fina
ncia
l sta
tem
ents
of
the
pare
nt c
ompa
ny a
nd s
peci
fies
the
acco
untin
g tre
atm
ent f
or in
tere
sts
in o
ther
ent
ities
in th
e se
para
te
pare
nt fi
nanc
ial s
tate
men
ts.
IFR
S 1
0 C
onso
lidat
ed F
inan
cial
Sta
tem
ents
co
ntai
ns g
uida
nce
on a
sses
sing
con
trol b
ased
on
prin
cipl
es s
imila
r to
thos
e in
PB
E IP
SA
S 6
an
d pr
ovid
es a
dditi
onal
gui
danc
e to
ass
ist i
n th
e de
term
inat
ion
of c
ontro
l whe
re th
is is
diff
icul
t to
asse
ss. I
AS
27
Sep
arat
e Fi
nanc
ial S
tate
men
ts
spec
ifies
the
acco
untin
g tre
atm
ent f
or in
tere
sts
in o
ther
ent
ities
in th
e se
para
te p
aren
t fin
anci
al
stat
emen
ts.
The
Gro
up d
oes
not b
elie
ve th
at th
e ap
plic
atio
n of
IF
RS
10
wou
ld re
sult
in m
ore
or fe
wer
ent
ities
be
ing
cons
olid
ated
than
und
er P
BE
IPS
AS
6.
Join
t Arr
ange
men
ts
PB
E IP
SA
S 8
Joi
nt V
entu
res
defin
es th
ree
type
s of
jo
int v
entu
res:
join
tly c
ontro
lled
asse
ts, j
oint
ly
cont
rolle
d op
erat
ions
and
join
t ven
ture
s.
IFR
S 1
1 Jo
int A
rran
gem
ents
focu
ses
on th
e rig
hts
and
oblig
atio
ns o
f the
par
ties
to th
e ar
rang
emen
t rat
her t
han
its le
gal f
orm
. The
re a
re
two
type
s of
join
t arr
ange
men
ts: j
oint
ope
ratio
ns
and
join
t ven
ture
s.
The
Gro
up d
oes
not b
elie
ve th
at th
e ap
plic
atio
n of
IF
RS
11
wou
ld re
sult
in a
mat
eria
l cha
nge
to th
e G
roup
’s re
sults
and
net
ass
ets.
Fair
Val
ue M
easu
rem
ent
Ther
e is
no
spec
ific
stan
dard
in th
e P
BE
Acc
ount
ing
Sta
ndar
ds, h
owev
er a
num
ber o
f PB
E A
ccou
ntin
g S
tand
ards
con
tain
gui
danc
e on
the
mea
sure
men
t of
fair
valu
e in
spe
cific
con
text
(for
exa
mpl
e P
BE
IPS
AS
17
Pro
perty
, Pla
nt a
nd E
quip
men
t and
PB
E IP
SA
S 2
9 Fi
nanc
ial I
nstru
men
ts: R
ecog
nitio
n an
d M
easu
rem
ent).
IFR
S 1
3 Fa
ir V
alue
Mea
sure
men
t doe
s no
t ex
tend
the
use
of fa
ir va
lue
acco
untin
g bu
t pr
ovid
es g
uida
nce
on h
ow it
sho
uld
be a
pplie
d w
here
its
use
is a
lread
y re
quire
d or
per
mitt
ed b
y ot
her s
tand
ards
with
in IF
RS
s.
The
appl
icat
ion
of IF
RS
13
may
resu
lt in
di
ffere
nces
in th
e m
easu
rem
ent o
f cer
tain
pr
oper
ty, p
lant
and
equ
ipm
ent c
ompa
red
to P
BE
IP
SA
S 1
7 an
d fin
anci
al a
sset
s an
d lia
bilit
ies
com
pare
d to
PB
E IP
SA
S 29
.
Te Rīpoata ā-Tau 2016/2017 o Te Kaunihera
o Tāmaki Makaurau
Pokanga 3: Ngā Pūrongo Pūtea | 109
Ann
ual R
epor
t 201
6/20
17
Vol
ume
3: F
inan
cial
sta
tem
ents
1
09
Mai
n di
ffere
nces
bet
wee
n IF
RS
and
PBE
Acc
ount
ing
Stan
dard
s (c
ontin
ued)
PB
E A
ccou
ntin
g St
anda
rds
whe
re th
e IF
RS
equi
vale
nt is
not
com
para
ble
(con
tinue
d)
Em
ploy
ee B
enef
its
PB
E IP
SA
S 2
5 E
mpl
oyee
Ben
efits
is b
ased
on
IPS
AS
25
. IP
SA
S 2
5 is
bas
ed o
n IA
S 1
9 E
mpl
oyee
Ben
efits
(2
004)
.
IAS
19
Em
ploy
ee B
enef
its (2
011)
intro
duce
s ch
ange
s to
the
reco
gniti
on, m
easu
rem
ent,
pres
enta
tion
and
disc
losu
re o
f pos
t-em
ploy
men
t be
nefit
s co
mpa
red
to IA
S 1
9 (2
004)
. The
st
anda
rd a
lso
requ
ires
net i
nter
est
expe
nse/
inco
me
to b
e ca
lcul
ated
as
the
prod
uct
of th
e ne
t def
ined
ben
efit
liabi
lity/
asse
t and
the
disc
ount
rate
as
dete
rmin
ed a
t the
beg
inni
ng o
f th
e ye
ar.
The
Gro
up h
as n
o de
fined
ben
efit
oblig
atio
ns a
nd
ther
efor
e th
ere
is n
o im
pact
on
its fi
nanc
ial
perfo
rman
ce a
nd fi
nanc
ial p
ositi
on.

Auckland Council Annual Report 2016/2017
110 | Volume 3: Financial statements
Annual Report 2016/2017
110
Glossary
Activity The goods or services the council provides.
Advisory panels Ten advisory panels provide the council with input on relevant issues and support for engaging with the groups and communities they represent.
Auckland City Centre Advisory Panel Disability Advisory Panel Ethnic Peoples Advisory Panel Heritage Advisory Panel Pacific Peoples Advisory Panel Rainbow Communities Advisory Panel Rural Advisory Panel Seniors Advisory Panel Youth Advisory Panel
Technical Panel
Advisory panel for art in public places
Amortisation The systematic allocation of the value of an intangible asset over its useful life.
Annual budget The budget that sets out what the Group and the council will be working to achieve in a financial year, how it will spend its money, the level of service to be provided, and the level of rates and other revenue required to fund that spending.
Annual report A document that tracks the Group and the council’s annual performance and reports against the relevant annual budget.
Associates Entities that the Group and/or the council have significant influence. Our share of the associates’ surplus/deficit and net assets is recorded in the Group and the council financial statements.
Auckland Council The local government of Auckland established on 1 November 2010. The council is made up of the governing body, 21 local boards and the council organisation (operational staff).
Auckland Council Group The Group consists of the council, and its subsidiaries, associates and joint ventures.
Auckland Plan A 30-year plan for Auckland. Required by the legislation that established Auckland Council, it is a comprehensive long-term strategy for Auckland's growth and development, and includes social, economic, environmental and cultural goals that support the vision for Auckland to become the world's most liveable city.
Budget The itemised formally adopted estimate of expected revenue and expenditure through LTP/Annual Budget for a given period.
Capital expenditure (capex)
Spending on buying or building new assets and renewing existing assets.
City Rail Link (CRL) a rail project in central Auckland designed to connect the Britomart Transport Centre with the Western Line at Mount Eden Railway Station.

Te Rīpoata ā-Tau 2016/2017 o Te Kaunihera
o Tāmaki Makaurau
Pokanga 3: Ngā Pūrongo Pūtea | 111
Annual Report 2016/2017
Volume 3: Financial statements 111
Glossary (continued)
Community outcomes The things the community thinks are important for its current or future social, economic, environmental or cultural well-being. These outcomes are used to help set priorities in the council’s 10-year plan.
Council-controlled organisation (CCO)
A company or other entity under the control of local authorities through their shareholding of 50 per cent or more, voting rights of 50 per cent or more, or right to appoint 50 per cent or more of the directors. Some organisations may meet this definition but are exempted as CCOs.
Credit Support Annex (CSA)
An agreement which provides collateral for derivative transactions. The purpose is to reduce credit risk to a counterparty by providing security.
Deferred capital projects Capital projects originally planned in previous years, but which have been delayed.
Depreciation The charge representing consumption or use of an asset, assessed by spreading the asset’s value over its estimated economic life. Depreciation includes amortisation of intangible assets unless otherwise stated.
Development contributions
Contributions from developers, collected to help fund new infrastructure required by growth, as set out in the Local Government Act 2002.
Effective interest rate method
A method of calculating the amortised cost of a financial instrument and of allocating the interest revenue or expense over the relevant period by using the rate that exactly discounts estimated future cash payments or receipts through the expected life of the financial instrument.
Fair value Amount which an asset could be exchanged or a liability settled between knowledgeable, willingly parties in an arm’s length transaction.
Governing body The governing body is made up of the mayor and 20 councillors elected on a ward basis. It shares its responsibility for decision-making with the local boards. It focuses on the big picture and on region-wide strategic decisions. Because each ward may vary in population, some wards have more than one councillor.
Grants and subsidies Revenue received from an external agency to help fund an activity or service that the Group and/or the council provide.
Gross operating expenditure
Total expenditure without deductions of depreciation and finance costs.
Housing Infrastructure Fund (HIF)
The government’s funding mechanism to assist high growth councils to advance infrastructure projects important to increasing housing supply.
Independent Māori Statutory Board (IMSB)
An independent board established by legislation to promote and advise the council on cultural, economic, environmental and social issues of significance for mana whenua groups and mataawaka of Tāmaki Makaurau. It also ensures that the council acts in accordance with statutory provisions referring to the Treaty of Waitangi.

Auckland Council Annual Report 2016/2017
112 | Volume 3: Financial statements
Annual Report 2016/2017
112
Glossary (continued)
Infrastructure growth charge
Amount collected from property owners or developers applying for new connections to help fund new infrastructure required by growth.
Joint ventures Contractual arrangements whereby the council or Group undertakes an economic activity that is subject to joint control or an interest in an entity with an external party.
Legacy councils The eight former territorial authorities in the Auckland region that were disestablished on 31 October 2010. They comprise Auckland City Council, Auckland Regional Council, Franklin District Council, Manukau City Council, North Shore City Council, Papakura District Council, Rodney District Council, Waitakere City Council.
Local boards Local boards represent their local communities and make decisions on local issues, activities and facilities. There are 21 local boards which share responsibility for decision-making with the governing body. Each board comprises between five and nine elected members. They make decisions on local matters, provide local leadership and build strong local communities.
Local board agreement An annual agreement between the governing body and each local board outlining its priorities and preferences in its local board plan for the year.
Local board plan A plan that reflects the priorities and preferences of the communities within the local board area in respect of the level and nature of local activities to be provided by the council over the following three years.
Local Government Act 2002 (LGA 2002)
The act that defines the powers and responsibilities of territorial local authorities such as the council.
Local Government (Financial Reporting and Prudence) Regulations 2014
The act promoting prudent financial management by local authorities requiring disclosure of performance in relation to benchmarks as a single entity and not including subsidiaries. Auckland Council must disclose, in its disclosure statements, its performance and that of its subsidiaries as a single entity.
Local Government (Auckland Council) Act 2009 (LGACA 2009)
The act establishes the council as a unitary authority for Auckland; and sets out its structure, functions, duties, and powers that differ from the general provisions applying to local authorities under the Local Government Act 2002 and certain other enactments. Also determines the management of transport and water supply and wastewater services for Auckland and sets out requirements relating to substantive council-controlled organisations.
Local Government (Rating) Act 2002 (LGRA)
Defines how territorial local authorities such as Auckland Council can assess and apply their rating policy.
Local Government Commission
An independent statutory body whose main role is to make decisions on the structure and representation requirements of local government in New Zealand.
Local Government Funding Agency (LGFA)
An organisation jointly owned by most local authorities in New Zealand and the Crown to borrow on behalf of the sector.

Te Rīpoata ā-Tau 2016/2017 o Te Kaunihera
o Tāmaki Makaurau
Pokanga 3: Ngā Pūrongo Pūtea | 113
Annual Report 2016/2017
Volume 3: Financial statements 113
Glossary (continued)
Long-term plan Also commonly referred to as the LTP and the 10-year plan. This sets out the council’s vision, activities, projects, policies, and budgets for a 10-year period.
Operating expenses Expenditure resulting from normal business operations.
Performance measures Methods for gauging progress towards the meeting of objectives. Measures usually relate to agreed levels of performance and types of services provided.
Rates A charge against the property to help fund services and assets the council provides.
Service concession arrangement
A binding arrangement between grantor and operator in which,
the operator uses the service concession asset to provide a public service on behalf of the grantor for a specified period of time; and
the operator is compensated for its services over the period of the service concession arrangement.
Service concession assets
Assets used to provide public services in a service concession arrangement.
Spatial plan Known as the Auckland Spatial Plan, or simply as the Auckland Plan.
Subsidiaries Entities over which the council and group has the power to govern the financial and operating policies generally accompanying a shareholding of more than one half of the voting rights.
The Southern Initiative (TSI)
A plan that identifies stable housing, job growth, skills development and environmental enhancement in south Auckland.
Unitary Plan Replaces the existing Regional Policy Statement and 13 district and regional plans.
Ward An administrative and electoral area of the council. There are 13 in the council’s area.
Water space licence Water space around Wynyard Quarter subject to a coastal permit which is held by the Group for rental return and/or capital growth.

Auckland Council Annual Report 2016/2017
114 | Volume 3: Financial statements
Visit our website for opening hours and list of services available at each service centre.
Me pēhea te whakapā mai ki te kauniheraHow to contact the council
At a customer service centre
Albany 30 Kell Drive, Albany
Birkenhead Corner of Rawene Road and Hinemoa Street, Birkenhead
Browns Bay Corner of Bute Road and Glen Road, Browns Bay
Central city Bledisloe House, 24 Wellesley Street, Auckland Central
35 Graham Street, Auckland Central
Devonport 2 Victoria Road, Devonport
Glen Eden 39 Glenmall Place, Glen Eden
Glenfield 90 Bentley Avenue, Glenfield
Great Barrier Island 75 Hector Sanderson Road, Claris
Helensville 49 Commercial Road, Helensville
Henderson 6 Henderson Valley Road, Henderson
Huapai 296 Main Road (SH16), Huapai
Manukau Ground Floor, Kotuku House, 4 Osterley Way, Manukau
New Lynn 31 Totara Avenue, New Lynn
Ōrewa 50 Centreway Road, Ōrewa
Papakura 35 Coles Crescent, Papakura
Pukekohe 82 Manukau Road, Pukekohe
Takapuna 1 The Strand, Takapuna
Waiheke Island 10 Belgium Street, Ostend
Waiuku Corner of King Street and Constable Road, Waiuku
Warkworth 1 Baxter Street, Warkworth
Whangaparāoa 9 Main Street, Whangaparāoa
Online aucklandcouncil.govt.nz/contactus
Phone 09 301 0101
Post Auckland Council, Private Bag 92300, Auckland 1142

Te Rīpoata ā-Tau 2016/2017 o Te Kaunihera
o Tāmaki Makaurau
Pokanga 3: Ngā Pūrongo Pūtea | 115

Auckland Council Annual Report 2016/2017
116 | Volume 3: Financial statements
ISSN 2253-1335 (Print) ISSN 2253-1343 (Online, PDF)