NUMERICAL STUDY OF THE EFFECT OF VISCOSITY ON AN ...
12
22nd International Congress of Mechanical Engineering (COBEM 2013) November 3-7, 2013, Ribeirão Preto, SP, Brazil Copyright © 2013 by ABCM NUMERICAL STUDY OF THE EFFECT OF VISCOSITY ON AN ELECTRICAL SUBMERSIBLE PUMP Thiago Sirino Henrique Stel LACIT/PPGEM/UTFPR, Av. Sete de Setembro 3165, CEP. 80230-901, Curitiba-PR-Brasil [email protected] [email protected] Rigoberto E. M. Morales LACIT/PPGEM/UTFPR, Av. Sete de Setembro 3165, CEP. 80230-901, Curitiba-PR-Brasil [email protected] Abstract. Electrical Submersible Pumps (ESP’s) are multiple stage pump systems that are widely used as an artificial lifting technique in offshore petroleum production. The pump stages consist of semi-axial centrifugal pumps with vaned diffusers and are used in several complex scenarios such as viscous fluids and multiphase flow pumping. Applying ESP’s to operate with fluids other than the water, although usual in some fields, gives rise to several issues, since virtually all pumps are design for operation with water. However, understanding the influence of viscosity in the ESP performance and flow field pattern is not a trivial matter. On one hand, the phenomenon itself is quite complex in almost every case, mainly because it is very dependent on the pump geometry and specific speed. On the other hand, the semi-axial centrifugal pump configuration itself seems to be geometrically tricky to be analyzed in detail. In this regard, this work presents a transient multi-block numerical approach using the ANSYS CFX TM CFD code to perform simulations for several flow rates, rotor speeds and fluid viscosities in an ESP. As a main objective, the pump performance degradation respect to viscosity is analyzed for several conditions regarding design and off-design operation. The flow field pattern associated with the effect of viscosity is also analyzed. Studying the pump performance degradation cause by viscosity, especially for off-design operation like this work is also intended, is a current and ongoing demand in offshore petroleum production. In association with that, understanding the flow field pattern for those scenarios, which seems to be very particular for each pump, should help to contribute to the related literature in this field. Keywords: ESP, viscosity, numerical, performance degradation, flow field pattern 1. INTRODUCTION Artificial lifting methods are a common practice in offshore petroleum production. Normally, they are used when the oil reservoir has a long time production history and, because of that, the formation pressure is too low to allow a commercially viable, natural flow well to the platform. There are several techniques for artificial lifting, and one of the most used are the Electrical Submersible Pump systems, often referred as “ESP’s”. These systems consist of multiple- stage centrifugal pumps, generally installed below the seabed, whose advantages include low maintenance, great adaptability in deep waters and high efficiency. ESP’s are supposed to work in very adverse conditions, such as pumping multiphase flows and highly viscous liquids. The latter case, which has already been studied for some decades, still represents a major concern in the offshore petroleum industry. In real case scenarios, its temperature can decrease significantly from the reservoir up to the seabed, which increases the fluid viscosity (Amaral et al., 2009). As a standardized procedure, manufacturers design and test centrifugal pump geometries based on water pumping. However, it is known that the pump performance is affected when handling fluids with viscosities higher than that of water, which is often referred as “performance degradation”. Commercial pumps’ catalogs do not provide actual tested data for operation with fluids other than water, and the usual alternative relies on correcting the water design performance data for the other scenario. There are some approaches in the literature on that regard, for example the charts and correlations of Ippen (1945), Hydraulic Institute (1948) and Stepanoff (1957). All of them are based on correction factors to estimate the centrifugal pump performance when operating with liquids of a given viscosity respect to the performance of water at the design point, even though some methods, such as the one of Hydraulic Institute (1948), also predict some off-design conditions. Although the above methods are widely accepted as classical approaches in industry, they are allegedly restricted to the range of specific speeds, viscosities and pump geometric types tested in each case. Moreover, they should be used as an engineering estimation tool and are not indicated in cases where great accuracy is needed. On the other hand, obtaining theoretical models to generalize the centrifugal pump performance for any operational condition and any working fluid seems a challenging task. The flow pattern when operating with water or highly viscous fluids can be quite different inside the impeller channels (Li, 2000a), and may be affected if the pump is single or multistage, radial or axial type, if it is volute type or has vaned (or unvaned) diffuser, among other constructive aspects. Also, when ISSN 2176-5480 9164
Transcript of NUMERICAL STUDY OF THE EFFECT OF VISCOSITY ON AN ...
22nd International Congress of Mechanical Engineering (COBEM 2013) November 3-7, 2013, Ribeirão Preto, SP, Brazil
Copyright © 2013 by ABCM
NUMERICAL STUDY OF THE EFFECT OF VISCOSITY ON AN ELECTRICAL SUBMERSIBLE PUMP
Thiago Sirino Henrique Stel LACIT/PPGEM/UTFPR, Av. Sete de Setembro 3165, CEP. 80230-901, Curitiba-PR-Brasil [email protected] [email protected] Rigoberto E. M. Morales LACIT/PPGEM/UTFPR, Av. Sete de Setembro 3165, CEP. 80230-901, Curitiba-PR-Brasil [email protected] Abstract. Electrical Submersible Pumps (ESP’s) are multiple stage pump systems that are widely used as an artificial lifting technique in offshore petroleum production. The pump stages consist of semi-axial centrifugal pumps with vaned diffusers and are used in several complex scenarios such as viscous fluids and multiphase flow pumping. Applying ESP’s to operate with fluids other than the water, although usual in some fields, gives rise to several issues, since virtually all pumps are design for operation with water. However, understanding the influence of viscosity in the ESP performance and flow field pattern is not a trivial matter. On one hand, the phenomenon itself is quite complex in almost every case, mainly because it is very dependent on the pump geometry and specific speed. On the other hand, the semi-axial centrifugal pump configuration itself seems to be geometrically tricky to be analyzed in detail. In this regard, this work presents a transient multi-block numerical approach using the ANSYS CFXTM CFD code to perform simulations for several flow rates, rotor speeds and fluid viscosities in an ESP. As a main objective, the pump performance degradation respect to viscosity is analyzed for several conditions regarding design and off-design operation. The flow field pattern associated with the effect of viscosity is also analyzed. Studying the pump performance degradation cause by viscosity, especially for off-design operation like this work is also intended, is a current and ongoing demand in offshore petroleum production. In association with that, understanding the flow field pattern for those scenarios, which seems to be very particular for each pump, should help to contribute to the related literature in this field. Keywords: ESP, viscosity, numerical, performance degradation, flow field pattern
1. INTRODUCTION
Artificial lifting methods are a common practice in offshore petroleum production. Normally, they are used when the oil reservoir has a long time production history and, because of that, the formation pressure is too low to allow a commercially viable, natural flow well to the platform. There are several techniques for artificial lifting, and one of the most used are the Electrical Submersible Pump systems, often referred as “ESP’s”. These systems consist of multiple-stage centrifugal pumps, generally installed below the seabed, whose advantages include low maintenance, great adaptability in deep waters and high efficiency.
ESP’s are supposed to work in very adverse conditions, such as pumping multiphase flows and highly viscous liquids. The latter case, which has already been studied for some decades, still represents a major concern in the offshore petroleum industry. In real case scenarios, its temperature can decrease significantly from the reservoir up to the seabed, which increases the fluid viscosity (Amaral et al., 2009). As a standardized procedure, manufacturers design and test centrifugal pump geometries based on water pumping. However, it is known that the pump performance is affected when handling fluids with viscosities higher than that of water, which is often referred as “performance degradation”. Commercial pumps’ catalogs do not provide actual tested data for operation with fluids other than water, and the usual alternative relies on correcting the water design performance data for the other scenario. There are some approaches in the literature on that regard, for example the charts and correlations of Ippen (1945), Hydraulic Institute (1948) and Stepanoff (1957). All of them are based on correction factors to estimate the centrifugal pump performance when operating with liquids of a given viscosity respect to the performance of water at the design point, even though some methods, such as the one of Hydraulic Institute (1948), also predict some off-design conditions.
Although the above methods are widely accepted as classical approaches in industry, they are allegedly restricted to the range of specific speeds, viscosities and pump geometric types tested in each case. Moreover, they should be used as an engineering estimation tool and are not indicated in cases where great accuracy is needed. On the other hand, obtaining theoretical models to generalize the centrifugal pump performance for any operational condition and any working fluid seems a challenging task. The flow pattern when operating with water or highly viscous fluids can be quite different inside the impeller channels (Li, 2000a), and may be affected if the pump is single or multistage, radial or axial type, if it is volute type or has vaned (or unvaned) diffuser, among other constructive aspects. Also, when
ISSN 2176-5480
9164
T. Sirino, H. Stel and R. E. M. Morales Numerical Study Of The Effect Of Viscosity On An Electrical Submersible Pump
considering fluids other than the water, flow can be laminar or turbulent depending on the operating condition (Gülich, 2010).
For a certain range of specific speeds and selected pump geometries, however, there are models to evaluate derating factors for performance correction when pump operates with highly viscous fluids, as the one proposed by Gülich (1999a, 1999b and 2010). He discusses how the losses inside the pump behave when pump operates with fluids other than water and provides a calculation procedure based on evaluating disc friction losses and hydraulic losses. The author takes into account geometrical characteristics such as the outlet impeller diameter, number of impeller entries and blade length, thermal effects related to variations on viscosity and, of course, the viscosity itself as an important component of the friction factor inside the impeller channels, among other specific considerations. It is also considered that the leakage flow loss is not appreciably changed when operating with fluids other than water, and that mixing losses (such as flow deceleration and local separation zones) and mechanical losses are virtually independent of viscosity. The resulting correction factors are compared with tested data and it is said to show good agreement, with greater general discrepancies when viscosity is very high. The author recognizes, however, that the correlations could not be tested for a wide range of specific speeds and applicability is still restricted for the pumps tested, which would not include ESP’s.
One of the issues when using or evaluating correction factors for performance degradation regards pump similarity. It is known that the similarity laws for inviscid flow, which normally hold well for water, are not valid for operation with more viscous fluids, so that the rotational speed is also an important aspect to take into account, as suggested by Amaral (2007) and Amaral et al. (2009). Similarity laws for restricted conditions such as flow rate optimum range and limited rotation speeds were proven to hold for a given pump, as shown experimentally by Solano (2009). He used dimensional analysis to test the pump performance for ranges of viscosities, rotational speeds and flow rates, and confirmed with measured data that the pump operation can be determined by three dimensionless parameters, namely flow coefficient, head coefficient and Reynolds number. However, this should be restricted to the pump optimum range and is strictly valid for a given pump. In any case, his findings alone seem to be very useful in the petroleum industry, where operation generally occurs in the pump optimum range provided by the manufacturers.
While experimental testing for numerous scenarios can be prohibitive for many reasons, from operational limitations to cost, CFD can be a powerful tool to investigate a wide range of conditions, and this is an important task to accomplish when studying performance degradation in pumps. In this sense, this work presents a numerical analysis of the effect of viscosity on the flow inside and ESP. A commercial CFD software is used to study the pump performance and flow pattern for several flow rates, rotational speeds and fluid viscosities. Results are compared to experimental measurements of Amaral (2007) and the influence of viscosity on the performance degradation is analyzed. Aspects related to dimensionless parameters as proposed by Solano (2009) are also discussed. 2. PUMP DESCRIPTION
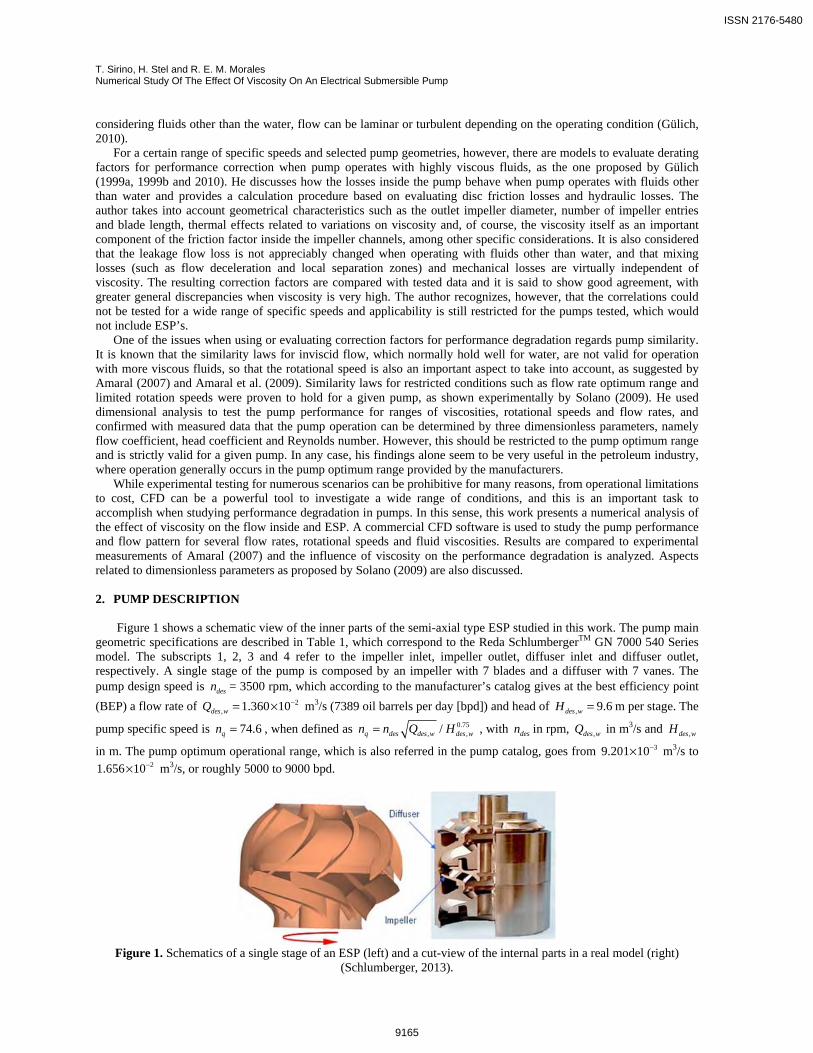
Figure 1 shows a schematic view of the inner parts of the semi-axial type ESP studied in this work. The pump main geometric specifications are described in Table 1, which correspond to the Reda SchlumbergerTM GN 7000 540 Series model. The subscripts 1, 2, 3 and 4 refer to the impeller inlet, impeller outlet, diffuser inlet and diffuser outlet, respectively. A single stage of the pump is composed by an impeller with 7 blades and a diffuser with 7 vanes. The pump design speed is desn = 3500 rpm, which according to the manufacturer’s catalog gives at the best efficiency point
(BEP) a flow rate of 2, 1.360 10−= ×des wQ m3/s (7389 oil barrels per day [bpd]) and head of , 9.6=des wH m per stage. The
pump specific speed is 74.6=qn , when defined as 0.75, ,/=q des des w des wn n Q H , with desn in rpm, ,des wQ in m3/s and ,des wH
in m. The pump optimum operational range, which is also referred in the pump catalog, goes from 39.201 10−× m3/s to 21.656 10−× m3/s, or roughly 5000 to 9000 bpd.
Figure 1. Schematics of a single stage of an ESP (left) and a cut-view of the internal parts in a real model (right)
(Schlumberger, 2013).
ISSN 2176-5480
9165
22nd International Congress of Mechanical Engineering (COBEM 2013) November 3-7, 2013, Ribeirão Preto, SP, Brazil
Table 1. Geometric specifications of the stage parts of the GN7000 540 Series ESP. Description Impeller Diffuser
Number of blades/vanes 7Z = 7Z =
Inlet inner diameter ,1 25.4 mmiD = ,3 83 mmiD =
Outlet inner diameter ,2 83 mmiD = ,4 25.4 mmiD =
Inlet outer diameter ,1 65.2 mmoD = ,3 93.7 mmoD =
Outlet outer diameter ,2 93.7 mmoD = ,4 65.2 mmoD =
Inlet blade height 1 17.3 mmb = 3 42 mmb =
Outlet blade height 2 15.7 mmb = 4 74 mmb =
Inlet blade thickness 1 2 mme = 3 3 mme =
Outlet blade thickness 2 3 mme = 4 4 mme =
Inlet blade angle 1 28ºβ = 3 25.5ºβ =
Outlet blade angle 2 36ºβ = 4 90ºβ =
3. NUMERICAL MODELING
The commercial software ANSYS CFXTM (ANSYS, 2013) is used to solve the problem numerically. This code uses an element-based finite volume method, and a high resolution advection scheme was considered. Turbulence was modeled with the Shear Stress Transport model (Menter, 1993) to resolve the Unsteady Reynolds-Averaged Navier-Stokes (URANS) equations.
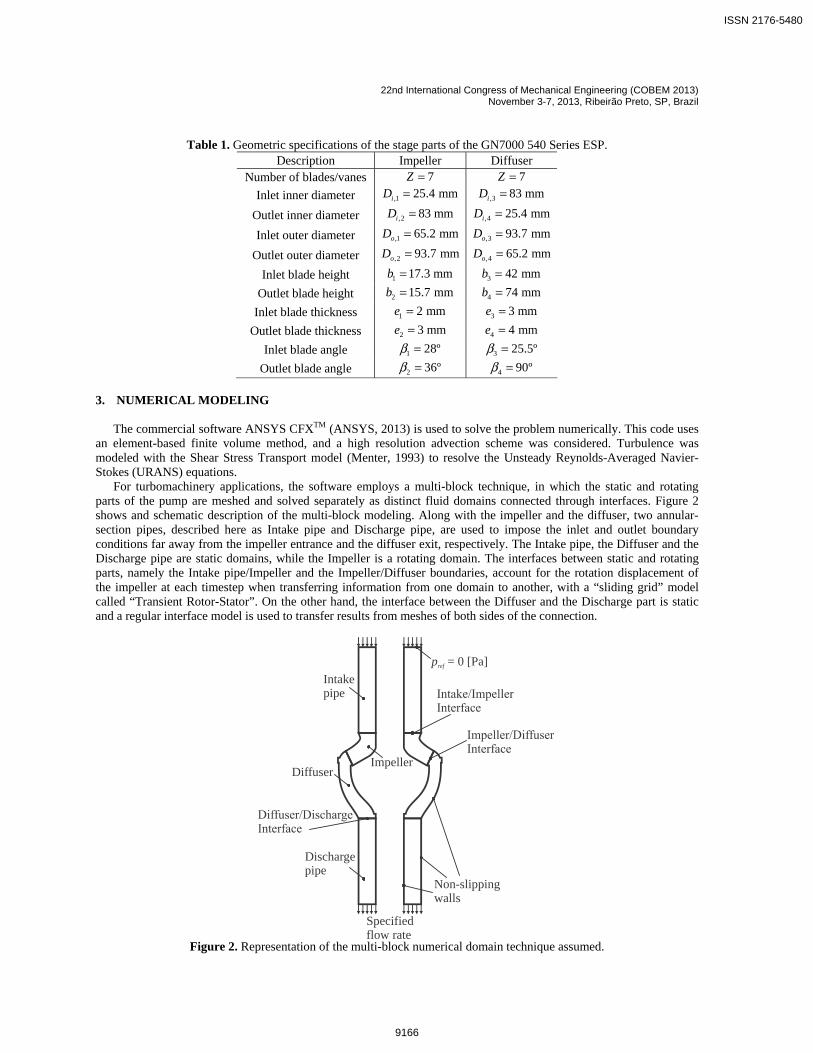
For turbomachinery applications, the software employs a multi-block technique, in which the static and rotating parts of the pump are meshed and solved separately as distinct fluid domains connected through interfaces. Figure 2 shows and schematic description of the multi-block modeling. Along with the impeller and the diffuser, two annular-section pipes, described here as Intake pipe and Discharge pipe, are used to impose the inlet and outlet boundary conditions far away from the impeller entrance and the diffuser exit, respectively. The Intake pipe, the Diffuser and the Discharge pipe are static domains, while the Impeller is a rotating domain. The interfaces between static and rotating parts, namely the Intake pipe/Impeller and the Impeller/Diffuser boundaries, account for the rotation displacement of the impeller at each timestep when transferring information from one domain to another, with a “sliding grid” model called “Transient Rotor-Stator”. On the other hand, the interface between the Diffuser and the Discharge part is static and a regular interface model is used to transfer results from meshes of both sides of the connection.
ImpellerDiffuser
Intakepipe
Dischargepipe
pref = 0 [Pa]
Specifiedflow rate
Non-slippingwalls
Figure 2. Representation of the multi-block numerical domain technique assumed.
ISSN 2176-5480
9166
T. Sirino, H. Stel and R. E. M. Morales Numerical Study Of The Effect Of Viscosity On An Electrical Submersible Pump
All walls are considered as smooth and no-slip. The inlet condition at the Intake pipe entrance is assumed as a fixed static pressure, 0 [Pa]=refp (gauge). At the outlet, imposed at the exit of the Discharge pipe, a fixed flow rate is
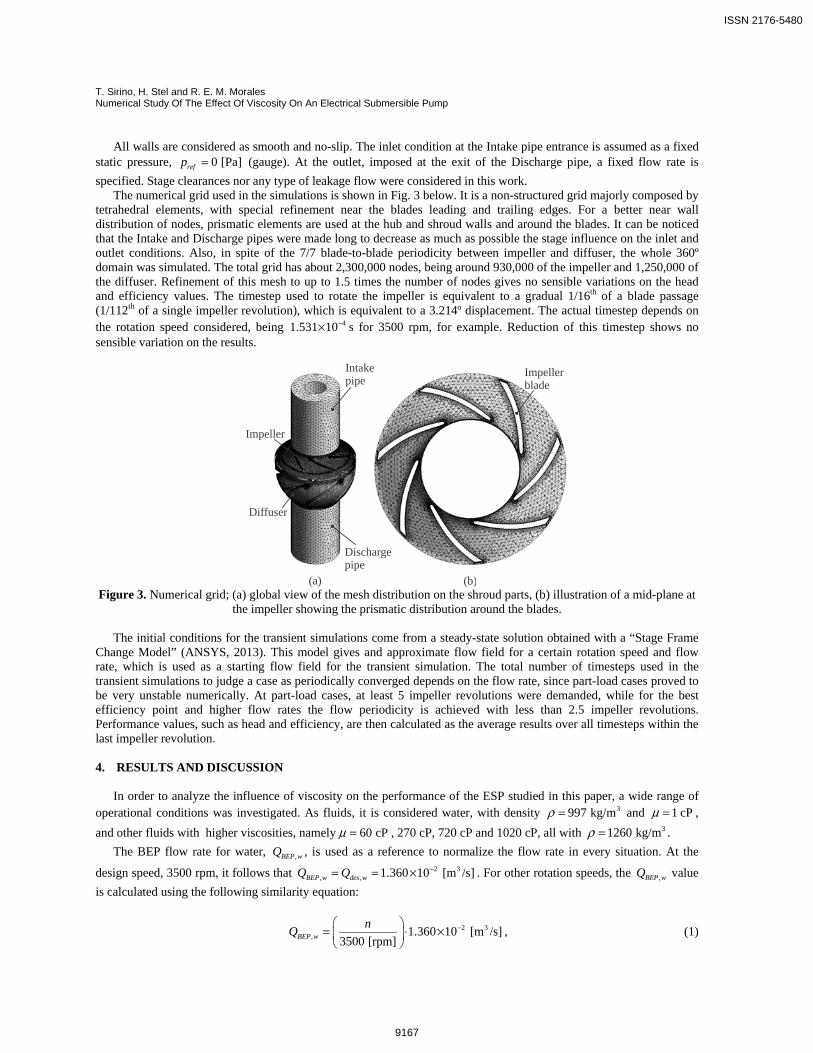
specified. Stage clearances nor any type of leakage flow were considered in this work. The numerical grid used in the simulations is shown in Fig. 3 below. It is a non-structured grid majorly composed by
tetrahedral elements, with special refinement near the blades leading and trailing edges. For a better near wall distribution of nodes, prismatic elements are used at the hub and shroud walls and around the blades. It can be noticed that the Intake and Discharge pipes were made long to decrease as much as possible the stage influence on the inlet and outlet conditions. Also, in spite of the 7/7 blade-to-blade periodicity between impeller and diffuser, the whole 360º domain was simulated. The total grid has about 2,300,000 nodes, being around 930,000 of the impeller and 1,250,000 of the diffuser. Refinement of this mesh to up to 1.5 times the number of nodes gives no sensible variations on the head and efficiency values. The timestep used to rotate the impeller is equivalent to a gradual 1/16th of a blade passage (1/112th of a single impeller revolution), which is equivalent to a 3.214º displacement. The actual timestep depends on the rotation speed considered, being 41.531 10−× s for 3500 rpm, for example. Reduction of this timestep shows no sensible variation on the results.
(a) (b)
Impeller
Diffuser
Intakepipe
Dischargepipe
Impellerblade
Figure 3. Numerical grid; (a) global view of the mesh distribution on the shroud parts, (b) illustration of a mid-plane at
the impeller showing the prismatic distribution around the blades.
The initial conditions for the transient simulations come from a steady-state solution obtained with a “Stage Frame Change Model” (ANSYS, 2013). This model gives and approximate flow field for a certain rotation speed and flow rate, which is used as a starting flow field for the transient simulation. The total number of timesteps used in the transient simulations to judge a case as periodically converged depends on the flow rate, since part-load cases proved to be very unstable numerically. At part-load cases, at least 5 impeller revolutions were demanded, while for the best efficiency point and higher flow rates the flow periodicity is achieved with less than 2.5 impeller revolutions. Performance values, such as head and efficiency, are then calculated as the average results over all timesteps within the last impeller revolution. 4. RESULTS AND DISCUSSION
In order to analyze the influence of viscosity on the performance of the ESP studied in this paper, a wide range of operational conditions was investigated. As fluids, it is considered water, with density 3997 kg/mρ = and 1 cPμ = ,
and other fluids with higher viscosities, namely 60 cPμ = , 270 cP, 720 cP and 1020 cP, all with 31260 kg/mρ = .
The BEP flow rate for water, ,BEP wQ , is used as a reference to normalize the flow rate in every situation. At the
design speed, 3500 rpm, it follows that 2 3, , 1.360 10 [m /s]−= = ×BEP w des wQ Q . For other rotation speeds, the ,BEP wQ value
is calculated using the following similarity equation:
2 3, 1.360 10 [m /s]
3500 [rpm]−
= ⋅ ×
BEP w
nQ , (1)
ISSN 2176-5480
9167
22nd International Congress of Mechanical Engineering (COBEM 2013) November 3-7, 2013, Ribeirão Preto, SP, Brazil
so that the actual ,BEP wQ depends on the rotation speed, n , considered in each analysis. Performance curves are
evaluated for four rotation speeds, viz. 3500, 3000, 2400 and 1800 rpm, and the flow rates considered in each curve range from the shutoff condition up to ,1.5 ⋅ BEP wQ .
The fluids physical properties and the rotation speeds considered were chosen following Amaral (2007), who performed experimental measurements for the above conditions on the same GN7000 ESP Model studied in this work. In the following sections, the numerical results are first compared with data of Amaral (2007) for validation and later discussed in terms of the flow pattern and performance values obtained numerically.
4.1 Validation with experimental data
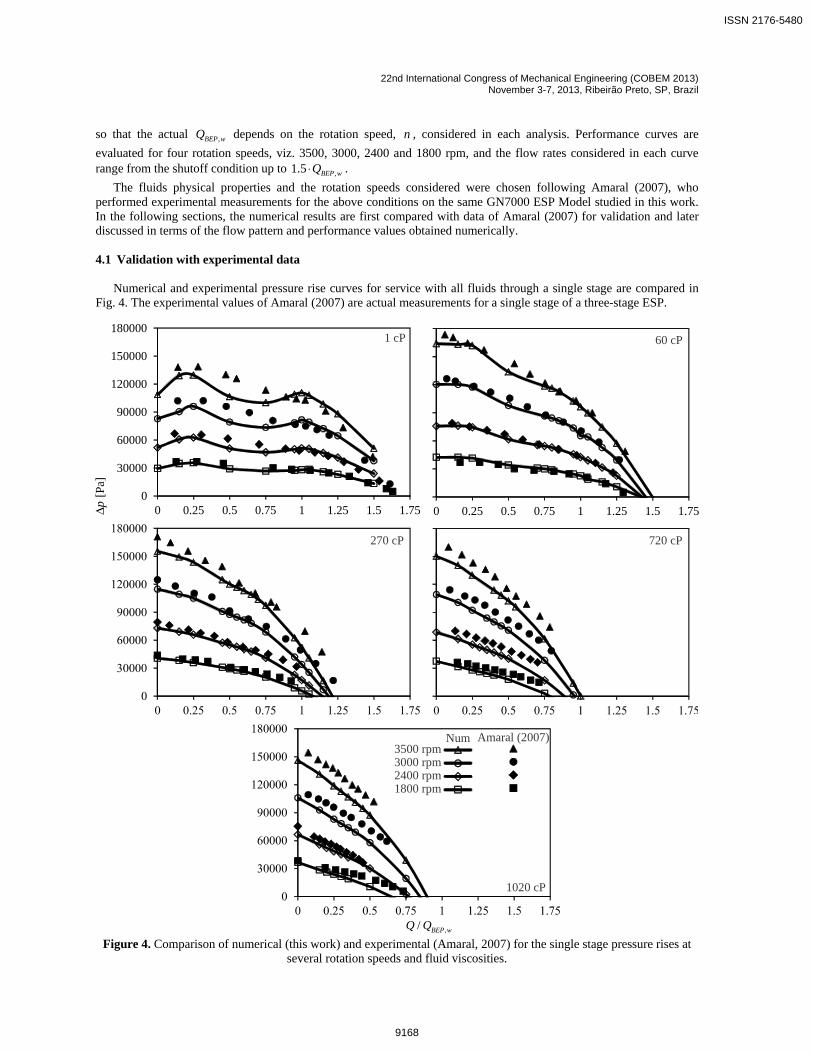
Numerical and experimental pressure rise curves for service with all fluids through a single stage are compared in
Fig. 4. The experimental values of Amaral (2007) are actual measurements for a single stage of a three-stage ESP.
0
30000
60000
90000
120000
150000
180000
0 0.25 0.5 0.75 1 1.25 1.5 1.75 0 0.25 0.5 0.75 1 1.25 1.5 1.75
,/ BEP wQ Q
[Pa
]Δp
3500 rpm3000 rpm2400 rpm1800 rpm
Num Amaral (2007)
1 cP 60 cP
270 cP 720 cP
1020 cP
Figure 4. Comparison of numerical (this work) and experimental (Amaral, 2007) for the single stage pressure rises at
several rotation speeds and fluid viscosities.
ISSN 2176-5480
9168
T. Sirino, H. Stel and R. E. M. Morales Numerical Study Of The Effect Of Viscosity On An Electrical Submersible Pump
Comparison of the numerical and experimental values for water shows good agreement near the BEP and for higher flow rates. A sudden decay of the pressure rise curves below the BEP condition when flow rate is reduced is observed until a minimum is reached at ,0.5 BEP wQ . In this last particular case, large separation zones inside the pump channels
were observed, and pump periodicity regime was not strictly achieved in a repetitive fashion. Then, numerical results increased again with reducing flow rate and agreed fairly well with experimental data. Near the ,1.0 ⋅ BEP wQ , the
deviation of numerical and experimental pressure rise is about 5.5% considering all rotation speeds, while for
,0.5 ⋅ BEP wQ the deviation can be as high as 17%. As discussed by Feng et al. (2010), RANS turbulence models are
generally not able to adequately calculate the recirculation zones inside the pump channels, and this seems to be critical here for low flow rates for water.
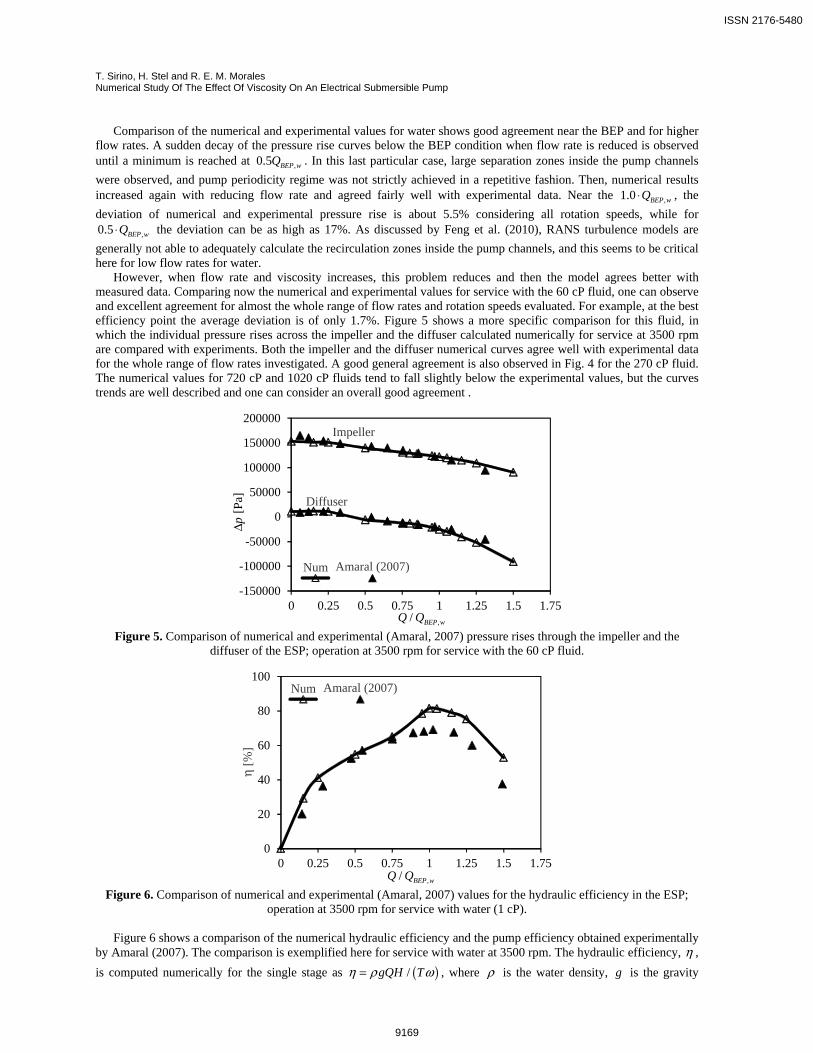
However, when flow rate and viscosity increases, this problem reduces and then the model agrees better with measured data. Comparing now the numerical and experimental values for service with the 60 cP fluid, one can observe and excellent agreement for almost the whole range of flow rates and rotation speeds evaluated. For example, at the best efficiency point the average deviation is of only 1.7%. Figure 5 shows a more specific comparison for this fluid, in which the individual pressure rises across the impeller and the diffuser calculated numerically for service at 3500 rpm are compared with experiments. Both the impeller and the diffuser numerical curves agree well with experimental data for the whole range of flow rates investigated. A good general agreement is also observed in Fig. 4 for the 270 cP fluid. The numerical values for 720 cP and 1020 cP fluids tend to fall slightly below the experimental values, but the curves trends are well described and one can consider an overall good agreement .
-150000
-100000
-50000
0
50000
100000
150000
200000
0 0.25 0.5 0.75 1 1.25 1.5 1.75,/ BEP wQ Q
Num Amaral (2007)
[P
a]Δp
Impeller
Diffuser
Figure 5. Comparison of numerical and experimental (Amaral, 2007) pressure rises through the impeller and the
diffuser of the ESP; operation at 3500 rpm for service with the 60 cP fluid.
0
20
40
60
80
100
0 0.25 0.5 0.75 1 1.25 1.5 1.75,/ BEP wQ Q
Num Amaral (2007)
η [%
]
Figure 6. Comparison of numerical and experimental (Amaral, 2007) values for the hydraulic efficiency in the ESP;
operation at 3500 rpm for service with water (1 cP).
Figure 6 shows a comparison of the numerical hydraulic efficiency and the pump efficiency obtained experimentally by Amaral (2007). The comparison is exemplified here for service with water at 3500 rpm. The hydraulic efficiency, η ,
is computed numerically for the single stage as ( )/gQH Tη ρ ω= , where ρ is the water density, g is the gravity
ISSN 2176-5480
9169
22nd International Congress of Mechanical Engineering (COBEM 2013) November 3-7, 2013, Ribeirão Preto, SP, Brazil
constant (= 9.81 m/s2), Q is the flow rate (m3/s), H is the stage head (m), T is the torque provided by all the rotating
surfaces ( 2 2kg m /s⋅ ) and ω is the angular speed (rad/s). One can notice that the numerical efficiency values are
generally higher than the experimental ones. This is quite expected since, on one hand, the experimental efficiency of Amaral (2007) is measured for a three-stage assembly, and on the other hand there are several losses there are not accounted in the numerical model, such as leakage flow, additional friction losses due to surface roughness, stage-to-stage losses, among others. The overall tendency is well captured in any case, and the higher numerical efficiency occurs at the design BEP, as expected.
Part-loadflow rate
Overloadflow rate
BEP
wat
er60
cP
720
cP
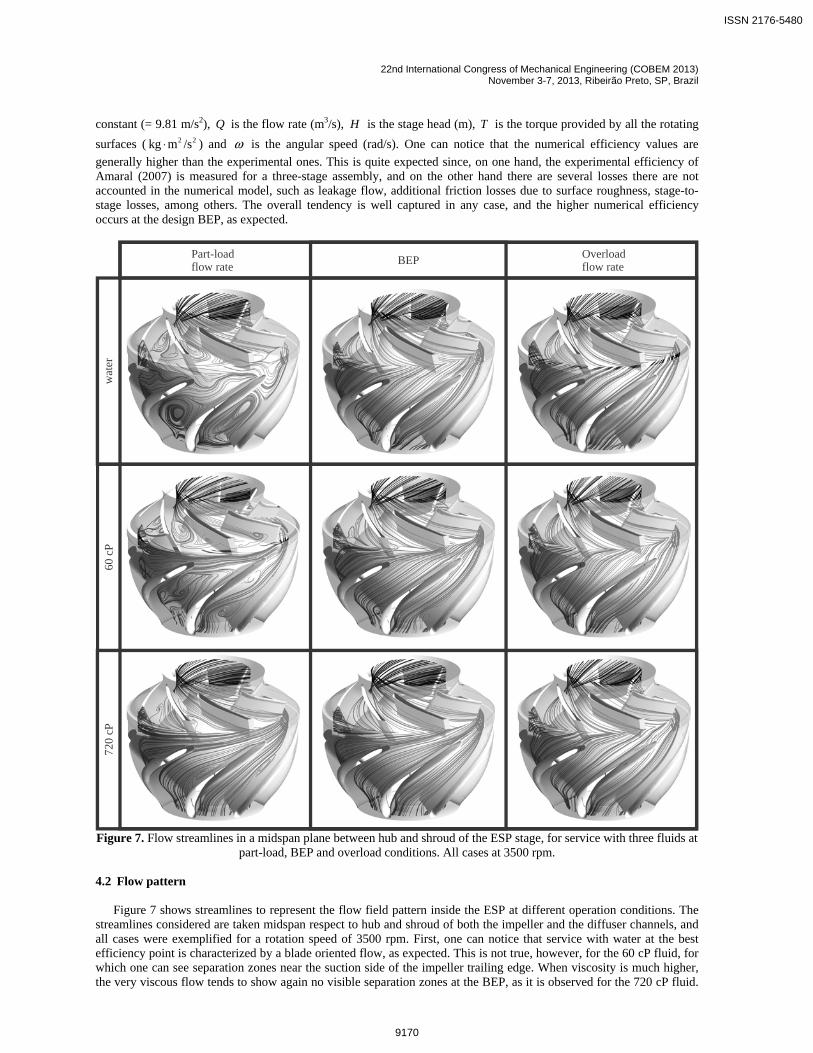
Figure 7. Flow streamlines in a midspan plane between hub and shroud of the ESP stage, for service with three fluids at
part-load, BEP and overload conditions. All cases at 3500 rpm. 4.2 Flow pattern
Figure 7 shows streamlines to represent the flow field pattern inside the ESP at different operation conditions. The
streamlines considered are taken midspan respect to hub and shroud of both the impeller and the diffuser channels, and all cases were exemplified for a rotation speed of 3500 rpm. First, one can notice that service with water at the best efficiency point is characterized by a blade oriented flow, as expected. This is not true, however, for the 60 cP fluid, for which one can see separation zones near the suction side of the impeller trailing edge. When viscosity is much higher, the very viscous flow tends to show again no visible separation zones at the BEP, as it is observed for the 720 cP fluid.
ISSN 2176-5480
9170
T. Sirino, H. Stel and R. E. M. Morales Numerical Study Of The Effect Of Viscosity On An Electrical Submersible Pump
The BEP flow rate for this last two cases reduces significantly ( ,0.8 ⋅ BEP wQ for the 60 cP fluid and ,0.45 ⋅ BEP wQ for the
720 cP fluid), as will be discussed later. Part-load flow rates for every case result in visible separation zones, as expected. Conversely, overload operation tends to show no separation zones.
Water, 0.25QBEP,w Water at the BEP 60 cP at the BEP (0.8QBEP,w)
0.140 0.105 0.070 0.035 0.000
Ti
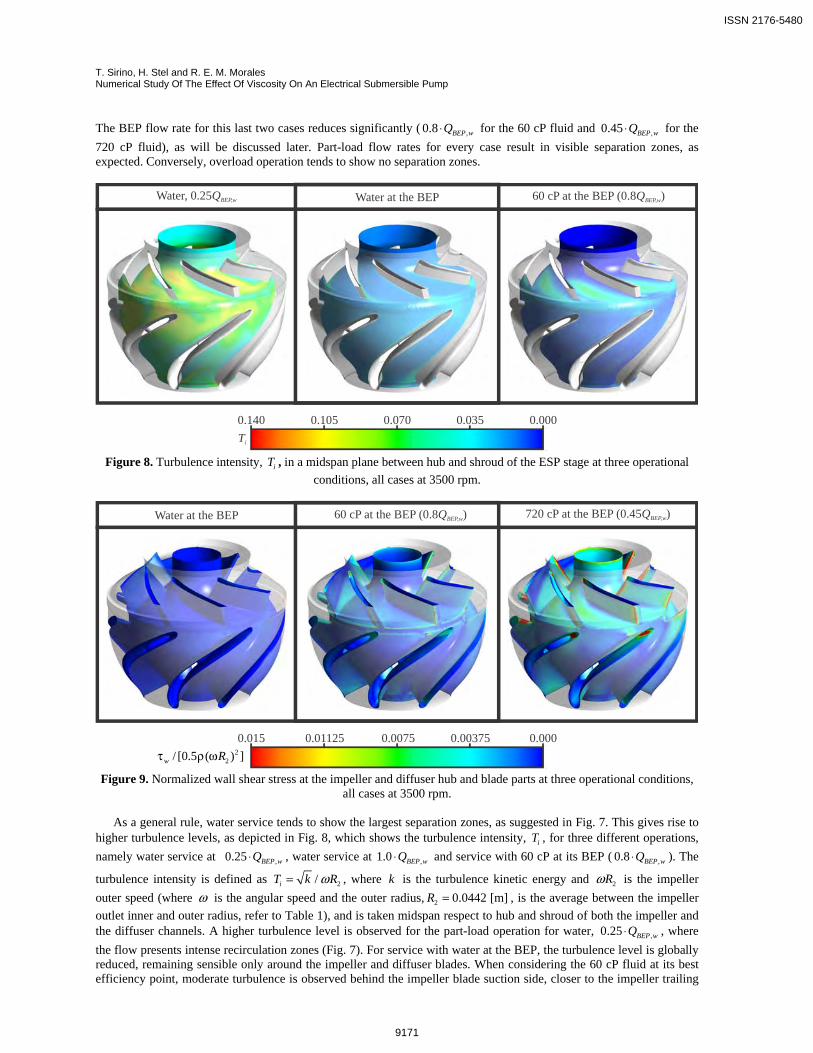
Figure 8. Turbulence intensity, iT , in a midspan plane between hub and shroud of the ESP stage at three operational
conditions, all cases at 3500 rpm.
0.015 0.01125 0.0075 0.00375 0.000
Water at the BEP 60 cP at the BEP (0.8QBEP,w) 720 cP at the BEP (0.45 )QBEP,w
22/ [0.5 ( ) ]τ ρ ωw R
Figure 9. Normalized wall shear stress at the impeller and diffuser hub and blade parts at three operational conditions,
all cases at 3500 rpm.
As a general rule, water service tends to show the largest separation zones, as suggested in Fig. 7. This gives rise to higher turbulence levels, as depicted in Fig. 8, which shows the turbulence intensity, iT , for three different operations,
namely water service at ,0.25 ⋅ BEP wQ , water service at ,1.0 ⋅ BEP wQ and service with 60 cP at its BEP ( ,0.8 ⋅ BEP wQ ). The
turbulence intensity is defined as 2/ ω=iT k R , where k is the turbulence kinetic energy and 2ωR is the impeller
outer speed (where ω is the angular speed and the outer radius, 2 0.0442 [m]=R , is the average between the impeller
outlet inner and outer radius, refer to Table 1), and is taken midspan respect to hub and shroud of both the impeller and the diffuser channels. A higher turbulence level is observed for the part-load operation for water, ,0.25 ⋅ BEP wQ , where
the flow presents intense recirculation zones (Fig. 7). For service with water at the BEP, the turbulence level is globally reduced, remaining sensible only around the impeller and diffuser blades. When considering the 60 cP fluid at its best efficiency point, moderate turbulence is observed behind the impeller blade suction side, closer to the impeller trailing
ISSN 2176-5480
9171
22nd International Congress of Mechanical Engineering (COBEM 2013) November 3-7, 2013, Ribeirão Preto, SP, Brazil
edge. Although it is very difficult to account the net effect of turbulence in pump losses, this can be considered in any case a source of efficiency decrease.
However, as the viscosity increases, the friction losses become more and more important, being the major responsible for the performance degradation. Figure 9 compares the distributions of the wall shear stress, τ w , over the
hub and blade parts of impeller and diffuser (the shroud excluded for visualization purposes), all of them for BEP conditions for each fluid (operation at 3500 rpm as an example). Values are normalized by 2
20.5 ( )ρ ωR . The wall shear
is significantly increased with viscosity, in spite of the fact that, as all cases are compared at their BEP, the flow rate for the highest viscosities are smaller than those for the water service. It is also observed that the blade tips are the regions with the highest stresses, once these regions are subject to high strain rates due to local flow acceleration and direction change.
4.3 Performance degradation
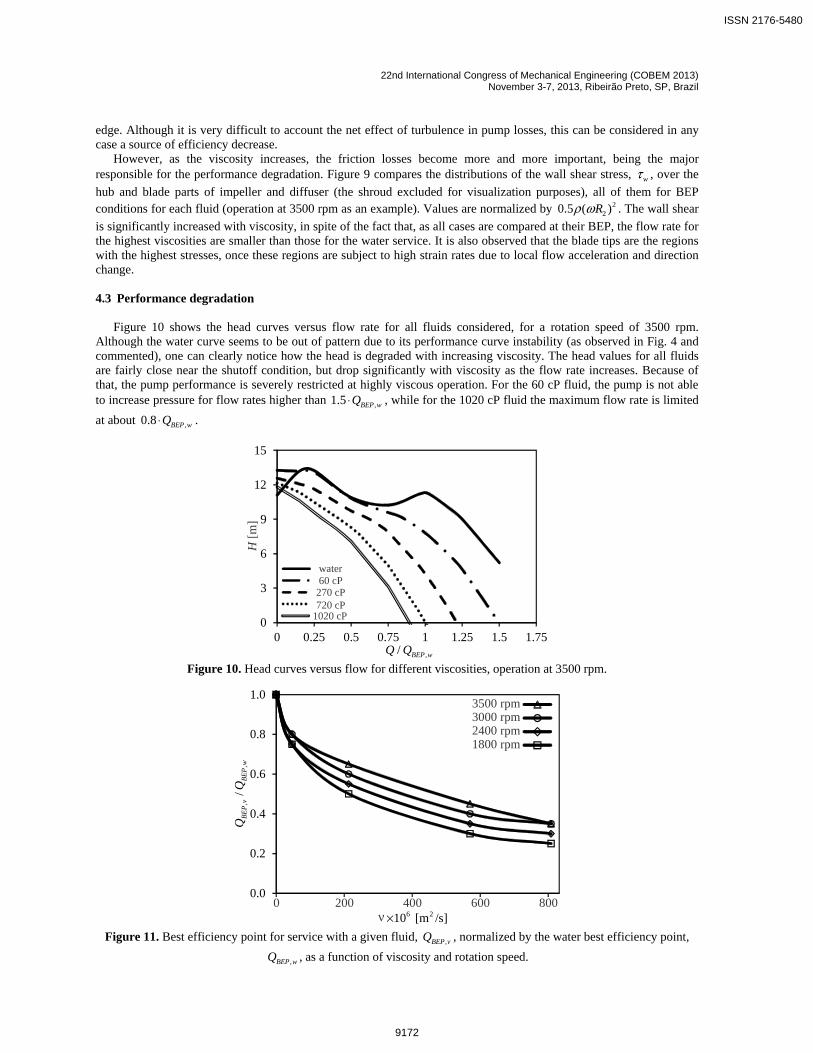
Figure 10 shows the head curves versus flow rate for all fluids considered, for a rotation speed of 3500 rpm.
Although the water curve seems to be out of pattern due to its performance curve instability (as observed in Fig. 4 and commented), one can clearly notice how the head is degraded with increasing viscosity. The head values for all fluids are fairly close near the shutoff condition, but drop significantly with viscosity as the flow rate increases. Because of that, the pump performance is severely restricted at highly viscous operation. For the 60 cP fluid, the pump is not able to increase pressure for flow rates higher than ,1.5 ⋅ BEP wQ , while for the 1020 cP fluid the maximum flow rate is limited
at about ,0.8 ⋅ BEP wQ .
0
3
6
9
12
15
0 0.25 0.5 0.75 1 1.25 1.5 1.75
water60 cP
720 cP1020 cP
,/ BEP wQ Q
H [
m]
270 cP
Figure 10. Head curves versus flow for different viscosities, operation at 3500 rpm.
,,
/B
EP
vB
EP
wQ
Q
6 210 [m /s]×ν
0.0
0.2
0.4
0.6
0.8
1.0
200 400 600 8000
3500 rpm3000 rpm2400 rpm1800 rpm
Figure 11. Best efficiency point for service with a given fluid, ,BEP vQ , normalized by the water best efficiency point,
,BEP wQ , as a function of viscosity and rotation speed.
ISSN 2176-5480
9172
T. Sirino, H. Stel and R. E. M. Morales Numerical Study Of The Effect Of Viscosity On An Electrical Submersible Pump
Once the pump performance is limited, it is said that not just the head itself is degraded, but also the flow rate. For a clearer understanding on this, Fig. 11 shows the ratio , ,/BEP v BEP wQ Q as a function of the kinematic viscosity and the
impeller speed. Here, ,BEP vQ is the best efficiency point obtained for any viscous fluid at a given impeller speed, and
,BEP wQ is the best efficiency point for water at a given rotation speed, as calculated by Eq. (1). This figure shows how
the best efficiency point decreases significantly with viscosity and also with the rotation speed. While the , ,/BEP v BEP wQ Q
values for all speeds converge to 1.0 when ν is close to the water viscosity, they decrease to 0.35 at the 3500 rpm speed
when viscosity increases up to 4 28 10 [m /s]ν −× , and can go down to 0.25 at 1800 rpm. The flow rate degradation can
be considered important even for the 60 cP fluid, for which the , ,/BEP v BEP wQ Q value is of 0.8 at the 3500 rpm speed.
Solano (2009) suggested that the pump performance at viscous operation could be analyzed by means of proper dimensionless numbers. As deduced by the author (and this can be demonstrated using a regular dimensional analysis), for a given pump, three dimensionless numbers can be derived from the flow governing equations and adequately normalized in terms of the design quantities. The three dimensionless and normalized numbers, namely the flow coefficient, φn , the head coefficient, ψ n , and the Reynolds number, nRe , are defined as:
,
φ
=
desn
des w
nQ
n Q (2)
2
2,
ψ
=
desn
des w
nH
Hn (3)
1ρ
μ
=
ndes
nRe
n, (4)
where Q , H , n , ρ and μ are respectively the flow rate, the head, the rotation speed, the fluid density and the fluid
viscosity at any situation and 2 3, 1.360 10 [m /s]−= ×des wQ , , 9.6 [m]=des wH and 3500 [rpm]=desn are the catalog
design flow rate, head and rotation speed for water. In a practical sense, the use of appropriate dimensional analysis would avoid requiring correction factors for
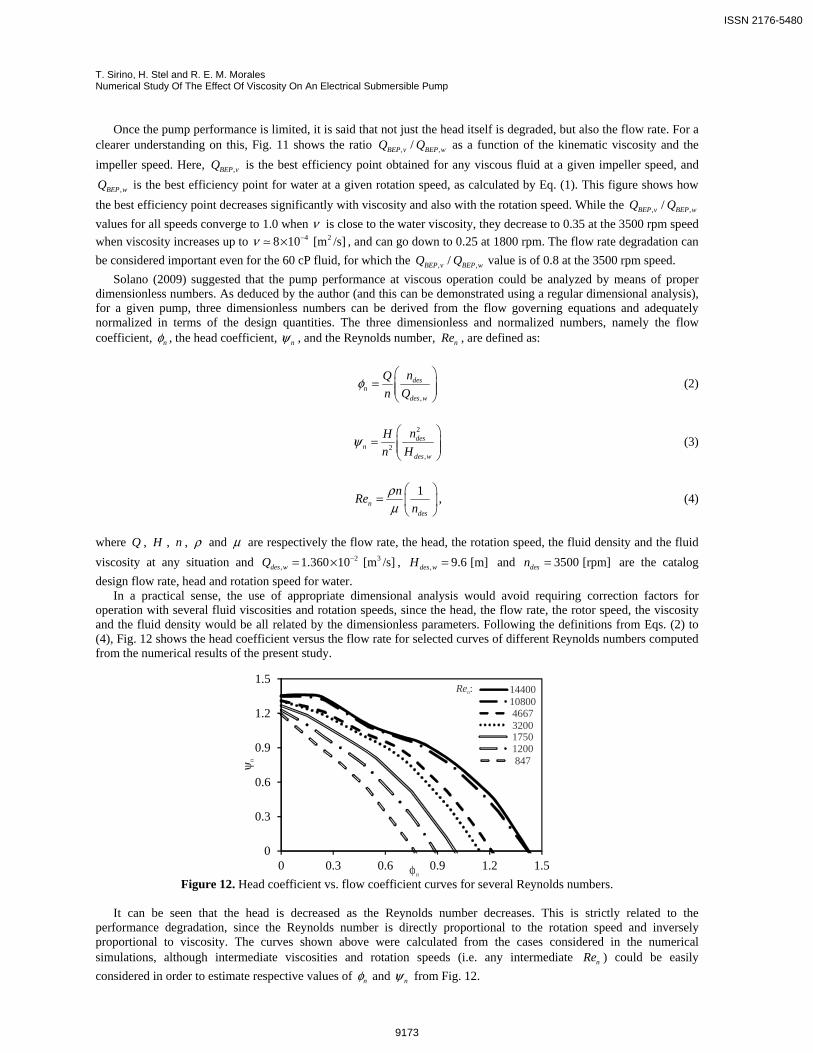
operation with several fluid viscosities and rotation speeds, since the head, the flow rate, the rotor speed, the viscosity and the fluid density would be all related by the dimensionless parameters. Following the definitions from Eqs. (2) to (4), Fig. 12 shows the head coefficient versus the flow rate for selected curves of different Reynolds numbers computed from the numerical results of the present study.
ψn
0
0.3
0.6
0.9
1.2
1.5
0 0.3 0.6 0.9 1.2 1.5
1440010800
32001750
4667
1200847
Ren:
φn Figure 12. Head coefficient vs. flow coefficient curves for several Reynolds numbers.
It can be seen that the head is decreased as the Reynolds number decreases. This is strictly related to the
performance degradation, since the Reynolds number is directly proportional to the rotation speed and inversely proportional to viscosity. The curves shown above were calculated from the cases considered in the numerical simulations, although intermediate viscosities and rotation speeds (i.e. any intermediate nRe ) could be easily
considered in order to estimate respective values of φn and ψ n from Fig. 12.
ISSN 2176-5480
9173
22nd International Congress of Mechanical Engineering (COBEM 2013) November 3-7, 2013, Ribeirão Preto, SP, Brazil
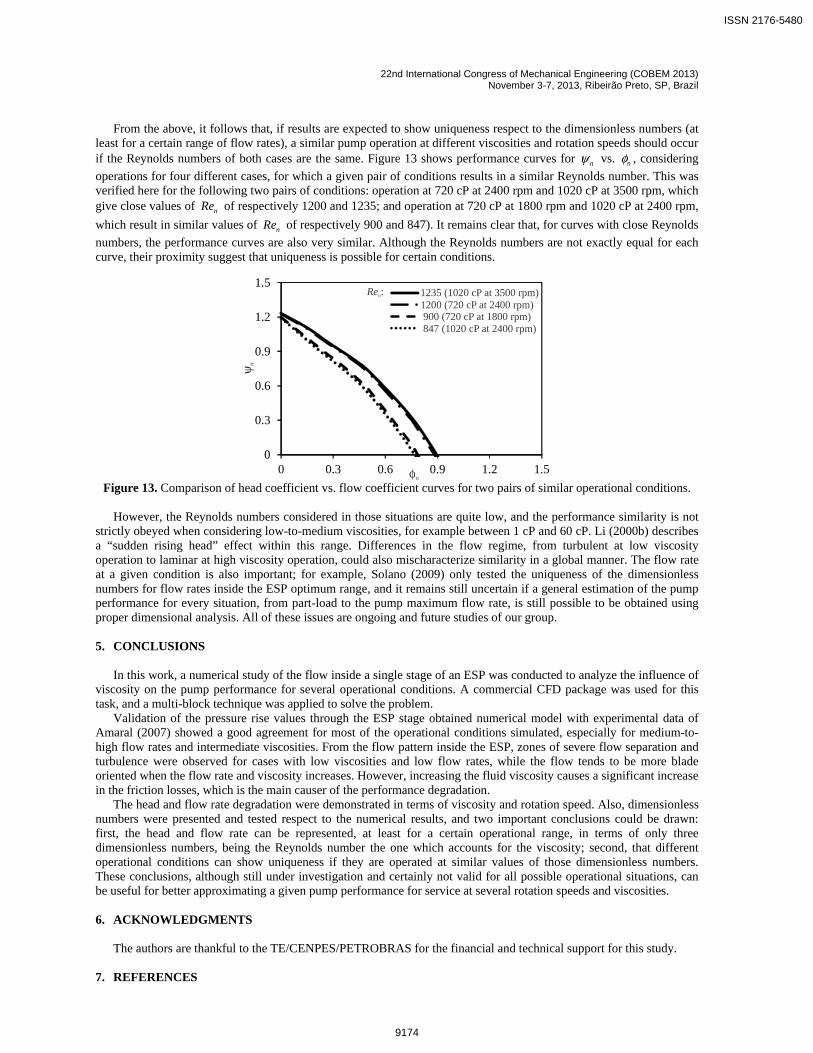
From the above, it follows that, if results are expected to show uniqueness respect to the dimensionless numbers (at least for a certain range of flow rates), a similar pump operation at different viscosities and rotation speeds should occur if the Reynolds numbers of both cases are the same. Figure 13 shows performance curves for ψ n vs. φn , considering
operations for four different cases, for which a given pair of conditions results in a similar Reynolds number. This was verified here for the following two pairs of conditions: operation at 720 cP at 2400 rpm and 1020 cP at 3500 rpm, which give close values of nRe of respectively 1200 and 1235; and operation at 720 cP at 1800 rpm and 1020 cP at 2400 rpm,
which result in similar values of nRe of respectively 900 and 847). It remains clear that, for curves with close Reynolds
numbers, the performance curves are also very similar. Although the Reynolds numbers are not exactly equal for each curve, their proximity suggest that uniqueness is possible for certain conditions.
0
0.3
0.6
0.9
1.2
1.5
0 0.3 0.6 0.9 1.2 1.5
ψn
1235 (1020 cP at 3500 rpm)1200 (720 cP at 2400 rpm)
847 (1020 cP at 2400 rpm)900 (720 cP at 1800 rpm)
Ren:
φn Figure 13. Comparison of head coefficient vs. flow coefficient curves for two pairs of similar operational conditions.
However, the Reynolds numbers considered in those situations are quite low, and the performance similarity is not
strictly obeyed when considering low-to-medium viscosities, for example between 1 cP and 60 cP. Li (2000b) describes a “sudden rising head” effect within this range. Differences in the flow regime, from turbulent at low viscosity operation to laminar at high viscosity operation, could also mischaracterize similarity in a global manner. The flow rate at a given condition is also important; for example, Solano (2009) only tested the uniqueness of the dimensionless numbers for flow rates inside the ESP optimum range, and it remains still uncertain if a general estimation of the pump performance for every situation, from part-load to the pump maximum flow rate, is still possible to be obtained using proper dimensional analysis. All of these issues are ongoing and future studies of our group.
5. CONCLUSIONS
In this work, a numerical study of the flow inside a single stage of an ESP was conducted to analyze the influence of
viscosity on the pump performance for several operational conditions. A commercial CFD package was used for this task, and a multi-block technique was applied to solve the problem.
Validation of the pressure rise values through the ESP stage obtained numerical model with experimental data of Amaral (2007) showed a good agreement for most of the operational conditions simulated, especially for medium-to-high flow rates and intermediate viscosities. From the flow pattern inside the ESP, zones of severe flow separation and turbulence were observed for cases with low viscosities and low flow rates, while the flow tends to be more blade oriented when the flow rate and viscosity increases. However, increasing the fluid viscosity causes a significant increase in the friction losses, which is the main causer of the performance degradation.
The head and flow rate degradation were demonstrated in terms of viscosity and rotation speed. Also, dimensionless numbers were presented and tested respect to the numerical results, and two important conclusions could be drawn: first, the head and flow rate can be represented, at least for a certain operational range, in terms of only three dimensionless numbers, being the Reynolds number the one which accounts for the viscosity; second, that different operational conditions can show uniqueness if they are operated at similar values of those dimensionless numbers. These conclusions, although still under investigation and certainly not valid for all possible operational situations, can be useful for better approximating a given pump performance for service at several rotation speeds and viscosities.
6. ACKNOWLEDGMENTS
The authors are thankful to the TE/CENPES/PETROBRAS for the financial and technical support for this study.
7. REFERENCES
ISSN 2176-5480
9174
T. Sirino, H. Stel and R. E. M. Morales Numerical Study Of The Effect Of Viscosity On An Electrical Submersible Pump
ANSYS, 2013. ANSYS - Solver Theory Guide. ANSYS Inc., Canonsburg, PA. Amaral, G., 2007. Modelagem do Escoamento Monofásico em Bomba Centrífuga Submersa Operando com Fluidos
Viscosos (Modeling of the Single-Phase Flow in an Electrical Submersible Pump Operating with Viscous Fluids). MS thesis (in Portuguese), State University of Campinas, Campinas, Brazil.
Amaral, G., Estevam, V. and França, F. A., 2009. “On the Influence of Viscosity on ESP Performance,” SPE Production & Operations, 24(2), pp. 303-310.
Feng, J., Benra, F. K. and Dohmen, H. J., 2010. “Application of Different Turbulence Models in Unsteady Flow Simulations of a Radial Diffuser Pump”. Forschung im Ingenieurwesen, 74(3), pp. 123-133.
Gülich, J. F., 1999a. “Pumping Highly Viscous Fluids with Centrifugal Pumps – Part 1”. World Pumps, 1999(395), pp. 30-34.
Gülich, J. F., 1999b. “Pumping Highly Viscous Fluids with Centrifugal Pumps – Part 2”. World Pumps, 1999(396), pp. 39-42.
Gülich, J. F., 2010. Centrifugal Pumps. Springer, Heidelberg, 2nd edition. Hydraulic Institute, 1948. Tentative Standards of Hydraulic Institute: Charts for the Determination of Pump
Performance When Handling Viscous Liquids. The Institute, NY. Ippen, A. T., 1945. “The Influence of Viscosity on Centrifugal Pump Performance”. Issue 199 of Fritz Engineering
Laboratory report, ASME Paper No. A-45-57. Li, W. G., 2000a. “Effects of Viscosity of Fluids on Centrifugal Pump Performance and Flow Pattern in the Impeller”.
International Journal of Heat and Fluid Flow, 21(2), pp. 207-212. Li, W. G., 2000b. “The ‘Sudden-Rising Head’ Effect in Centrifugal Oil Pumps”. World Pumps, 2000(409), pp. 34-36. Menter, F. R., 1993. “Zonal Two Equation k-ω Turbulence Models for Aerodynamic Flows”. AIAA Paper, 93-2906. Schlumberger, 2013. “Pumping It Up…or How We Built a Better ESP”. 26 Jun. 2013
<http://www.slb.com/Alumni/slb_alumni_news/2011/2011_0705_pumping_it_up.aspx> Solano, E. A., 2009. “Viscous Effects on the Performance of Electro Submersible Pumps (ESP’s),” MS thesis, The
University of Tulsa, Tulsa, OK. Stepanoff, A. J., 1957. Centrifugal and Axial Flow Pumps: Theory, Design and Application. John Wiley & Sons, NY,
2nd edition. 8. RESPONSIBILITY NOTICE
The authors are the only responsible for the printed material included in this paper.
ISSN 2176-5480
9175