NuevasCombinacionesde Medicamentospara manejo de la...
37
Guillermo Umpierrez, MD, CDE, FACP, FACE Professor of Medicine Emory University School of Medicine Member of AACE Diabetes Task Force, National Chair, Primary care Diabetes Education Program, U.S. Nuevas Combinaciones de Medicamentos para manejo de la Diabetes Tipo 2
Transcript of NuevasCombinacionesde Medicamentospara manejo de la...
Guillermo Umpierrez, MD, CDE, FACP, FACEProfessor of Medicine
Emory University School of Medicine
Member of AACE Diabetes Task Force, National Chair, Primary care Diabetes
Education Program, U.S.
Nuevas Combinaciones de Medicamentos para manejo
de la Diabetes Tipo 2
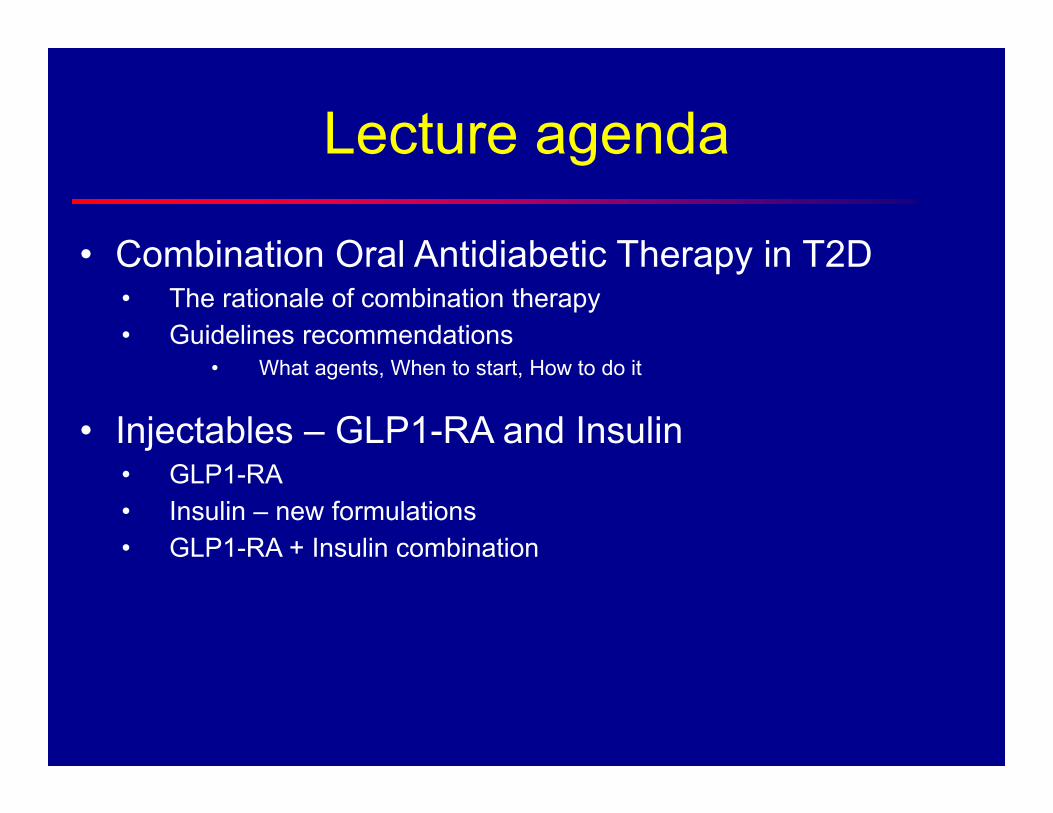
Lecture agenda
• Combination Oral Antidiabetic Therapy in T2D• The rationale of combination therapy• Guidelines recommendations
• What agents, When to start, How to do it
• Injectables – GLP1-RA and Insulin• GLP1-RA• Insulin – new formulations• GLP1-RA + Insulin combination
0
2
4
6
8
10
12
14
1920 1930 1940 1950 1960 1970 1980 1990 2000 2010 2020
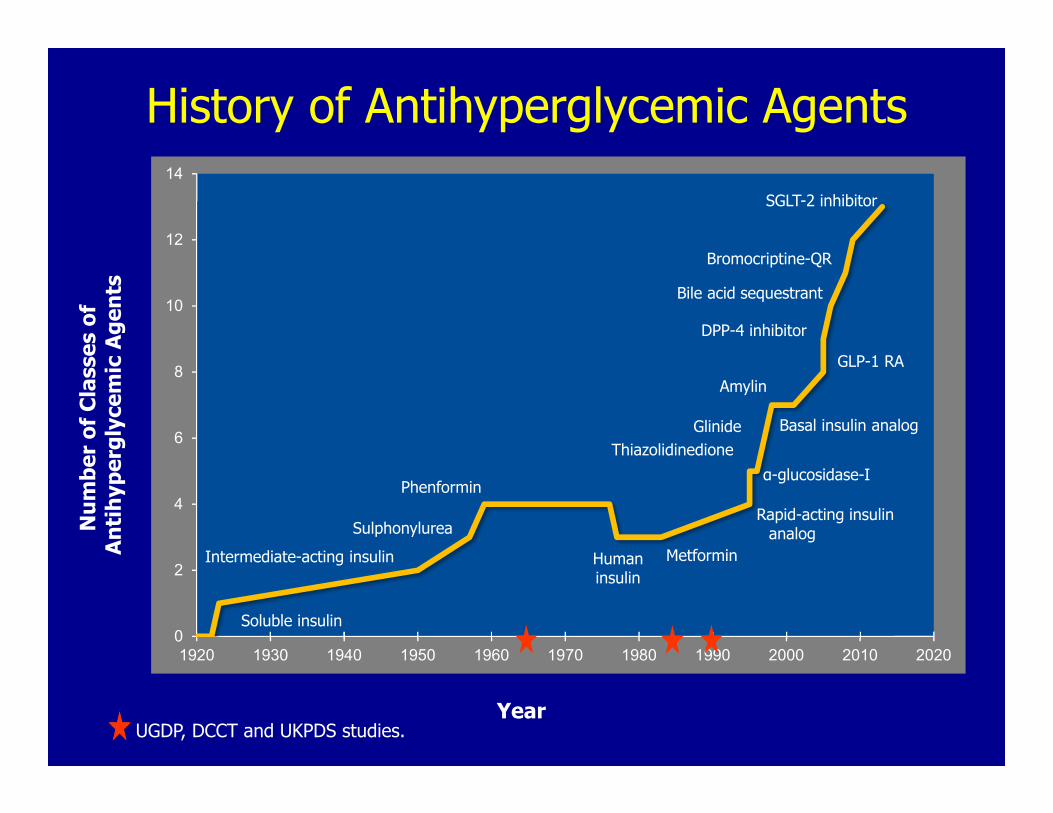
Soluble insulin
SGLT-2 inhibitor
Bromocriptine-QR
Bile acid sequestrant
DPP-4 inhibitor
AmylinGLP-1 RA
Basal insulin analogGlinideThiazolidinedione
MetforminHuman insulin
Sulphonylurea
Phenformin
Intermediate-acting insulin
α-glucosidase-I
Num
ber o
f Cla
sses
of
Antih
yper
glyc
emic
Agen
ts
YearUGDP, DCCT and UKPDS studies.
History of Antihyperglycemic Agents
Rapid-acting insulin analog
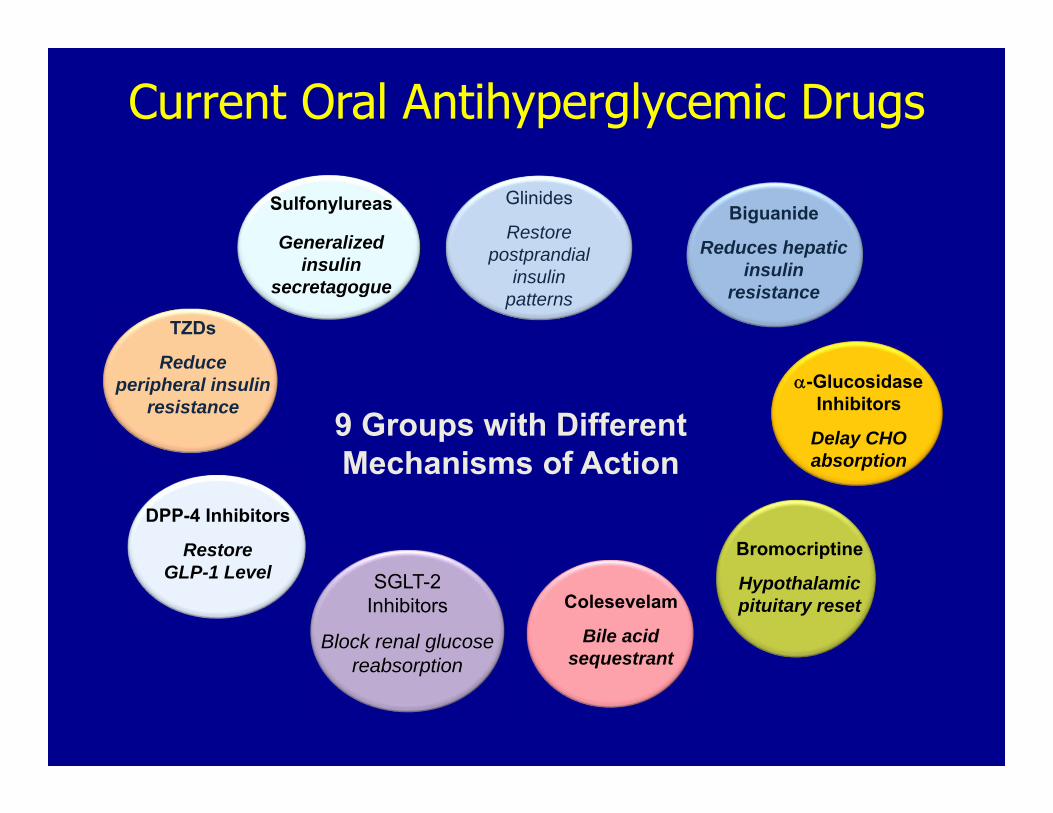
Current Oral Antihyperglycemic Drugs
Sulfonylureas
Generalized insulin
secretagogue
9 Groups with Different Mechanisms of Action
-GlucosidaseInhibitors
Delay CHO absorption
Biguanide
Reduces hepaticinsulin
resistance
TZDs
Reduce peripheral insulin
resistance
Colesevelam
Bile acid sequestrant
Bromocriptine
Hypothalamicpituitary reset
SGLT-2 Inhibitors
Block renal glucose reabsorption
Glinides
Restore postprandial
insulin patterns
DPP-4 Inhibitors
RestoreGLP-1 Level
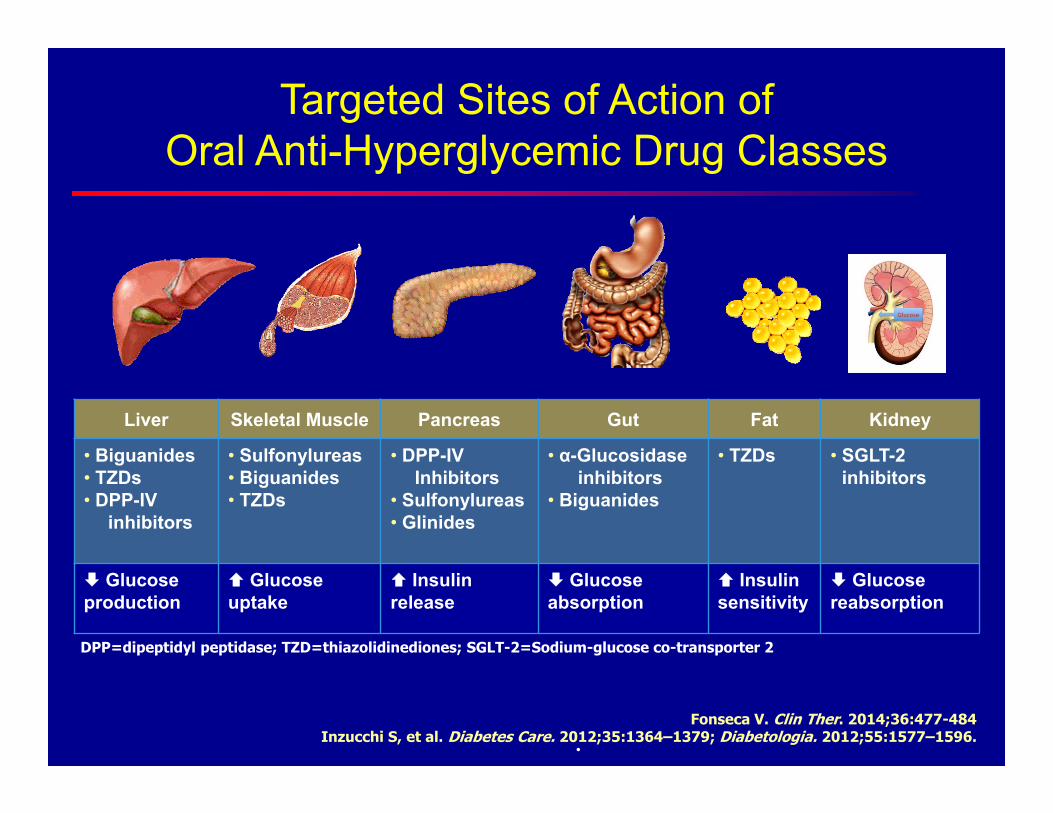
Targeted Sites of Action ofOral Anti-Hyperglycemic Drug Classes
DPP=dipeptidyl peptidase; TZD=thiazolidinediones; SGLT-2=Sodium-glucose co-transporter 2
.Fonseca V. Clin Ther. 2014;36:477-484
Inzucchi S, et al. Diabetes Care. 2012;35:1364–1379; Diabetologia. 2012;55:1577–1596.
Liver Skeletal Muscle Pancreas Gut Fat Kidney
• Biguanides• TZDs• DPP-IV
inhibitors
• Sulfonylureas• Biguanides• TZDs
• DPP-IV Inhibitors
• Sulfonylureas• Glinides
• α-Glucosidaseinhibitors
• Biguanides
• TZDs • SGLT-2 inhibitors
Glucose production
Glucose uptake
Insulin release
Glucoseabsorption
Insulin sensitivity
Glucose reabsorption
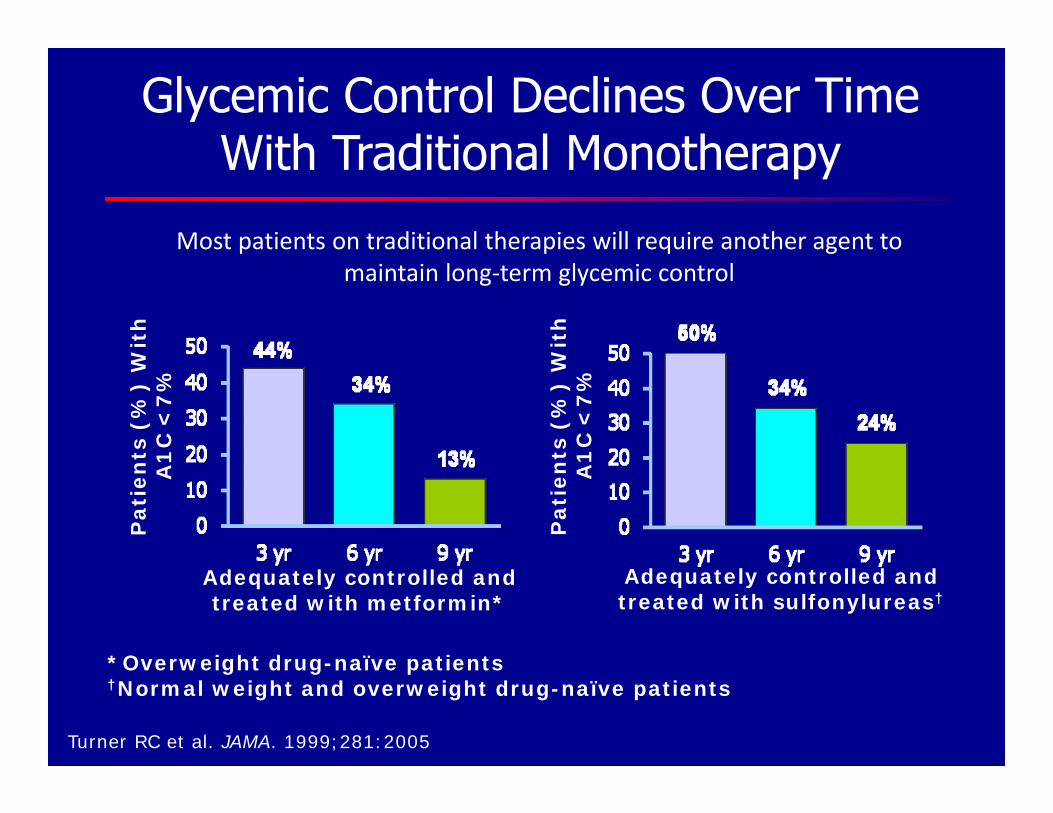
Most patients on traditional therapies will require another agent to maintain long‐term glycemic control
*Overweight drug-naïve patients †Normal weight and overweight drug-naïve patients
Pat
ien
ts (
%)
Wit
h
A1
C <
7%
Pat
ien
ts (
%)
Wit
h
A1
C <
7%
Adequately controlled and treated with sulfonylureas†
Adequately controlled and treated with metformin*
Glycemic Control Declines Over Time With Traditional Monotherapy
Turner RC et al. JAMA. 1999;281:2005
-2.5
-2
-1.5
-1
-0.5
0
0.5
0 1 2 3 4 5 6 7
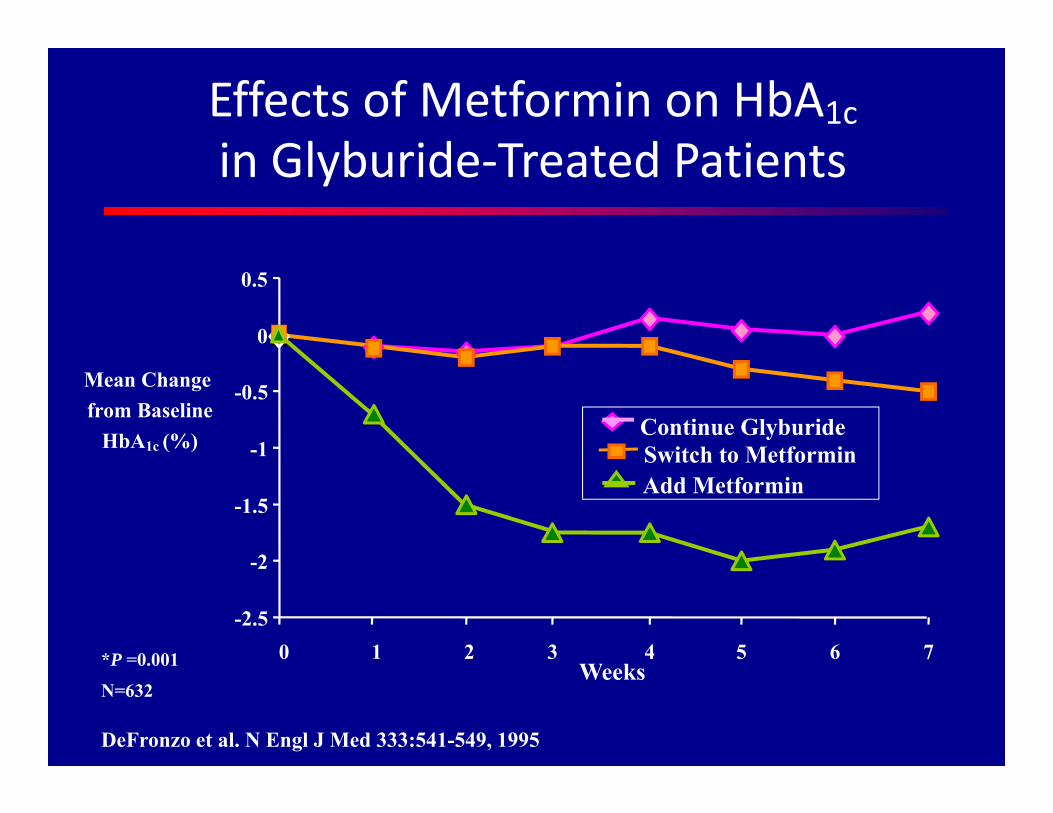
Mean Change from Baseline
HbA1c (%)
Weeks
DeFronzo et al. N Engl J Med 333:541-549, 1995
N=632
*P =0.001
Effects of Metformin on HbA1c in Glyburide‐Treated Patients
Continue GlyburideSwitch to MetforminAdd Metformin
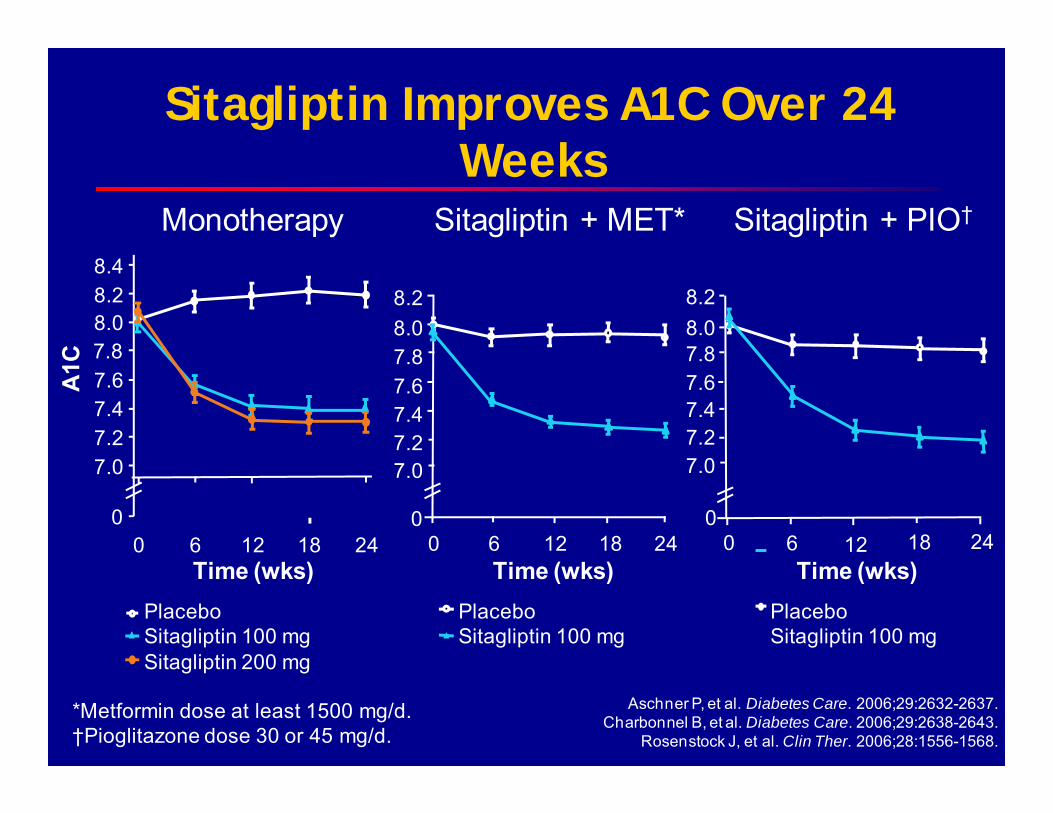
Aschner P, et al. Diabetes Care. 2006;29:2632-2637.Charbonnel B, et al. Diabetes Care. 2006;29:2638-2643.
Rosenstock J, et al. Clin Ther. 2006;28:1556-1568.
PlaceboSitagliptin 100 mg
Sitagliptin + MET*
Time (wks)0 6 12 18 24
7.67.8
7.47.27.0
8.28.0
0
PlaceboSitagliptin 100 mg
Sitagliptin + PIO†
Time (wks)0 6 12 18 24
7.67.8
7.47.27.0
8.28.0
0
*Metformin dose at least 1500 mg/d.†Pioglitazone dose 30 or 45 mg/d.
Monotherapy
A1C
8.4
7.67.8
7.47.27.0
8.28.0
Time (wks)0 6 12 18 24
0
PlaceboSitagliptin 100 mg Sitagliptin 200 mg
Sitagliptin Improves A1C Over 24 Weeks
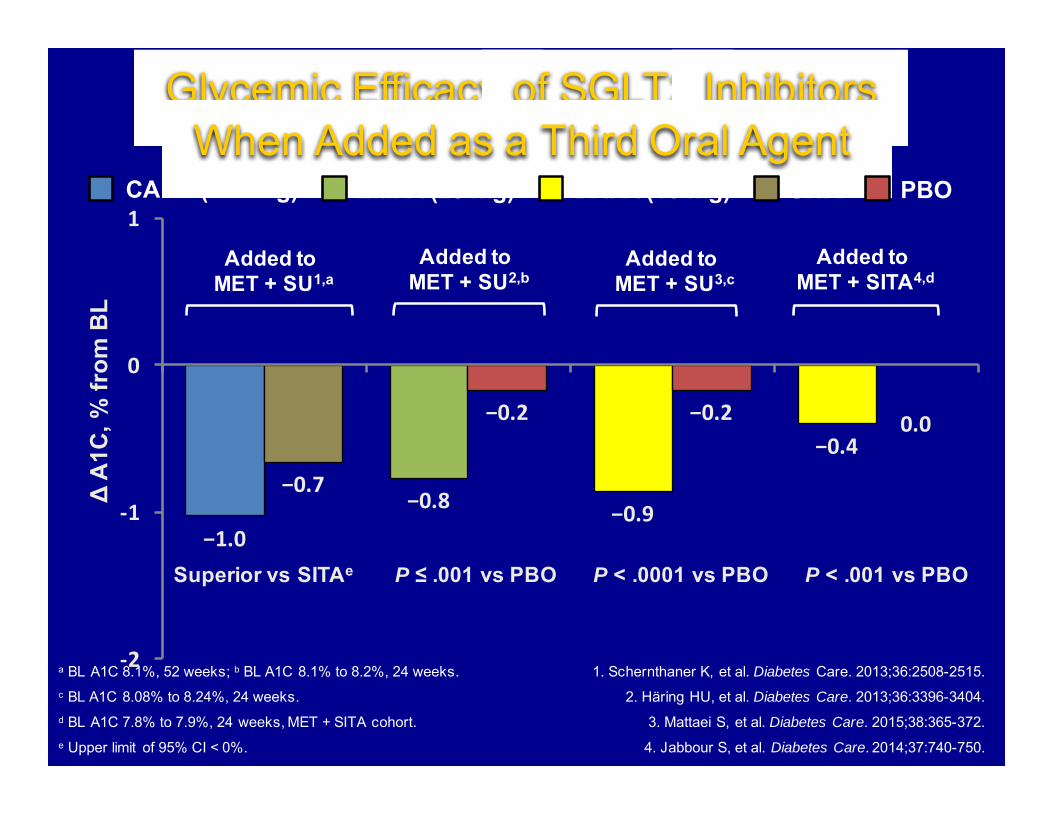
−1.0
−0.8 −0.9
−0.4
−0.7
−0.2 −0.2 0.0
‐2
‐1
0
1
Δ A
1C, %
from
BL
Glycemic Efficacy of SGLT2 InhibitorsWhen Added as a Third Oral Agent
a BL A1C 8.1%, 52 weeks; b BL A1C 8.1% to 8.2%, 24 weeks.c BL A1C 8.08% to 8.24%, 24 weeks.d BL A1C 7.8% to 7.9%, 24 weeks, MET + SITA cohort.e Upper limit of 95% CI < 0%.
1. Schernthaner K, et al. Diabetes Care. 2013;36:2508-2515.
2. Häring HU, et al. Diabetes Care. 2013;36:3396-3404.
3. Mattaei S, et al. Diabetes Care. 2015;38:365-372.
4. Jabbour S, et al. Diabetes Care. 2014;37:740-750.
Added to MET + SU1,a
Added to MET + SU2,b
Added to MET + SU3,c
Added to MET + SITA4,d
Superior vs SITAe P ≤ .001 vs PBO P < .001 vs PBOP < .0001 vs PBO
DAPA (10 mg) SITA PBOEMPA (25 mg)CANA (300 mg)
Adverse Events Oral Combination Therapy
Adverse Events Oral Combination Therapy
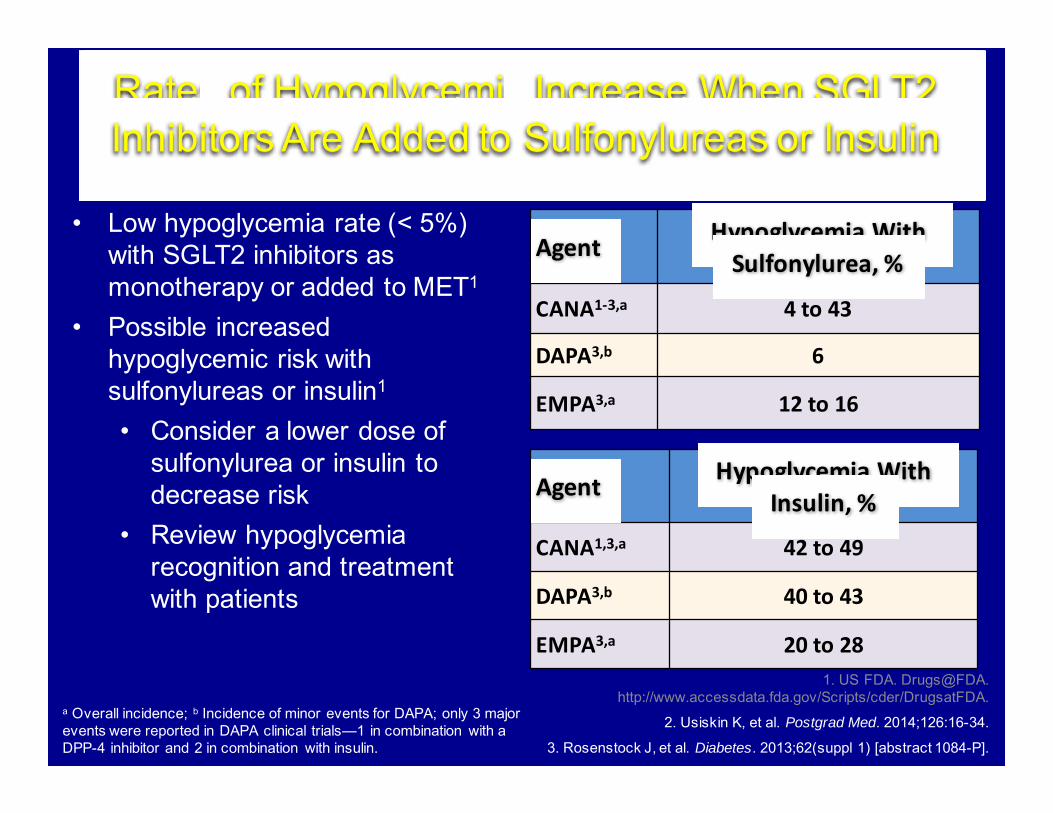
Rates of Hypoglycemia Increase When SGLT2 Inhibitors Are Added to Sulfonylureas or Insulin
a Overall incidence; b Incidence of minor events for DAPA; only 3 major events were reported in DAPA clinical trials—1 in combination with a DPP-4 inhibitor and 2 in combination with insulin.
1. US FDA. Drugs@FDA. http://www.accessdata.fda.gov/Scripts/cder/DrugsatFDA.
2. Usiskin K, et al. Postgrad Med. 2014;126:16-34.
3. Rosenstock J, et al. Diabetes. 2013;62(suppl 1) [abstract 1084-P].
Agent Hypoglycemia With Sulfonylurea, %
CANA1‐3,a 4 to 43
DAPA3,b 6
EMPA3,a 12 to 16
• Low hypoglycemia rate (< 5%) with SGLT2 inhibitors as monotherapy or added to MET1
• Possible increased hypoglycemic risk with sulfonylureas or insulin1
• Consider a lower dose of sulfonylurea or insulin to decrease risk
• Review hypoglycemia recognition and treatment with patients
Agent Hypoglycemia With Insulin, %
CANA1,3,a 42 to 49
DAPA3,b 40 to 43
EMPA3,a 20 to 28
−0.8 −0.9
−1.5
−1.0
−1.5 −1.42
−1.1
−1.6
−1.3
−0.8−1.0
−1.36
‐2
‐1
0
1
ΔA1
C, %
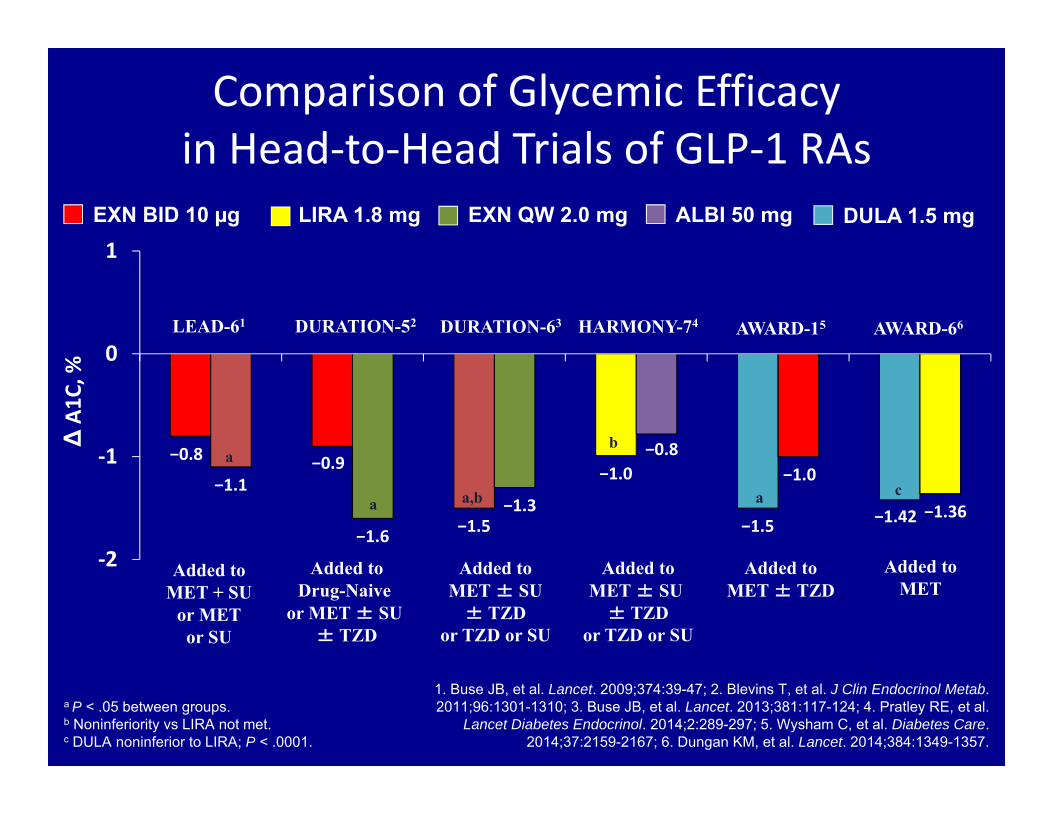
Comparison of Glycemic Efficacy in Head‐to‐Head Trials of GLP‐1 RAs
a P < .05 between groups.b Noninferiority vs LIRA not met.c DULA noninferior to LIRA; P < .0001.
1. Buse JB, et al. Lancet. 2009;374:39-47; 2. Blevins T, et al. J Clin Endocrinol Metab. 2011;96:1301-1310; 3. Buse JB, et al. Lancet. 2013;381:117-124; 4. Pratley RE, et al.
Lancet Diabetes Endocrinol. 2014;2:289-297; 5. Wysham C, et al. Diabetes Care. 2014;37:2159-2167; 6. Dungan KM, et al. Lancet. 2014;384:1349-1357.
a
ab
a,b
DURATION-52LEAD-61 DURATION-63 HARMONY-74 AWARD-15 AWARD-66
a c
EXN BID 10 µg LIRA 1.8 mg EXN QW 2.0 mg ALBI 50 mg DULA 1.5 mg
Added toMET + SU
or METor SU
Added toDrug-Naive
or MET ± SU ± TZD
Added toMET ± SU ± TZD
or TZD or SU
Added toMET ± SU
± TZDor TZD or SU
Added toMET ± TZD
Added toMET
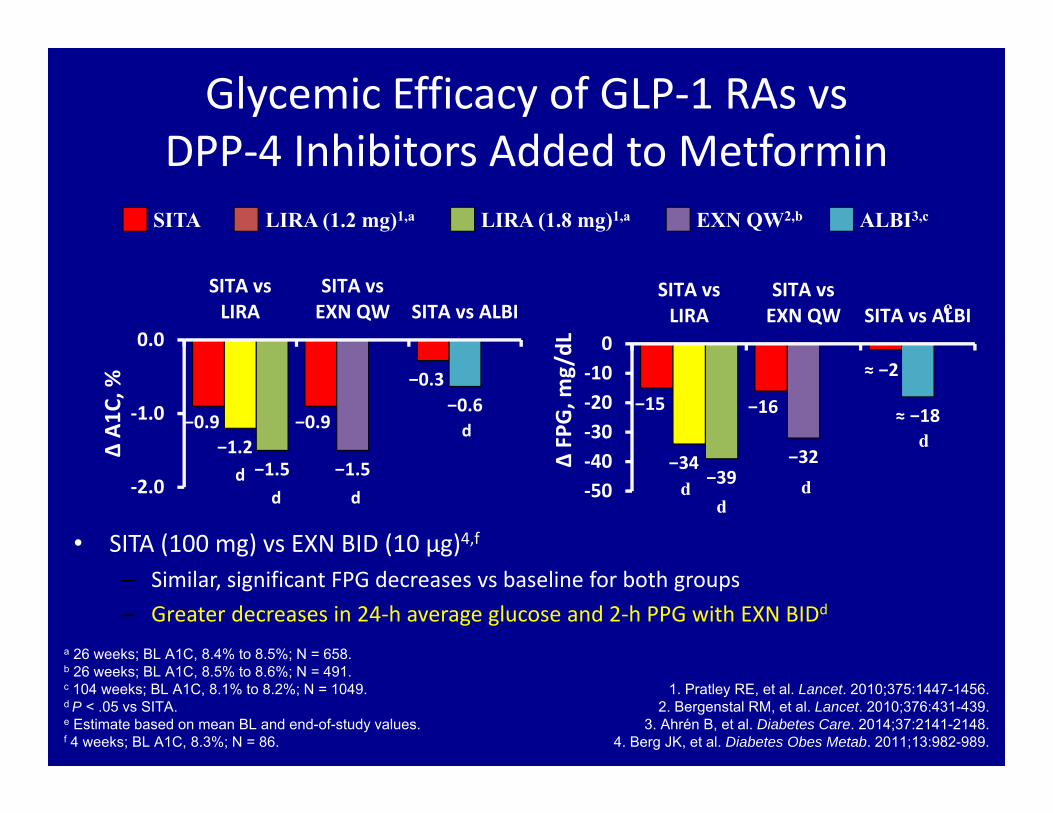
Glycemic Efficacy of GLP‐1 RAs vs DPP‐4 Inhibitors Added to Metformin
a 26 weeks; BL A1C, 8.4% to 8.5%; N = 658.b 26 weeks; BL A1C, 8.5% to 8.6%; N = 491.c 104 weeks; BL A1C, 8.1% to 8.2%; N = 1049.d P < .05 vs SITA.e Estimate based on mean BL and end-of-study values.f 4 weeks; BL A1C, 8.3%; N = 86.
1. Pratley RE, et al. Lancet. 2010;375:1447-1456. 2. Bergenstal RM, et al. Lancet. 2010;376:431-439.
3. Ahrén B, et al. Diabetes Care. 2014;37:2141-2148. 4. Berg JK, et al. Diabetes Obes Metab. 2011;13:982-989.
• SITA (100 mg) vs EXN BID (10 µg)4,f
– Similar, significant FPG decreases vs baseline for both groups– Greater decreases in 24‐h average glucose and 2‐h PPG with EXN BIDd
−15 −16
≈ −2
−34 −32
≈ −18
−39‐50‐40‐30‐20‐100
SITA vsLIRA
SITA vsEXN QW SITA vs ALBI
Δ FP
G, m
g/dL
dd
d−0.9 −0.9
−0.3
−1.2−1.5
−0.6
−1.5‐2.0
‐1.0
0.0
SITA vsLIRA
SITA vsEXN QW SITA vs ALBI
Δ A1
C, %
dd d
SITA LIRA (1.8 mg)1,aLIRA (1.2 mg)1,a EXN QW2,b ALBI3,c
d
d
e
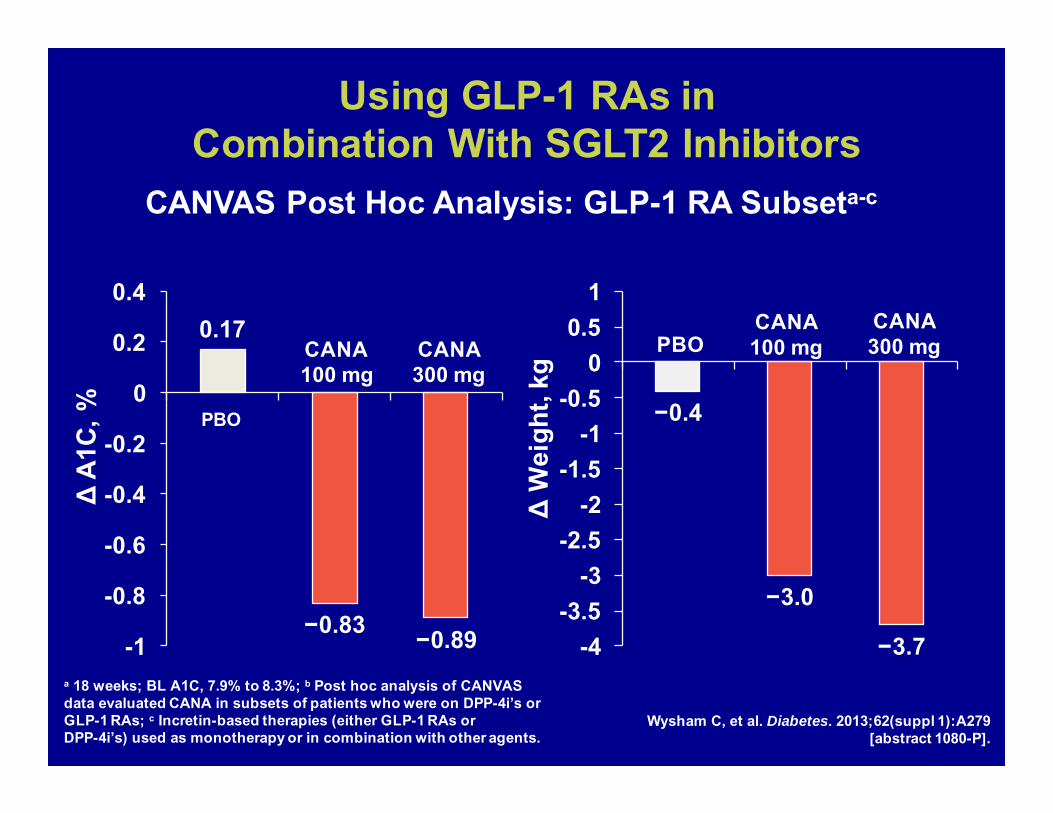
Using GLP-1 RAs in Combination With SGLT2 Inhibitors
ΔA1
C, %
0.17
−0.83 −0.89-1
-0.8
-0.6
-0.4
-0.2
0
0.2
0.4
ΔW
eigh
t, kg
−0.4
−3.0
−3.7-4-3.5
-3-2.5
-2-1.5
-1-0.5
00.5
1
a 18 weeks; BL A1C, 7.9% to 8.3%; b Post hoc analysis of CANVAS data evaluated CANA in subsets of patients who were on DPP-4i’s or GLP-1 RAs; c Incretin-based therapies (either GLP-1 RAs or DPP-4i’s) used as monotherapy or in combination with other agents.
Wysham C, et al. Diabetes. 2013;62(suppl 1):A279 [abstract 1080-P].
CANA 100 mg
CANA300 mgCANA
300 mg
PBO
PBOCANA100 mg
CANVAS Post Hoc Analysis: GLP-1 RA Subseta-c
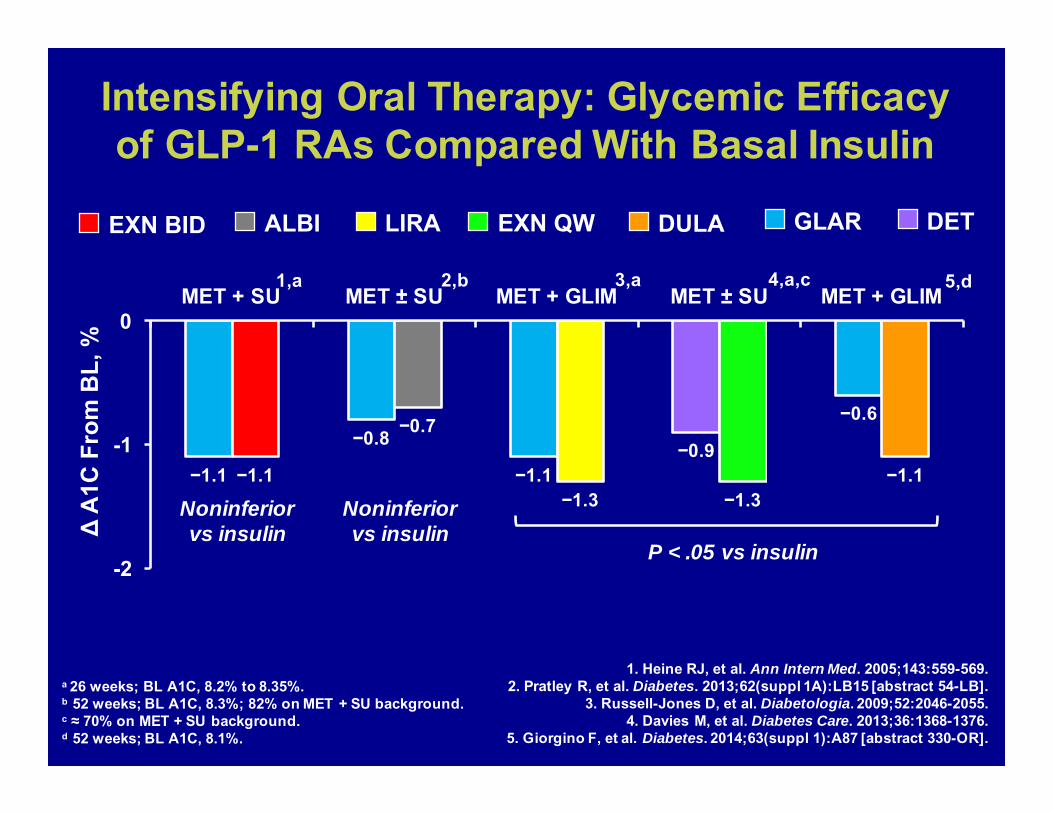
Intensifying Oral Therapy: Glycemic Efficacy of GLP-1 RAs Compared With Basal Insulin
a 26 weeks; BL A1C, 8.2% to 8.35%.b 52 weeks; BL A1C, 8.3%; 82% on MET + SU background.c ≈ 70% on MET + SU background.d 52 weeks; BL A1C, 8.1%.
1. Heine RJ, et al. Ann Intern Med. 2005;143:559-569.2. Pratley R, et al. Diabetes. 2013;62(suppl 1A):LB15 [abstract 54-LB].
3. Russell-Jones D, et al. Diabetologia. 2009;52:2046-2055.4. Davies M, et al. Diabetes Care. 2013;36:1368-1376.
5. Giorgino F, et al. Diabetes. 2014;63(suppl 1):A87 [abstract 330-OR].
−1.1
−0.8
−1.1−0.9
−0.6
−1.1
−0.7
−1.3 −1.3−1.1
-2
-1
0MET + SU MET ± SU MET + GLIM MET ± SU MET + GLIM
ΔA
1C F
rom
BL,
%
1,a 2,b 3,a
Noninferiorvs insulin
4,a,c
P < .05 vs insulin
5,d
DULAEXN BID LIRA EXN QW DETGLARALBI
Noninferiorvs insulin
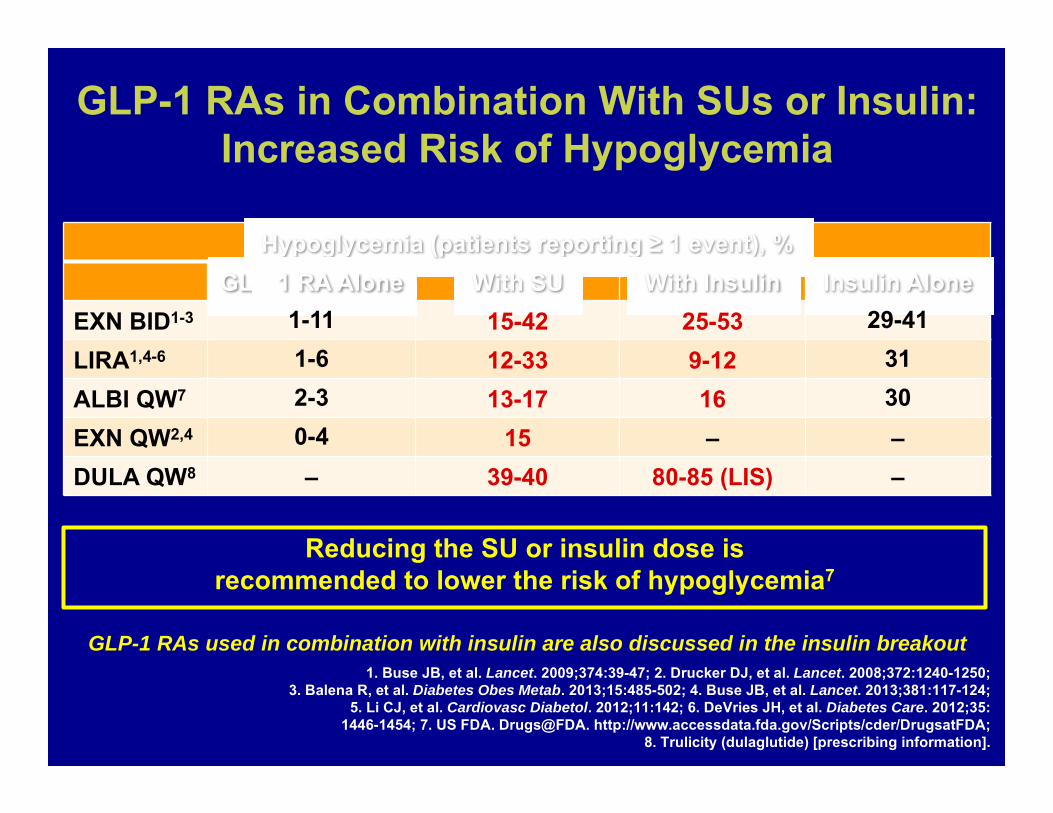
GLP-1 RAs in Combination With SUs or Insulin: Increased Risk of Hypoglycemia
Hypoglycemia (patients reporting ≥ 1 event), %GLP-1 RA Alone With SU With Insulin Insulin Alone
EXN BID1-3 1-11 15-42 25-53 29-41LIRA1,4-6 1-6 12-33 9-12 31ALBI QW7 2-3 13-17 16 30EXN QW2,4 0-4 15 – –DULA QW8 – 39-40 80-85 (LIS) –
1. Buse JB, et al. Lancet. 2009;374:39-47; 2. Drucker DJ, et al. Lancet. 2008;372:1240-1250; 3. Balena R, et al. Diabetes Obes Metab. 2013;15:485-502; 4. Buse JB, et al. Lancet. 2013;381:117-124;
5. Li CJ, et al. Cardiovasc Diabetol. 2012;11:142; 6. DeVries JH, et al. Diabetes Care. 2012;35:1446-1454; 7. US FDA. Drugs@FDA. http://www.accessdata.fda.gov/Scripts/cder/DrugsatFDA;
8. Trulicity (dulaglutide) [prescribing information].
Reducing the SU or insulin dose is recommended to lower the risk of hypoglycemia7
GLP-1 RAs used in combination with insulin are also discussed in the insulin breakout
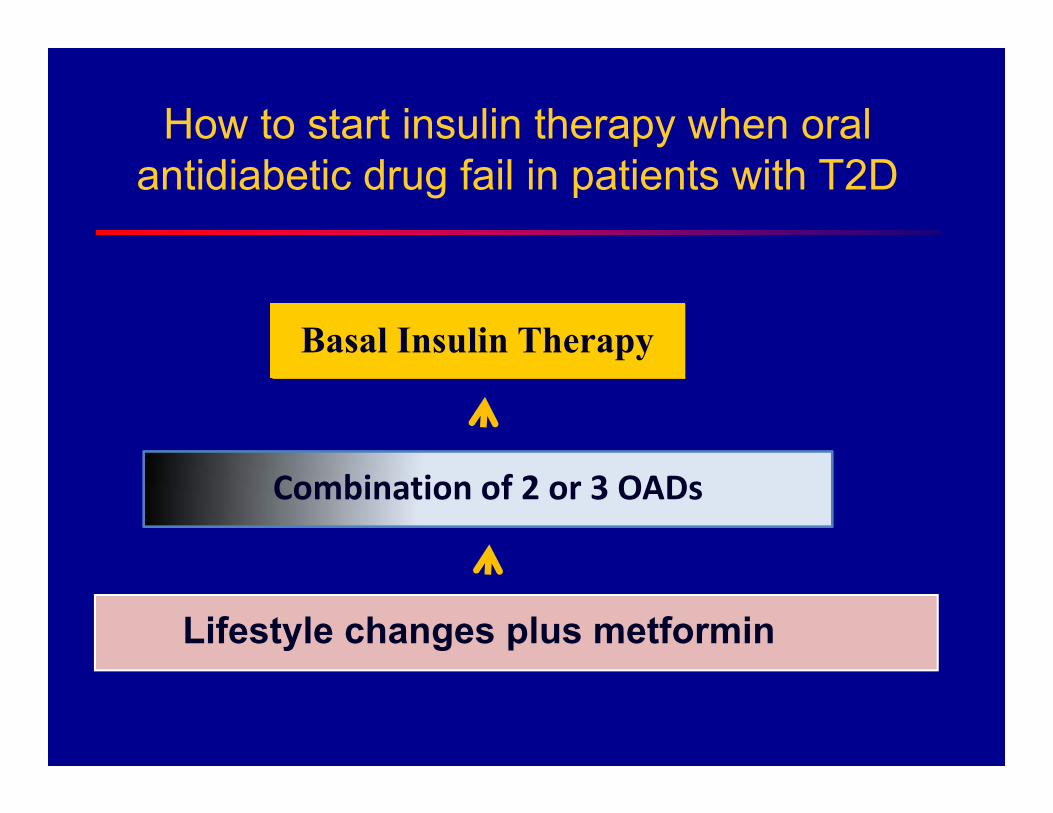
Combination of 2 or 3 OADs
Lifestyle changes plus metformin
How to start insulin therapy when oral antidiabetic drug fail in patients with T2D
Basal Insulin Therapy
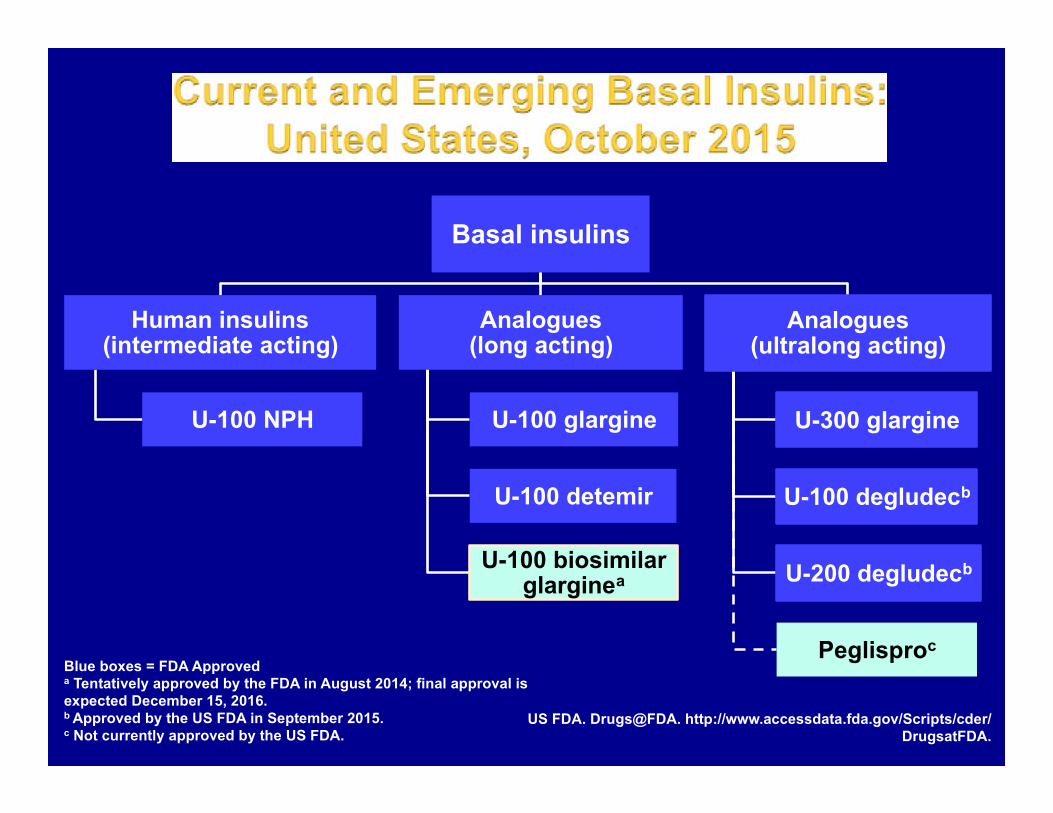
US FDA. Drugs@FDA. http://www.accessdata.fda.gov/Scripts/cder/DrugsatFDA.
Basal insulins
Human insulins (intermediate acting)
U-100 NPH
Analogues (long acting)
U-100 glargine
U-100 detemir
U-100 biosimilar glarginea
Analogues (ultralong acting)
U-300 glargine
U-100 degludecb
U-200 degludecb
Peglisproc Blue boxes = FDA Approved a Tentatively approved by the FDA in August 2014; final approval is expected December 15, 2016. b Approved by the US FDA in September 2015. c Not currently approved by the US FDA.
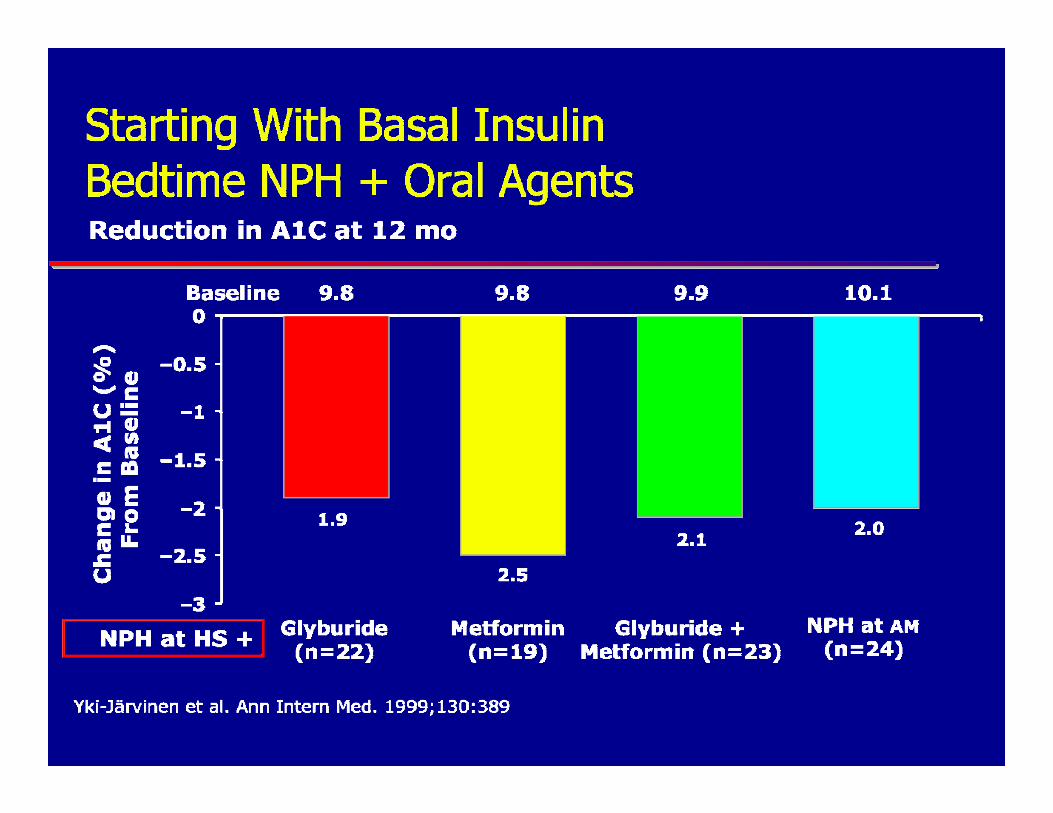
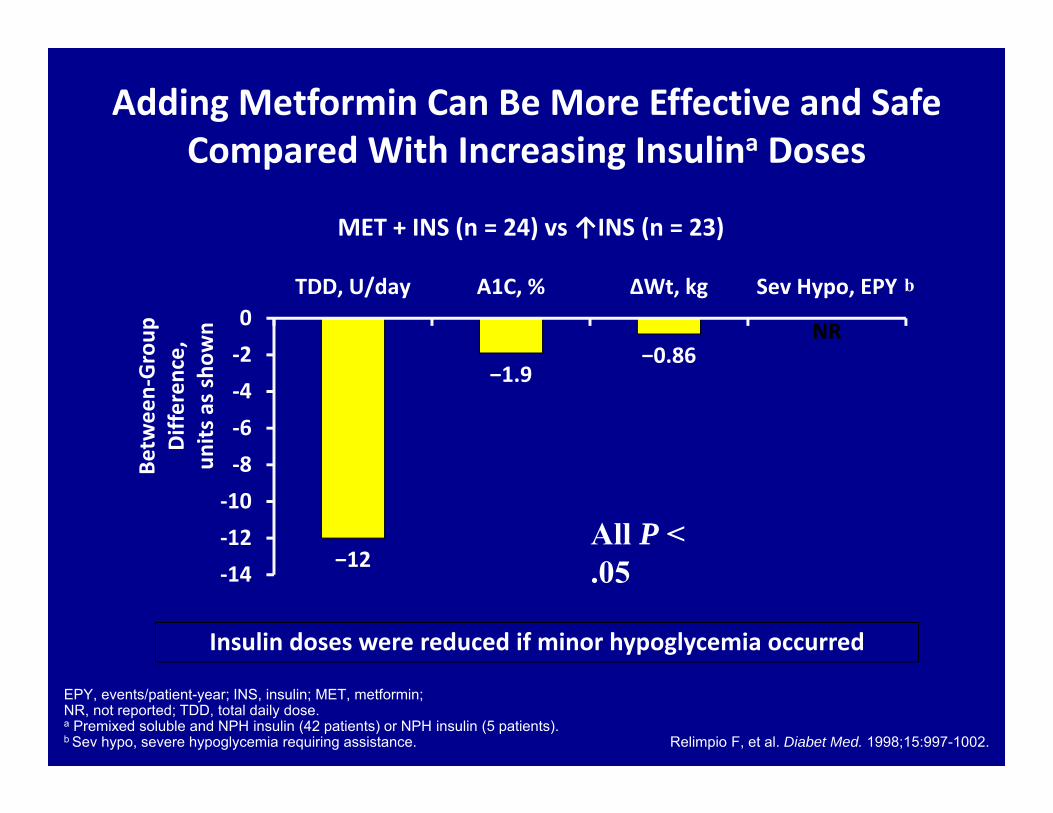
Adding Metformin Can Be More Effective and Safe Compared With Increasing Insulina Doses
EPY, events/patient-year; INS, insulin; MET, metformin; NR, not reported; TDD, total daily dose.a Premixed soluble and NPH insulin (42 patients) or NPH insulin (5 patients).b Sev hypo, severe hypoglycemia requiring assistance. Relimpio F, et al. Diabet Med. 1998;15:997-1002.
MET + INS (n = 24) vs ↑INS (n = 23)
−12
−1.9−0.86
NR
‐14‐12‐10‐8‐6‐4‐20
TDD, U/day A1C, % ΔWt, kg Sev Hypo, EPY
Betw
een‐Group
Differen
ce,
units
as s
hown
All P < .05
b
Insulin doses were reduced if minor hypoglycemia occurred
Barnett et al. Clin Drug Investig (2013) 33:707–717
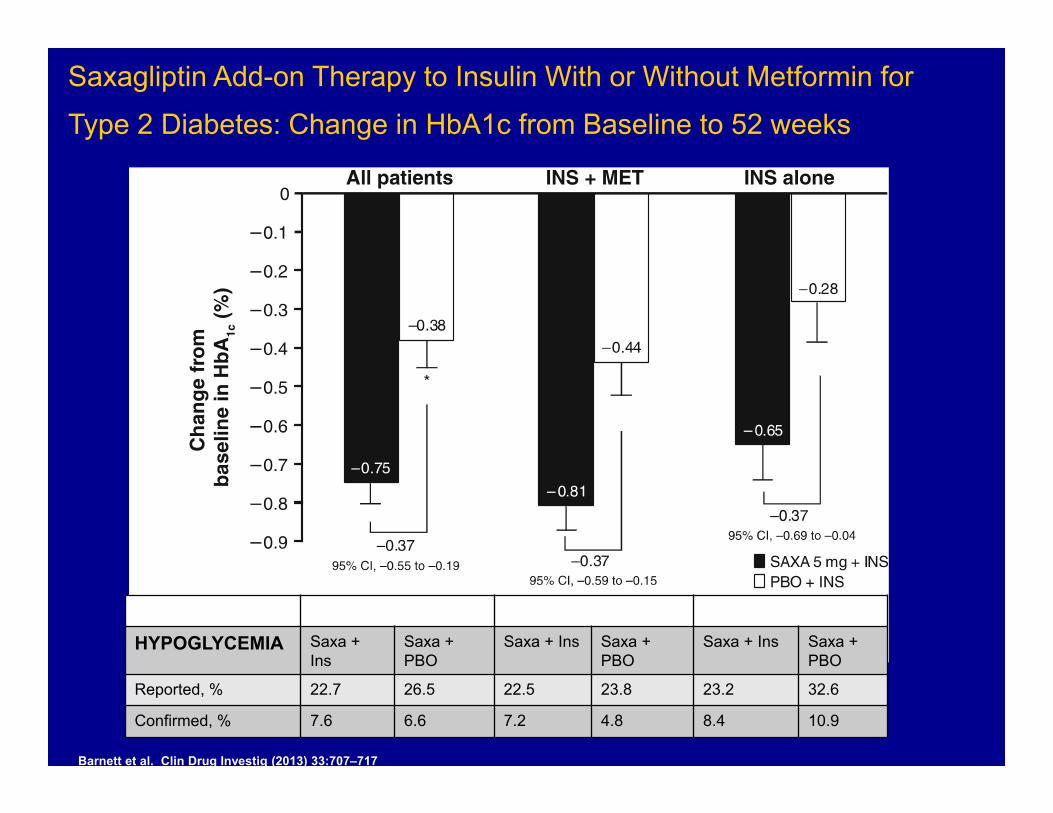
Saxagliptin Add-on Therapy to Insulin With or Without Metformin for Type 2 Diabetes: Change in HbA1c from Baseline to 52 weeks
All Patients Insulin + Metformin Insulin lone
HYPOGLYCEMIA Saxa + Ins
Saxa + PBO
Saxa + Ins Saxa + PBO
Saxa + Ins Saxa + PBO
Reported, % 22.7 26.5 22.5 23.8 23.2 32.6
Confirmed, % 7.6 6.6 7.2 4.8 8.4 10.9
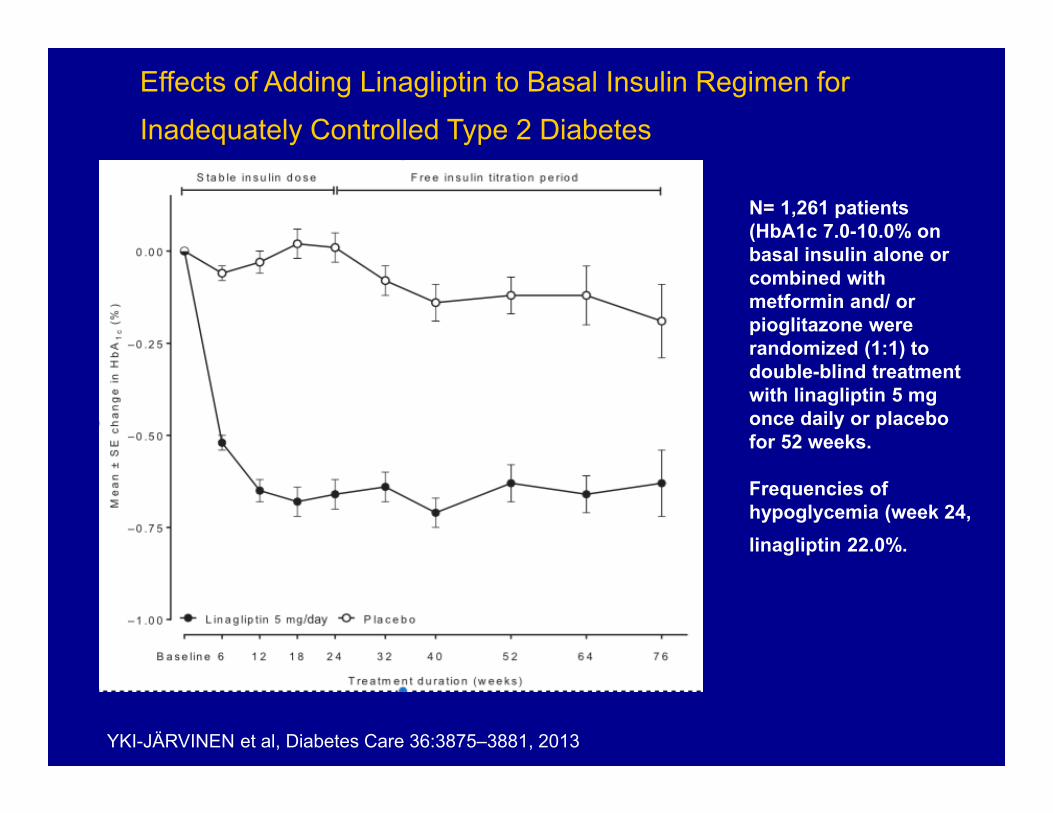
Effects of Adding Linagliptin to Basal Insulin Regimen for Inadequately Controlled Type 2 Diabetes
YKI-JÄRVINEN et al, Diabetes Care 36:3875–3881, 2013
N= 1,261 patients (HbA1c 7.0-10.0% on basal insulin alone or combined with metformin and/ or pioglitazone were randomized (1:1) to double-blind treatment with linagliptin 5 mg once daily or placebo for 52 weeks.
Frequencies of hypoglycemia (week 24, linagliptin 22.0%.
Placebo
Linagliptin
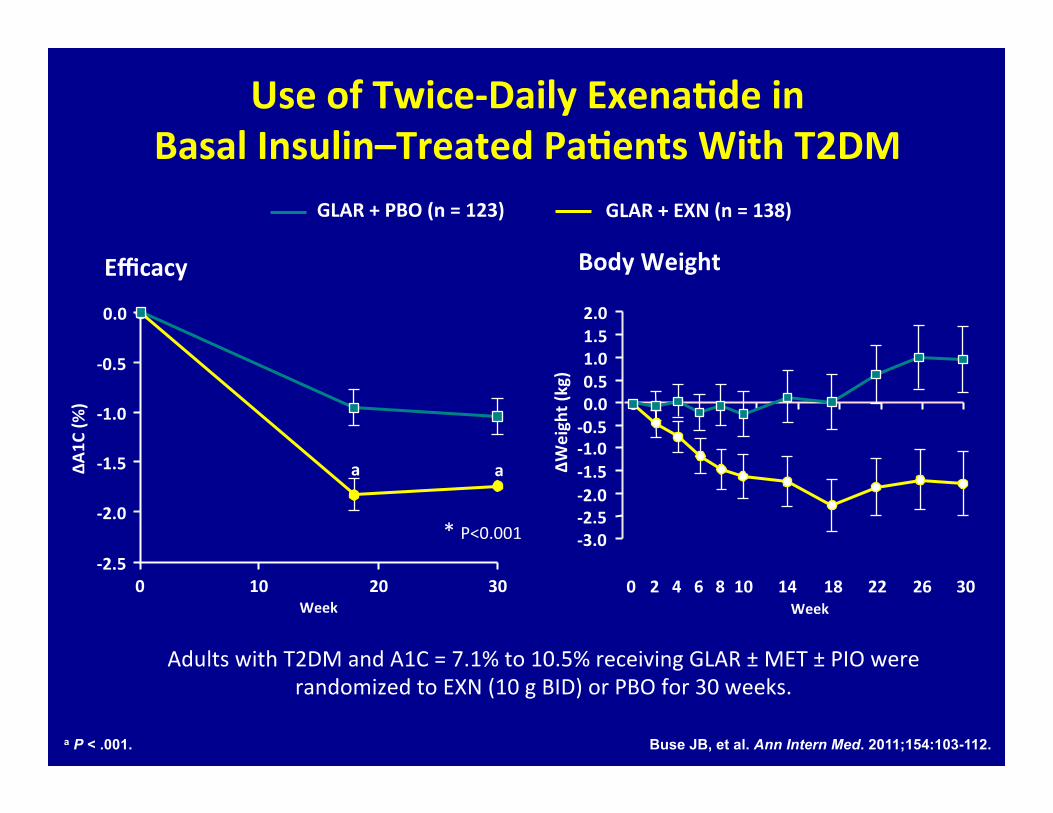
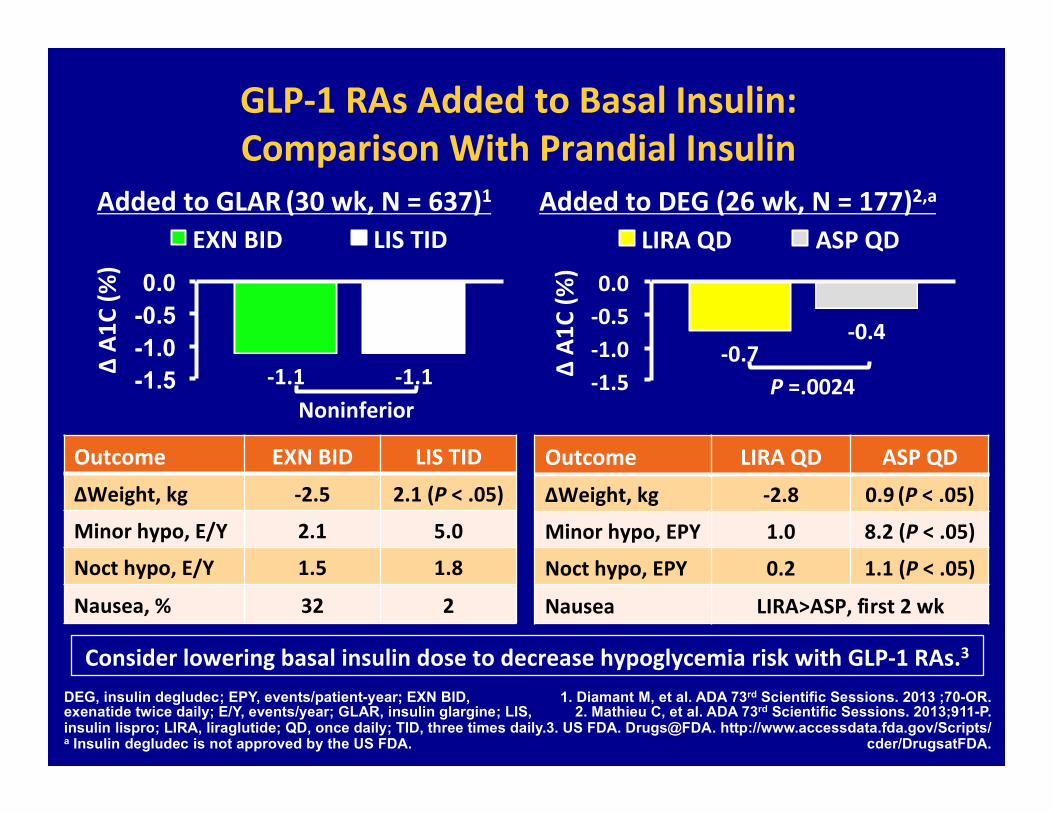
GLP‐1 RAs Added to Basal Insulin: Comparison With Prandial Insulin
‐1.1 ‐1.1 -1.5 -1.0 -0.5 0.0
∆ A1
C (%
)
EXN BID LIS TID
‐0.7 ‐0.4
‐1.5 ‐1.0 ‐0.5 0.0
∆ A1
C (%
)
LIRA QD ASP QD
DEG, insulin degludec; EPY, events/patient-year; EXN BID, exenatide twice daily; E/Y, events/year; GLAR, insulin glargine; LIS, insulin lispro; LIRA, liraglutide; QD, once daily; TID, three times daily. a Insulin degludec is not approved by the US FDA.
1. Diamant M, et al. ADA 73rd Scientific Sessions. 2013 ;70-OR. 2. Mathieu C, et al. ADA 73rd Scientific Sessions. 2013;911-P.
3. US FDA. Drugs@FDA. http://www.accessdata.fda.gov/Scripts/cder/DrugsatFDA.
Added to GLAR (30 wk, N = 637)1 Added to DEG (26 wk, N = 177)2,a
Noninferior P =.0024
Outcome EXN BID LIS TID ΔWeight, kg ‐2.5 2.1 (P < .05)
Minor hypo, E/Y 2.1 5.0
Noct hypo, E/Y 1.5 1.8
Nausea, % 32 2
Outcome LIRA QD ASP QD ΔWeight, kg ‐2.8 0.9 (P < .05)
Minor hypo, EPY 1.0 8.2 (P < .05)
Noct hypo, EPY 0.2 1.1 (P < .05)
Nausea LIRA>ASP, first 2 wk
Consider lowering basal insulin dose to decrease hypoglycemia risk with GLP‐1 RAs.3
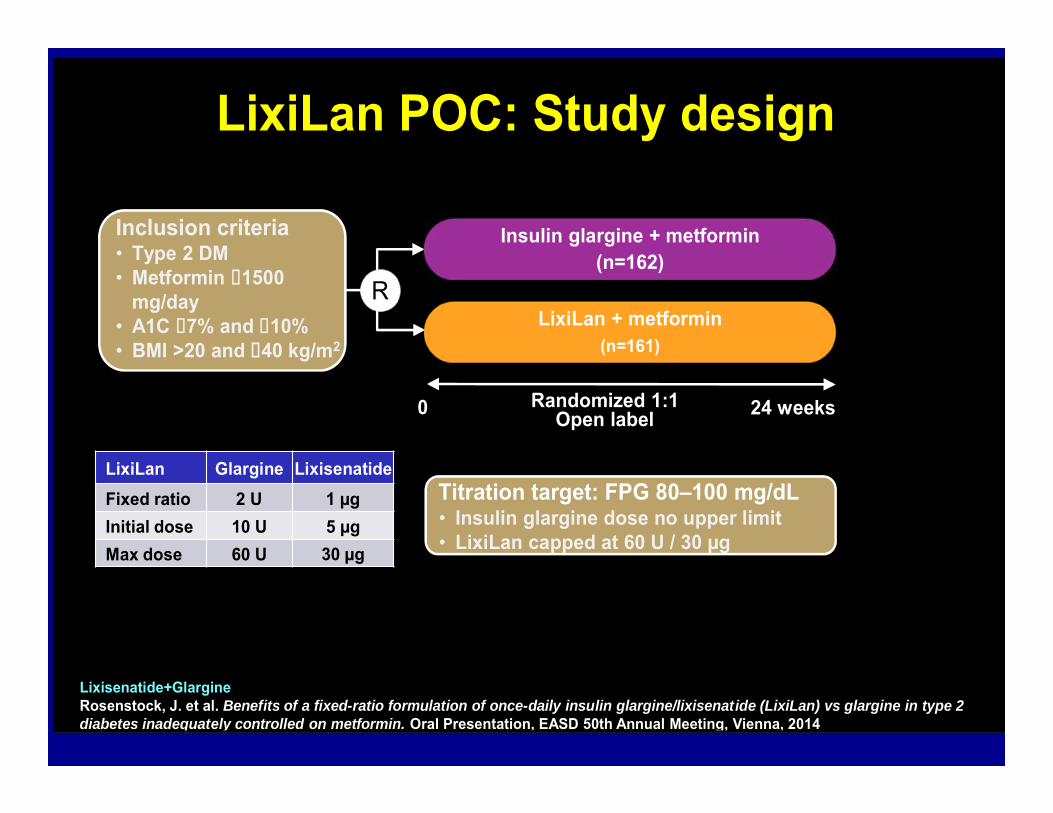
Insulin glargine + metformin(n=162)
LixiLan + metformin(n=161)
0 Randomized 1:1Open label 24 weeks
Titration target: FPG 80–100 mg/dL• Insulin glargine dose no upper limit• LixiLan capped at 60 U / 30 µg
LixiLan Glargine LixisenatideFixed ratio 2 U 1 µgInitial dose 10 U 5 µgMax dose 60 U 30 µg
Inclusion criteria• Type 2 DM • Metformin 1500
mg/day• A1C 7% and 10%• BMI >20 and 40 kg/m2
R
LixiLan POC: Study design
Lixisenatide+GlargineRosenstock, J. et al. Benefits of a fixed-ratio formulation of once-daily insulin glargine/lixisenatide (LixiLan) vs glargine in type 2 diabetes inadequately controlled on metformin. Oral Presentation, EASD 50th Annual Meeting, Vienna, 2014
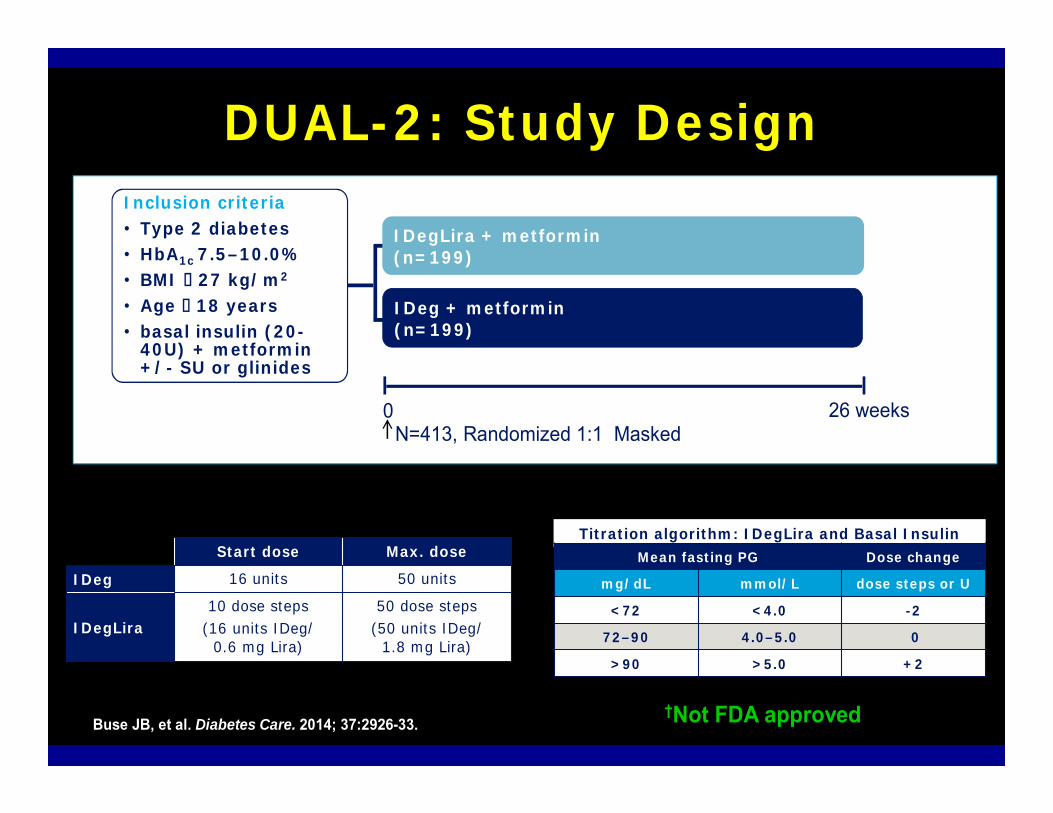
DUAL-2: Study Design
0 26 weeksN=413, Randomized 1:1 Masked
Titration algorithm: IDegLira and Basal Insulin Mean fasting PG Dose change
mg/dL mmol/L dose steps or U
<72 <4.0 -2
72–90 4.0–5.0 0
>90 >5.0 +2
†Not FDA approved
Start dose Max. dose
IDeg 16 units 50 units
IDegLira10 dose steps
(16 units IDeg/0.6 mg Lira)
50 dose steps(50 units IDeg/
1.8 mg Lira)
Patients with type 2 diabetes
(N=398) IDeg + metformin(n=199)
IDegLira + metformin(n=199)
Inclusion criteria• Type 2 diabetes• HbA1c 7.5–10.0%• BMI 27 kg/m2
• Age 18 years• basal insulin (20-
40U) + metformin +/- SU or glinidesU
Buse JB, et al. Diabetes Care. 2014; 37:2926-33.
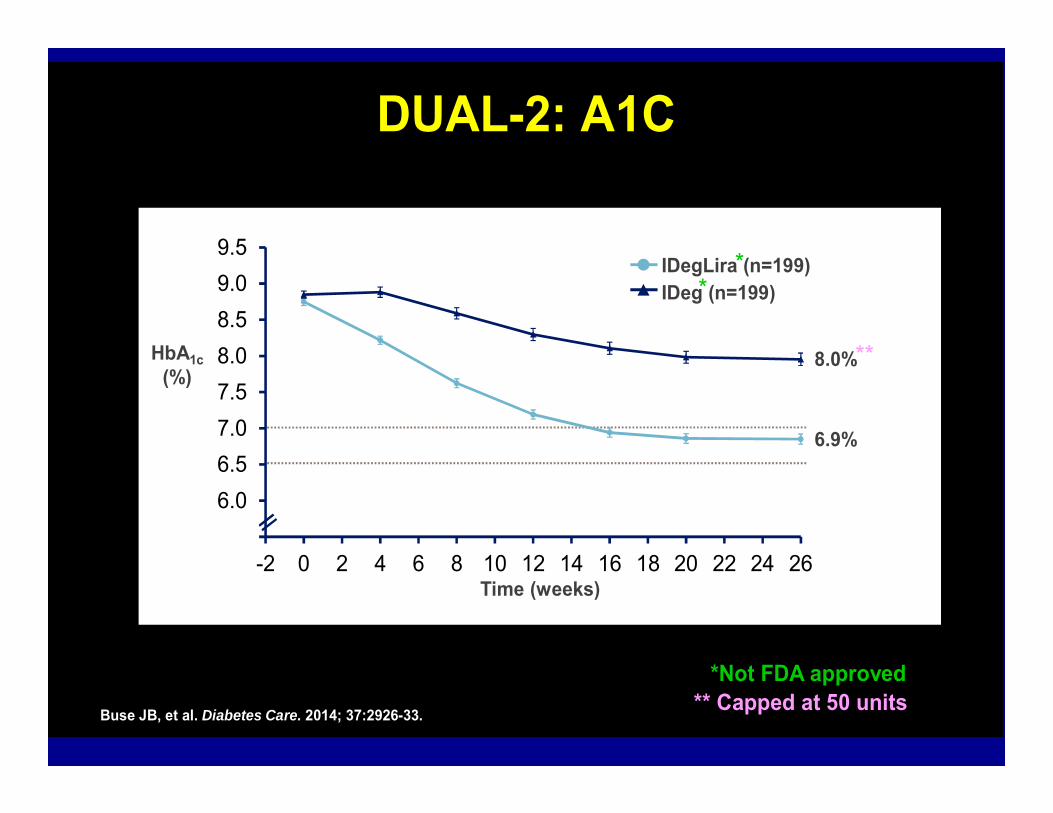
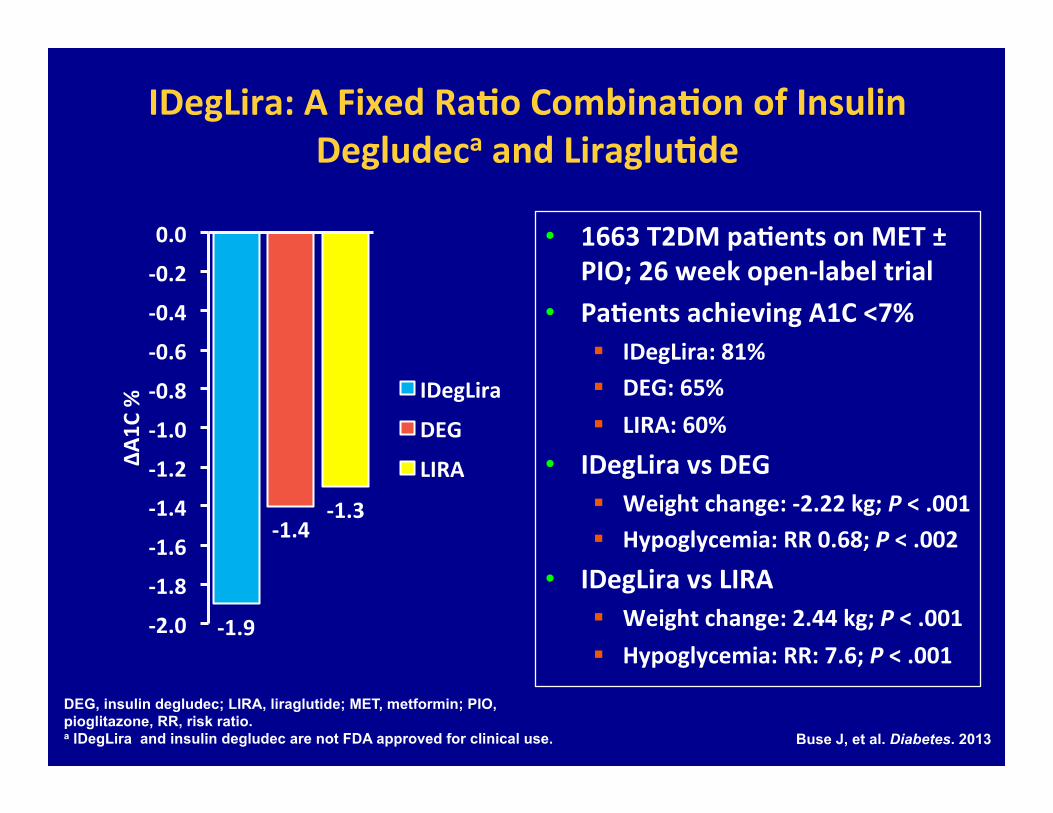
IDegLira (n=199)IDeg (n=199)
Time (weeks)
HbA1c(%)
0.0
8.0%
6.9%
5.56.06.57.07.58.08.59.09.5
-2 0 2 4 6 8 10 12 14 16 18 20 22 24 26
DUAL-2: A1C
Buse JB, et al. Diabetes Care. 2014; 37:2926-33.
*Not FDA approved
**
**
** Capped at 50 units
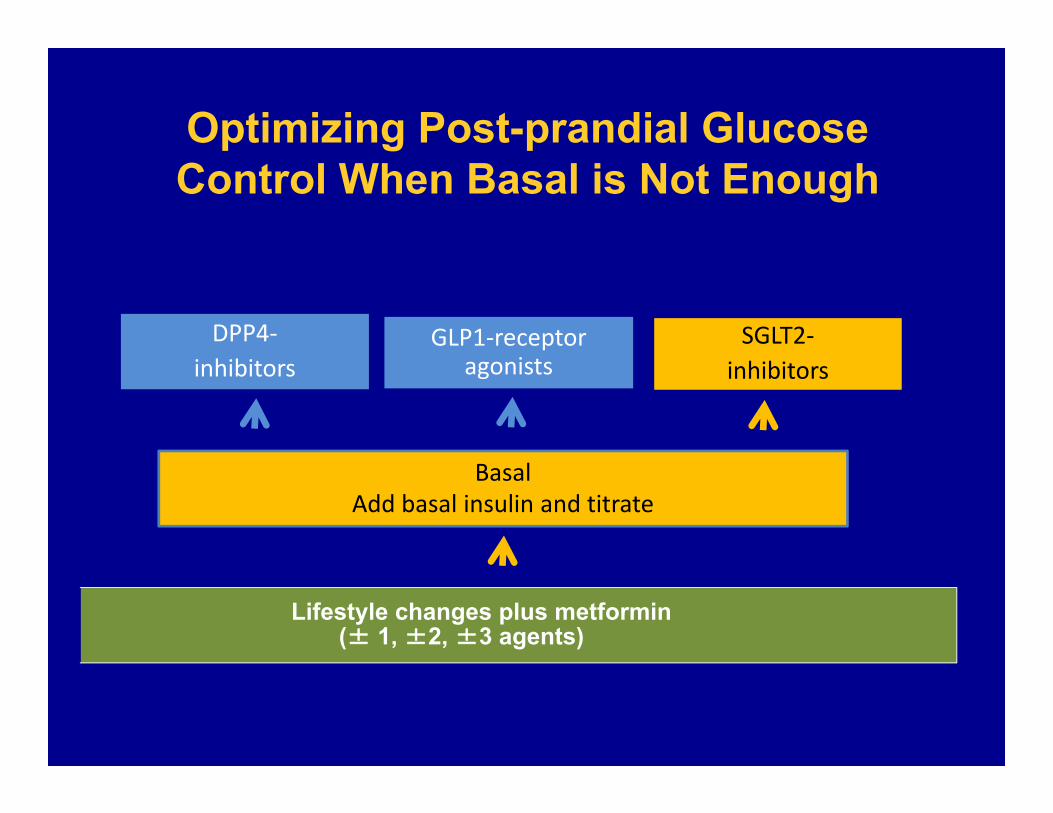
DPP4‐inhibitors
SGLT2‐inhibitors
BasalAdd basal insulin and titrate
Lifestyle changes plus metformin(± 1, ±2, ±3 agents)
Optimizing Post-prandial Glucose Control When Basal is Not Enough
GLP1‐receptor agonists
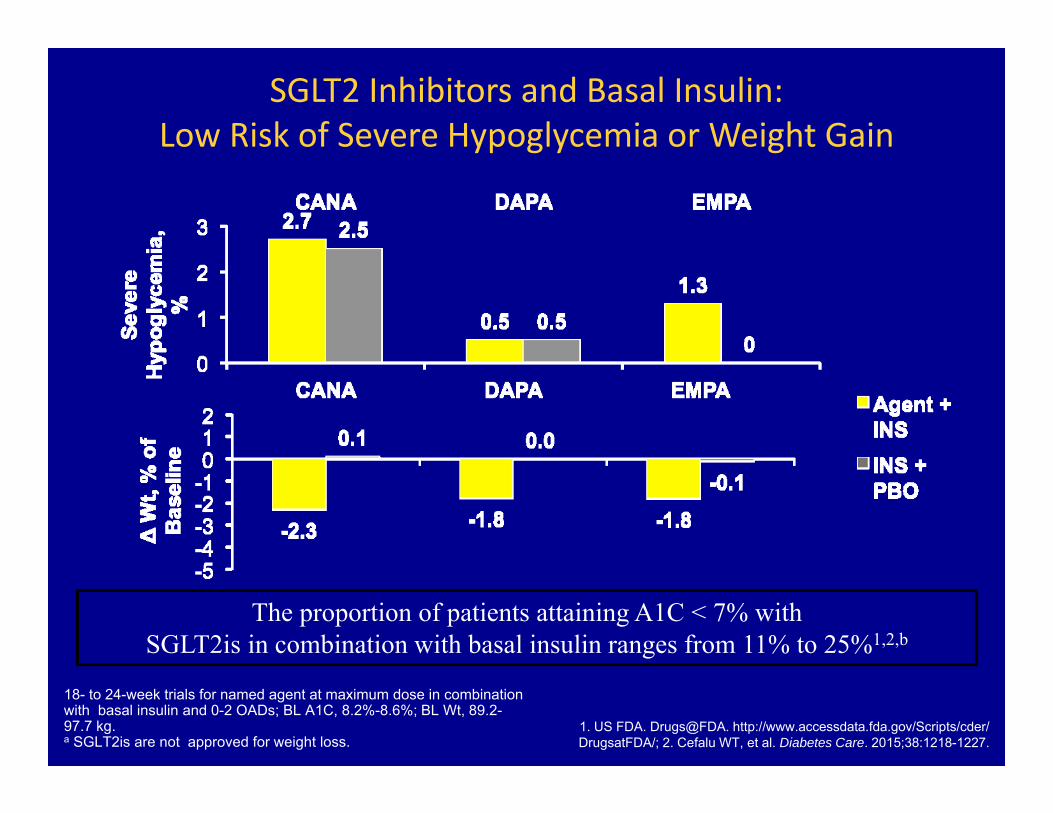
SGLT2 Inhibitors and Basal Insulin: Low Risk of Severe Hypoglycemia or Weight Gain
18- to 24-week trials for named agent at maximum dose in combination with basal insulin and 0-2 OADs; BL A1C, 8.2%-8.6%; BL Wt, 89.2-97.7 kg. a SGLT2is are not approved for weight loss.
1. US FDA. Drugs@FDA. http://www.accessdata.fda.gov/Scripts/cder/ DrugsatFDA/; 2. Cefalu WT, et al. Diabetes Care. 2015;38:1218-1227.
The proportion of patients attaining A1C < 7% with SGLT2is in combination with basal insulin ranges from 11% to 25%1,2,b
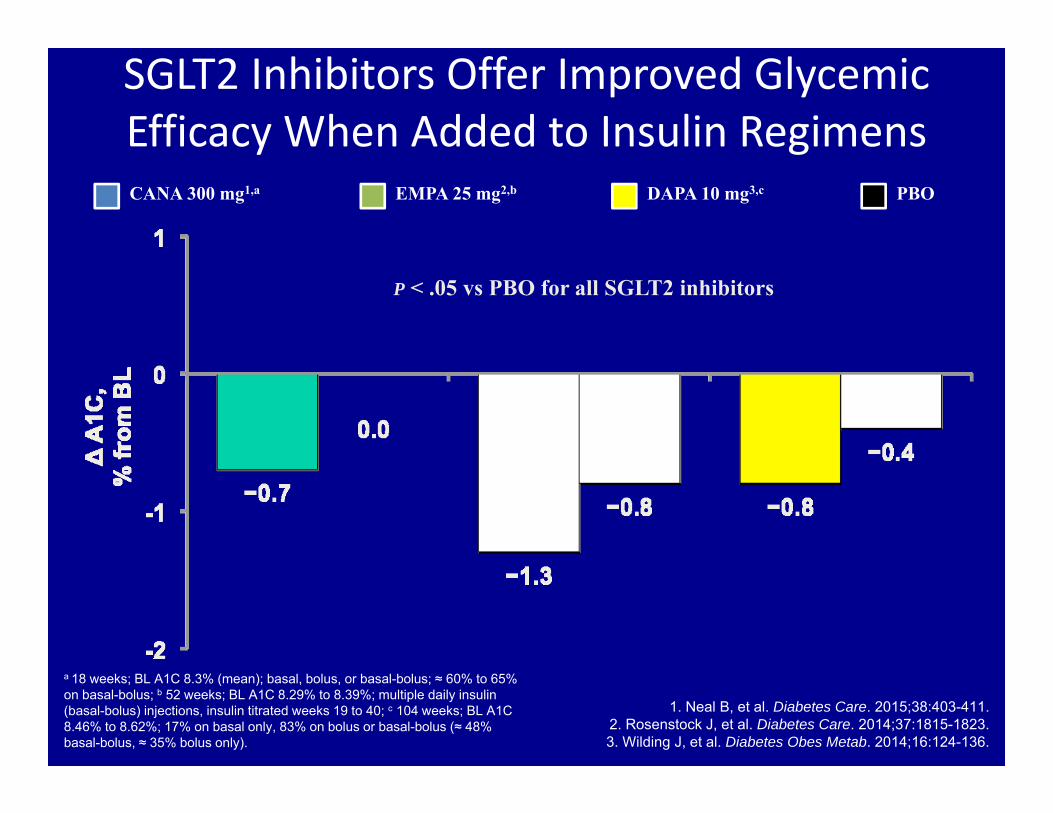
SGLT2 Inhibitors Offer Improved Glycemic Efficacy When Added to Insulin Regimens
a 18 weeks; BL A1C 8.3% (mean); basal, bolus, or basal-bolus; ≈ 60% to 65% on basal-bolus; b 52 weeks; BL A1C 8.29% to 8.39%; multiple daily insulin (basal-bolus) injections, insulin titrated weeks 19 to 40; c 104 weeks; BL A1C 8.46% to 8.62%; 17% on basal only, 83% on bolus or basal-bolus (≈ 48% basal-bolus, ≈ 35% bolus only).
1. Neal B, et al. Diabetes Care. 2015;38:403-411. 2. Rosenstock J, et al. Diabetes Care. 2014;37:1815-1823. 3. Wilding J, et al. Diabetes Obes Metab. 2014;16:124-136.
CANA 300 mg1,a DAPA 10 mg3,c PBOEMPA 25 mg2,b
P < .05 vs PBO for all SGLT2 inhibitors
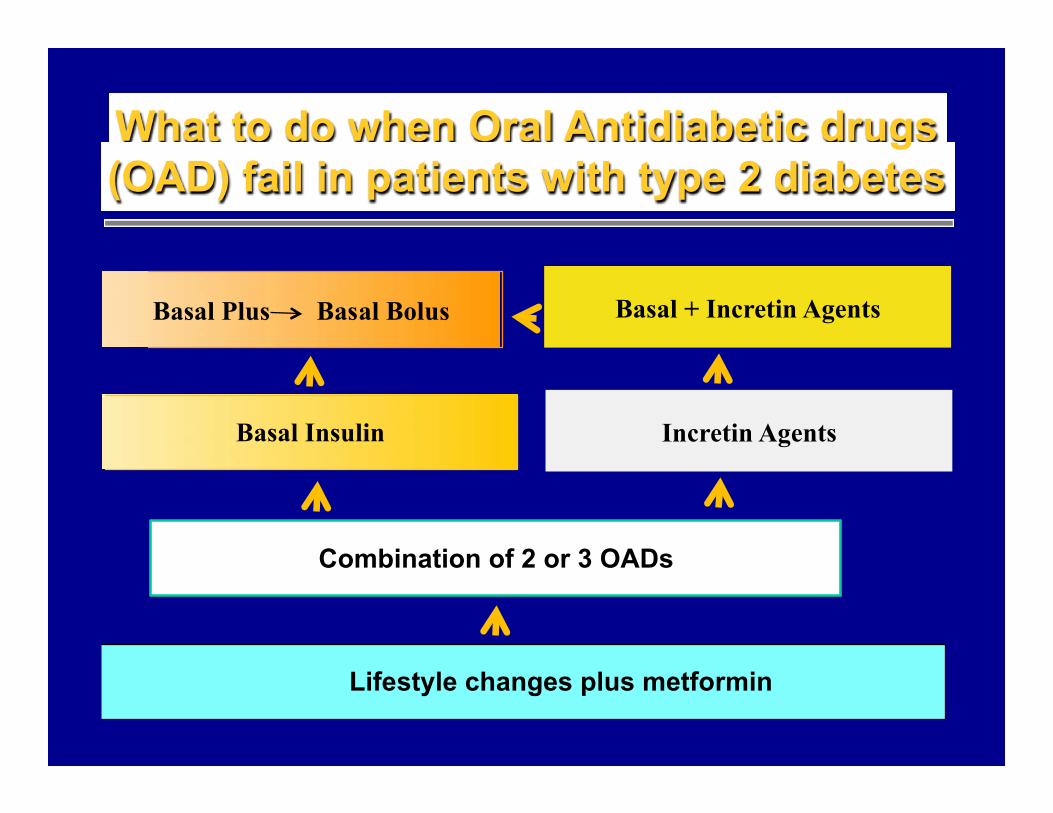
Combination of 2 or 3 OADs
Lifestyle changes plus metformin
What to do when Oral Antidiabetic drugs (OAD) fail in patients with type 2 diabetes
Incretin Agents
Basal Plus Basal Bolus
Basal Insulin
Basal + Incretin Agents