Nuclear-structure and nuclear-astrophysics experiments · PDF fileNuclear-structure and...
38
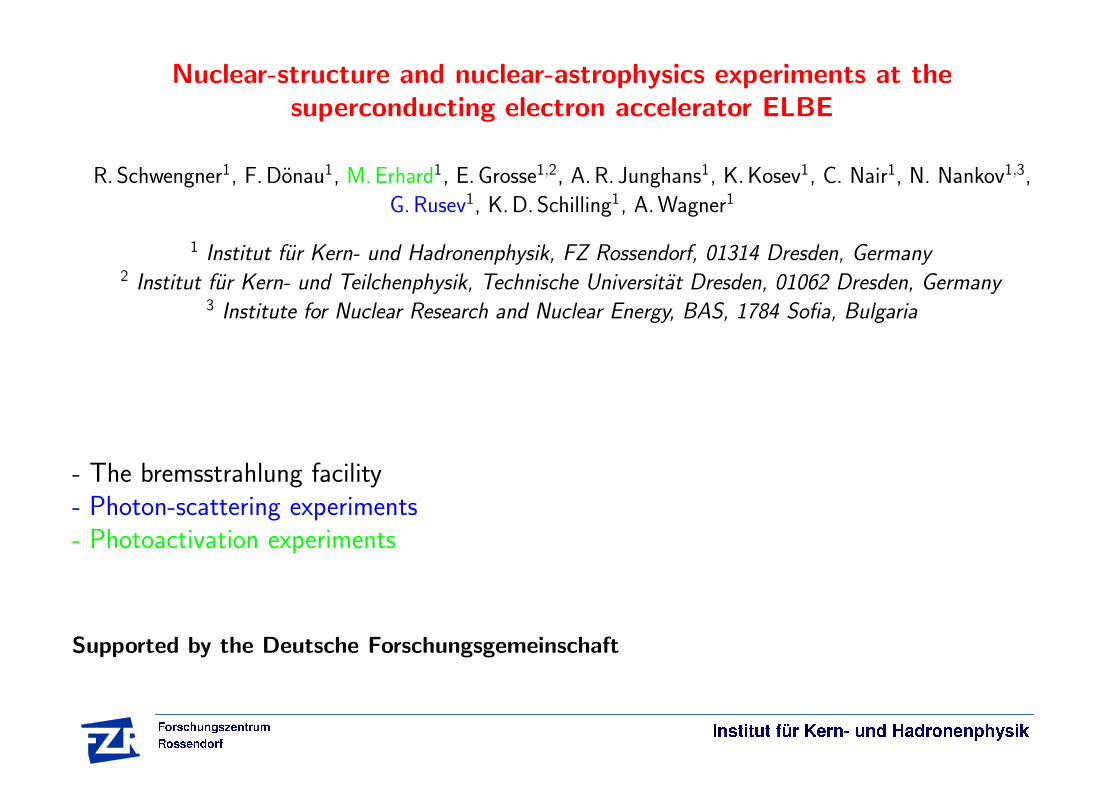
Nuclear-structure and nuclear-astrophysics experiments at the superconducting electron accelerator ELBE R. Schwengner 1 , F. D¨ onau 1 , M. Erhard 1 , E. Grosse 1,2 , A. R. Junghans 1 , K. Kosev 1 , C. Nair 1 , N. Nankov 1,3 , G. Rusev 1 , K. D. Schilling 1 , A. Wagner 1 1 Institut f¨ ur Kern- und Hadronenphysik, FZ Rossendorf, 01314 Dresden, Germany 2 Institut f¨ ur Kern- und Teilchenphysik, Technische Universit¨ at Dresden, 01062 Dresden, Germany 3 Institute for Nuclear Research and Nuclear Energy, BAS, 1784 Sofia, Bulgaria - The bremsstrahlung facility - Photon-scattering experiments - Photoactivation experiments Supported by the Deutsche Forschungsgemeinschaft
Transcript of Nuclear-structure and nuclear-astrophysics experiments · PDF fileNuclear-structure and...
Nuclear-structure and nuclear-astrophysics experiments at the
superconducting electron accelerator ELBE
R. Schwengner1, F. Donau1, M. Erhard1, E. Grosse1,2, A. R. Junghans1, K. Kosev1, C. Nair1, N. Nankov1,3,
G. Rusev1, K.D. Schilling1, A.Wagner1
1 Institut fur Kern- und Hadronenphysik, FZ Rossendorf, 01314 Dresden, Germany2 Institut fur Kern- und Teilchenphysik, Technische Universitat Dresden, 01062 Dresden, Germany
3 Institute for Nuclear Research and Nuclear Energy, BAS, 1784 Sofia, Bulgaria
- The bremsstrahlung facility
- Photon-scattering experiments
- Photoactivation experiments
Supported by the Deutsche Forschungsgemeinschaft
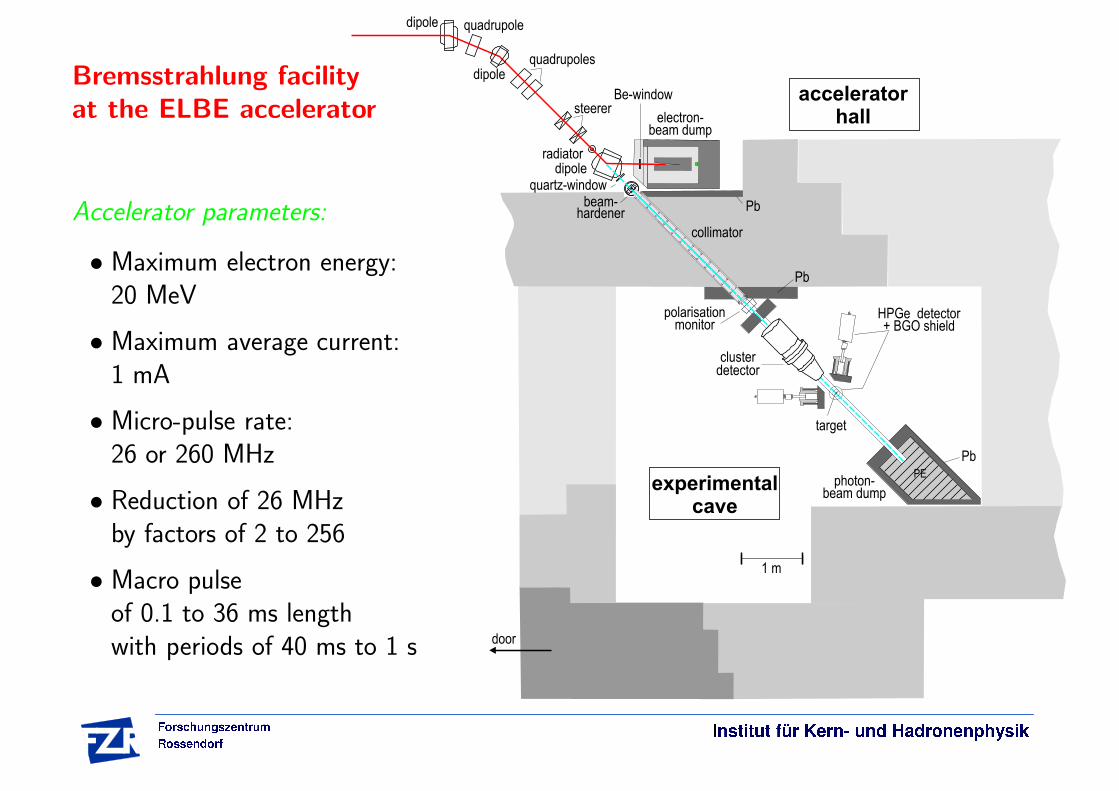
Bremsstrahlung facility
at the ELBE accelerator
Accelerator parameters:
• Maximum electron energy:
20 MeV
• Maximum average current:
1 mA
• Micro-pulse rate:
26 or 260 MHz
• Reduction of 26 MHz
by factors of 2 to 256
• Macro pulse
of 0.1 to 36 ms length
with periods of 40 ms to 1 s
1 m
Be-window
dipole
dipole
dipole
radiator
steerer
quadrupoles
quadrupole
electron-beam dump
quartz-windowbeam-
hardener
collimator
polarisationmonitor
target
PbPE
door
Pb
photon-beam dump
Pb
HPGe detector+ BGO shield
experimentalcave
acceleratorhall
clusterdetector
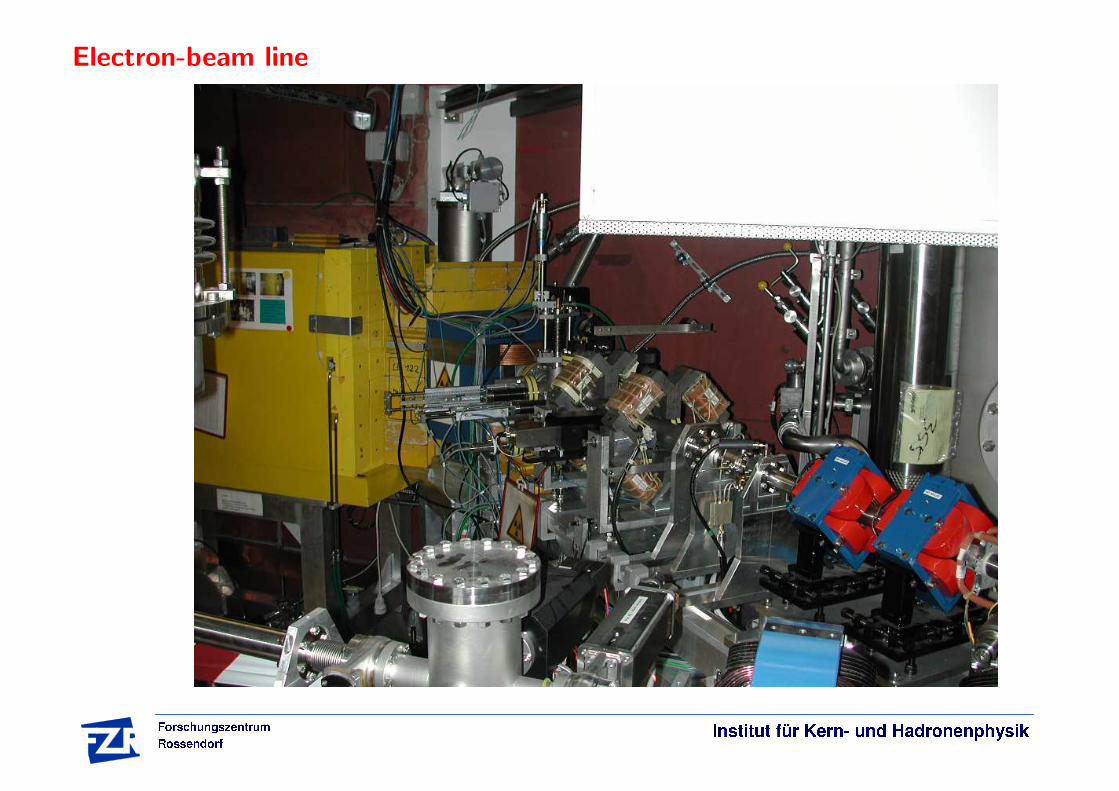
Electron-beam line

Simulation of the flux of photons passing the collimator
0 100 200 300 400 500
Radiator thickness / (mg/cm2)
103
104
105
Nγ w
ithin
5 m
rad
Eγ > 6 MeV
Ee
kin = 12 MeV
Eγ < 6 MeV
Nb radiator
0 10 20 30 40 50 60 70 80 90 100
θ / mrad
0
107
107
dNγ /
sin
θdθ
1.8 mg/cm2
Ee
kin = 12 MeV
18 mg/cm2
Nb radiator
180 mg/cm2
.
.
2
1
Simulations with GEANT4:
• Number of photons produced
by 109 electrons of Ekine = 12
MeV in a cone with an opening
angle of 5 mrad as a function of
the niobium-radiator thickness.
• Number of photons produced by
109 electrons of E kine
= 12 MeV
in niobium radiators of differ-
ent thicknesses as a function
of the angle between electron
beam and photon.

Radiator
Niobium radiators:
• Six radiator foils of 16 mm diameter
mounted on a water-cooled copper rod
• Thicknesses of 2, 3, 4, 5, 7 and 12.5
µm, corresponding to 2 · 10−4 to 10−3
radiation lengths
• Radiator holder can be moved by a DC
motor drive to select a radiator without
breaking the vacuum

Detector setup

Beam dump
E γ = 12 MeV
Photon-beam dump
Pb
Pb
Pb
Pb
PE
GEANT3 simulation with 1000 trajectories
of 12 MeV photons.
About 0.3 % of the photons are scattered back
towards the detectors.
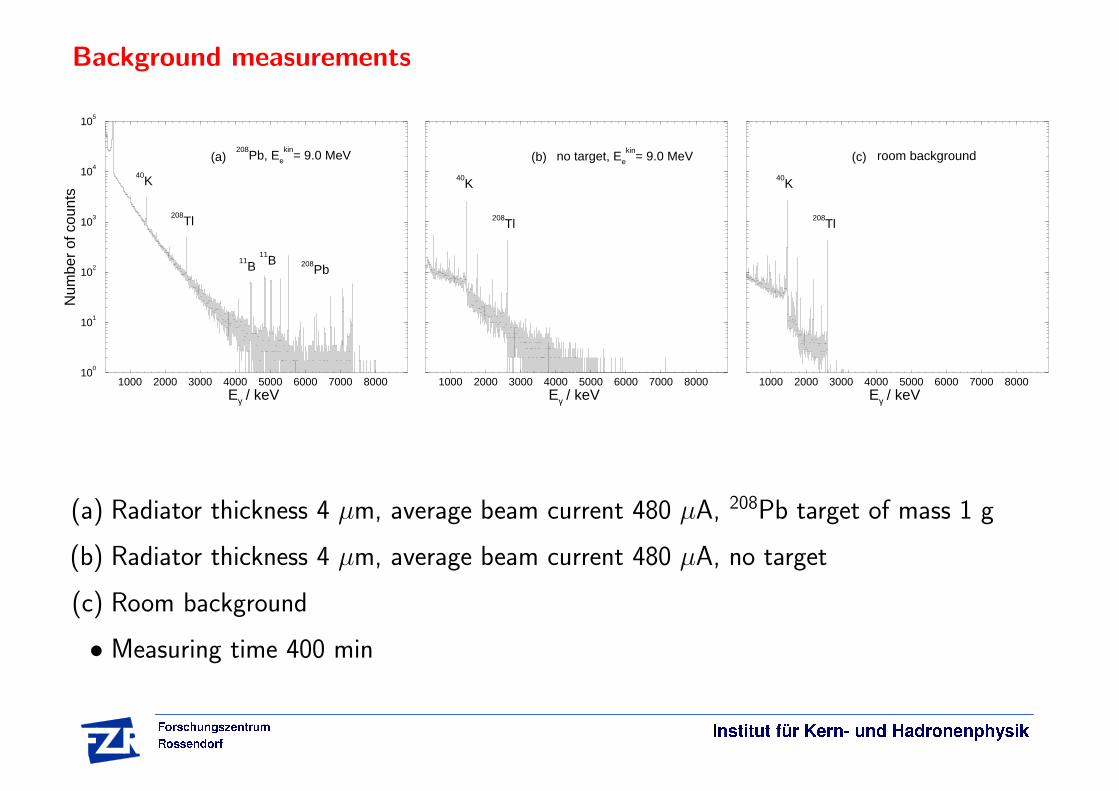
Background measurements
1000 2000 3000 4000 5000 6000 7000 8000Eγ / keV
100
101
102
103
104
105
Num
ber
of c
ount
s
(a)208
Pb, Ee
kin= 9.0 MeV
40K
208Tl
208Pb
11B
11B
1000 2000 3000 4000 5000 6000 7000 8000Eγ / keV
(b) no target, Ee
kin= 9.0 MeV
40K
208Tl
1000 2000 3000 4000 5000 6000 7000 8000Eγ / keV
(c) room background
40K
208Tl
(a) Radiator thickness 4 µm, average beam current 480 µA, 208Pb target of mass 1 g
(b) Radiator thickness 4 µm, average beam current 480 µA, no target
(c) Room background
• Measuring time 400 min
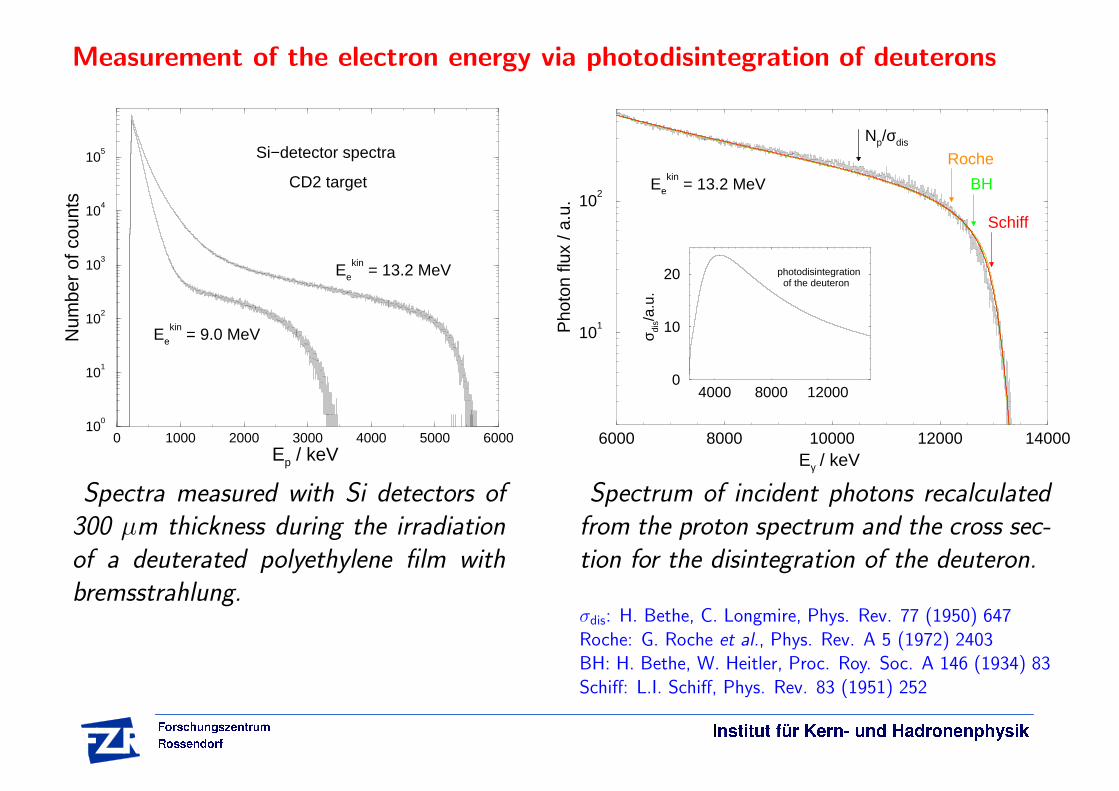
Measurement of the electron energy via photodisintegration of deuterons
0 1000 2000 3000 4000 5000 6000Ep / keV
100
101
102
103
104
105
Num
ber
of c
ount
s
Si−detector spectra
Ee
kin = 9.0 MeV
CD2 target
Ee
kin = 13.2 MeV
6000 8000 10000 12000 14000Eγ / keV
101
102
Pho
ton
flux
/ a.u
.
Schiff
BH
Np/σdis
Ee
kin = 13.2 MeV
Roche
4000 8000 120000
10
20
σ dis/a
.u.
of the deuteronphotodisintegration
Spectra measured with Si detectors of
300 µm thickness during the irradiation
of a deuterated polyethylene film with
bremsstrahlung.
Spectrum of incident photons recalculated
from the proton spectrum and the cross sec-
tion for the disintegration of the deuteron.
σdis: H. Bethe, C. Longmire, Phys. Rev. 77 (1950) 647
Roche: G. Roche et al., Phys. Rev. A 5 (1972) 2403BH: H. Bethe, W. Heitler, Proc. Roy. Soc. A 146 (1934) 83
Schiff: L.I. Schiff, Phys. Rev. 83 (1951) 252
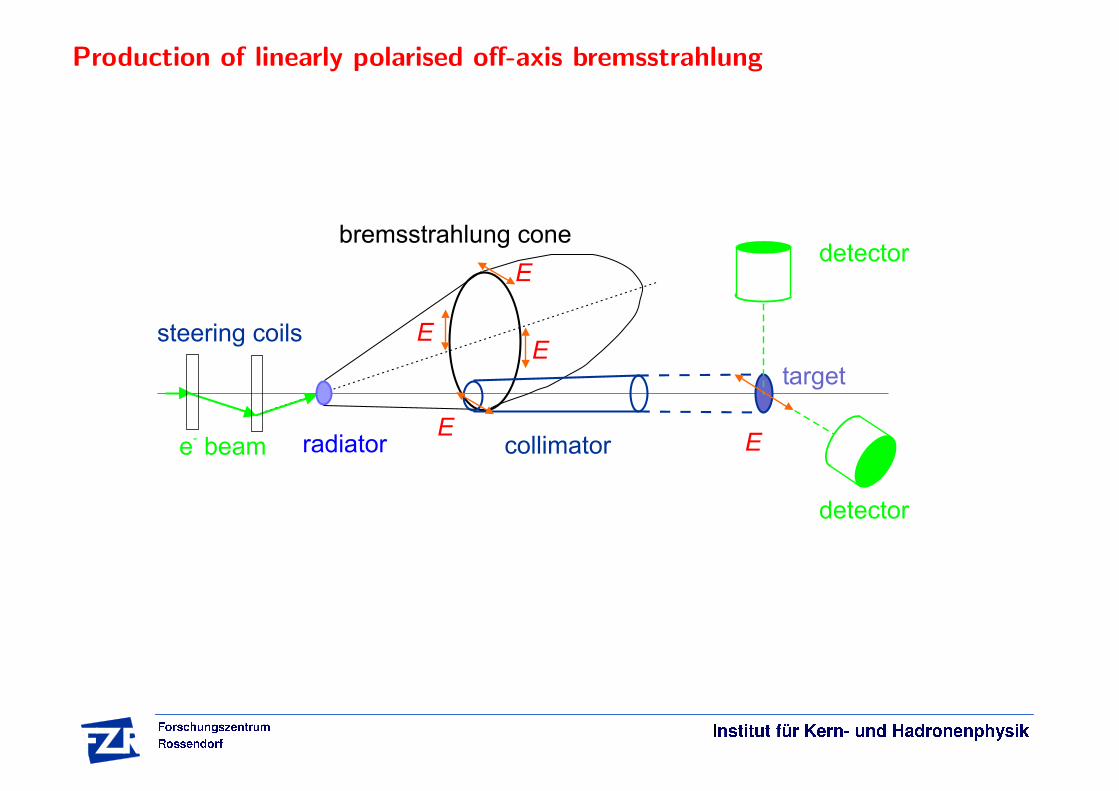
Production of linearly polarised off-axis bremsstrahlung
detector
collimatorradiator
bremsstrahlung cone
e beam- E
E
E
E
E
detector
steering coils
target
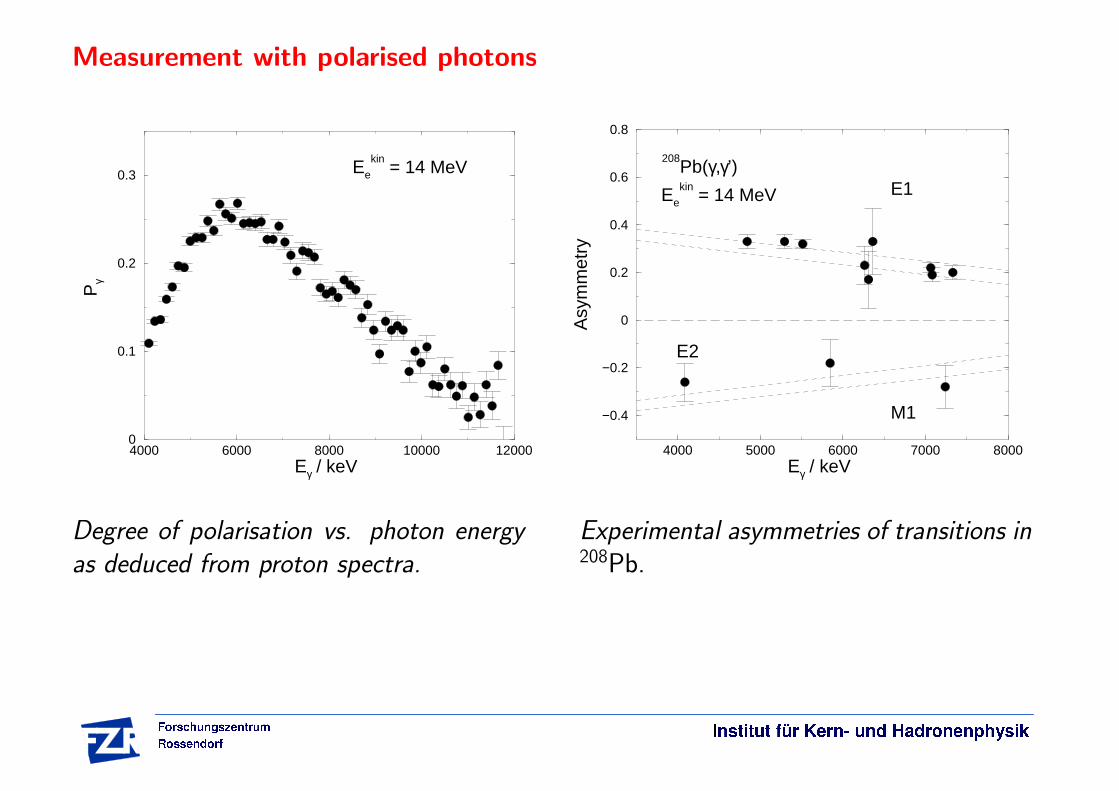
Measurement with polarised photons
4000 6000 8000 10000 12000Eγ / keV
0
0.1
0.2
0.3
Pγ
Ee
kin = 14 MeV
4000 5000 6000 7000 8000Eγ / keV
−0.4
−0.2
0
0.2
0.4
0.6
0.8
Asy
mm
etry
208Pb(γ,γ’)
Ee
kin = 14 MeV E1
M1
E2
Degree of polarisation vs. photon energy
as deduced from proton spectra.
Experimental asymmetries of transitions in208
Pb.

Photon scattering from 208Pb
4000 6000 8000 10000 12000 14000 16000 18000Eγ / keV
101
102
103
104
Num
ber
of c
ount
s
208Pb(γ,γ’)
Ee
kin = 17 MeV
Θ = 127o
11B
12C
74Ge
Sn
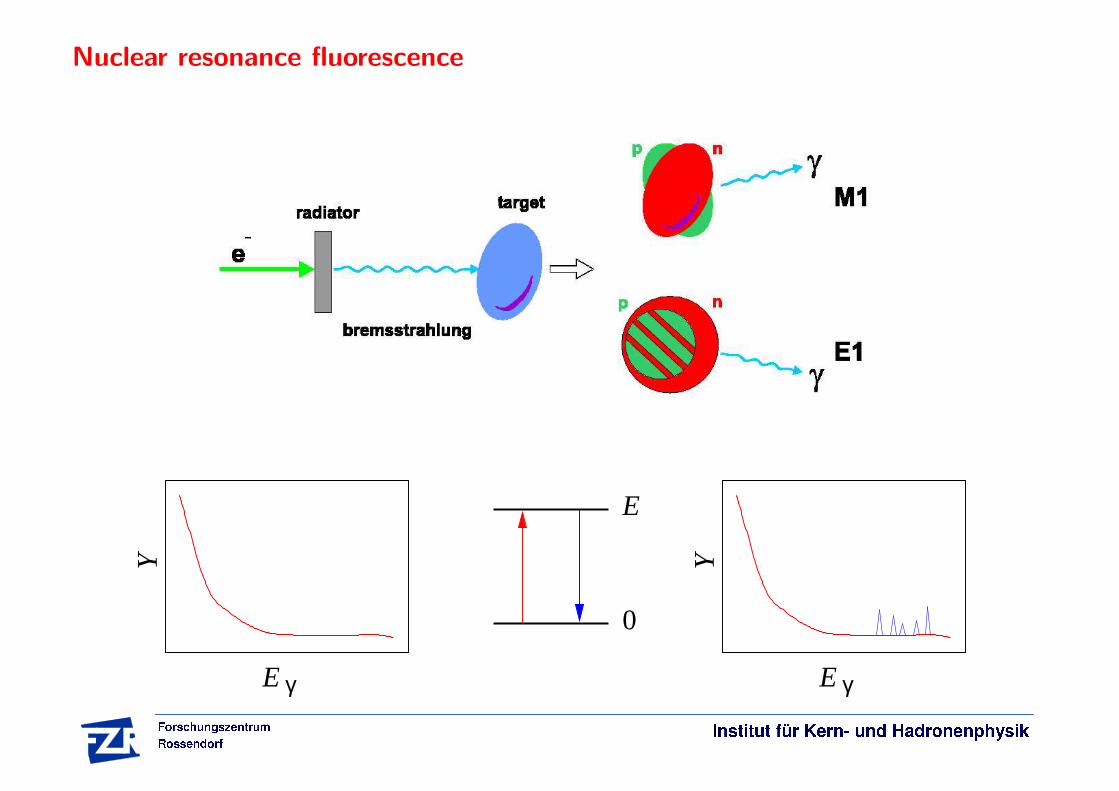
Nuclear resonance fluorescence
E γ
0
E
Y YγE

Photon scattering
E, J, π, Γ
γ γ ’0 γ ’f
Experimental needs:
• Continuous photon spectrum of high intensity⇒ bremsstrahlung
• Variable end-point energy⇒ tunable electron energy
Experimental observables:
• Energy of the scattered photons → E
• Intensity of the scattered photons → Γ
• Angular distribution of the scattered photons → J
• Polarisation of the scattered photons → π
⇒ Compton polarimeter (E γ < 5 MeV)⇒ polarised bremsstrahlung for higher γ energies
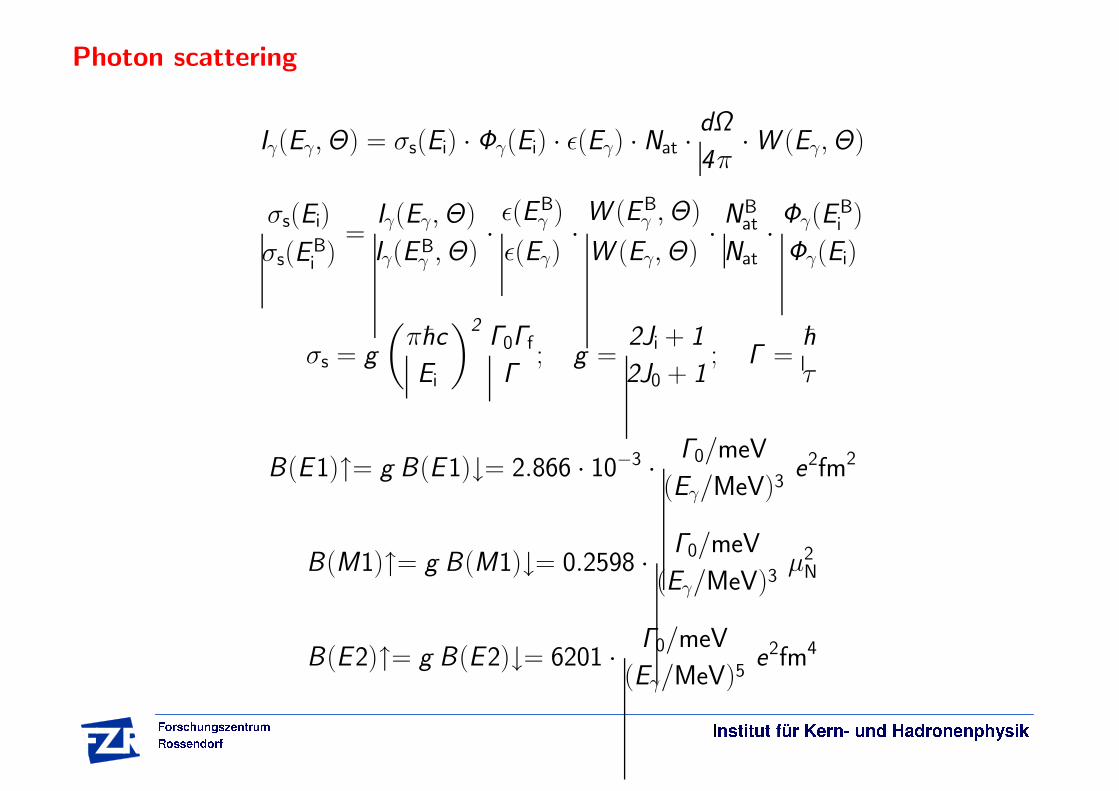
Photon scattering
Iγ(Eγ, Θ) = σs(Ei) · Φγ(Ei) · ε(Eγ) · Nat ·dΩ
4π· W (Eγ, Θ)
σs(Ei)
σs(EB
i)
=Iγ(Eγ, Θ)
Iγ(EBγ , Θ)
·ε(EB
γ )
ε(Eγ)·W (EB
γ , Θ)
W (Eγ, Θ)·NB
at
Nat
·Φγ(E
Bi)
Φγ(Ei)
σs = g
(
πhc
Ei
)2Γ0Γf
Γ; g =
2Ji + 1
2J0 + 1; Γ =
h
τ
B(E1)↑= g B(E1)↓= 2.866 · 10−3 ·
Γ0/meV
(Eγ/MeV)3e2
fm2
B(M1)↑= g B(M1)↓= 0.2598 ·Γ0/meV
(Eγ/MeV)3µ2
N
B(E2)↑= g B(E2)↓= 6201 ·Γ0/meV
(Eγ/MeV)5e2
fm4

Nuclides under investigation in photon-scattering experiments
Z
42
40
38
36
34
48 50 52 54 56 58 N
nuclide Sn E kine
MeV MeV
92Mo 12.7 6.0, 13.2
98Mo 8.6 13.23.3a, 3.8a
100Mo 8.3 7.8, 13.23.2a, 3.4a, 3.8a
88Sr 11.1 9.0, 13.26.8b
90Zr 12.0 7.0, 9.0
a Dynamitron experiment,
PRL 95 (2005) 062501b S-Dalinac experiment,
PRC 70 (2004) 064307

M1 strength in even-even Mo isotopes up to 4 MeV
2.5 3 3.5 4Ex / MeV
0
0.1
0.2
0.3
0.4
0.5
B(M
1) /
µ N
2
92Mo50
Σ B(M1) = 0.56(4) µN
2
2.5 3 3.5 4Ex / MeV
94Mo52
Σ B(M1) = 0.67(7) µN
2
2.5 3 3.5 4Ex / MeV
96Mo54
Σ B(M1) = 0.47(2) µN
2
2.5 3 3.5 4Ex / MeV
0
0.1
0.2
0.3
0.4
0.5
B(M
1) /
µ N
2
98Mo56
Σ B(M1) = 0.74(3) µN
2
2.5 3 3.5 4Ex / MeV
100Mo58
Σ B(M1) = 0.98(4) µN
294Mo: C. Fransen et al.,
PRC 67 (2003) 02430796Mo: C. Fransen et al.,
PRC 70 (2004) 044317

Deformation of even-even Mo isotopes
Total energy as a function of the quadrupole deformation ε2 and the triaxiality γ:
0
10
20
30
40
50
60
0 0.01 0.02 0.03 0.04 0.05 0.06 0.07 0.08ε2
γ
0
10
20
30
40
50
60
0.02 0.03 0.04 0.05 0.06 0.07 0.08ε2
γ
0
10
20
30
40
50
60
0.05 0.06 0.07 0.08 0.09 0.1 0.11 0.12 0.13 0.14ε2
γ
0
10
20
30
40
50
60
0.16 0.18 0.2 0.22 0.24ε2
γ
0
10
20
30
40
50
60
0.16 0.18 0.2 0.22 0.24ε2
γ
92Mo5094Mo52
96Mo5498Mo56
100Mo58
ε2 = 0.0 ε2 = 0.02 ε2 = 0.10 ε2 = 0.18 ε2 = 0.21
γ = 60 γ = 37 γ = 32
TAC model with shell-correction method
S. Frauendorf, NPA 557 (1993) 259c, NPA 667 (2000) 115
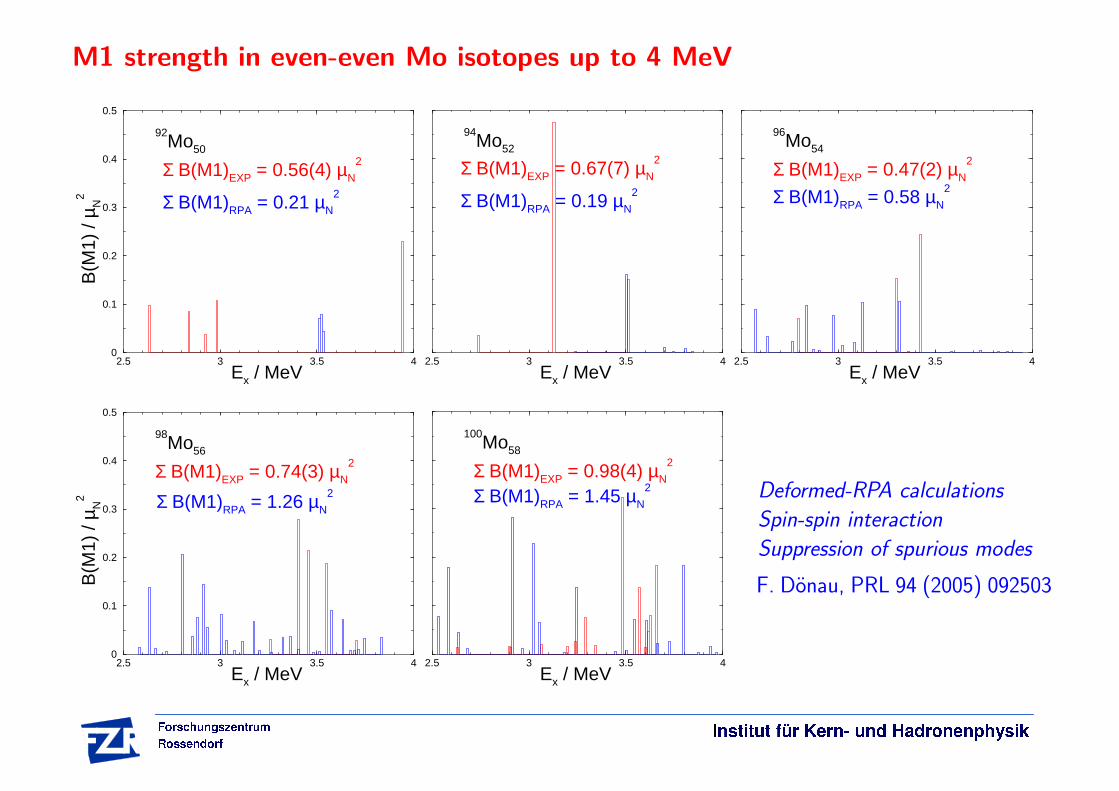
M1 strength in even-even Mo isotopes up to 4 MeV
2.5 3 3.5 4Ex / MeV
0
0.1
0.2
0.3
0.4
0.5
B(M
1) /
µ N
2
92Mo50
Σ B(M1)EXP = 0.56(4) µN
2
Σ B(M1)RPA = 0.21 µN
2
2.5 3 3.5 4Ex / MeV
94Mo52
Σ B(M1)EXP = 0.67(7) µN
2
Σ B(M1)RPA = 0.19 µN
2
2.5 3 3.5 4Ex / MeV
96Mo54
Σ B(M1)EXP = 0.47(2) µN
2
Σ B(M1)RPA = 0.58 µN
2
2.5 3 3.5 4Ex / MeV
0
0.1
0.2
0.3
0.4
0.5
B(M
1) /
µ N
2
98Mo56
Σ B(M1)EXP = 0.74(3) µN
2
Σ B(M1)RPA = 1.26 µN
2
2.5 3 3.5 4Ex / MeV
100Mo58
Σ B(M1)EXP = 0.98(4) µN
2
Σ B(M1)RPA = 1.45 µN
2 Deformed-RPA calculations
Spin-spin interaction
Suppression of spurious modes
F. Donau, PRL 94 (2005) 092503

Photon scattering from 92Mo, 98Mo and 100Mo

Detection limits
pDL = 3
√
(1+ηP
ηB
)B
R. Jenkins, R.W. Gould, D. Gedcke,
Quantitative X-Ray Spectrometry,
Marcel Dekker, New York, 1981

Angular distributions of transitions in 92Mo, 98Mo and 100Mo
Expected values:
L = 1:Iγ(90)/Iγ(127) = 0.73
L = 2:Iγ(90)/Iγ(127) = 2.28

E1 strength in 92Mo, 98Mo and 100Mo
The summed B(E1) strength decreases with increasing N/Z.

E1 strength in even-even Mo isotopes and in even-even N = 50 isotones
49 50 51 52 53 54 55 56 57 58 59N
0
0.1
0.2
0.3
0.4
0.5
0.6
0.7
0.8
0.9
1
1.1
1.2
Σ B
(E1)
/ (
e2 fm2 )
E > 5 MeV
92Mo
98Mo
100Mo
Peaks
RPA
34 35 36 37 38 39 40 41 42 43 44Z
0
0.1
0.2
0.3
0.4
0.5
0.6
0.7
0.8
0.9
1
1.1
1.2
Σ B
(E1)
/ (
e2 fm2 )
E > 5 MeV
86Kr50
88Sr50
90Zr50
92Mo50
The summed B(E1) strength decreases
with increasing N/Z.The summed B(E1) strength increases
with increasing N/Z.

Unresolved strength in the continuum
fL(E ) =1
∆
∑
∆
Γ0
E 3

E1 strength in even-even Mo isotopes and in even-even N = 50 isotones
49 50 51 52 53 54 55 56 57 58 59N
0
0.1
0.2
0.3
0.4
0.5
0.6
0.7
0.8
0.9
1
1.1
1.2
Σ B
(E1)
/ (
e2 fm2 )
E > 5 MeV
92Mo
98Mo
100Mo
Peaks
Peaks + Cont.
RPA
34 35 36 37 38 39 40 41 42 43 44Z
0
0.1
0.2
0.3
0.4
0.5
0.6
0.7
0.8
0.9
1
1.1
1.2
Σ B
(E1)
/ (
e2 fm2 )
E > 5 MeV
86Kr50
88Sr50
90Zr50
92Mo50
The summed B(E1) strength decreases
with increasing N/Z.The summed B(E1) strength increases
with increasing N/Z.
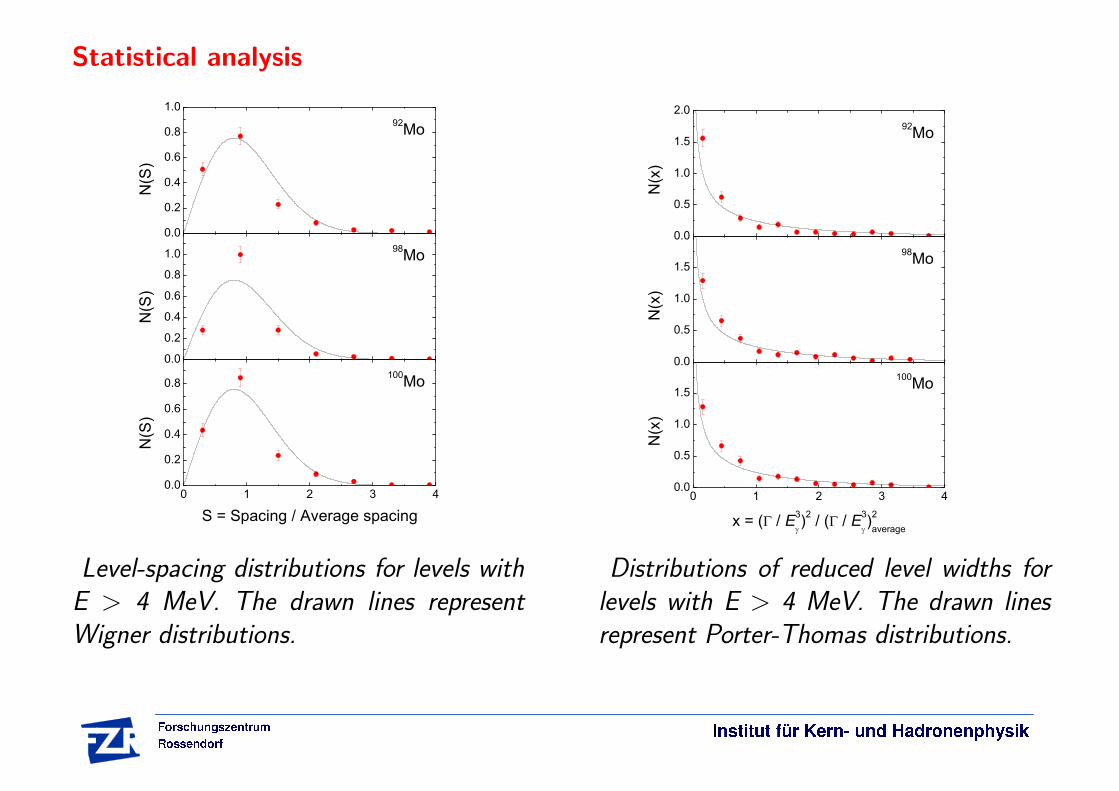
Statistical analysis
Level-spacing distributions for levels with
E > 4 MeV. The drawn lines represent
Wigner distributions.
Distributions of reduced level widths for
levels with E > 4 MeV. The drawn lines
represent Porter-Thomas distributions.
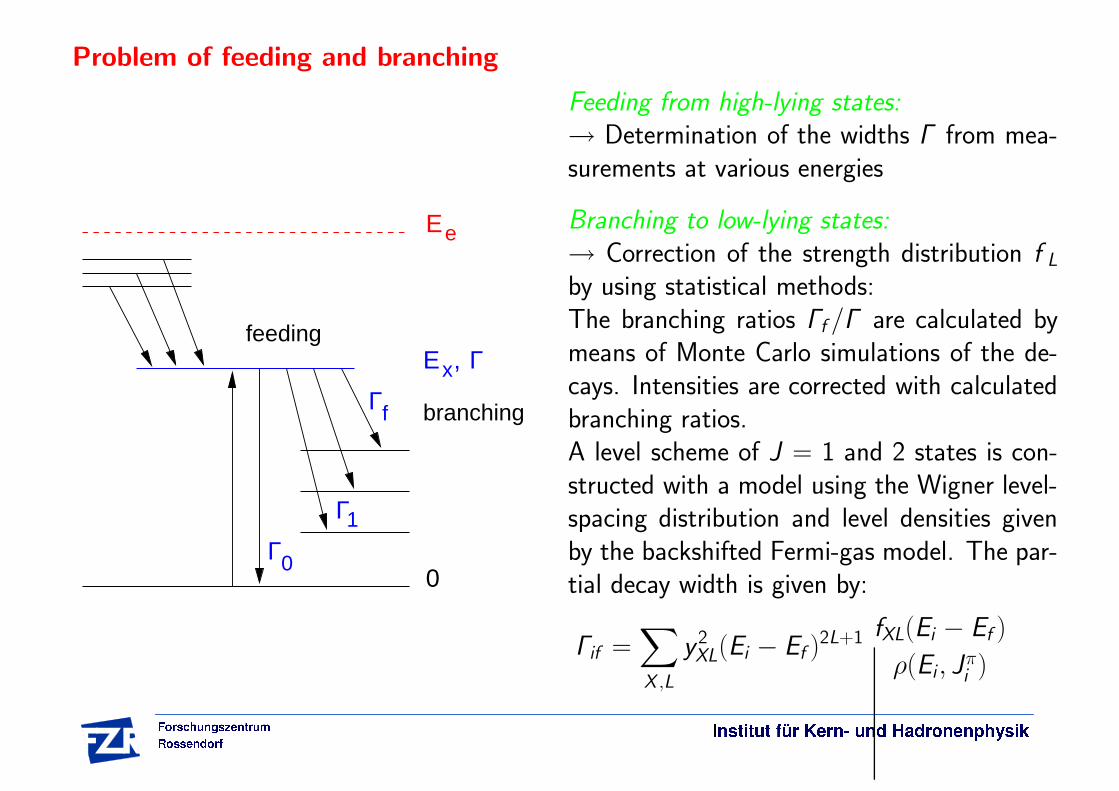
Problem of feeding and branching
0Γ0
Γ1
Ee
E ,x Γ
branchingΓf
feeding
Feeding from high-lying states:
→ Determination of the widths Γ from mea-
surements at various energies
Branching to low-lying states:
→ Correction of the strength distribution f L
by using statistical methods:
The branching ratios Γf /Γ are calculated by
means of Monte Carlo simulations of the de-
cays. Intensities are corrected with calculated
branching ratios.
A level scheme of J = 1 and 2 states is con-
structed with a model using the Wigner level-
spacing distribution and level densities given
by the backshifted Fermi-gas model. The par-
tial decay width is given by:
Γif =∑
X ,L
y 2
XL(Ei − Ef )
2L+1fXL(Ei − Ef )
ρ(Ei , Jπi)
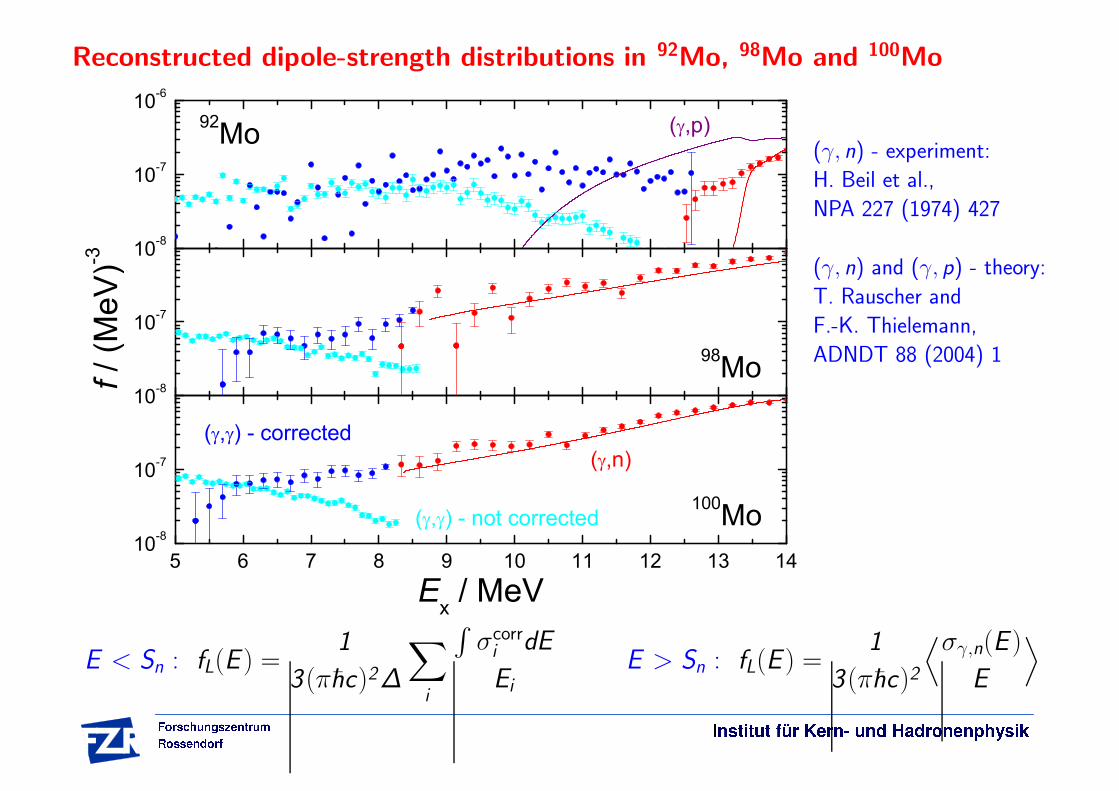
Reconstructed dipole-strength distributions in 92Mo, 98Mo and 100Mo
(γ, n) - experiment:
H. Beil et al.,
NPA 227 (1974) 427
(γ, n) and (γ, p) - theory:
T. Rauscher and
F.-K. Thielemann,
ADNDT 88 (2004) 1
E < Sn : fL(E ) =1
3 (πhc)2∆
∑
i
∫
σcorr
idE
Ei
E > Sn : fL(E ) =1
3 (πhc)2
⟨
σγ,n(E )
E
⟩

Accumulative E1 strength
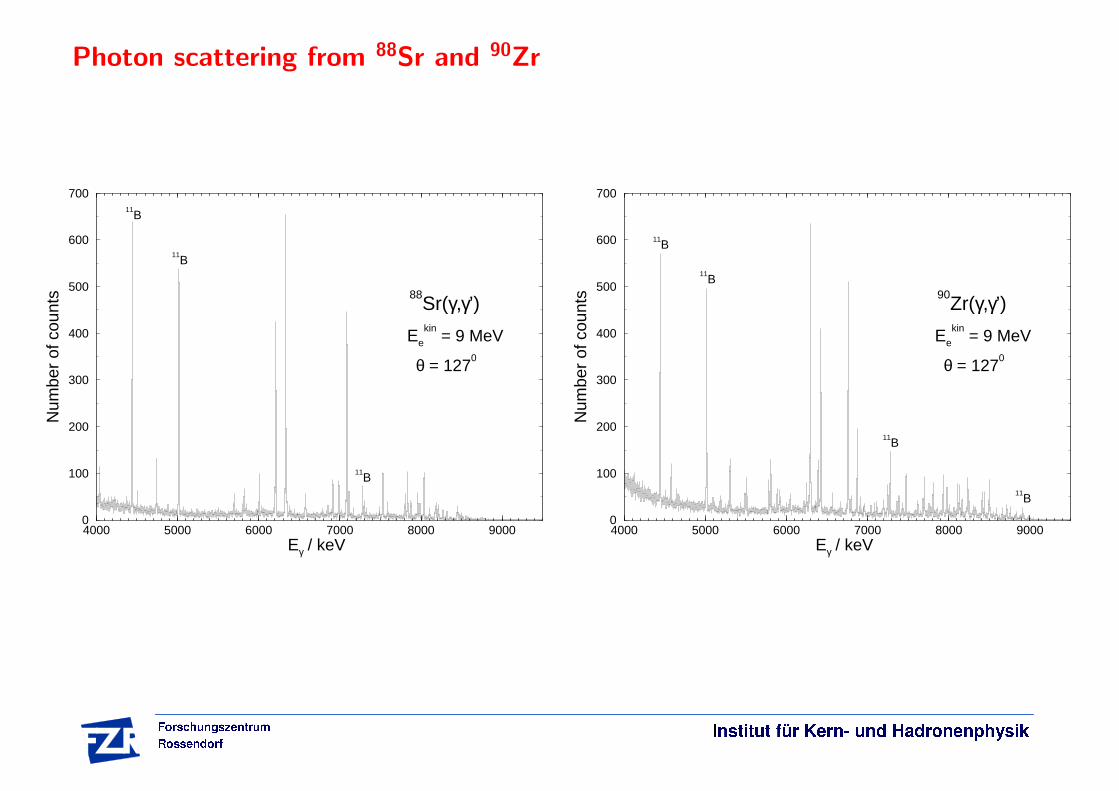
Photon scattering from 88Sr and 90Zr
4000 5000 6000 7000 8000 9000Eγ / keV
0
100
200
300
400
500
600
700
Num
ber
of c
ount
s
Ee
kin = 9 MeV
θ = 1270
88Sr(γ,γ’)
11B
11B
11B
4000 5000 6000 7000 8000 9000Eγ / keV
0
100
200
300
400
500
600
700
Num
ber
of c
ount
s
Ee
kin = 9 MeV
θ = 1270
90Zr(γ,γ’)
11B
11B
11B
11B

Summary
Dipole-strength distributions of even-even Mo isotopes have been studied up to therespective neutron-separation energies at the photon-scattering facility of the ELBE ac-celerator.
The M1 strength distributions up to Ex < 4 MeV fragment with increasing deformation,which is qualitatively described by deformed-RPA calculations.
The total E1 strength above 5 MeV decreases with increasing N/Z of the Mo isotopes,which is reproduced by deformed-RPA predictions.
The total E1 strength above 5 MeV increases with increasing N/Z for N = 50 isotones.
The high level density above 5 MeV in connection with feeding by high-lying states andbranchings to low-lying states require new techniques in order to reconstruct the originaldipole-strength distributions.
Simulations of the decay of excited levels deliver an estimate of the branchings. Thereconstructed dipole-strength distributions fit the low-energy tails of the giant dipoleresonances.
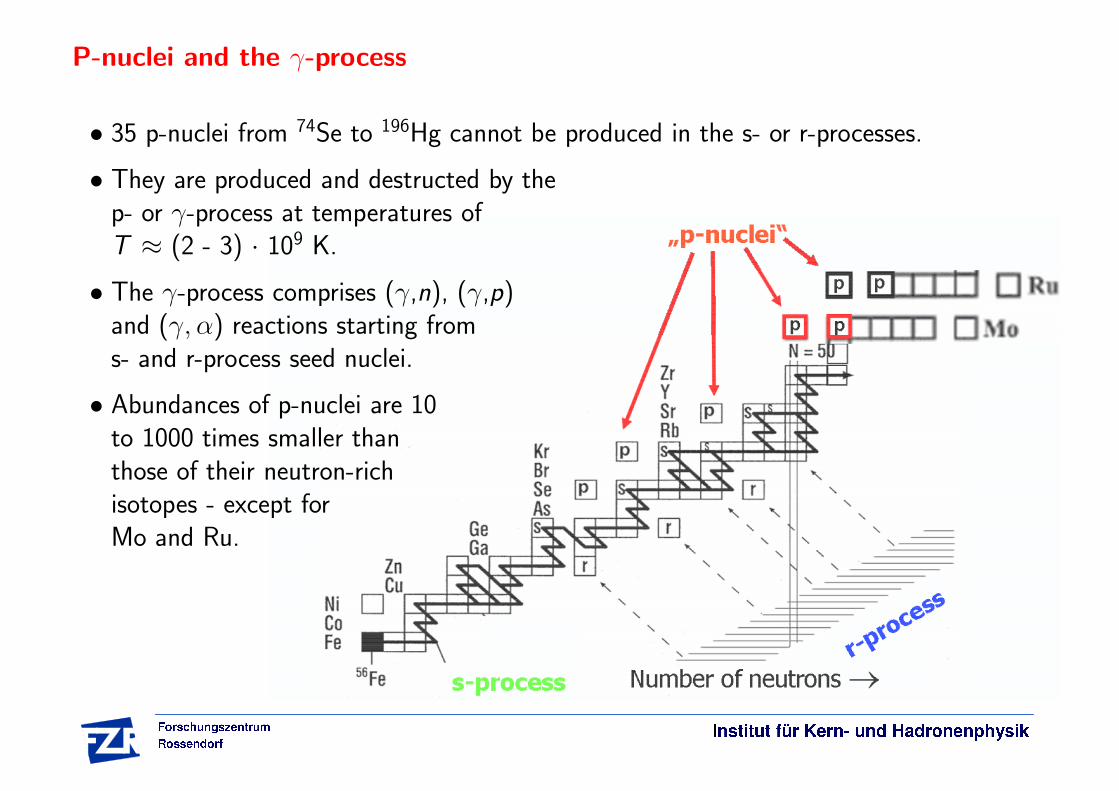
P-nuclei and the γ-process
• 35 p-nuclei from 74Se to 196Hg cannot be produced in the s- or r-processes.
• They are produced and destructed by thep- or γ-process at temperatures ofT ≈ (2 - 3) · 109 K.
• The γ-process comprises (γ,n), (γ,p)and (γ, α) reactions starting froms- and r-process seed nuclei.
• Abundances of p-nuclei are 10to 1000 times smaller thanthose of their neutron-richisotopes - except forMo and Ru.
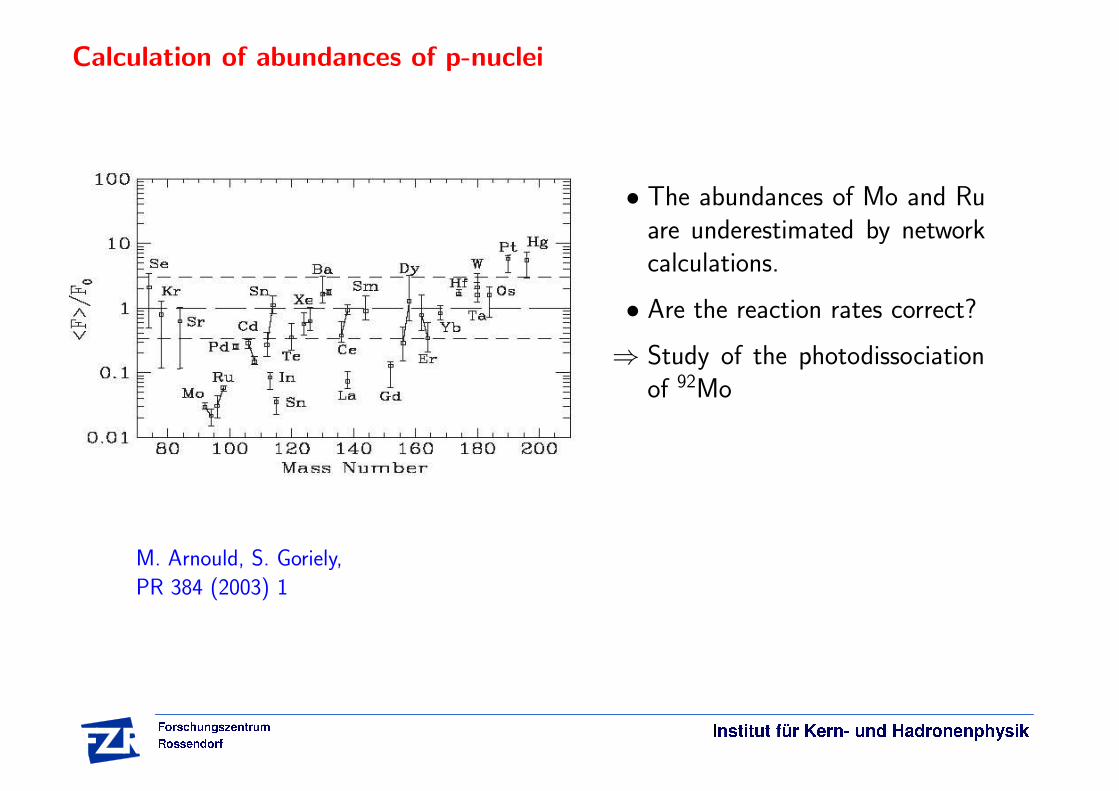
Calculation of abundances of p-nuclei
• The abundances of Mo and Ruare underestimated by networkcalculations.
• Are the reaction rates correct?
⇒ Study of the photodissociationof 92Mo
M. Arnould, S. Goriely,
PR 384 (2003) 1
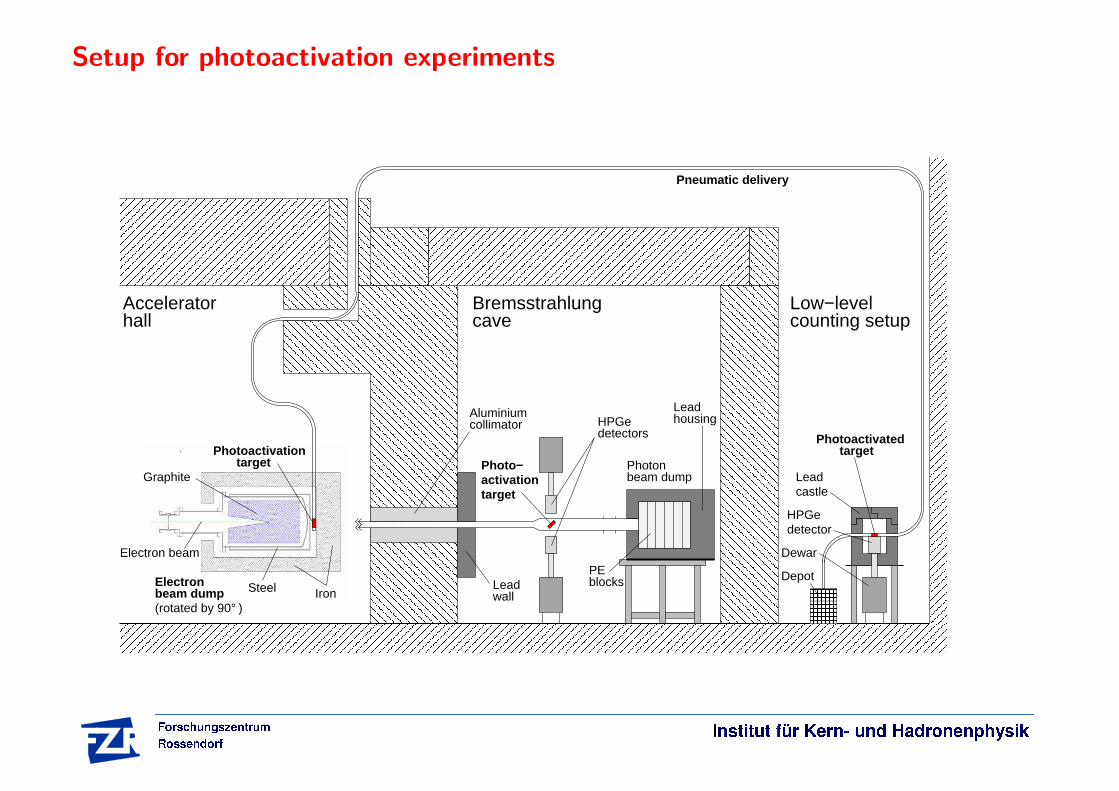
Setup for photoactivation experiments
caveBremsstrahlung
counting setupLow−levelAccelerator
hall
Photoactivationtarget
Electronbeam dump(rotated by 90°)
collimatorAluminium
targetactivationPhoto−
Leadwall
HPGedetectors
housingLead
beam dumpPhoton
PEblocks
castleLead
Photoactivatedtarget
detectorHPGe
Pneumatic delivery
Steel Iron
Electron beam
Graphite
Dewar
Depot

Photoactivation of92Mo
Electron capture (EC) and decay
9142Mo
−652.9 keV1/2
64.6 s
9/2+
15.5 min
0 keV
48.2%
9/2+
680 y
0 keV
−104.5 keV1/2
60.86 d
Nb4191
0.58%
Zr9140
1/2+0.17 ps
1204.8 keV
5/2+stable
0 keV
100% (2.9%) EC 93%
+β( <
0.2
%)
EC 2.9%
EC 4
%
A = 92A = 91Mo42
92
0+stable
0 keV
pS 7456 keV
12672 keVSn
9
3%
+β
+β 5
0%
not t
o sc
ale
Photoactivation process
γ+
transitions
β
Nact(Ee) = Ntar ·
∫Ee
Ethr
σ(γ,x) Φγ(E , Ee) dE
Nact(Ee) = Iγ(Eγ) · ε−1(Eγ) · p
−1(Eγ) · κcorr

Activation yield
100Mo(γ,n)
92Mo(γ,p) + (γ,n)
92Mo(γ, α)
Activation yield of the 197Au(γ, n) re-action. The yield is normalised to thenumber of 197Au atoms and to the ab-solute photon flux at Eγ = 8917 keV.
Activation yields of Mo isotopes normalisedto the activation yield of the 197Au(γ, n) re-action.
Open symbols:
T. Rauscher and F.-K. Thielemann,
ADNDT 88 (2004) 1

Summary
Endpoint energy derived from the photodissociation of 2H.
Photon-flux distribution deduced from photon scattering from states with known widthsin 11B.
Determination of the photon flux in the electron-beam dump by means of gold targets.
Determination of the activation yield of the 92Mo(γ, p)91mNb reaction up to Sn(92Mo)
via the decay 91mNb(EC) → 91Zr (E γ = 1205 keV).
Good agreement of the activation yield with theoretical predictions.
92Mo(γ, α)88Zr observed for the first time.