First results with non-irradiated and heavily irradiated microstrip trenched detectors
Upload
nguyencongCategory
view
213download
0
©BEG/CEE‐UT, 1
North, South, Texas and the RestCEE Annual Meeting 4‐5 December 2013

©BEG/CEE‐UT, 2
Welcome!
• Agenda highlights and other logistics• Introductions – “Up at Night” rules of the game and Chatham House rules for meeting

©BEG/CEE‐UT, 3
WHAT KEEPS ME UP AT NIGHT“To sleep: perchance to dream: ay, there's the rub”

©BEG/CEE‐UT, 4
What Keeps Us Up at Night
• Rapid changes and increasing complexity of commodity markets
• Reconciling project announcements and status• Fuzzy data
– On macroeconomics, OPEC, climate (!), etc• Science, technical, economic literacy; human factor literacy– How can we achieve more impact from CEE research?

©BEG/CEE‐UT, 5
Implied market balances and
policy/regulation
Economics, industry structure, NOCs
Economics and market structure
NGVsActivity and
economic impactsUS Gas/Power, ERCOT balances
(Not So) Simple Value Chains
Upstream Midstream
Raw Material Imports, Exports
Downstream
Product Imports, Exports
Power “Res, Comm” Industrial Transportation
Interaction of:• Substitute fuels and competing alternatives• Sectoral fundamentals, macro conditions, stakeholder perceptions
Energy Webs
How do we do this??? Commercial frameworks
“Thought Clouds”

©BEG/CEE‐UT, 6
Putting It All Together
0
5
10
15
20
25
30
35
40
45
TCF
Transportation EIA Ref
LNG exports EIA Ref
Pipeline exports EIA Ref
Power generation EIA Ref
Industrial EIA Ref
Other EIA Ref
Dry gas prod EIA Ref
Imports EIA Ref
Total supply EIA Ref
Total demand CEE High Case
Total demand CEEAlternative CaseTotal supply EIA High OGR
Total demand EIA High OGR

©BEG/CEE‐UT, 7
CEE High Case Demand Stack
0
5
10
15
20
25
30
35
40
45
2012
2013
2014
2015
2016
2017
2018
2019
2020
2021
2022
2023
2024
2025
2026
2027
2028
2029
2030
TCF
LNG exports CEE
Pipeline exports CEE
Power generation CEE
Industrial CEE
©BEG/CEE‐UT, 8
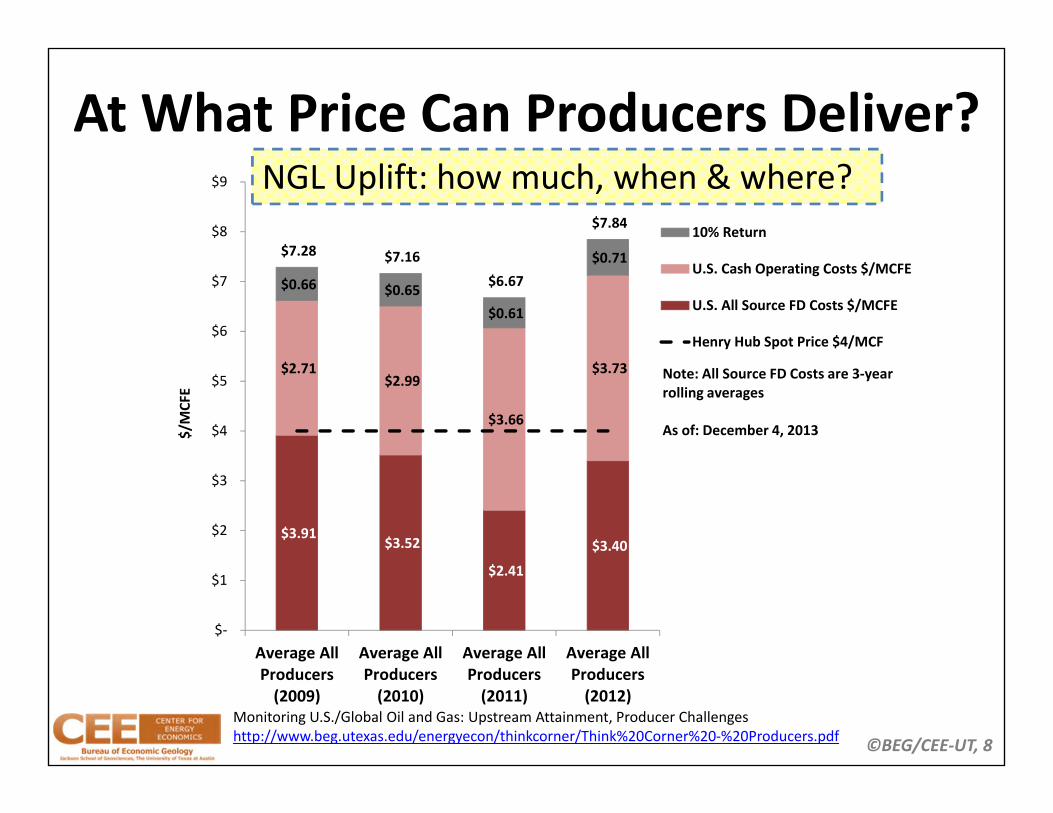
$3.91 $3.52
$2.41
$3.40
$2.71 $2.99
$3.66
$3.73
$0.66 $0.65 $0.61
$0.71 $7.28 $7.16
$6.67
$7.84
$‐
$1
$2
$3
$4
$5
$6
$7
$8
$9
Average AllProducers(2009)
Average AllProducers(2010)
Average AllProducers(2011)
Average AllProducers(2012)
$/MCFE
10% Return
U.S. Cash Operating Costs $/MCFE
U.S. All Source FD Costs $/MCFE
Henry Hub Spot Price $4/MCF
Note: All Source FD Costs are 3‐year rolling averages
As of: December 4, 2013
At What Price Can Producers Deliver?
Monitoring U.S./Global Oil and Gas: Upstream Attainment, Producer Challenges http://www.beg.utexas.edu/energyecon/thinkcorner/Think%20Corner%20‐%20Producers.pdf
NGL Uplift: how much, when & where?
©BEG/CEE‐UT, 9
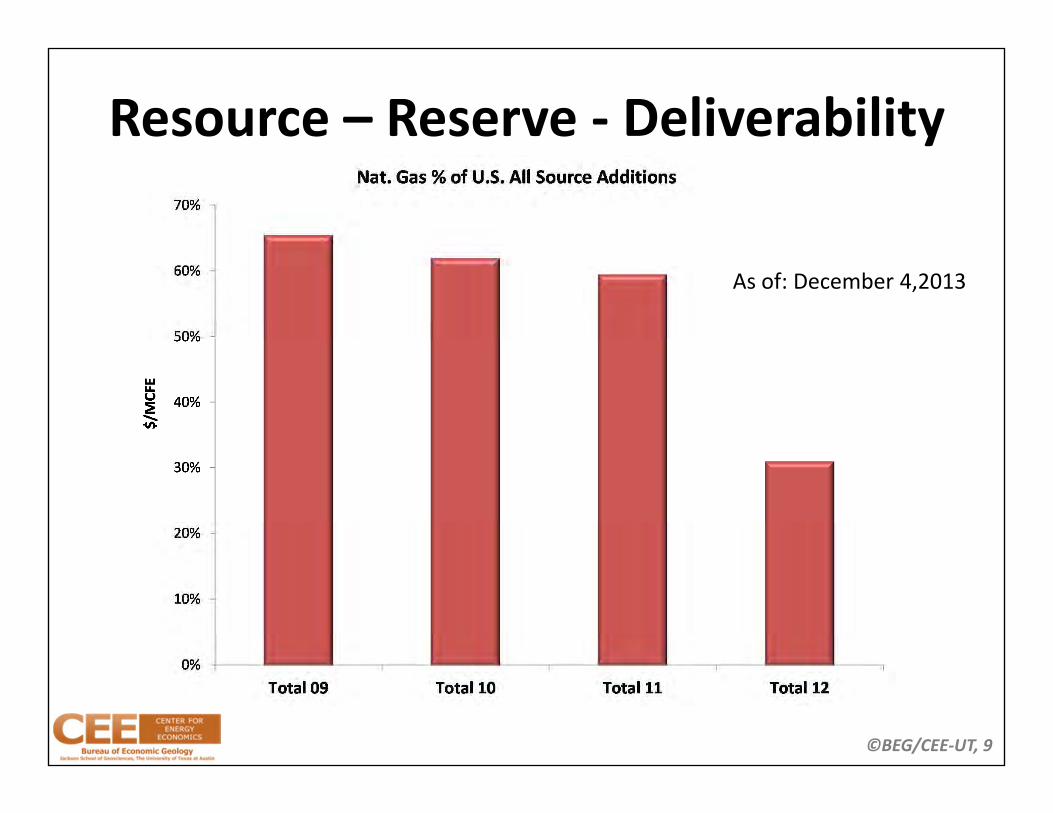
Resource – Reserve ‐ Deliverability
As of: December 4,2013

©BEG/CEE‐UT, 10
NG Price Deck (OIES NG 58)
©BEG/CEE‐UT, 11
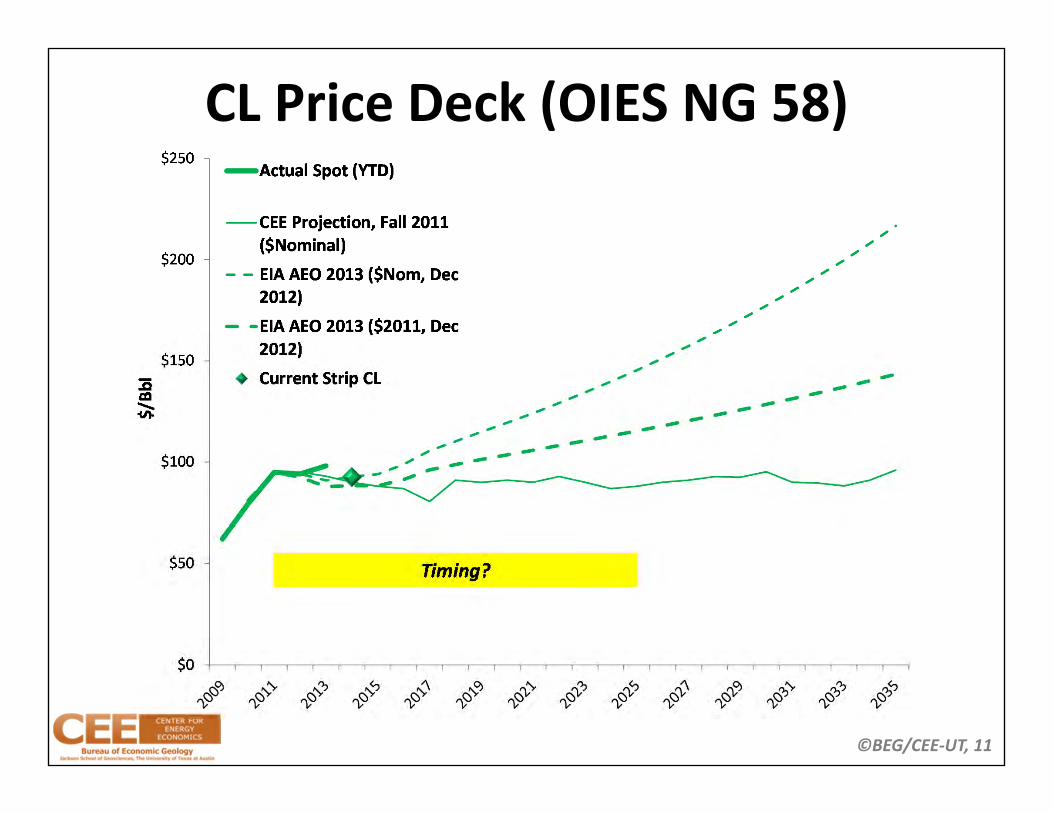
CL Price Deck (OIES NG 58)

©BEG/CEE‐UT, 12Courtesy Dr. Roy Spencer (Dr. John Christy), NOAA‐University of Alabama Huntsville
©BEG/CEE‐UT, 13
O[H] CANADA!North

©BEG/CEE‐UT, 14
North America Energy Integration, 1998Cliff Notes Version
• Finding: Given the treatment of energy in the NAFTA, the lack of clarity with respect to provisions that indirectly impact on energy and the historical, economic, political, legal and technology considerations associated with North American energy, the NAFTA provides only a weak framework for North American gas and electricity integration.– Consequently, trends toward integration are and will be more heavily influenced by other factors – the historical, economic, legal, political and technology contexts for natural gas and electricity development and trade.

©BEG/CEE‐UT, 15
NAEP, cont.
• A “CUS” system for electricity: Will the process for electricity restructuring parallel natural gas restructuring in Canada and the U.S.?– Our analysis of Alternative Future 1 led to a qualified “yes,” within our ten‐year time frame, electricity integration would proceed in a manner similar to that of natural gas.
• Mexico joins the “CUS”: How does Mexico fit into the Canada‐U.S. (CUS) market relationship and process?– Alternative Future 2 failed under the criteria we established.

©BEG/CEE‐UT, 16
CANADA U.S. ISSUESIndustrialCustomers
+ + Industrial customers are positive forces for electricity restructuring; they benefit most from technology change that allows decentralized power purchases
Ratepayers +> + Customer choice in residential markets may occur more quickly in Canada because of the longer, more intense winter heating season
Existing energy industries (gas and electric utilities)
‐> ‐ Existing electric utilities are barriers to electricity restructuring, more so in the case of Canada’s Crown corporations
Potential new players (“energy entrepreneurs”)
+< + Energy entrepreneurs, companies that will drive the direction and pace of restructuring, can play a more effective role in the U.S.
Federal vs. state/provincial regulators, policy makers
‐< ‐ In the CUS, decentralization is both a strength and a weakness but Canada could reach consensus among federal and provincial officials more quickly than the U.S. may among federal and state officials
Environmentalists ‐> ‐ Strategies, focal issues (“the North”) and the level of conflict in Canada appear to be stronger negative influences. Many environmental groups in the U.S. view electricity restructuring to be a strike against policy‐mandated alternative fuels and conservation programs long imposed on utilities.
Alternative Future 1
©BEG/CEE‐UT, 17
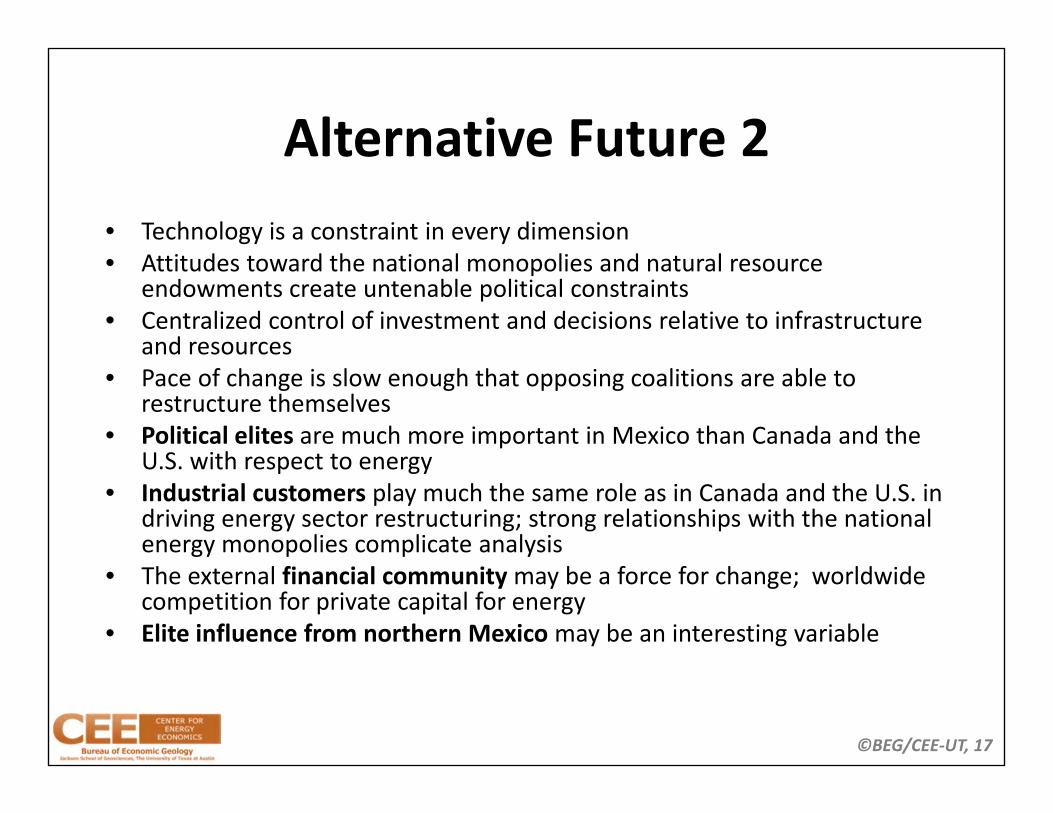
Alternative Future 2• Technology is a constraint in every dimension• Attitudes toward the national monopolies and natural resource
endowments create untenable political constraints• Centralized control of investment and decisions relative to infrastructure
and resources• Pace of change is slow enough that opposing coalitions are able to
restructure themselves• Political elites are much more important in Mexico than Canada and the
U.S. with respect to energy• Industrial customers play much the same role as in Canada and the U.S. in
driving energy sector restructuring; strong relationships with the national energy monopolies complicate analysis
• The external financial communitymay be a force for change; worldwide competition for private capital for energy
• Elite influence from northern Mexicomay be an interesting variable

©BEG/CEE‐UT, 18
MILES AND MILES….Texas

©BEG/CEE‐UT, 19
The Complicated World of Oil & Gas Taxes, I
Employment impacts relative to base case of reduced oil and gas capex with IDC treatment eliminated.• WM = WM/API results• REMI prod+capex = CEE results• REMI prod+capex+subsidy = CEE results with all federal energy subsidies returned to
consumption (all categories)

©BEG/CEE‐UT, 20
The Complicated World of Oil & Gas Taxes, II
Impacts on capex relative to base case of reduced oil and gas capex with IDC treatment eliminated.• WM = WM/API results• REMI prod+capex = CEE results• REMI prod+capex+subsidy = CEE results with all federal energy subsidies returned to
consumption (all categories)

©BEG/CEE‐UT, 21
The Complicated World of Oil & Gas Taxes, III
Impacts on output relative to base case of reduced oil and gas capex with IDC treatment eliminated.• WM = WM/API results• REMI prod+capex = CEE results• REMI prod+capex+subsidy = CEE results with all federal energy subsidies returned to
consumption (all categories)

©BEG/CEE‐UT, 22
Midstream:We Care About NGLs. Why?
• NGL uplift has been helping upstream economics• ~40% of NGL yield is ethane
– Ethylene crackers• Need capacity expansion, 2017‐18• Need export markets
– Methane stream: limited due to pipe gas specs
• ~15% condensate– Cannot blend all with crude oil due to refinery specs– Need to export

©BEG/CEE‐UT, 23
NGL Production‐Source of Ethane
• Excess ethane supply until at least 2017• 2013 S is about 1 MMBPD + 300‐350 MBPD rejected, flared or blended

©BEG/CEE‐UT, 24
NGL Prices
CEE based on CME/NYMEX

©BEG/CEE‐UT, 25
NGLs Values Relative to Crude Oil
CEE based on CME/NYMEX
0%
10%
20%
30%
40%
50%
60%
70%
80%
90%
100%
110%
120%
130%
140%
150%
160%
170%% W
TIPentane (C5) Isobutane (C4+) Butane (C4)Propane (C3) Ethane (C2) Methane (C1)
©BEG/CEE‐UT, 26
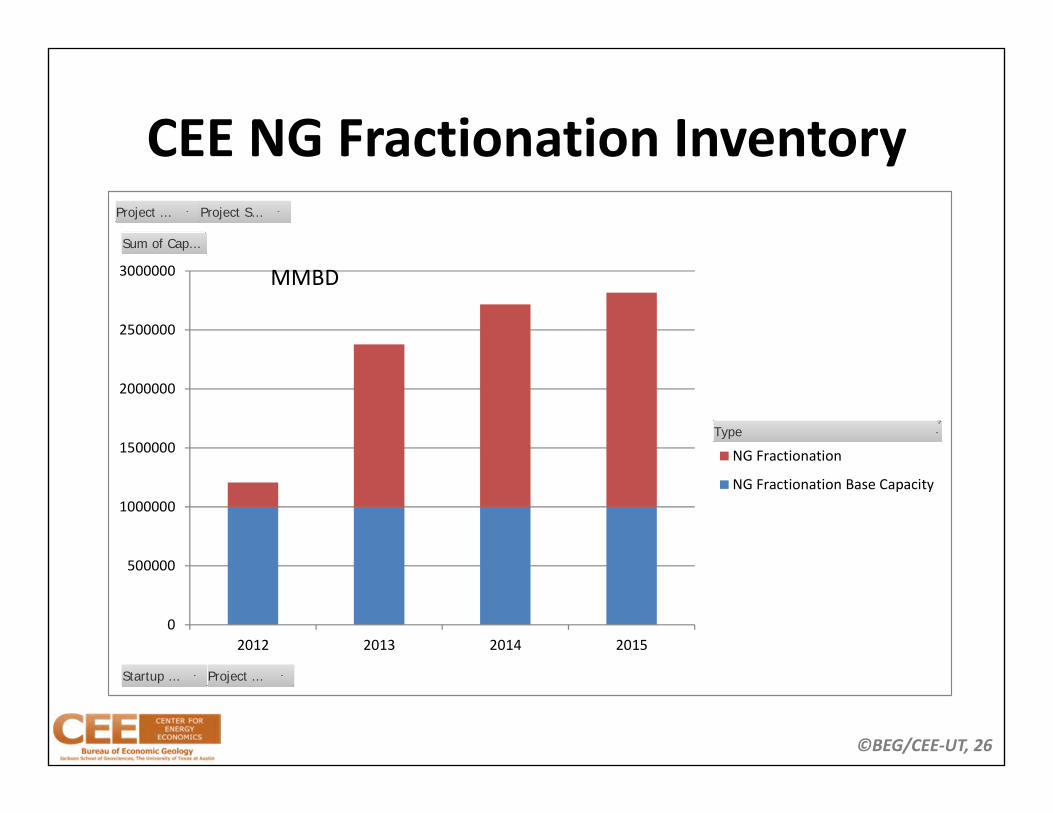
CEE NG Fractionation Inventory
0
500000
1000000
1500000
2000000
2500000
3000000
2012 2013 2014 2015
NG Fractionation
NG Fractionation Base Capacity
Type
Startup ... Project ...
Sum of Cap...
Project ... Project S...
MMBD

©BEG/CEE‐UT, 27
Global Ethylene Capacity
‐
20,000,000
40,000,000
60,000,000
80,000,000
100,000,000
120,000,000
140,000,000
160,000,000Ethylene Capacity (tpy)
Middle East, Africa
Asia Pacific
North America
South America
Eastern Europe
Western Europe
Oil & Gas Journal

©BEG/CEE‐UT, 28
Ethane (and many other) QuestionsProvides uplift to upstream economics
Demand Constrained
Price collapse & rejection uplift
reduced
Need Ethylene Crackers
Need Export Market
Global ethylene capacity Demand ?
Can US ethylene compete if ethane P ?
Without ethane uplift, upstream economics?
Is there a fundamental difference today in how production streams are considered and, if so, implications for: producers, midstream, downstream, customers.Is there more market exposure for production streams that once were embedded in integrated business models?

©BEG/CEE‐UT, 29
CEE Industrial (very) High Case
15
17
19
21
23
25
27
2012 2013 2014 2015 2016 2017 2018 2019 NA
GTL
MTG
Metals
Propylene
Polyethylene
Chlor‐Alkali
Methanol
Ammonia‐urea‐fertilizer
Ethylene Crackers
Base Demand
Type
Startup ... Project ...
Sum of ACC lo...
Project ... Project Status
BCFD

©BEG/CEE‐UT, 30
High Case Construction Impacts OnlyTotal capex: US $98.9bn, Texas $38.4 bn

©BEG/CEE‐UT, 31
GLOBAL ENERGY VIEWSThe Rest

©BEG/CEE‐UT, 32
Energy Exports• Crude oil, product exports – US DOC is gatekeeper
– White House has final say• Any product leaving has to have incoming of like volume or quality– Issue lately with crude shipments by rail
• Fact: Light sweet crude is stuck– Lease condensate as test case
• DOC “tests” are subjective– DOC appetite to review applications is a consideration
• End game – strip DOC of authority– “Outmoded, outdated, inefficient”

©BEG/CEE‐UT, 33
Regulatory Chain
Bureau Of Industry and Security(BIS)
Commerce Control List(CCL) of ECCNs
U.S. Department of Commerce
Part 754 of EAR(Export Administration Regulations)
Supplement No. 1ECCN 1C984
DOE
Supplement No. 1: 1C981-983

©BEG/CEE‐UT, 34
Ramifications of Not Allowing Exports
• Forward curve already collapsed– Reserves reporting and NGLs: At what point do constraints on what can be
produced and sold affect reserves bookings?• Producer effects
– Rash of overleveraged producers collapsing?• Market effects
– Associated gas heavily affected (low oil: high nat gas)• Oil:gas implications
– Vanishing spread – impact on investments• Geopolitics
– OPEC backlash (Iran/Iraq, Iran/Saudi)? Impact on country fiscal balances? But NOCs are expensive and “cost of political stability” is high
• Volatility will be worse because regulatory context will create difficulty in achieving market response– Includes inexperience of new registered futures traders as well as less liquidity

©BEG/CEE‐UT, 35
Ramifications of Allowing Exports
• No infrastructure needed – new capacity already under development
• Refiner positions are mixed• Price of refined products won’t change (except in OK?) – international prices for products will prevail
• National security? Is there a “lobby” for national security?– Outdated laws, regulations– Will FDI sponsors support exports to get higher value for light crude production? What are their real interests?

©BEG/CEE‐UT, 36
Conclusions
Clear as mud

©BEG/CEE‐UT, 37
012345678910111213141516
Low Cost High HH High Cost Europe High Cost Pacific
$/MMBtu
RegasificationShippingLiquefactionHenry Hub
$10/MMBtu NBP
Is U.S. LNG Competitive?
$9/MMBtu European floor
CEE analysis; * Australia bank sources
$15‐16/MMBtu Asia spot
$11/MMBtu Japan 2010
* Value Chain Cost NA to Asia (DES – cost of supply)

©BEG/CEE‐UT, 38
“MÉXICO LINDO Y QUERIDO”South

©BEG/CEE‐UT, 39
GAS‐POWERWorkshop/Scene Setting

©BEG/CEE‐UT, 40
CEE Research Portfolio
• Potential for gas use in power generation– Coal risks: CSAPR/CAIR, MATS, 316 (b) ‐ water use for cooling, coal ash, GHG (federal and/or state)
– Nuclear retirements– Renewables: capacity and capacity factor– Demand response, energy efficiency
• ERCOT resource adequacy– Competitive and mostly isolated ERCOT market is a good testing ground for above‐listed factors as well

©BEG/CEE‐UT, 41
Coal Retirements• Up to 80 GW of coal capacity may retire by 2020
– announced about 26 GW (2014‐2020)– 2.6 GW in 2011; 8 GW in 2012; 2 GW by mid‐2013 already retired
(mostly older, smaller units)

©BEG/CEE‐UT, 42
Nuclear Retirements• 4 recent announcements; more on the way?• Only 1‐2 new plants under construction

©BEG/CEE‐UT, 43
Dampers on Gas Use in Power
• Currently, coal is competitive with gas at $3‐4/MMBtu of gas price
• Renewables capacity has been growing– Better capacity factors for wind– Declining cost of PVs– Storage projects seem to be moving forward
• Smart grid and demand response• Energy efficiency and conservation (EIA AEO 2013 Reference Case: 0.9% annual demand growth; 0.2% in “best technology available” case)

©BEG/CEE‐UT, 44
Competing Views of the World
0.0
0.5
1.0
1.5
2.0
2.5
2010 2015 2020 2025 2030 2035 2040
Consumption of Natural Gas (Index, 2010 = 1)
AEO Real GDP IHS Real GDP AEO Electricity IHS Electricity
Based on data from EIA AEO 2013 & IHS Global Insight
Avg y‐y growth of 2.5%

©BEG/CEE‐UT, 45
A CEE Scenario on Gas Use in Power
0
1
2
3
4
5
6
7
8
9
2030
Qua
ds
Nuclear shutdowns
Change in Gas Price Forecast
Coal risks
U.S. Gas‐Power Linkages: Building Future Views for details: http://www.beg.utexas.edu/energyecon/thinkcorner/Think%20Corner%20Gas‐Power%20Linkages.pdf
1 Quad 1 tcf ~2.7 bcfd

©BEG/CEE‐UT, 46
The ERCOT Market ‐ Basics
• ERCOT is an energy‐only market • Reserve margin target of 13.75% (was 12.5%; might be increased to 16%)
• Rapid demand growth over the last decade• Generation capacity expansion falling behind• Extreme weather in summer of 2011• System‐wide offer cap (price cap) was raised to $4,500 (from $3,000) on August 1, 2012; and will increase to $9,000 by 2015.

©BEG/CEE‐UT, 47
Demand & Generation Growth Mismatch
Peak demand increased >10 GW but net operational capacity declined ~7 GW between 2002 and 2012
Gülen & Soni, The Impacts of Raising the Energy Price Cap in ERCOT, The Electricity Journal, 26(7), 43‐54.

©BEG/CEE‐UT, 48
Why is Generation Falling Behind? Possible Contributing Factors
• Competition works• Low natural gas prices since 2008 low electricity prices tighter margins
• Low price caps & infrequency of price cap hits– Even in August 2011, only 17 hits
• Negative prices due to wind dispatch• Aftershocks of the 2008 crisis: more cautious investment & lending practices

©BEG/CEE‐UT, 49
Wholesale Price in ERCOT
IMM, ERCOT State of the Market 2011 & 2012

©BEG/CEE‐UT, 50
Departure from normal temperature(F) 8/2/2011 – 8/31/2011
Still the question: Was this a “once in 100 years” event or more of a new normal?

©BEG/CEE‐UT, 51
Reserve Margin – Forecasts v Actual
2012 Update 1: de‐mothballed units2012 Update 2: de‐mothballed units, lower demand growth, new resources
Gülen & Soni, The Impacts of Raising the Energy Price Cap in ERCOT, The Electricity Journal, 26(7), 43‐54.
May 2012 CDR
May 2012 CDR Update 1
May 2012 CDR Update 2
Dec 2012 CDR
May 2013 CDR
‐2%
0%
2%
4%
6%
8%
10%
12%
14%
16%
18%
20%
22%
2005 2006 2007 2008 2009 2010 2011 2012 2013 2014 2015 2016 2017 2018 2019 2020 2021 2022
Target Reserve Margin 2005 CDR2006 CDR 2007 CDR2008 CDR 2009 CDR2010 CDR 2011 CDRRealized Reserve Margin May 2012 CDRMay 2012 CDR Update 1 May 2012 CDR Update 2Dec 2012 CDR May 2013 CDR

©BEG/CEE‐UT, 52
Change in Demand Growth Assumption
Gülen & Soni, The Impacts of Raising the Energy Price Cap in ERCOT, The Electricity Journal, 26(7), 43‐54.
0%
1%
2%
3%
4%
5%
6%
65,000
67,000
69,000
71,000
73,000
75,000
77,000
79,000
81,000
83,000
85,000
2013 2014 2015 2016 2017 2018 2019 2020 2021 2022
Annual Grow
th Rate
MW
May 2012 CDR Dec 2012 CDR May CDR Growth Rate Dec CDR Growth Rate

©BEG/CEE‐UT, 53
CDR Revisions
• Lower demand growth scenario from Moody’s since December 2012 CDR
• Going forward, a different approach to estimating demand growth– Weather modeling– Energy efficiency & demand response
• Possible change to target reserve margin (16%)• Wind ELCC to rise from 8.7% to ~14% for West Texas & ~33% for coastal areas
©BEG/CEE‐UT, 54
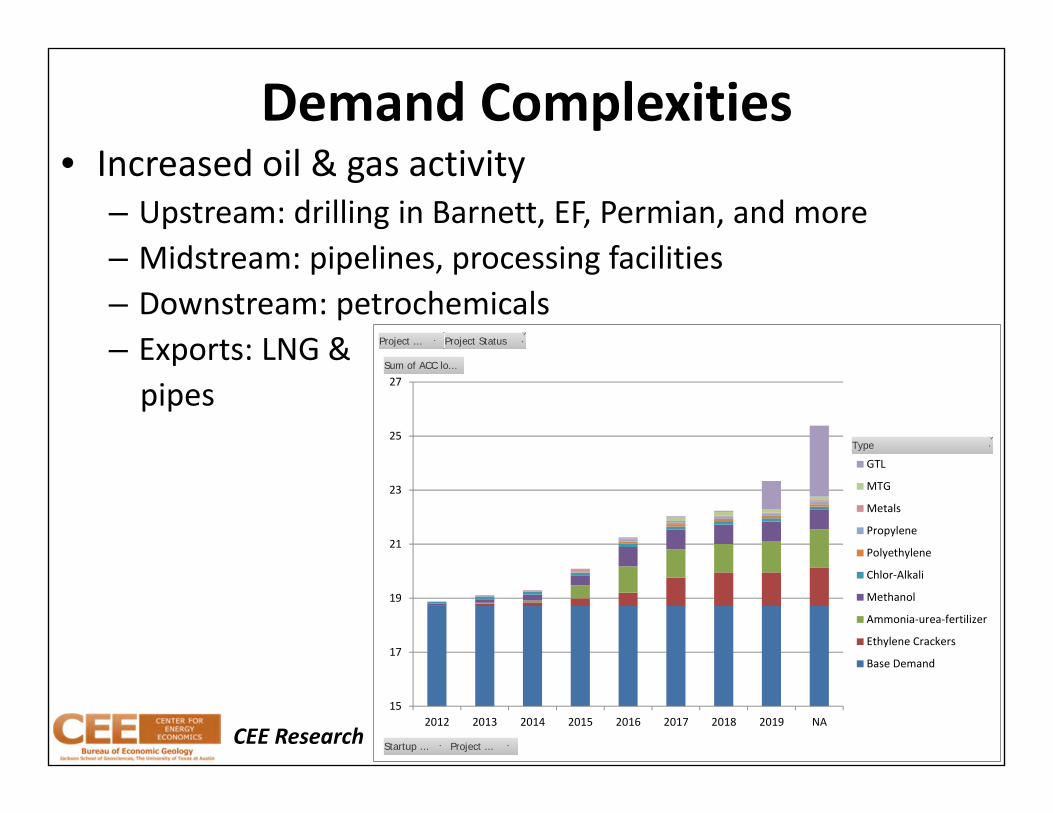
Demand Complexities• Increased oil & gas activity
– Upstream: drilling in Barnett, EF, Permian, and more– Midstream: pipelines, processing facilities– Downstream: petrochemicals– Exports: LNG &pipes
CEE Research 15
17
19
21
23
25
27
2012 2013 2014 2015 2016 2017 2018 2019 NA
GTL
MTG
Metals
Propylene
Polyethylene
Chlor‐Alkali
Methanol
Ammonia‐urea‐fertilizer
Ethylene Crackers
Base Demand
Type
Startup ... Project ...
Sum of ACC lo...
Project ... Project Status

©BEG/CEE‐UT, 55
Generation Interconnection Requests
ERCOT System Planning Report September 2013

©BEG/CEE‐UT, 56
Natural Gas & Wind Dominate
ERCOT System Planning Report September 2013

©BEG/CEE‐UT, 57
Increasing IAs
ERCOT System Planning Report September 2013

©BEG/CEE‐UT, 58
CEE Analysis: Impact of Higher SWOC
Gülen & Soni, The Impacts of Raising the Energy Price Cap in ERCOT, The Electricity Journal, 26(7), 43‐54.

©BEG/CEE‐UT, 59
Impact of Higher Demand Growth & Natural Gas Price Scenarios
Gülen & Soni, The Impacts of Raising the Energy Price Cap in ERCOT, The Electricity Journal, 26(7), 43‐54.

©BEG/CEE‐UT, 60
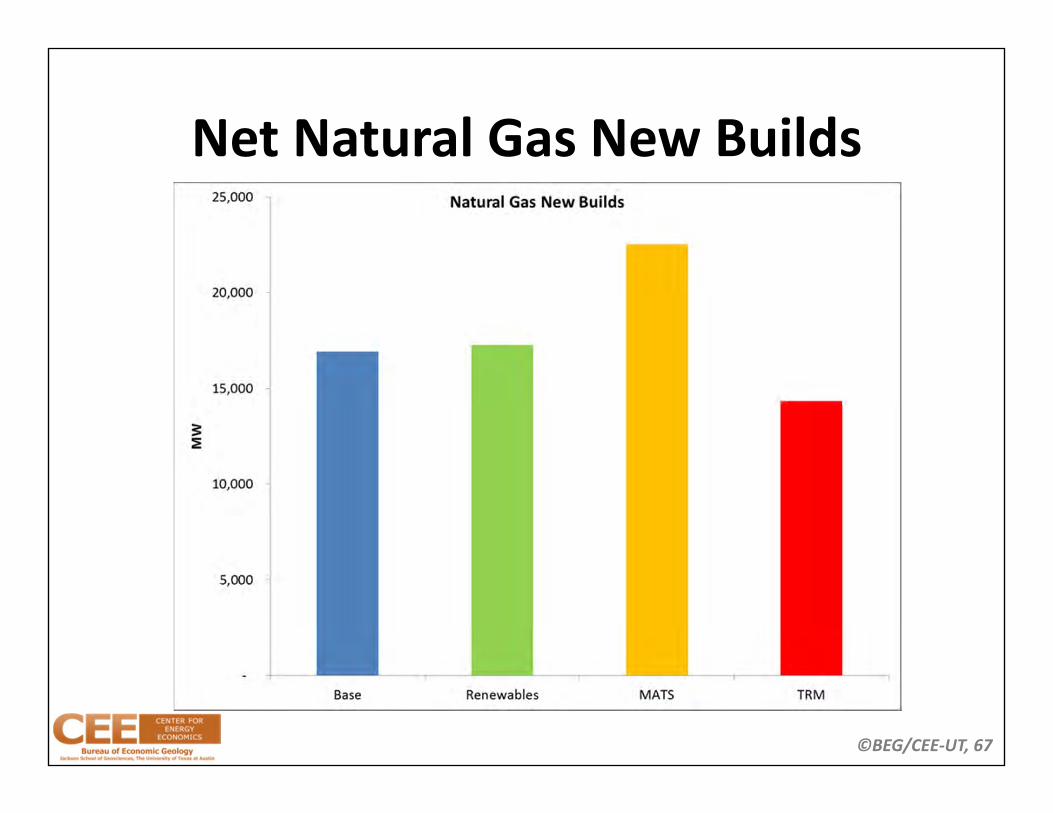
Recent CEE Research
• Base Case—2013 AEO natural gas price forecast and ERCOT low demand growth scenario
• Target Reserve Margin (TRM)—Set target reserve margin equal to 13.75%
• MATS—Added cost compliance with MATS, CSAPR/CAIR, 316 (b) and coal combustion residuals as estimated by ERCOT
• Renewables—Inserted planned renewable builds in ERCOT through 2017 according to SNL/ERCOT data + employed higher ELCC figures

©BEG/CEE‐UT, 61
Retirements (2013‐2023)
• All retirements in the Base Case are natural gas• Under the MATS Case, there are 3.1 GW of coal retirements• Very few retirements in the TRM case due to “capacity payments”
©BEG/CEE‐UT, 62
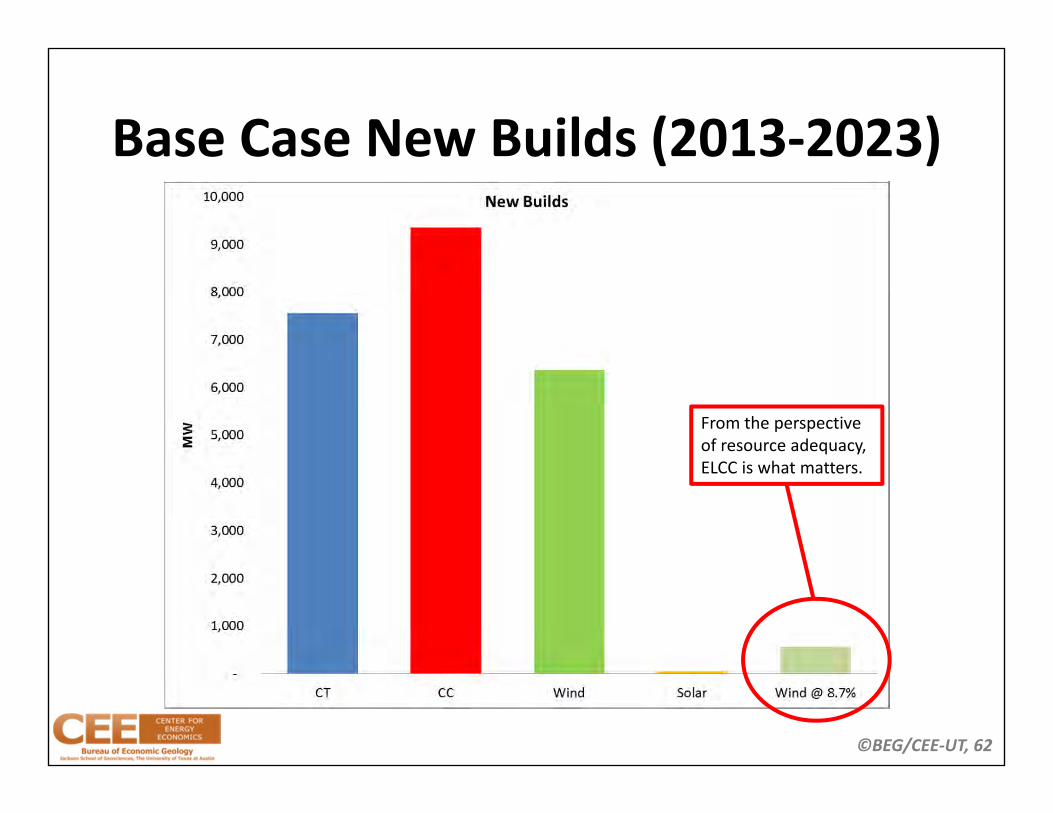
Base Case New Builds (2013‐2023)
From the perspective of resource adequacy, ELCC is what matters.

©BEG/CEE‐UT, 63
TRM Case New Builds (2013‐2023)
• Fewer new builds than the Base Case, especially in CC, due to fewer retirements probably less gas use

©BEG/CEE‐UT, 64
MATS Case New Builds (2013‐2023)
• MATS case brings more CT/CC online to replace lost coal units probably more gas use

©BEG/CEE‐UT, 65
Renewables Case New Builds (2013‐23)
New ELCC: 13% for Western Wind and 30% for Coastal Wind.

©BEG/CEE‐UT, 66
Net Builds(2013‐2023)
©BEG/CEE‐UT, 67
Net Natural Gas New Builds

©BEG/CEE‐UT, 68
Reserve Margin (2013‐2023)
©BEG/CEE‐UT, 69
Going Forward
• Due diligence on recent results• Combined effects (e.g., MATS + renewables)
– Add DR & EE (?)
• Expand to the rest of the US (i.e., update the analysis from early 2012)– Coal & nuclear retirements– Renewables