Improving the Food Environment Through Nutrition Standards: A ...
FOOD STAMP PROGRAMQUALITY CONTROL
ANNUAL REPORT
FISCAL YEAR 2005
U.S. DEPARTMENT OF AGRICULTUREFOOD AND NUTRITION SERVICE
PROGRAM ACCOUNTABILITY DIVISIONQUALITY CONTROL BRANCH
January 2007

TABLE OF CONTENTS INTRODUCTION………..………………..…………………………….………………..……………….i REPORT ORGANIZATION………….……..……..….……………………….…........................…..…ii HIGHLIGHTS……………………………….…………………………………………………….….…iii PART I: QUALITY CONTROL DATA PagePenalties……………………………………………………………………………………………………3 Performance Bonuses….…………………………………………..……………………...........................4 Exhibit 1 State Payment Error Rates - FY 2005……………………………...……………….………..….5 Tables 1 Summary of U.S. Quality Control Findings………………………...…….………………..…...7 2 Active Case Error Rates, FY 2005…………………………………………..……………..….....8 3 State Reported and Official Dollar Error Rates, FY 2005……………….……………..…..….9 4 Official Dollar Error Rates, FY 2004 vs. FY 2005…………………..…………………….…..10 5 Issuance & Issuance in Error, FY 2005………..……………..……...........................................11 Exhibit 2 U.S. Overpayments, Underpayments, and Combined Rates - FY 1996 through FY 2005.....13 Tables 6 Official Combined Payment Error Rates, FY 2001 through FY 2005…………………….....15 7 Official Overpayment Error Rates, FY 2001 through FY 2005…………………...…………16 8 Official Underpayment Error Rates, FY 2001 through FY 2005……………………...……..17 Exhibit 3 U.S. Validated and Reported Negative Case Error Rates, FY 2003 through FY 2005…..…19 Tables 9 Validated Negative Case Error Rates, FY 2001 through FY 2005……...…………………....21 10 Reported vs. Validated Negative Case Error Rates - FY 2005..…………………………...…22 PART II: VARIANCES Notes……………………….………………………………………………………………………...……24 Exhibit 4 Distribution of Variances by Element - All Error Cases……………………..…….….…..….25 Tables 11 Distribution of Variances by Program Factor - All Error Cases……………..……………..27 12 Distribution of Variances by Program Factor - Overpayments………………….…..……...28 13 Distribution of Variances by Program Factor - Underpayments…………………………....29 14 Agency and Client Variances and Case Error Rates - All Error Cases…………………..…30 15 Agency and Client Variances and Case Error Rates - Overpayments………………………31 16 Agency and Client Variances and Case Error Rates - Underpayments………………….....32 17 Distribution of Variances by How Discovered - All Error Cases…………………….……...33 18 Percent of Variances by Time of Occurrence……….……………...........................................34 Exhibit 5 Distribution of Variances by Time of Occurrence…….……….……………………………..35 Tables 19 Agency & Client Dollar Error Rates - All Error Cases.........................……….……..….......37 20 Agency & Client Dollar Error Rates - Overpayments………….………………..….….....…38 21 Agency & Client Dollar Error Rates - Underpayments…………….…………………….….39
TABLE OF CONTENTS CONTINUED Exhibit Page 6 Source of Error Dollars………………………….…………….…………..…….…….…….….41 PART III: COMPARISONS OF BENEFIT AND OVERPAYMENT ERROR DOLLARS BY
HOUSEHOLD CHARACTERISTICS Exhibits 7 Households - Elderly Members…..……..…….………….…….….............................................45 8 Households - Children……………..……..…….………….……..…...........................................47 Tables 22 Elderly……………………………………………………..………..…………………………...49 23 Children……………………………...………………………..……..…………………………..50 24 Non-Citizens……………………..………………………….…..….............................................51 Exhibits 9 Households - Marital & Family Status………………………………..…….………..…..….....53 10 Households - Household Size…………………………….…….....…..........................................55 Tables 25 Marital & Family Status……………………………………………...………………..……......57 26 Household Size……………………..….………………….…….….…………………………….58 27 Source of Income………………………………...……………………………………...…...…..59 Exhibits 11 Households - Countable Resources…………….………….…….…………………………...…61 12 Households - Employment Status……………….……………………………………………...63 PART IV: SAMPLE PARAMETERS Tables 28 Active Cases - Estimated Caseloads, Average Monthly Allotments and Average Monthly
Allotments Per Case, FY 2005………………………..….…………………………..…..…......67 29 Active Case Sample Sizes and Completion Rate, FY 2005.………………………….………..68 30 Active Case Sample Sizes and Standard Errors, FY 2005……………..…..…………….…...69 31 Negative Case Sample Sizes, FY 2005.……………………………...………………….……....70

INTRODUCTION This Food Stamp Program (FSP) Quality Control (QC) Annual Report presents official quality control error rates and other statistical data derived from FSP QC reviews conducted for Fiscal Year (FY) 2005. Each State agency conducts monthly QC reviews of a statistical sample of households participating in the FSP (active cases) and households for which participation was denied or terminated (negative cases). These reviews measure the validity of food stamp cases at a given time. The reported State dollar and case error rates are based on these reviews. The State reviews also provide information on the error cause and characteristics of the household. Additionally, Federal reviews of each State’s sample are conducted annually to validate each State agency’s error rate. The official active error rates listed in this report are based upon the Federal validation reviews of the State agency samples. In a program that provided $28.6 billion in benefits in FY 2005 to needy Americans, more than half of whom are children and the elderly, efficient and effective program administration is essential. Local agencies certify households for food stamp benefits and, along with the State agencies, are directly responsible for operating the FSP. While the Food and Nutrition Service (FNS) can assist States through a variety of methods, the States themselves must ultimately make the commitment to conduct accurate and efficient program operations. FNS remains committed to supporting the ongoing efforts of States to increase the accuracy of food stamp certification actions. To help support these efforts, FNS has undertaken special initiatives designed to
increase payment accuracy. Activities in FY 2005 included: 1) continued funding for State Exchange activity; 2) FNS regional payment accuracy conferences; 3) technical assistance to States; and 4) National and regional publications publicizing successful payment strategies implemented across the country. As a result of these special initiatives and the efforts of individual State agencies, the national payment error rate has declined in FY 2005 for the seventh straight year. In addition to efforts to increase the accuracy of food stamp certification actions, FNS is also continuing to make improvements to the FSP to ensure that it is responsive and effective in its support of those individuals and families who rely on its benefits. This includes making the FSP more visible and accessible to needy individuals and working families. One additional note: The FSP determined that as a result of Hurricane Katrina, there was good cause to not perform QC reviews for the months of June 2005 through September 2005 for Louisiana and Mississippi. As a result, these two States were assigned food stamp quality control error rates for the FY 2005 review period. For this reason, the data presented in this report for these States are not complete. Further information on the FSP may be obtained by referencing the FSP regulations and handbooks, or the FNS website at http://www.fns.usda.gov/fsp. Specific information on the QC process is found in the FNS 310 Handbook, the Food Stamp Program Quality Control Review Handbook. Additional information may also be obtained by contacting the Quality Control Branch at 703-305-2460.
i

REPORT ORGANIZATION
PART I Part I presents official quality control (QC) error rates as well as reported dollar and case error rates. With the passage of the Hunger Prevention Act of 1988, the payment error rate became the sum of the overpayment and underpayment error rates. Therefore, in this report we use the term "combined payment error rate" to reference the sum of the overpayment and underpayment error rates.
PART II Part II provides information on variances. A variance occurs in a case when information verified by the QC reviewer differs from information used at the time of the most recent certification action, when policy has been misapplied for individual elements of eligibility or when the basis of issuance is incorrect. Not all variances result in a case being cited for a dollar error. Only variances occurring in dollar error cases are included in this report. For Tables 19, 20, and 21 we assume that the first variance coded is the primary variance. All error amounts are assigned to this variance. All variances (primary and otherwise) cited for a particular case are included in the remaining Tables.
PART III Part III provides data on the distribution of monthly benefit dollars and overpayment error dollars for selected household characteristics for each State and on a National basis. This information can be used to identify error prone household characteristics by comparing the percent of allotments to the percent of error dollars.
PART IV Part IV provides information on State sampling parameters of the active and negative universes. For active cases we have also included completion rates and standard errors for the reported and regressed payment error rates.
ii

iii
HIGHLIGHTS
Active Cases. The following statistics compare the performance measure for
active cases for FY 2001 through FY 2005:
FY 2001 FY 2002 FY 2003 FY 2004 FY 2005
National-average official
overpayment error rate a/ : 6.47% 6.16% 5.04% 4.48% 4.53%
National-average official
underpayment error rate : 2.19% 2.10% 1.59% 1.41% 1.31%
National-average official
combined error rate (standard
error = approximately 0.14%) b/ : 8.66% 8.26% 6.63% 5.88% 5.84%
Number of States with an official
combined error rate under 6% : 12 13 21 28 32
Number of States with an official
combined error rate over 10% : 9 9 7 2 0
Negative cases. The following compares the performance measures for
reported negative cases for FY 2001 through FY 2005:
FY 2001 FY 2002 FY 2003 FY 2004 FY 2005
National-average negative case
error rate c/ : 8.31% 7.87% 7.64% 6.52% 6.91%
a/ National weighted average for active cases is calculated by weighting each State’s error rate by its actual
issuance.
b/ The official combined rate may not equal the sum of the underpayment and overpayment error rates due
to rounding.
c/ Validated national weighted average is calculated by weighting each State’s error rate by its actual
caseload.
PART I:PART I:QUALITY CONTROL DATAQUALITY CONTROL DATA
Part I presents official quality control (QC) error rates as well as reported dollar and case error rates. With the passage of the Hunger Prevention Act of
1988, the payment error rate became the sum of the overpayment and underpayment error rates.
Therefore, in this report we use the term “combined payment error rate” to reference the sum of the
overpayment and underpayment error rates.

Liability Amounts for Fiscal Year 2005
3
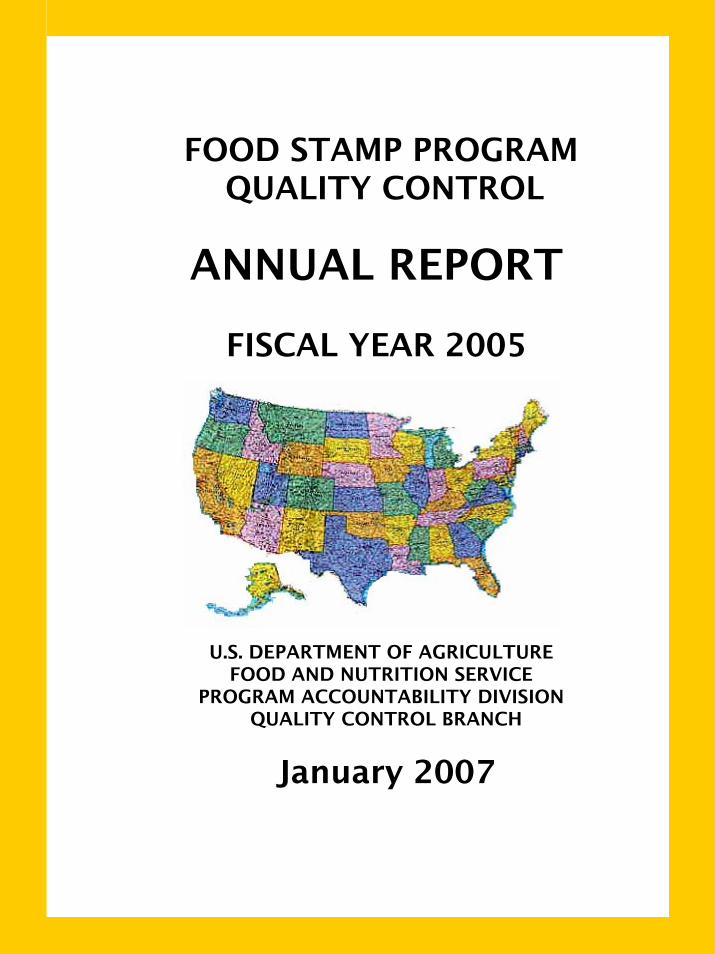
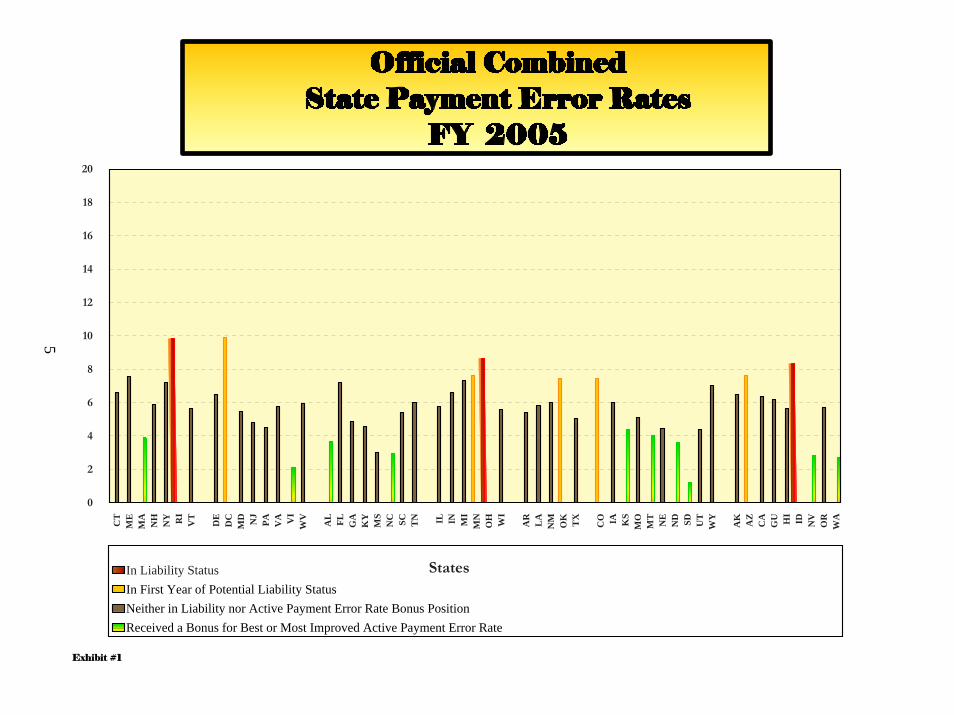
Under the amended Food Stamp Act, a liability shall be established whenever, for 2 consecutive years, there is a 95 percent statistical probability that a State’s payment error rate exceeds 105 percent of the national performance average. In FY 2005, three States’ error rates exceeded the liability level for the second consecutive year and liabilities totaling an aggregate of $3.6 million were established against those States. The Department’s settlement offer to these States was 50 percent designated as at-risk for repayment if the same probability exists again in FY 2006; and 50 percent was designated for new investment activities. In addition to these three states, five additional States exceeded the liability level for the first year. These eight States are potentially liable in FY 2006 should their performance again exceed the liability level. The FY 2005 States assessed liabilities and had a 95 percent statistical probability of their payment error rate exceeding 105 percent of the national performance average are: Assessed a Liability: Idaho $ 240,951 Ohio $ 3,065,580 Rhode Island $ 301,508 Exceeded First Year Liability Level: Arizona Colorado District of Columbia Minnesota Oklahoma
Poorly performing States are not held liable for all errors. Penalties are assessed for only that portion of the error rate that is above 6 percent. To calculate the liability, take the value of all allotments issued by the State agency in the fiscal year, times the difference between 6 percent and the State’s payment error rate, times 10 percent.

Performance Bonuses for Fiscal Year 2005 A total of $48 million in performance bonuses is shared among high performing States in the following categories: • Best and Most Improved Payment Error
Rate ($24 million shared) • Best and Most Improved Negative Error
Rate ($6 million shared)
• Participant Access Rate ($12 million shared)
• Timeliness of Application Processing ($6 million shared)
The amount each State receives within a specific category is prorated based on caseload. The Payment and Negative Error Rate Bonuses are awarded based on QC findings. The FY 2005 awardees for the Payment Error Rate and Negative Error Rate bonuses are: For Best Payment Error Rate: For Best Negative Error Rate: South Dakota Virgin Islands Washington* Nevada* North Carolina North Dakota Alabama* Massachusetts Montana Kansas
$ $ $ $ $ $ $ $ $ $
528,745188,353
4,882,4751,146,4926,648,522
460,9334,336,0063,458,588
759,3041,590,582
Nebraska South Dakota Minnesota Montana
$ $ $ $
1,063,944533,894
2,500,737767,222
For Most Improved Negative Error Rate:
*These States also ranked among the top three Most Improved States.
Delaware Vermont
$ $
602,771531,432
4
CT
ME
MA
NH
NY RI
VT
DE
DC
MD NJ
PA VA VI
WV
AL FL GA
KY
MS
NC SC TN IL IN MI
MN
OH WI
AR
LA
NM OK TX
CO IA KS
MO
MT
NE
ND SD UT
WY
AK AZ
CA
GU HI
ID NV
OR
WA
0
2
4
6
8
10
12
14
16
18
20
In Liability StatusIn First Year of Potential Liability StatusNeither in Liability nor Active Payment Error Rate Bonus PositionReceived a Bonus for Best or Most Improved Active Payment Error Rate
States
Exhibit #1
5

TABLE 1: SUMMARY OF U.S. QUALITY CONTROL FINDINGS FOR FY 04 AND FY 05
FY FY 2004 2005
ACTIVE CASES:
Completed Sample Reviews - State 50,031 47,986
Completed Sample Reviews - Federal 19,433 19,123
Average Monthly Caseload 9,816,604 10,294,858
Estimated Monthly Allotments 1,835,338,257 2,129,307,939
Average Allotment Per Case $195 $207
REPORTED CASE ERROR RATES a/
Underpayment 3.13% 3.12%
Overpayment b/ 7.29% 7.48%
Combined 10.42% 10.59%
OFFICIAL ERROR RATES c/
Underpayment 1.41% 1.31%
Overpayment b/ 4.48% 4.53%
Combined 5.88% 5.84%
NEGATIVE CASES:
Average Monthly Caseload 554,874 582,302
Completed Case Reviews 33,579 32,609
Validated Negative Error Rate 6.52% 6.91%
a/ U.S. case error rates are weighted by State caseloads.
b/ Overpayments include both overpayments to eligible and payments to ineligibles. The reported data for Mississippi and Louisiana is based on 8 months of sample data.
c/ U.S. official error rates are weighted by States' actual issuance data. Fiscal year 2005 official rates for Mississippi and Louisiana were assigned due to Hurricane Katrina.
7

TABLE 2: ACTIVE CASE ERROR RATES, FY 2005
REPORTED CASE ERROR RATESSTATE OVERPAYMENT UNDERPAYMENT COMBINED
Connecticut 6.32 4.70 11.02Maine 9.52 3.31 12.83Massachusetts 5.53 2.50 8.03New Hampshire 5.57 3.43 9.00New York 6.18 3.89 10.07Rhode Island 9.65 5.38 15.03Vermont 8.94 2.42 11.36
Delaware 6.71 4.92 11.63Dist. of Col. 9.56 2.46 12.02Maryland 6.94 3.31 10.25New Jersey 4.67 1.52 6.19Pennsylvania 5.18 2.50 7.68Virginia 7.28 3.01 10.29Virgin Islands 3.75 0.94 4.69West Virginia 8.51 2.20 10.71
Alabama 6.37 1.24 7.61Florida 8.61 2.83 11.44Georgia 7.64 1.99 9.63Kentucky 5.63 2.18 7.81Mississippi a/ 4.64 2.73 7.37North Carolina 4.00 1.56 5.56South Carolina 7.21 1.98 9.19Tennessee 8.12 1.62 9.74
Illinois 8.36 1.54 9.90Indiana 8.73 3.47 12.20Michigan 9.36 3.09 12.45Minnesota 9.43 3.08 12.51Ohio 12.30 4.16 16.46Wisconsin 7.24 5.24 12.48
Arkansas 7.95 2.03 9.98Louisiana a/ 8.22 3.10 11.32New Mexico 8.37 4.10 12.47Oklahoma 10.80 2.48 13.28Texas 6.60 3.68 10.28
Colorado 9.59 5.81 15.40Iowa 9.35 2.38 11.73Kansas 6.46 2.53 8.99Missouri 6.19 2.32 8.51Montana 6.77 1.98 8.75Nebraska 6.65 1.76 8.41North Dakota 4.86 3.42 8.28South Dakota 2.75 0.69 3.44Utah 5.43 2.93 8.36Wyoming 8.12 2.90 11.02
Alaska 9.75 2.50 12.25Arizona 8.46 4.06 12.52California 8.86 5.83 14.69Guam 13.02 10.48 23.50Hawaii 7.86 4.47 12.33Idaho 9.58 5.45 15.03Nevada 3.69 1.72 5.41Oregon 7.60 2.24 9.84Washington 3.48 2.74 6.22
U.S. Average 7.48 3.12 10.59
June 16, 2005 was the cut-off date for error rates used in this report.
a/ Reported rates are based on 8 months of sample data.
8
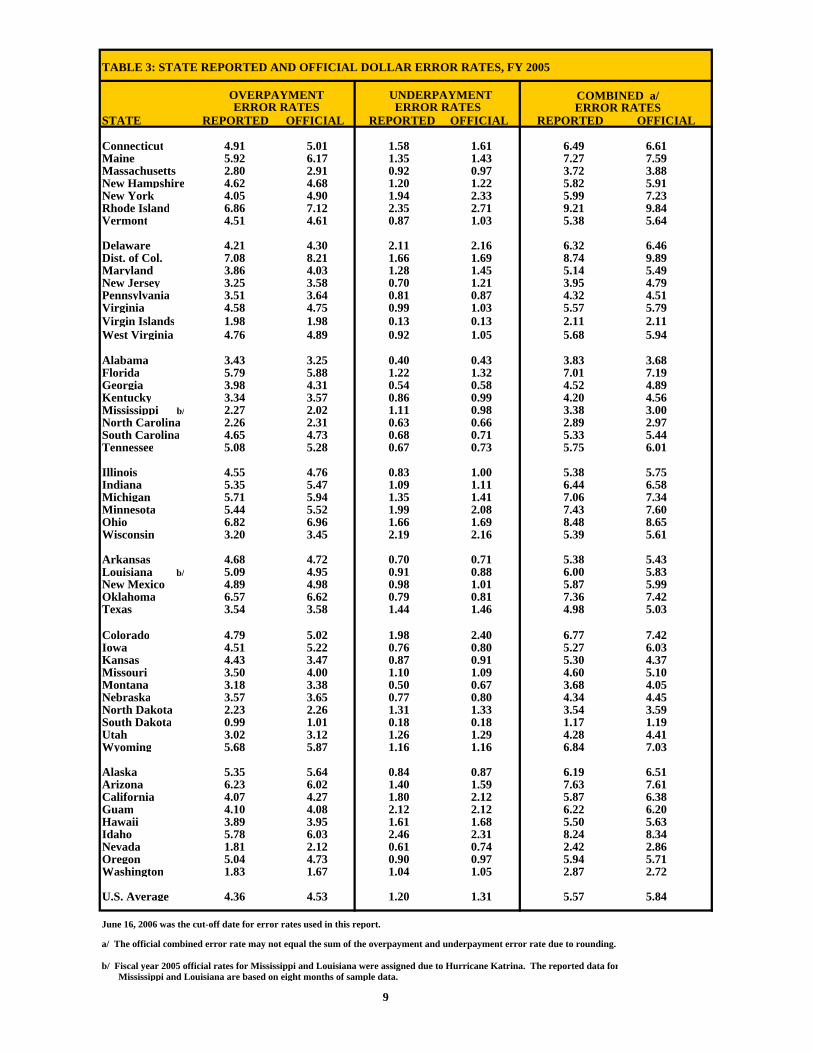
TABLE 3: STATE REPORTED AND OFFICIAL DOLLAR ERROR RATES, FY 2005
COMBINED a/ ERROR RATES
STATE REPORTED OFFICIAL REPORTED OFFICIAL REPORTED OFFICIAL
Connecticut 4.91 5.01 1.58 1.61 6.49 6.61Maine 5.92 6.17 1.35 1.43 7.27 7.59Massachusetts 2.80 2.91 0.92 0.97 3.72 3.88New Hampshire 4.62 4.68 1.20 1.22 5.82 5.91New York 4.05 4.90 1.94 2.33 5.99 7.23Rhode Island 6.86 7.12 2.35 2.71 9.21 9.84Vermont 4.51 4.61 0.87 1.03 5.38 5.64
Delaware 4.21 4.30 2.11 2.16 6.32 6.46Dist. of Col. 7.08 8.21 1.66 1.69 8.74 9.89Maryland 3.86 4.03 1.28 1.45 5.14 5.49New Jersey 3.25 3.58 0.70 1.21 3.95 4.79Pennsylvania 3.51 3.64 0.81 0.87 4.32 4.51Virginia 4.58 4.75 0.99 1.03 5.57 5.79Virgin Islands 1.98 1.98 0.13 0.13 2.11 2.11West Virginia 4.76 4.89 0.92 1.05 5.68 5.94
Alabama 3.43 3.25 0.40 0.43 3.83 3.68Florida 5.79 5.88 1.22 1.32 7.01 7.19Georgia 3.98 4.31 0.54 0.58 4.52 4.89Kentucky 3.34 3.57 0.86 0.99 4.20 4.56Mississippi b/ 2.27 2.02 1.11 0.98 3.38 3.00North Carolina 2.26 2.31 0.63 0.66 2.89 2.97South Carolina 4.65 4.73 0.68 0.71 5.33 5.44Tennessee 5.08 5.28 0.67 0.73 5.75 6.01
Illinois 4.55 4.76 0.83 1.00 5.38 5.75Indiana 5.35 5.47 1.09 1.11 6.44 6.58Michigan 5.71 5.94 1.35 1.41 7.06 7.34Minnesota 5.44 5.52 1.99 2.08 7.43 7.60Ohio 6.82 6.96 1.66 1.69 8.48 8.65Wisconsin 3.20 3.45 2.19 2.16 5.39 5.61
Arkansas 4.68 4.72 0.70 0.71 5.38 5.43Louisiana b/ 5.09 4.95 0.91 0.88 6.00 5.83New Mexico 4.89 4.98 0.98 1.01 5.87 5.99Oklahoma 6.57 6.62 0.79 0.81 7.36 7.42Texas 3.54 3.58 1.44 1.46 4.98 5.03
Colorado 4.79 5.02 1.98 2.40 6.77 7.42Iowa 4.51 5.22 0.76 0.80 5.27 6.03Kansas 4.43 3.47 0.87 0.91 5.30 4.37Missouri 3.50 4.00 1.10 1.09 4.60 5.10Montana 3.18 3.38 0.50 0.67 3.68 4.05Nebraska 3.57 3.65 0.77 0.80 4.34 4.45North Dakota 2.23 2.26 1.31 1.33 3.54 3.59South Dakota 0.99 1.01 0.18 0.18 1.17 1.19Utah 3.02 3.12 1.26 1.29 4.28 4.41Wyoming 5.68 5.87 1.16 1.16 6.84 7.03
Alaska 5.35 5.64 0.84 0.87 6.19 6.51Arizona 6.23 6.02 1.40 1.59 7.63 7.61California 4.07 4.27 1.80 2.12 5.87 6.38Guam 4.10 4.08 2.12 2.12 6.22 6.20Hawaii 3.89 3.95 1.61 1.68 5.50 5.63Idaho 5.78 6.03 2.46 2.31 8.24 8.34Nevada 1.81 2.12 0.61 0.74 2.42 2.86Oregon 5.04 4.73 0.90 0.97 5.94 5.71Washington 1.83 1.67 1.04 1.05 2.87 2.72
U.S. Average 4.36 4.53 1.20 1.31 5.57 5.84
June 16, 2006 was the cut-off date for error rates used in this report.
a/ The official combined error rate may not equal the sum of the overpayment and underpayment error rate due to rounding.
b/ Fiscal year 2005 official rates for Mississippi and Louisiana were assigned due to Hurricane Katrina. The reported data for Mississippi and Louisiana are based on eight months of sample data.
9
UNDERPAYMENTERROR RATES
OVERPAYMENT ERROR RATES
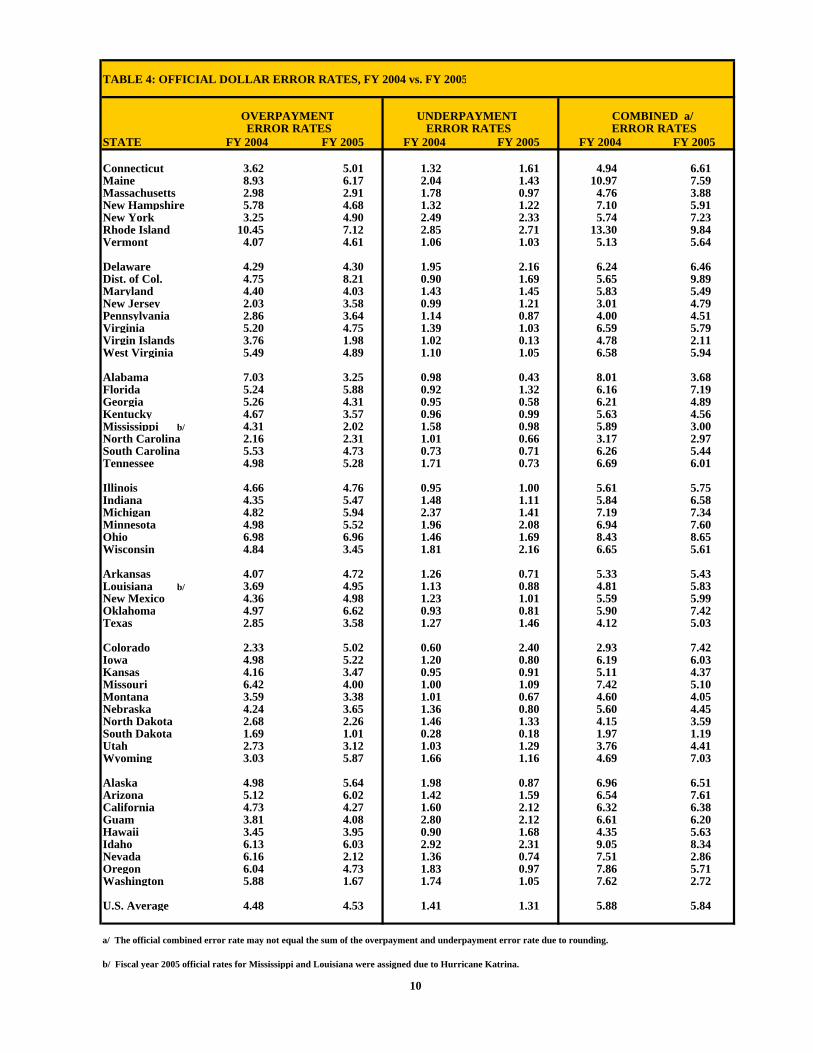
TABLE 4: OFFICIAL DOLLAR ERROR RATES, FY 2004 vs. FY 2005
STATE FY 2004 FY 2005 FY 2004 FY 2005 FY 2004 FY 2005
Connecticut 3.62 5.01 1.32 1.61 4.94 6.61Maine 8.93 6.17 2.04 1.43 10.97 7.59Massachusetts 2.98 2.91 1.78 0.97 4.76 3.88New Hampshire 5.78 4.68 1.32 1.22 7.10 5.91New York 3.25 4.90 2.49 2.33 5.74 7.23Rhode Island 10.45 7.12 2.85 2.71 13.30 9.84Vermont 4.07 4.61 1.06 1.03 5.13 5.64
Delaware 4.29 4.30 1.95 2.16 6.24 6.46Dist. of Col. 4.75 8.21 0.90 1.69 5.65 9.89Maryland 4.40 4.03 1.43 1.45 5.83 5.49New Jersey 2.03 3.58 0.99 1.21 3.01 4.79Pennsylvania 2.86 3.64 1.14 0.87 4.00 4.51Virginia 5.20 4.75 1.39 1.03 6.59 5.79Virgin Islands 3.76 1.98 1.02 0.13 4.78 2.11West Virginia 5.49 4.89 1.10 1.05 6.58 5.94
Alabama 7.03 3.25 0.98 0.43 8.01 3.68Florida 5.24 5.88 0.92 1.32 6.16 7.19Georgia 5.26 4.31 0.95 0.58 6.21 4.89Kentucky 4.67 3.57 0.96 0.99 5.63 4.56Mississippi b/ 4.31 2.02 1.58 0.98 5.89 3.00North Carolina 2.16 2.31 1.01 0.66 3.17 2.97South Carolina 5.53 4.73 0.73 0.71 6.26 5.44Tennessee 4.98 5.28 1.71 0.73 6.69 6.01
Illinois 4.66 4.76 0.95 1.00 5.61 5.75Indiana 4.35 5.47 1.48 1.11 5.84 6.58Michigan 4.82 5.94 2.37 1.41 7.19 7.34Minnesota 4.98 5.52 1.96 2.08 6.94 7.60Ohio 6.98 6.96 1.46 1.69 8.43 8.65Wisconsin 4.84 3.45 1.81 2.16 6.65 5.61
Arkansas 4.07 4.72 1.26 0.71 5.33 5.43Louisiana b/ 3.69 4.95 1.13 0.88 4.81 5.83New Mexico 4.36 4.98 1.23 1.01 5.59 5.99Oklahoma 4.97 6.62 0.93 0.81 5.90 7.42Texas 2.85 3.58 1.27 1.46 4.12 5.03
Colorado 2.33 5.02 0.60 2.40 2.93 7.42Iowa 4.98 5.22 1.20 0.80 6.19 6.03Kansas 4.16 3.47 0.95 0.91 5.11 4.37Missouri 6.42 4.00 1.00 1.09 7.42 5.10Montana 3.59 3.38 1.01 0.67 4.60 4.05Nebraska 4.24 3.65 1.36 0.80 5.60 4.45North Dakota 2.68 2.26 1.46 1.33 4.15 3.59South Dakota 1.69 1.01 0.28 0.18 1.97 1.19Utah 2.73 3.12 1.03 1.29 3.76 4.41Wyoming 3.03 5.87 1.66 1.16 4.69 7.03
Alaska 4.98 5.64 1.98 0.87 6.96 6.51Arizona 5.12 6.02 1.42 1.59 6.54 7.61California 4.73 4.27 1.60 2.12 6.32 6.38Guam 3.81 4.08 2.80 2.12 6.61 6.20Hawaii 3.45 3.95 0.90 1.68 4.35 5.63Idaho 6.13 6.03 2.92 2.31 9.05 8.34Nevada 6.16 2.12 1.36 0.74 7.51 2.86Oregon 6.04 4.73 1.83 0.97 7.86 5.71Washington 5.88 1.67 1.74 1.05 7.62 2.72
U.S. Average 4.48 4.53 1.41 1.31 5.88 5.84
a/ The official combined error rate may not equal the sum of the overpayment and underpayment error rate due to rounding.
b/ Fiscal year 2005 official rates for Mississippi and Louisiana were assigned due to Hurricane Katrina.
10
ERROR RATES COMBINED a/ OVERPAYMENT
ERROR RATES UNDERPAYMENT
ERROR RATES
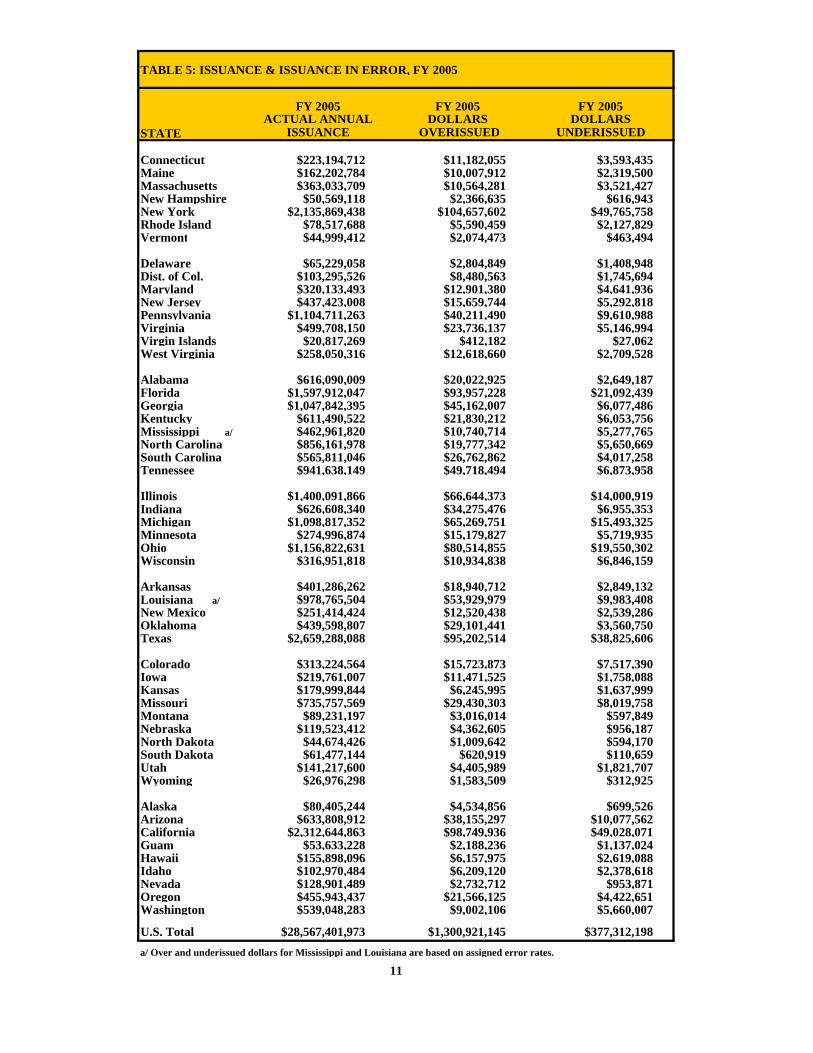
TABLE 5: ISSUANCE & ISSUANCE IN ERROR, FY 2005
STATE
Connecticut $223,194,712 $11,182,055 $3,593,435Maine $162,202,784 $10,007,912 $2,319,500Massachusetts $363,033,709 $10,564,281 $3,521,427New Hampshire $50,569,118 $2,366,635 $616,943New York $2,135,869,438 $104,657,602 $49,765,758Rhode Island $78,517,688 $5,590,459 $2,127,829Vermont $44,999,412 $2,074,473 $463,494
Delaware $65,229,058 $2,804,849 $1,408,948Dist. of Col. $103,295,526 $8,480,563 $1,745,694Maryland $320,133,493 $12,901,380 $4,641,936New Jersey $437,423,008 $15,659,744 $5,292,818Pennsylvania $1,104,711,263 $40,211,490 $9,610,988Virginia $499,708,150 $23,736,137 $5,146,994Virgin Islands $20,817,269 $412,182 $27,062West Virginia $258,050,316 $12,618,660 $2,709,528
Alabama $616,090,009 $20,022,925 $2,649,187Florida $1,597,912,047 $93,957,228 $21,092,439Georgia $1,047,842,395 $45,162,007 $6,077,486Kentucky $611,490,522 $21,830,212 $6,053,756Mississippi a/ $462,961,820 $10,740,714 $5,277,765North Carolina $856,161,978 $19,777,342 $5,650,669South Carolina $565,811,046 $26,762,862 $4,017,258Tennessee $941,638,149 $49,718,494 $6,873,958
Illinois $1,400,091,866 $66,644,373 $14,000,919Indiana $626,608,340 $34,275,476 $6,955,353Michigan $1,098,817,352 $65,269,751 $15,493,325Minnesota $274,996,874 $15,179,827 $5,719,935Ohio $1,156,822,631 $80,514,855 $19,550,302Wisconsin $316,951,818 $10,934,838 $6,846,159
Arkansas $401,286,262 $18,940,712 $2,849,132Louisiana a/ $978,765,504 $53,929,979 $9,983,408New Mexico $251,414,424 $12,520,438 $2,539,286Oklahoma $439,598,807 $29,101,441 $3,560,750Texas $2,659,288,088 $95,202,514 $38,825,606
Colorado $313,224,564 $15,723,873 $7,517,390Iowa $219,761,007 $11,471,525 $1,758,088Kansas $179,999,844 $6,245,995 $1,637,999Missouri $735,757,569 $29,430,303 $8,019,758Montana $89,231,197 $3,016,014 $597,849Nebraska $119,523,412 $4,362,605 $956,187North Dakota $44,674,426 $1,009,642 $594,170South Dakota $61,477,144 $620,919 $110,659Utah $141,217,600 $4,405,989 $1,821,707Wyoming $26,976,298 $1,583,509 $312,925
Alaska $80,405,244 $4,534,856 $699,526Arizona $633,808,912 $38,155,297 $10,077,562California $2,312,644,863 $98,749,936 $49,028,071Guam $53,633,228 $2,188,236 $1,137,024Hawaii $155,898,096 $6,157,975 $2,619,088Idaho $102,970,484 $6,209,120 $2,378,618Nevada $128,901,489 $2,732,712 $953,871Oregon $455,943,437 $21,566,125 $4,422,651Washington $539,048,283 $9,002,106 $5,660,007
U.S. Total $28,567,401,973 $1,300,921,145 $377,312,198a/ Over and underissued dollars for Mississippi and Louisiana are based on assigned error rates.
11
FY 2005ACTUAL ANNUAL
ISSUANCE
FY 2005DOLLARS
OVERISSUED
FY 2005DOLLARS
UNDERISSUED

+
+
+
+
+
+ ++
+
+
0.00
2.00
4.00
6.00
8.00
10.00
12.00
1996 1997 1998 1999 2000 2001 2002 2003 2004 2005Combined 9.23 9.75 10.70 9.86 8.91 8.66 8.26 6.63 5.88 5.84
Overpymnts 6.92 7.28 7.63 7.01 6.51 6.47 6.15 5.04 4.48 4.53Underpymnts 2.31 2.47 3.07 2.85 2.40 2.19 2.10 1.59 1.41 1.31
+
Exhibit #2
13

TABLE 6: OFFICIAL COMBINED PAYMENT ERROR RATES, FY 2001 - FY 2005
STATE FY 2001 FY 2002 FY 2003 FY 2004 FY 2005
Connecticut 9.86 11.70 8.77 4.94 6.61Maine 8.49 6.26 13.29 10.97 7.59Massachusetts 8.50 8.40 4.99 4.76 3.88New Hampshire 10.99 12.03 7.52 7.10 5.91New York 8.61 7.75 5.88 5.74 7.23Rhode Island 5.56 10.21 8.94 13.30 9.84Vermont 10.95 7.68 8.52 5.13 5.64
Delaware 10.02 8.46 5.38 6.24 6.46Dist. of Col. 11.38 8.75 8.97 5.65 9.89Maryland 8.92 8.80 7.23 5.83 5.49New Jersey 7.97 4.08 2.43 3.01 4.79Pennsylvania 8.29 9.49 8.21 4.00 4.51Virginia 8.07 6.74 5.46 6.59 5.79Virgin Islands 4.70 5.72 6.88 4.78 2.11West Virginia 6.78 7.13 6.21 6.58 5.94
Alabama 9.76 8.74 8.02 8.01 3.68Florida 9.80 9.61 7.93 6.16 7.19Georgia 6.42 6.73 5.15 6.21 4.89Kentucky 7.53 7.71 6.32 5.63 4.56Mississippi a/ 3.47 4.39 4.07 5.89 3.00North Carolina 6.35 4.70 4.94 3.17 2.97South Carolina 4.62 4.40 4.94 6.26 5.44Tennessee 6.22 7.02 7.20 6.69 6.01
Illinois 8.19 8.75 4.87 5.61 5.75Indiana 6.83 8.31 10.00 5.84 6.58Michigan 13.93 14.10 11.10 7.19 7.34Minnesota 5.22 5.73 7.96 6.94 7.60Ohio 8.48 6.50 6.61 8.43 8.65Wisconsin 13.14 12.69 9.32 6.65 5.61
Arkansas 3.24 4.29 4.02 5.33 5.43Louisiana a/ 5.78 5.78 5.79 4.81 5.83New Mexico 6.65 6.71 6.16 5.59 5.99Oklahoma 8.23 7.94 8.98 5.90 7.42Texas 3.73 4.85 3.29 4.12 5.03
Colorado 8.53 9.66 7.40 2.93 7.42Iowa 7.05 6.44 5.23 6.19 6.03Kansas 10.37 11.70 10.45 5.11 4.37Missouri 10.21 9.77 6.75 7.42 5.10Montana 8.15 8.18 5.78 4.60 4.05Nebraska 8.44 7.02 7.24 5.60 4.45North Dakota 5.96 6.14 4.85 4.15 3.59South Dakota 2.11 2.12 1.16 1.97 1.19Utah 9.04 6.60 5.00 3.76 4.41Wyoming 3.04 3.29 4.23 4.69 7.03
Alaska 9.69 10.99 13.88 6.96 6.51Arizona 5.79 5.27 5.83 6.54 7.61California 17.37 14.84 7.96 6.32 6.38Guam 9.22 6.05 7.04 6.61 6.20Hawaii 6.53 5.03 4.78 4.35 5.63Idaho 7.41 9.04 11.31 9.05 8.34Nevada 8.00 6.41 8.25 7.51 2.86Oregon 9.76 11.07 13.00 7.86 5.71Washington 8.53 8.16 6.28 7.62 2.72
U.S. Average 8.66 8.26 6.63 5.88 5.84
a/ Fiscal year 2005 official rates for Mississippi and Louisiana were assigned due to Hurricane Katrina.
15

TABLE 7: OFFICIAL OVERPAYMENT ERROR RATES, FY 2001 - FY 2005
STATE FY 2001 FY 2002 FY 2003 FY 2004 FY 2005
Connecticut 7.24 8.74 7.02 3.62 5.01Maine 6.92 4.19 10.16 8.93 6.17Massachusetts 6.30 6.28 3.57 2.98 2.91New Hampshire 8.86 10.56 6.27 5.78 4.68New York 5.36 5.33 3.67 3.25 4.90Rhode Island 4.00 7.58 7.04 10.45 7.12Vermont 9.02 6.83 6.99 4.07 4.61
Delaware 6.67 5.23 4.07 4.29 4.30Dist. of Col. 8.48 6.62 7.08 4.75 8.21Maryland 6.83 6.05 5.12 4.40 4.03New Jersey 6.09 3.20 1.83 2.03 3.58Pennsylvania 5.66 7.54 6.24 2.86 3.64Virginia 5.13 4.82 4.13 5.20 4.75Virgin Islands 3.34 4.16 5.87 3.76 1.98West Virginia 5.79 5.47 4.80 5.49 4.89
Alabama 8.67 7.57 6.87 7.03 3.25Florida 7.45 7.42 5.50 5.24 5.88Georgia 4.99 5.59 4.00 5.26 4.31Kentucky 5.74 6.27 5.10 4.67 3.57Mississippi a/ 2.39 3.50 3.07 4.31 2.02North Carolina 5.47 3.59 3.94 2.16 2.31South Carolina 3.43 4.18 4.22 5.53 4.73Tennessee 5.04 6.06 6.13 4.98 5.28
Illinois 6.87 7.32 4.10 4.66 4.76Indiana 4.98 5.90 7.94 4.35 5.47Michigan 9.82 9.54 8.25 4.82 5.94Minnesota 3.63 4.51 5.99 4.98 5.52Ohio 6.63 4.51 5.09 6.98 6.96Wisconsin 9.26 9.19 6.78 4.84 3.45
Arkansas 2.64 3.53 3.52 4.07 4.72Louisiana a/ 4.31 3.88 4.41 3.69 4.95New Mexico 5.33 5.54 4.86 4.36 4.98Oklahoma 6.74 6.10 7.83 4.97 6.62Texas 2.71 3.47 2.23 2.85 3.58
Colorado 6.76 7.23 6.08 2.33 5.02Iowa 5.83 4.79 4.13 4.98 5.22Kansas 8.79 8.95 8.04 4.16 3.47Missouri 8.14 7.88 5.37 6.42 4.00Montana 6.62 6.53 4.92 3.59 3.38Nebraska 7.10 5.20 5.67 4.24 3.65North Dakota 3.89 3.99 3.80 2.68 2.26South Dakota 1.82 1.73 0.90 1.69 1.01Utah 6.85 4.88 3.40 2.73 3.12Wyoming 2.14 2.84 3.03 3.03 5.87
Alaska 7.82 8.23 10.84 4.98 5.64Arizona 4.48 3.86 4.71 5.12 6.02California 12.64 10.15 5.71 4.73 4.27Guam 5.80 4.14 4.64 3.81 4.08Hawaii 4.79 3.67 3.45 3.45 3.95Idaho 4.77 5.66 7.90 6.13 6.03Nevada 6.01 5.49 6.46 6.16 2.12Oregon 8.23 8.40 10.70 6.04 4.73Washington 6.47 5.96 5.02 5.88 1.67
U.S. Average 6.47 6.15 5.04 4.48 4.53
a/ Fiscal year 2005 official rates for Mississippi and Louisiana were assigned due to Hurricane Katrina.
16

TABLE 8: OFFICIAL UNDERPAYMENT ERROR RATES, FY 2001 - FY 2005
STATE FY 2001 FY 2002 FY 2003 FY 2004 FY 2005
Connecticut 2.62 2.96 1.75 1.32 1.61Maine 1.57 2.07 3.13 2.04 1.43Massachusetts 2.20 2.11 1.42 1.78 0.97New Hampshire 2.13 1.46 1.25 1.32 1.22New York 3.25 2.41 2.21 2.49 2.33Rhode Island 1.56 2.63 1.90 2.85 2.71Vermont 1.93 0.85 1.53 1.06 1.03
Delaware 3.34 3.24 1.31 1.95 2.16Dist. of Col. 2.90 2.14 1.89 0.90 1.69Maryland 2.09 2.75 2.11 1.43 1.45New Jersey 1.88 0.87 0.60 0.99 1.21Pennsylvania 2.63 1.95 1.97 1.14 0.87Virginia 2.94 1.92 1.33 1.39 1.03Virgin Islands 1.36 1.55 1.00 1.02 0.13West Virginia 1.00 1.66 1.42 1.10 1.05
Alabama 1.09 1.16 1.14 0.98 0.43Florida 2.35 2.19 2.43 0.92 1.32Georgia 1.43 1.14 1.16 0.95 0.58Kentucky 1.79 1.44 1.22 0.96 0.99Mississippi a/ 1.08 0.89 1.00 1.58 0.98North Carolina 0.88 1.11 1.00 1.01 0.66South Carolina 1.19 0.23 0.71 0.73 0.71Tennessee 1.18 0.97 1.07 1.71 0.73
Illinois 1.32 1.42 0.77 0.95 1.00Indiana 1.85 2.40 2.06 1.48 1.11Michigan 4.11 4.56 2.85 2.37 1.41Minnesota 1.59 1.22 1.98 1.96 2.08Ohio 1.85 1.99 1.52 1.46 1.69Wisconsin 3.88 3.49 2.54 1.81 2.16
Arkansas 0.60 0.75 0.50 1.26 0.71Louisiana a/ 1.48 1.90 1.38 1.13 0.88New Mexico 1.31 1.17 1.30 1.23 1.01Oklahoma 1.49 1.84 1.15 0.93 0.81Texas 1.02 1.38 1.06 1.27 1.46
Colorado 1.77 2.43 1.32 0.60 2.40Iowa 1.23 1.65 1.10 1.20 0.80Kansas 1.58 2.75 2.41 0.95 0.91Missouri 2.07 1.89 1.38 1.00 1.09Montana 1.54 1.64 0.86 1.01 0.67Nebraska 1.34 1.82 1.57 1.36 0.80North Dakota 2.08 2.14 1.04 1.46 1.33South Dakota 0.29 0.39 0.25 0.28 0.18Utah 2.18 1.72 1.60 1.03 1.29Wyoming 0.90 0.45 1.20 1.66 1.16
Alaska 1.87 2.76 3.04 1.98 0.87Arizona 1.31 1.41 1.13 1.42 1.59California 4.73 4.69 2.25 1.60 2.12Guam 3.43 1.91 2.40 2.80 2.12Hawaii 1.74 1.36 1.33 0.90 1.68Idaho 2.64 3.39 3.41 2.92 2.31Nevada 1.98 0.92 1.79 1.36 0.74Oregon 1.52 2.66 2.30 1.83 0.97Washington 2.05 2.20 1.26 1.74 1.05
U.S. Average 2.19 2.10 1.59 1.41 1.31
a/ Fiscal year 2005 official rates for Mississippi and Louisiana were assigned due to Hurricane Katrina.
17

7.646.52 6.91
5.615.15
6.12
FY 2003
FY 2004
FY 2005
0
2
4
6
8
Validated
Reported
Exhibit # 3
19
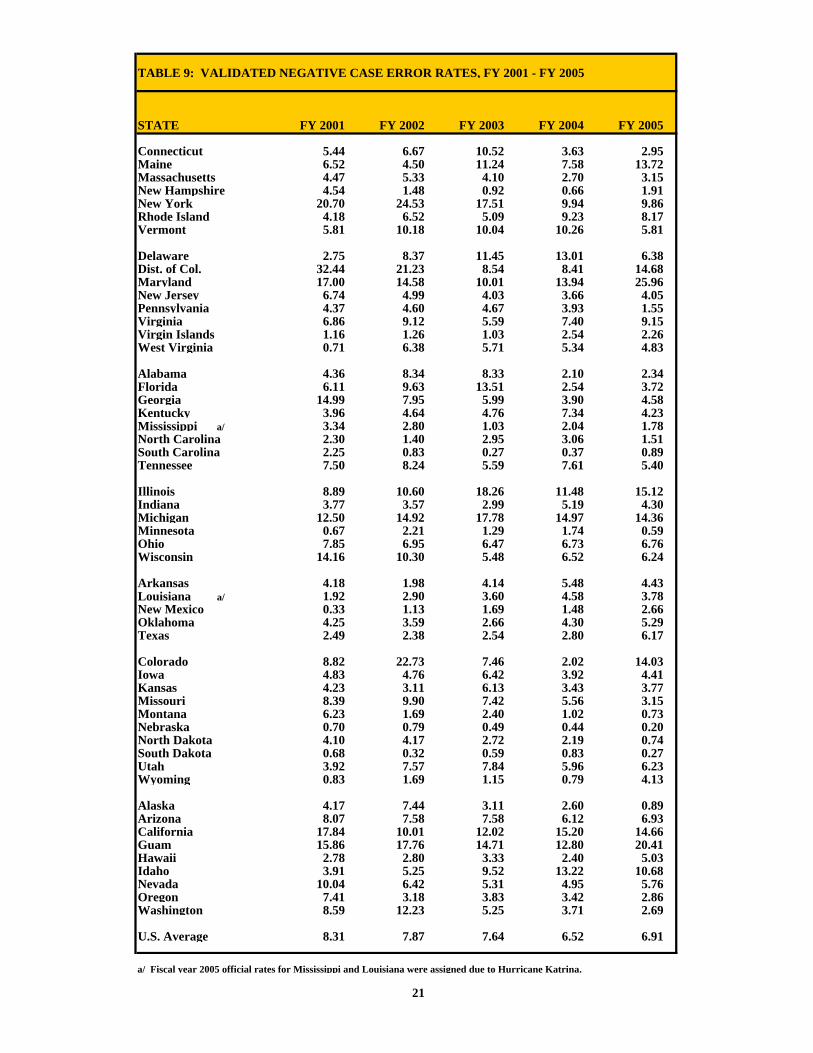
TABLE 9: VALIDATED NEGATIVE CASE ERROR RATES, FY 2001 - FY 2005
STATE FY 2001 FY 2002 FY 2003 FY 2004 FY 2005
Connecticut 5.44 6.67 10.52 3.63 2.95Maine 6.52 4.50 11.24 7.58 13.72Massachusetts 4.47 5.33 4.10 2.70 3.15New Hampshire 4.54 1.48 0.92 0.66 1.91New York 20.70 24.53 17.51 9.94 9.86Rhode Island 4.18 6.52 5.09 9.23 8.17Vermont 5.81 10.18 10.04 10.26 5.81
Delaware 2.75 8.37 11.45 13.01 6.38Dist. of Col. 32.44 21.23 8.54 8.41 14.68Maryland 17.00 14.58 10.01 13.94 25.96New Jersey 6.74 4.99 4.03 3.66 4.05Pennsylvania 4.37 4.60 4.67 3.93 1.55Virginia 6.86 9.12 5.59 7.40 9.15Virgin Islands 1.16 1.26 1.03 2.54 2.26West Virginia 0.71 6.38 5.71 5.34 4.83
Alabama 4.36 8.34 8.33 2.10 2.34Florida 6.11 9.63 13.51 2.54 3.72Georgia 14.99 7.95 5.99 3.90 4.58Kentucky 3.96 4.64 4.76 7.34 4.23Mississippi a/ 3.34 2.80 1.03 2.04 1.78North Carolina 2.30 1.40 2.95 3.06 1.51South Carolina 2.25 0.83 0.27 0.37 0.89Tennessee 7.50 8.24 5.59 7.61 5.40
Illinois 8.89 10.60 18.26 11.48 15.12Indiana 3.77 3.57 2.99 5.19 4.30Michigan 12.50 14.92 17.78 14.97 14.36Minnesota 0.67 2.21 1.29 1.74 0.59Ohio 7.85 6.95 6.47 6.73 6.76Wisconsin 14.16 10.30 5.48 6.52 6.24
Arkansas 4.18 1.98 4.14 5.48 4.43Louisiana a/ 1.92 2.90 3.60 4.58 3.78New Mexico 0.33 1.13 1.69 1.48 2.66Oklahoma 4.25 3.59 2.66 4.30 5.29Texas 2.49 2.38 2.54 2.80 6.17
Colorado 8.82 22.73 7.46 2.02 14.03Iowa 4.83 4.76 6.42 3.92 4.41Kansas 4.23 3.11 6.13 3.43 3.77Missouri 8.39 9.90 7.42 5.56 3.15Montana 6.23 1.69 2.40 1.02 0.73Nebraska 0.70 0.79 0.49 0.44 0.20North Dakota 4.10 4.17 2.72 2.19 0.74South Dakota 0.68 0.32 0.59 0.83 0.27Utah 3.92 7.57 7.84 5.96 6.23Wyoming 0.83 1.69 1.15 0.79 4.13
Alaska 4.17 7.44 3.11 2.60 0.89Arizona 8.07 7.58 7.58 6.12 6.93California 17.84 10.01 12.02 15.20 14.66Guam 15.86 17.76 14.71 12.80 20.41Hawaii 2.78 2.80 3.33 2.40 5.03Idaho 3.91 5.25 9.52 13.22 10.68Nevada 10.04 6.42 5.31 4.95 5.76Oregon 7.41 3.18 3.83 3.42 2.86Washington 8.59 12.23 5.25 3.71 2.69
U.S. Average 8.31 7.87 7.64 6.52 6.91
a/ Fiscal year 2005 official rates for Mississippi and Louisiana were assigned due to Hurricane Katrina.
21
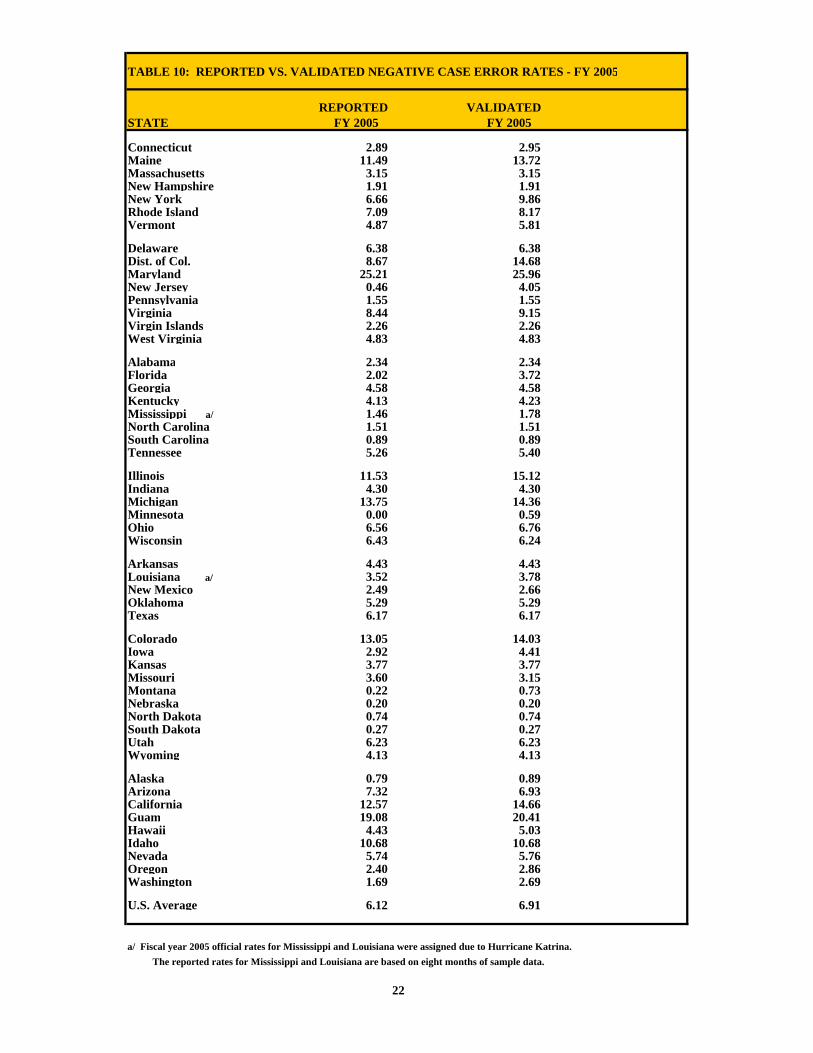
TABLE 10: REPORTED VS. VALIDATED NEGATIVE CASE ERROR RATES - FY 2005
STATE FY 2005 FY 2005
Connecticut 2.89 2.95Maine 11.49 13.72Massachusetts 3.15 3.15New Hampshire 1.91 1.91New York 6.66 9.86Rhode Island 7.09 8.17Vermont 4.87 5.81
Delaware 6.38 6.38Dist. of Col. 8.67 14.68Maryland 25.21 25.96New Jersey 0.46 4.05Pennsylvania 1.55 1.55Virginia 8.44 9.15Virgin Islands 2.26 2.26West Virginia 4.83 4.83
Alabama 2.34 2.34Florida 2.02 3.72Georgia 4.58 4.58Kentucky 4.13 4.23Mississippi a/ 1.46 1.78North Carolina 1.51 1.51South Carolina 0.89 0.89Tennessee 5.26 5.40
Illinois 11.53 15.12Indiana 4.30 4.30Michigan 13.75 14.36Minnesota 0.00 0.59Ohio 6.56 6.76Wisconsin 6.43 6.24
Arkansas 4.43 4.43Louisiana a/ 3.52 3.78New Mexico 2.49 2.66Oklahoma 5.29 5.29Texas 6.17 6.17
Colorado 13.05 14.03Iowa 2.92 4.41Kansas 3.77 3.77Missouri 3.60 3.15Montana 0.22 0.73Nebraska 0.20 0.20North Dakota 0.74 0.74South Dakota 0.27 0.27Utah 6.23 6.23Wyoming 4.13 4.13
Alaska 0.79 0.89Arizona 7.32 6.93California 12.57 14.66Guam 19.08 20.41Hawaii 4.43 5.03Idaho 10.68 10.68Nevada 5.74 5.76Oregon 2.40 2.86Washington 1.69 2.69
U.S. Average 6.12 6.91
a/ Fiscal year 2005 official rates for Mississippi and Louisiana were assigned due to Hurricane Katrina. The reported rates for Mississippi and Louisiana are based on eight months of sample data.
22
REPORTED VALIDATED

PART II:VARIANCES
Part II provides information on variances. A variance occurs in a case when information verified by the QC reviewer differs from information used at the time of the most recent certification action, when policy has been misapplied for individual elements of eligibility or the basis of issuance is incorrect. Not all
variances result in a case being cited for a dollar error.
Only variances occurring in dollar error cases are included in this report. For Tables 19, 20, and 21 we
assume that the first variance coded is the primary variance. All error amounts are assigned to this
variance. All variances (primary and otherwise) cited for a particular case are included in the remaining
Tables.

VARIANCES What is a variance? Variances occur when information verified by the QC reviewer differs from information used at the time of the most recent certification action or when policy has been misapplied for individual elements of eligibility or the basis of issuance is incorrect. Not all variances result in a case being cited for a dollar error.
What variances are included in this report? Only variances occurring in dollar error cases are included in this report. For all variance tables, other than Tables 19, 20, and 21, all variances cited in the case are included. For Tables 19, 20, and 21 we assume that the first variance coded is the primary variance. All error amounts are assigned to this variance.
What are the Program factors referred to in Tables 11 through 13? NON-FINANCIAL ELIGIBILITY refers to non-financial factors considered in determining a household's eligibility. These include Age & Student Status, Citizenship & Non-Citizenship, Residency, Household Composition, Work Requirements, and Social Security Number. INCOME refers to a household's Earned (Wages & Salaries, Self-employment, etc.) or Unearned Income (Veterans Benefits, Unemployment Compensation, Worker's Compensation, and Other Government Programs (PA, RSDI, SSI, etc.)) OTHER refers to variances occurring in areas such as Arithmetic Computation, Monthly Reporting, FS Simplification Project, and Demonstration Projects.
DEDUCTIONS refer to the allowed deductions from a household's gross income. These include the Earned Income, Dependent Care, Standard Shelter, Medical and Child Support Payment deductions. RESOURCES refer to a household's liquid or non-liquid assets. These include Bank Accounts or Cash on Hand, Nonrecurring Lump Sum Payments, Personal Property, Real Property, and Vehicles, etc. For additional information, please refer to The Food Stamp Program Quality Control Review Handbook FNS-310.
24
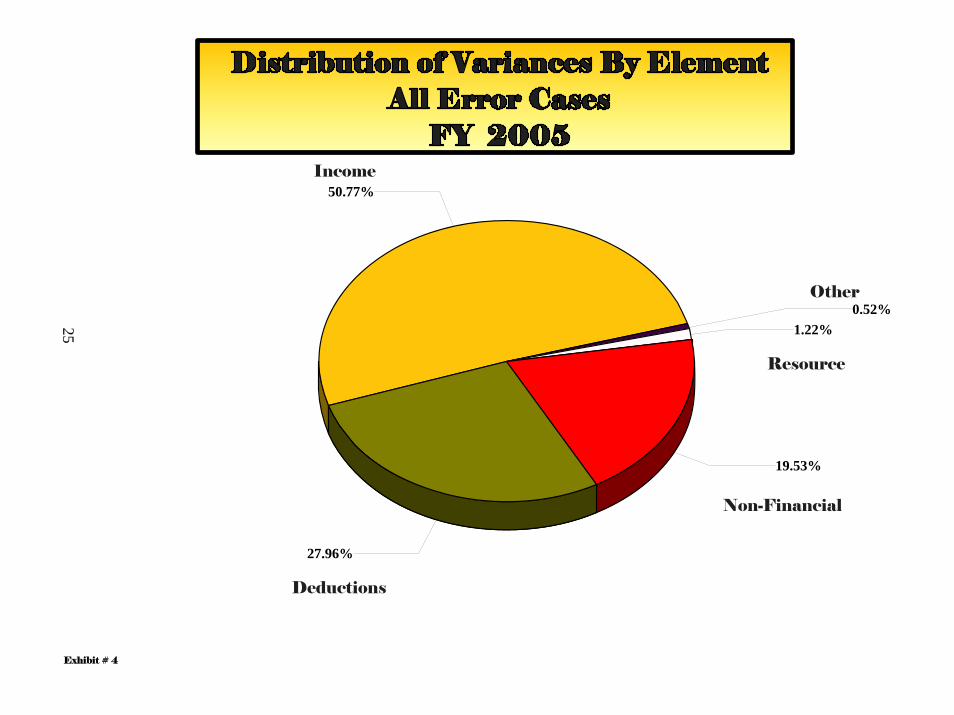
Exhibit # 4
50.77%
27.96%
19.53%
1.22%0.52%
Income
Other
Non-Financial
Resource
Deductions
25
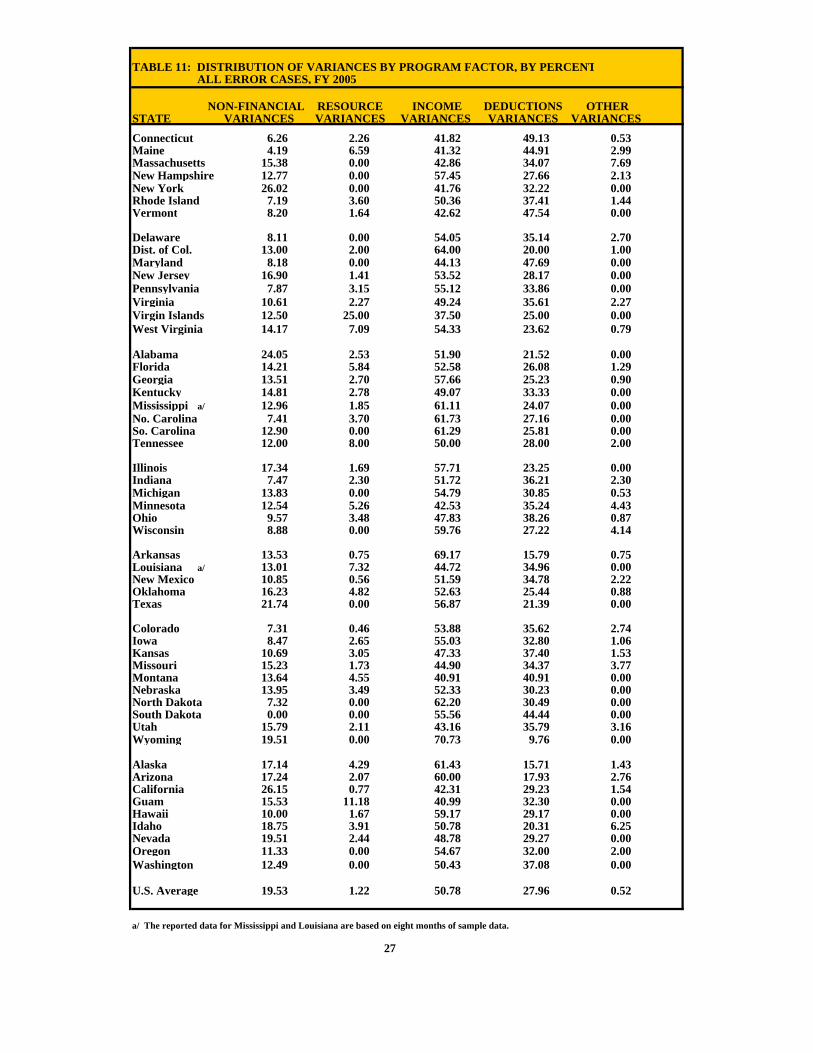
TABLE 11: DISTRIBUTION OF VARIANCES BY PROGRAM FACTOR, BY PERCENT ALL ERROR CASES, FY 2005
NON-FINANCIAL RESOURCE INCOME DEDUCTIONS OTHERSTATE VARIANCES VARIANCES VARIANCES VARIANCES VARIANCES
Connecticut 6.26 2.26 41.82 49.13 0.53Maine 4.19 6.59 41.32 44.91 2.99Massachusetts 15.38 0.00 42.86 34.07 7.69New Hampshire 12.77 0.00 57.45 27.66 2.13New York 26.02 0.00 41.76 32.22 0.00Rhode Island 7.19 3.60 50.36 37.41 1.44Vermont 8.20 1.64 42.62 47.54 0.00
Delaware 8.11 0.00 54.05 35.14 2.70Dist. of Col. 13.00 2.00 64.00 20.00 1.00Maryland 8.18 0.00 44.13 47.69 0.00New Jersey 16.90 1.41 53.52 28.17 0.00Pennsylvania 7.87 3.15 55.12 33.86 0.00Virginia 10.61 2.27 49.24 35.61 2.27Virgin Islands 12.50 25.00 37.50 25.00 0.00West Virginia 14.17 7.09 54.33 23.62 0.79
Alabama 24.05 2.53 51.90 21.52 0.00Florida 14.21 5.84 52.58 26.08 1.29Georgia 13.51 2.70 57.66 25.23 0.90Kentucky 14.81 2.78 49.07 33.33 0.00Mississippi a/ 12.96 1.85 61.11 24.07 0.00No. Carolina 7.41 3.70 61.73 27.16 0.00So. Carolina 12.90 0.00 61.29 25.81 0.00Tennessee 12.00 8.00 50.00 28.00 2.00
Illinois 17.34 1.69 57.71 23.25 0.00Indiana 7.47 2.30 51.72 36.21 2.30Michigan 13.83 0.00 54.79 30.85 0.53Minnesota 12.54 5.26 42.53 35.24 4.43Ohio 9.57 3.48 47.83 38.26 0.87Wisconsin 8.88 0.00 59.76 27.22 4.14
Arkansas 13.53 0.75 69.17 15.79 0.75Louisiana a/ 13.01 7.32 44.72 34.96 0.00New Mexico 10.85 0.56 51.59 34.78 2.22Oklahoma 16.23 4.82 52.63 25.44 0.88Texas 21.74 0.00 56.87 21.39 0.00
Colorado 7.31 0.46 53.88 35.62 2.74Iowa 8.47 2.65 55.03 32.80 1.06Kansas 10.69 3.05 47.33 37.40 1.53Missouri 15.23 1.73 44.90 34.37 3.77Montana 13.64 4.55 40.91 40.91 0.00Nebraska 13.95 3.49 52.33 30.23 0.00North Dakota 7.32 0.00 62.20 30.49 0.00South Dakota 0.00 0.00 55.56 44.44 0.00Utah 15.79 2.11 43.16 35.79 3.16Wyoming 19.51 0.00 70.73 9.76 0.00
Alaska 17.14 4.29 61.43 15.71 1.43Arizona 17.24 2.07 60.00 17.93 2.76California 26.15 0.77 42.31 29.23 1.54Guam 15.53 11.18 40.99 32.30 0.00Hawaii 10.00 1.67 59.17 29.17 0.00Idaho 18.75 3.91 50.78 20.31 6.25Nevada 19.51 2.44 48.78 29.27 0.00Oregon 11.33 0.00 54.67 32.00 2.00Washington 12.49 0.00 50.43 37.08 0.00
U.S. Average 19.53 1.22 50.78 27.96 0.52
a/ The reported data for Mississippi and Louisiana are based on eight months of sample data.
27

TABLE 12: DISTRIBUTION OF VARIANCES BY PROGRAM FACTOR, BY PERCENT OVERPAYMENT CASES, FY 2005
NON-FINANCIAL RESOURCE INCOME DEDUCTIONS OTHERSTATE VARIANCES VARIANCES VARIANCES VARIANCES VARIANCES
Connecticut 6.90 3.66 58.41 30.17 0.86Maine 3.94 8.66 42.52 43.31 1.57Massachusetts 14.75 0.00 45.90 36.07 3.28New Hampshire 7.14 0.00 71.43 17.86 3.57New York 19.70 0.00 50.64 29.66 0.00Rhode Island 5.56 5.56 57.78 30.00 1.11Vermont 8.51 2.13 44.68 44.68 0.00
Delaware 2.50 0.00 67.50 27.50 2.50Dist. of Col. 11.25 2.50 63.75 21.25 1.25Maryland 7.58 0.00 48.05 44.37 0.00New Jersey 11.54 1.92 63.46 23.08 0.00Pennsylvania 9.64 4.82 59.04 26.51 0.00Virginia 8.99 3.37 59.55 28.09 0.00Virgin Islands 15.38 30.77 38.46 15.38 0.00West Virginia 11.88 8.91 53.47 24.75 0.99
Alabama 25.76 3.03 53.03 18.18 0.00Florida 10.07 7.84 57.86 22.82 1.41Georgia 12.36 3.37 59.55 24.72 0.00Kentucky 13.92 3.80 55.70 26.58 0.00Mississippi a/ 5.88 2.94 67.65 23.53 0.00No. Carolina 5.00 5.00 60.00 30.00 0.00So. Carolina 12.33 0.00 65.75 21.92 0.00Tennessee 10.59 9.41 52.94 25.88 1.18
Illinois 12.65 2.02 60.64 24.69 0.00Indiana 4.92 3.28 54.92 36.89 0.00Michigan 15.67 0.00 55.97 27.61 0.75Minnesota 10.99 6.76 43.54 34.66 4.05Ohio 10.06 4.73 49.70 34.91 0.59Wisconsin 8.60 0.00 60.22 29.03 2.15
Arkansas 15.09 0.94 73.58 10.38 0.00Louisiana a/ 12.90 9.68 48.39 29.03 0.00New Mexico 9.79 0.87 59.95 28.52 0.87Oklahoma 15.56 6.11 53.33 23.89 1.11Texas 13.38 0.00 61.36 25.26 0.00
Colorado 4.32 0.72 63.31 29.50 2.16Iowa 8.50 3.27 60.13 27.45 0.65Kansas 11.24 4.49 55.06 28.09 1.12Missouri 9.58 2.48 55.64 30.85 1.47Montana 14.00 6.00 46.00 34.00 0.00Nebraska 10.29 4.41 57.35 27.94 0.00North Dakota 3.92 0.00 72.55 23.53 0.00South Dakota 0.00 0.00 57.14 42.86 0.00Utah 16.13 3.23 45.16 35.48 0.00Wyoming 19.35 0.00 70.97 9.68 0.00
Alaska 12.50 5.36 64.29 16.07 1.79Arizona 14.29 3.06 74.49 5.10 3.06California 26.92 1.28 44.87 26.92 0.00Guam 8.05 14.94 45.98 31.03 0.00Hawaii 7.89 2.63 64.47 25.00 0.00Idaho 14.46 6.02 57.83 15.66 6.02Nevada 14.29 3.57 57.14 25.00 0.00Oregon 9.65 0.00 54.39 35.96 0.00Washington 13.37 0.00 52.76 33.87 0.00
U.S. Average 14.26 1.78 56.49 27.14 0.33
a/ The reported data for Mississippi and Louisiana are based on eight months of sample data.
28
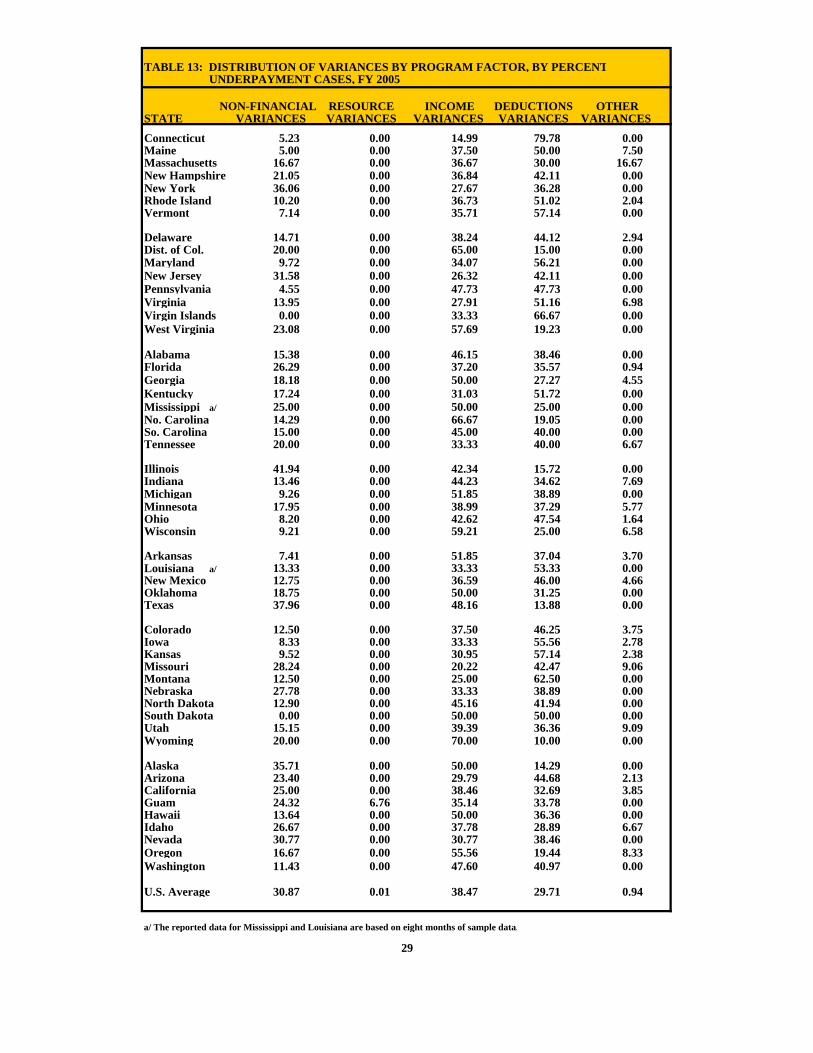
TABLE 13: DISTRIBUTION OF VARIANCES BY PROGRAM FACTOR, BY PERCENT UNDERPAYMENT CASES, FY 2005
NON-FINANCIAL RESOURCE INCOME DEDUCTIONS OTHERSTATE VARIANCES VARIANCES VARIANCES VARIANCES VARIANCES
Connecticut 5.23 0.00 14.99 79.78 0.00Maine 5.00 0.00 37.50 50.00 7.50Massachusetts 16.67 0.00 36.67 30.00 16.67New Hampshire 21.05 0.00 36.84 42.11 0.00New York 36.06 0.00 27.67 36.28 0.00Rhode Island 10.20 0.00 36.73 51.02 2.04Vermont 7.14 0.00 35.71 57.14 0.00
Delaware 14.71 0.00 38.24 44.12 2.94Dist. of Col. 20.00 0.00 65.00 15.00 0.00Maryland 9.72 0.00 34.07 56.21 0.00New Jersey 31.58 0.00 26.32 42.11 0.00Pennsylvania 4.55 0.00 47.73 47.73 0.00Virginia 13.95 0.00 27.91 51.16 6.98Virgin Islands 0.00 0.00 33.33 66.67 0.00West Virginia 23.08 0.00 57.69 19.23 0.00
Alabama 15.38 0.00 46.15 38.46 0.00Florida 26.29 0.00 37.20 35.57 0.94Georgia 18.18 0.00 50.00 27.27 4.55Kentucky 17.24 0.00 31.03 51.72 0.00Mississippi a/ 25.00 0.00 50.00 25.00 0.00No. Carolina 14.29 0.00 66.67 19.05 0.00So. Carolina 15.00 0.00 45.00 40.00 0.00Tennessee 20.00 0.00 33.33 40.00 6.67
Illinois 41.94 0.00 42.34 15.72 0.00Indiana 13.46 0.00 44.23 34.62 7.69Michigan 9.26 0.00 51.85 38.89 0.00Minnesota 17.95 0.00 38.99 37.29 5.77Ohio 8.20 0.00 42.62 47.54 1.64Wisconsin 9.21 0.00 59.21 25.00 6.58
Arkansas 7.41 0.00 51.85 37.04 3.70Louisiana a/ 13.33 0.00 33.33 53.33 0.00New Mexico 12.75 0.00 36.59 46.00 4.66Oklahoma 18.75 0.00 50.00 31.25 0.00Texas 37.96 0.00 48.16 13.88 0.00
Colorado 12.50 0.00 37.50 46.25 3.75Iowa 8.33 0.00 33.33 55.56 2.78Kansas 9.52 0.00 30.95 57.14 2.38Missouri 28.24 0.00 20.22 42.47 9.06Montana 12.50 0.00 25.00 62.50 0.00Nebraska 27.78 0.00 33.33 38.89 0.00North Dakota 12.90 0.00 45.16 41.94 0.00South Dakota 0.00 0.00 50.00 50.00 0.00Utah 15.15 0.00 39.39 36.36 9.09Wyoming 20.00 0.00 70.00 10.00 0.00
Alaska 35.71 0.00 50.00 14.29 0.00Arizona 23.40 0.00 29.79 44.68 2.13California 25.00 0.00 38.46 32.69 3.85Guam 24.32 6.76 35.14 33.78 0.00Hawaii 13.64 0.00 50.00 36.36 0.00Idaho 26.67 0.00 37.78 28.89 6.67Nevada 30.77 0.00 30.77 38.46 0.00Oregon 16.67 0.00 55.56 19.44 8.33Washington 11.43 0.00 47.60 40.97 0.00
U.S. Average 30.87 0.01 38.47 29.71 0.94
a/ The reported data for Mississippi and Louisiana are based on eight months of sample data.
29
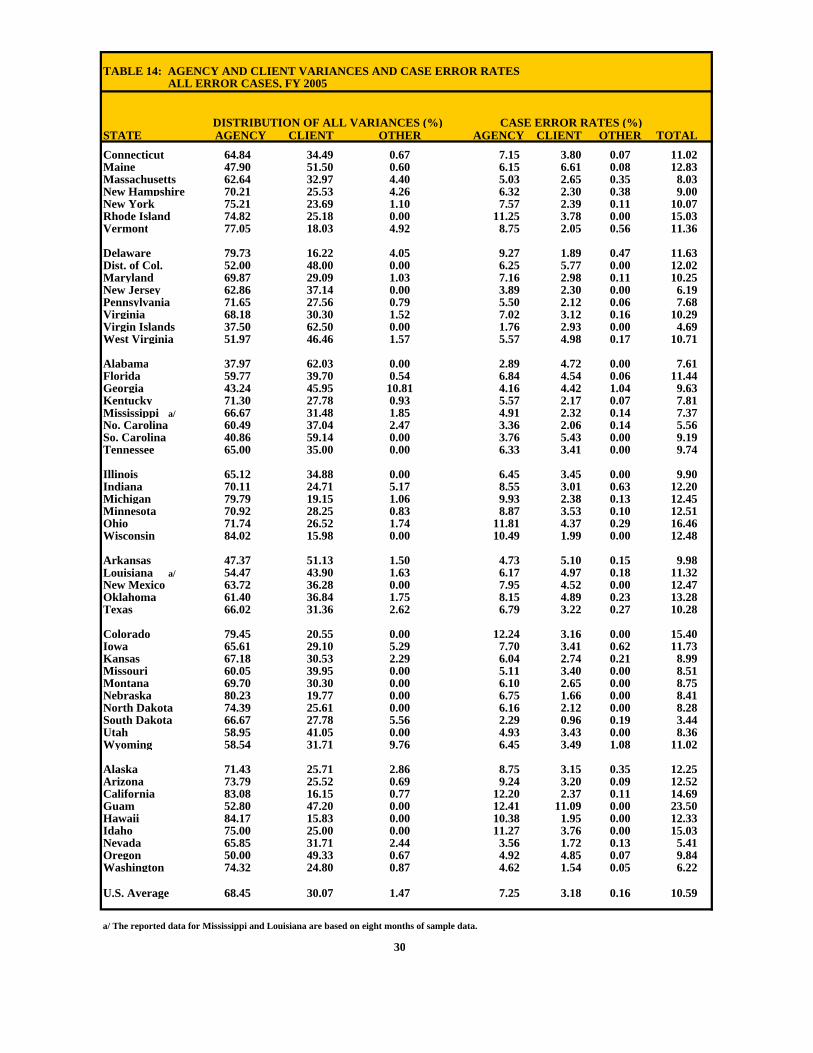
TABLE 14: AGENCY AND CLIENT VARIANCES AND CASE ERROR RATES ALL ERROR CASES, FY 2005
DISTRIBUTION OF ALL VARIANCES (%) CASE ERROR RATES (%)STATE AGENCY CLIENT OTHER AGENCY CLIENT OTHER TOTALConnecticut 64.84 34.49 0.67 7.15 3.80 0.07 11.02Maine 47.90 51.50 0.60 6.15 6.61 0.08 12.83Massachusetts 62.64 32.97 4.40 5.03 2.65 0.35 8.03New Hampshire 70.21 25.53 4.26 6.32 2.30 0.38 9.00New York 75.21 23.69 1.10 7.57 2.39 0.11 10.07Rhode Island 74.82 25.18 0.00 11.25 3.78 0.00 15.03Vermont 77.05 18.03 4.92 8.75 2.05 0.56 11.36
Delaware 79.73 16.22 4.05 9.27 1.89 0.47 11.63Dist. of Col. 52.00 48.00 0.00 6.25 5.77 0.00 12.02Maryland 69.87 29.09 1.03 7.16 2.98 0.11 10.25New Jersey 62.86 37.14 0.00 3.89 2.30 0.00 6.19Pennsylvania 71.65 27.56 0.79 5.50 2.12 0.06 7.68Virginia 68.18 30.30 1.52 7.02 3.12 0.16 10.29Virgin Islands 37.50 62.50 0.00 1.76 2.93 0.00 4.69West Virginia 51.97 46.46 1.57 5.57 4.98 0.17 10.71
Alabama 37.97 62.03 0.00 2.89 4.72 0.00 7.61Florida 59.77 39.70 0.54 6.84 4.54 0.06 11.44Georgia 43.24 45.95 10.81 4.16 4.42 1.04 9.63Kentucky 71.30 27.78 0.93 5.57 2.17 0.07 7.81Mississippi a/ 66.67 31.48 1.85 4.91 2.32 0.14 7.37No. Carolina 60.49 37.04 2.47 3.36 2.06 0.14 5.56So. Carolina 40.86 59.14 0.00 3.76 5.43 0.00 9.19Tennessee 65.00 35.00 0.00 6.33 3.41 0.00 9.74
Illinois 65.12 34.88 0.00 6.45 3.45 0.00 9.90Indiana 70.11 24.71 5.17 8.55 3.01 0.63 12.20Michigan 79.79 19.15 1.06 9.93 2.38 0.13 12.45Minnesota 70.92 28.25 0.83 8.87 3.53 0.10 12.51Ohio 71.74 26.52 1.74 11.81 4.37 0.29 16.46Wisconsin 84.02 15.98 0.00 10.49 1.99 0.00 12.48
Arkansas 47.37 51.13 1.50 4.73 5.10 0.15 9.98Louisiana a/ 54.47 43.90 1.63 6.17 4.97 0.18 11.32New Mexico 63.72 36.28 0.00 7.95 4.52 0.00 12.47Oklahoma 61.40 36.84 1.75 8.15 4.89 0.23 13.28Texas 66.02 31.36 2.62 6.79 3.22 0.27 10.28
Colorado 79.45 20.55 0.00 12.24 3.16 0.00 15.40Iowa 65.61 29.10 5.29 7.70 3.41 0.62 11.73Kansas 67.18 30.53 2.29 6.04 2.74 0.21 8.99Missouri 60.05 39.95 0.00 5.11 3.40 0.00 8.51Montana 69.70 30.30 0.00 6.10 2.65 0.00 8.75Nebraska 80.23 19.77 0.00 6.75 1.66 0.00 8.41North Dakota 74.39 25.61 0.00 6.16 2.12 0.00 8.28South Dakota 66.67 27.78 5.56 2.29 0.96 0.19 3.44Utah 58.95 41.05 0.00 4.93 3.43 0.00 8.36Wyoming 58.54 31.71 9.76 6.45 3.49 1.08 11.02
Alaska 71.43 25.71 2.86 8.75 3.15 0.35 12.25Arizona 73.79 25.52 0.69 9.24 3.20 0.09 12.52California 83.08 16.15 0.77 12.20 2.37 0.11 14.69Guam 52.80 47.20 0.00 12.41 11.09 0.00 23.50Hawaii 84.17 15.83 0.00 10.38 1.95 0.00 12.33Idaho 75.00 25.00 0.00 11.27 3.76 0.00 15.03Nevada 65.85 31.71 2.44 3.56 1.72 0.13 5.41Oregon 50.00 49.33 0.67 4.92 4.85 0.07 9.84Washington 74.32 24.80 0.87 4.62 1.54 0.05 6.22
U.S. Average 68.45 30.07 1.47 7.25 3.18 0.16 10.59
a/ The reported data for Mississippi and Louisiana are based on eight months of sample data.
30

TABLE 15: AGENCY AND CLIENT VARIANCES AND CASE ERROR RATES OVERPAYMENT CASES, FY 2005
DISTRIBUTION OF ALL VARIANCES (%) CASE ERROR RATES (%)STATE AGENCY CLIENT OTHER AGENCY CLIENT OTHER TOTALConnecticut 49.99 48.93 1.08 3.16 3.09 0.07 6.32Maine 40.16 59.06 0.79 3.82 5.62 0.08 9.52Massachusetts 57.38 37.70 4.92 3.17 2.08 0.27 5.53New Hampshire 53.57 42.86 3.57 2.98 2.39 0.20 5.57New York 66.67 33.33 0.00 4.12 2.06 0.00 6.18Rhode Island 72.22 27.78 0.00 6.97 2.68 0.00 9.65Vermont 72.34 21.28 6.38 6.47 1.90 0.57 8.94
Delaware 70.00 22.50 7.50 4.70 1.51 0.50 6.71Dist. of Col. 43.75 56.25 0.00 4.18 5.38 0.00 9.56Maryland 63.71 34.85 1.44 4.42 2.42 0.10 6.94New Jersey 56.86 43.14 0.00 2.66 2.01 0.00 4.67Pennsylvania 60.24 38.55 1.20 3.12 2.00 0.06 5.18Virginia 56.18 42.70 1.12 4.09 3.11 0.08 7.28Virgin Islands 38.46 61.54 0.00 1.44 2.31 0.00 3.75West Virginia 44.55 54.46 0.99 3.79 4.63 0.08 8.51
Alabama 28.79 71.21 0.00 1.83 4.54 0.00 6.37Florida 49.77 49.51 0.72 4.29 4.26 0.06 8.61Georgia 35.96 50.56 13.48 2.75 3.86 1.03 7.64Kentucky 64.56 34.18 1.27 3.63 1.92 0.07 5.63Mississippi a/ 58.82 38.24 2.94 2.73 1.77 0.14 4.64No. Carolina 51.67 45.00 3.33 2.07 1.80 0.13 4.00So. Carolina 35.62 64.38 0.00 2.57 4.64 0.00 7.21Tennessee 60.00 40.00 0.00 4.87 3.25 0.00 8.12
Illinois 60.55 39.45 0.00 5.06 3.30 0.00 8.36Indiana 62.30 31.15 6.56 5.44 2.72 0.57 8.73Michigan 74.63 23.88 1.49 6.99 2.24 0.14 9.36Minnesota 69.20 30.80 0.00 6.53 2.90 0.00 9.43Ohio 69.23 28.40 2.37 8.52 3.49 0.29 12.30Wisconsin 81.72 18.28 0.00 5.92 1.32 0.00 7.24
Arkansas 39.62 60.38 0.00 3.15 4.80 0.00 7.95Louisiana a/ 44.09 54.84 1.08 3.62 4.51 0.09 8.22New Mexico 51.54 48.46 0.00 4.31 4.06 0.00 8.37Oklahoma 57.22 41.11 1.67 6.18 4.44 0.18 10.80Texas 55.63 41.73 2.64 3.67 2.75 0.17 6.60
Colorado 72.66 27.34 0.00 6.97 2.62 0.00 9.59Iowa 61.44 32.03 6.54 5.74 2.99 0.61 9.35Kansas 56.18 40.45 3.37 3.63 2.61 0.22 6.46Missouri 53.49 46.51 0.00 3.31 2.88 0.00 6.19Montana 64.00 36.00 0.00 4.33 2.44 0.00 6.77Nebraska 75.00 25.00 0.00 4.99 1.66 0.00 6.65North Dakota 74.51 25.49 0.00 3.62 1.24 0.00 4.86South Dakota 64.29 28.57 7.14 1.77 0.79 0.20 2.75Utah 53.23 46.77 0.00 2.89 2.54 0.00 5.43Wyoming 58.06 35.48 6.45 4.71 2.88 0.52 8.12
Alaska 67.86 30.36 1.79 6.62 2.96 0.17 9.75Arizona 66.33 32.65 1.02 5.61 2.76 0.09 8.46California 74.36 25.64 0.00 6.59 2.27 0.00 8.86Guam 48.28 51.72 0.00 6.29 6.73 0.00 13.02Hawaii 78.95 21.05 0.00 6.21 1.65 0.00 7.86Idaho 65.06 34.94 0.00 6.23 3.35 0.00 9.58Nevada 53.57 42.86 3.57 1.98 1.58 0.13 3.69Oregon 40.35 58.77 0.88 3.07 4.47 0.07 7.60Washington 61.59 36.81 1.61 2.14 1.28 0.06 3.48
U.S. Average 59.73 38.99 1.28 4.46 2.91 0.10 7.47
a/ The reported data for Mississippi and Louisiana are based on eight months of sample data.
31

TABLE 16: AGENCY AND CLIENT VARIANCES AND CASE ERROR RATES UNDERPAYMENT ERROR CASES, FY 2005
DISTRIBUTION OF ALL VARIANCES (%) CASE ERROR RATES (%)STATE AGENCY CLIENT OTHER AGENCY CLIENT OTHER TOTALConnecticut 88.85 11.15 0.00 4.18 0.52 0.00 4.70Maine 72.50 27.50 0.00 2.40 0.91 0.00 3.31Massachusetts 73.33 23.33 3.33 1.83 0.58 0.08 2.50New Hampshire 94.74 0.00 5.26 3.25 0.00 0.18 3.43New York 88.78 8.38 2.84 3.45 0.33 0.11 3.89Rhode Island 79.59 20.41 0.00 4.28 1.10 0.00 5.38Vermont 92.86 7.14 0.00 2.25 0.17 0.00 2.42
Delaware 91.18 8.82 0.00 4.49 0.43 0.00 4.92Dist. of Col. 85.00 15.00 0.00 2.09 0.37 0.00 2.46Maryland 85.52 14.48 0.00 2.83 0.48 0.00 3.31New Jersey 78.95 21.05 0.00 1.20 0.32 0.00 1.52Pennsylvania 93.18 6.82 0.00 2.33 0.17 0.00 2.50Virginia 93.02 4.65 2.33 2.80 0.14 0.07 3.01Virgin Islands 33.33 66.67 0.00 0.31 0.63 0.00 0.94West Virginia 80.77 15.38 3.85 1.78 0.34 0.08 2.20
Alabama 84.62 15.38 0.00 1.05 0.19 0.00 1.24Florida 88.91 11.09 0.00 2.52 0.31 0.00 2.83Georgia 72.73 27.27 0.00 1.45 0.54 0.00 1.99Kentucky 89.66 10.34 0.00 1.95 0.23 0.00 2.18Mississippi a/ 80.00 20.00 0.00 2.18 0.55 0.00 2.73No. Carolina 85.71 14.29 0.00 1.34 0.22 0.00 1.56So. Carolina 60.00 40.00 0.00 1.19 0.79 0.00 1.98Tennessee 93.33 6.67 0.00 1.51 0.11 0.00 1.62
Illinois 89.10 10.90 0.00 1.37 0.17 0.00 1.54Indiana 88.46 9.62 1.92 3.07 0.33 0.07 3.47Michigan 92.59 7.41 0.00 2.86 0.23 0.00 3.09Minnesota 76.93 19.33 3.74 2.37 0.60 0.12 3.08Ohio 78.69 21.31 0.00 3.27 0.89 0.00 4.16Wisconsin 86.84 13.16 0.00 4.55 0.69 0.00 5.24
Arkansas 77.78 14.81 7.41 1.58 0.30 0.15 2.03Louisiana a/ 86.67 10.00 3.33 2.69 0.31 0.10 3.10New Mexico 85.55 14.45 0.00 3.51 0.59 0.00 4.10Oklahoma 77.08 20.83 2.08 1.91 0.52 0.05 2.48Texas 86.20 11.24 2.56 3.17 0.41 0.09 3.68
Colorado 91.25 8.75 0.00 5.30 0.51 0.00 5.81Iowa 83.33 16.67 0.00 1.98 0.40 0.00 2.38Kansas 90.48 9.52 0.00 2.29 0.24 0.00 2.53Missouri 75.13 24.87 0.00 1.74 0.58 0.00 2.32Montana 87.50 12.50 0.00 1.73 0.25 0.00 1.98Nebraska 100.00 0.00 0.00 1.76 0.00 0.00 1.76North Dakota 74.19 25.81 0.00 2.54 0.88 0.00 3.42South Dakota 75.00 25.00 0.00 0.52 0.17 0.00 0.69Utah 69.70 30.30 0.00 2.04 0.89 0.00 2.93Wyoming 60.00 20.00 20.00 1.74 0.58 0.58 2.90
Alaska 85.71 7.14 7.14 2.14 0.18 0.18 2.50Arizona 89.36 10.64 0.00 3.63 0.43 0.00 4.06California 96.15 1.92 1.92 5.61 0.11 0.11 5.83Guam 58.11 41.89 0.00 6.09 4.39 0.00 10.48Hawaii 93.18 6.82 0.00 4.17 0.30 0.00 4.47Idaho 93.33 6.67 0.00 5.09 0.36 0.00 5.45Nevada 92.31 7.69 0.00 1.59 0.13 0.00 1.72Oregon 80.56 19.44 0.00 1.80 0.44 0.00 2.24Washington 89.50 10.50 0.00 2.45 0.29 0.00 2.74
U.S. Average 87.25 10.87 1.88 2.72 0.34 0.06 3.12
a/ The reported data for Mississippi and Louisiana are based on eight months of sample data.
32
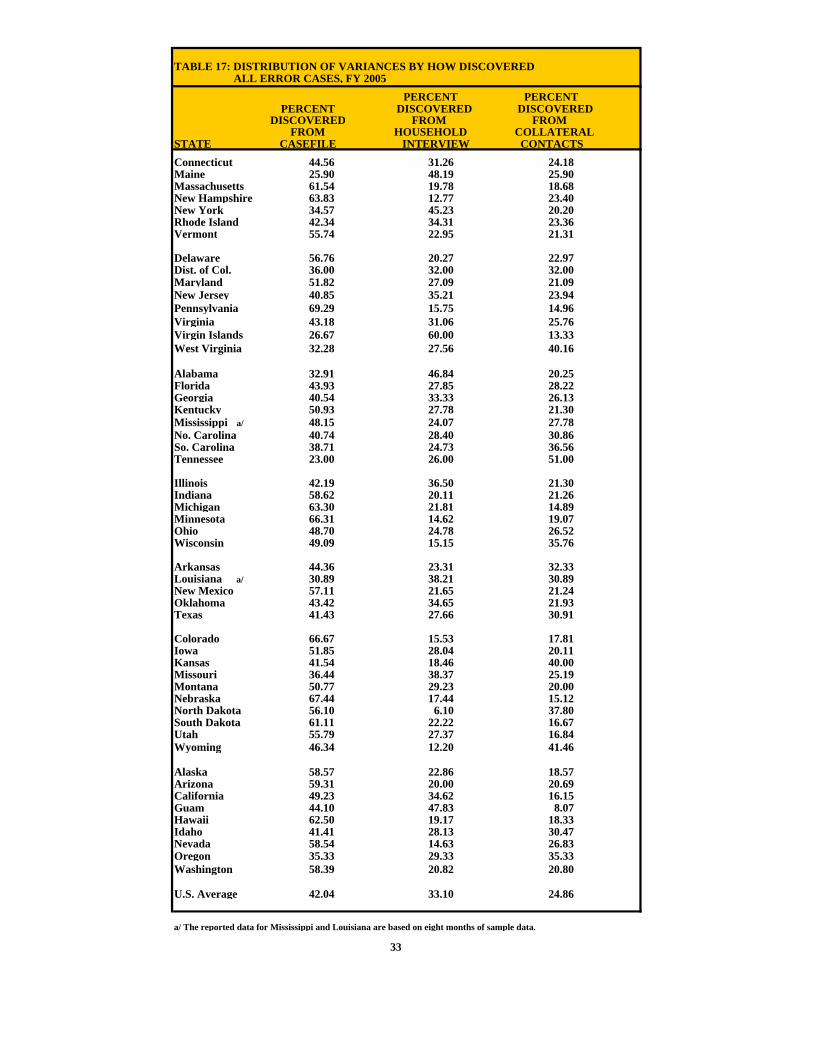
TABLE 17: DISTRIBUTION OF VARIANCES BY HOW DISCOVERED ALL ERROR CASES, FY 2005
PERCENT PERCENTPERCENT DISCOVERED DISCOVERED
DISCOVERED FROM FROM FROM HOUSEHOLD COLLATERAL
STATE CASEFILE INTERVIEW CONTACTSConnecticut 44.56 31.26 24.18Maine 25.90 48.19 25.90Massachusetts 61.54 19.78 18.68New Hampshire 63.83 12.77 23.40New York 34.57 45.23 20.20Rhode Island 42.34 34.31 23.36Vermont 55.74 22.95 21.31
Delaware 56.76 20.27 22.97Dist. of Col. 36.00 32.00 32.00Maryland 51.82 27.09 21.09New Jersey 40.85 35.21 23.94Pennsylvania 69.29 15.75 14.96Virginia 43.18 31.06 25.76Virgin Islands 26.67 60.00 13.33West Virginia 32.28 27.56 40.16
Alabama 32.91 46.84 20.25Florida 43.93 27.85 28.22Georgia 40.54 33.33 26.13Kentucky 50.93 27.78 21.30Mississippi a/ 48.15 24.07 27.78No. Carolina 40.74 28.40 30.86So. Carolina 38.71 24.73 36.56Tennessee 23.00 26.00 51.00
Illinois 42.19 36.50 21.30Indiana 58.62 20.11 21.26Michigan 63.30 21.81 14.89Minnesota 66.31 14.62 19.07Ohio 48.70 24.78 26.52Wisconsin 49.09 15.15 35.76
Arkansas 44.36 23.31 32.33Louisiana a/ 30.89 38.21 30.89New Mexico 57.11 21.65 21.24Oklahoma 43.42 34.65 21.93Texas 41.43 27.66 30.91
Colorado 66.67 15.53 17.81Iowa 51.85 28.04 20.11Kansas 41.54 18.46 40.00Missouri 36.44 38.37 25.19Montana 50.77 29.23 20.00Nebraska 67.44 17.44 15.12North Dakota 56.10 6.10 37.80South Dakota 61.11 22.22 16.67Utah 55.79 27.37 16.84Wyoming 46.34 12.20 41.46
Alaska 58.57 22.86 18.57Arizona 59.31 20.00 20.69California 49.23 34.62 16.15Guam 44.10 47.83 8.07Hawaii 62.50 19.17 18.33Idaho 41.41 28.13 30.47Nevada 58.54 14.63 26.83Oregon 35.33 29.33 35.33Washington 58.39 20.82 20.80
U.S. Average 42.04 33.10 24.86
a/ The reported data for Mississippi and Louisiana are based on eight months of sample data.
33

TABLE 18: PERCENT OF VARIANCES BY TIME OF OCCURRENCE ALL ERROR CASES, FY 2005
BEFORE OR AT SUBSEQUENT TO OCCURRENCE MOST RECENT MOST RECENT CANNOT BE
STATE CERTIFICATION CERTIFICATION DETERMINEDConnecticut 76.30 23.70 0.00Maine 73.65 23.35 2.99Massachusetts 73.63 26.37 0.00New Hampshire 70.21 29.79 0.00New York 83.54 16.46 0.00Rhode Island 54.68 45.32 0.00Vermont 77.05 21.31 1.64
Delaware 59.46 40.54 0.00Dist. of Col. 85.00 13.00 2.00Maryland 79.07 20.24 0.68New Jersey 63.38 36.62 0.00Pennsylvania 56.69 43.31 0.00Virginia 75.76 24.24 0.00Virgin Islands 86.67 13.33 0.00West Virginia 58.27 41.73 0.00
Alabama 70.89 29.11 0.00Florida 80.02 19.98 0.00Georgia 79.28 20.72 0.00Kentucky 77.78 22.22 0.00Mississippi a/ 31.48 66.67 1.85No. Carolina 83.75 16.25 0.00So. Carolina 55.91 44.09 0.00Tennessee 87.00 13.00 0.00
Illinois 67.80 32.20 0.00Indiana 67.82 31.61 0.57Michigan 64.89 34.04 1.06Minnesota 48.39 48.53 3.08Ohio 70.43 29.57 0.00Wisconsin 60.48 38.32 1.20
Arkansas 73.68 26.32 0.00Louisiana a/ 82.11 17.89 0.00New Mexico 82.25 17.75 0.00Oklahoma 70.18 29.82 0.00Texas 74.21 25.79 0.00
Colorado 79.91 18.72 1.37Iowa 57.45 42.55 0.00Kansas 62.31 37.69 0.00Missouri 69.15 30.85 0.00Montana 67.69 30.77 1.54Nebraska 70.93 29.07 0.00North Dakota 40.24 58.54 1.22South Dakota 44.44 55.56 0.00Utah 69.47 30.53 0.00Wyoming 78.05 21.95 0.00
Alaska 77.14 22.86 0.00Arizona 67.59 31.72 0.69California 51.54 48.46 0.00Guam 68.94 31.06 0.00Hawaii 45.83 54.17 0.00Idaho 64.84 35.16 0.00Nevada 65.85 34.15 0.00Oregon 61.33 38.67 0.00Washington 68.28 31.72 0.00
U.S. Average 74.47 25.44 0.10
a/ The reported data for Mississippi and Louisiana are based on eight months of sample data.
34

Exhibit # 5
74.46%
25.44%
0.10%
Before or At Most Recent Certification
Cannot Be Determined
Subsequent To Most Recent Certification
35

TABLE 19: AGENCY AND CLIENT DOLLAR ERROR RATES - ALL ERRORS, FY 2005 a/
DISTRIBUTION OF ALL VARIANCES (%) DOLLAR ERROR RATES (%)STATE AGENCY CLIENT OTHER AGENCY CLIENT OTHER TOTAL
Connecticut 56.82 43.18 0.00 3.76 2.85 0.00 6.61Maine 47.98 51.70 0.32 3.64 3.92 0.02 7.59Massachusetts 59.77 36.88 3.35 2.32 1.43 0.13 3.88New Hampshire 53.82 44.56 1.62 3.18 2.63 0.10 5.91New York 65.95 33.22 0.83 4.77 2.40 0.06 7.23Rhode Island 63.78 36.22 0.00 6.28 3.56 0.00 9.84Vermont 65.08 30.59 4.33 3.67 1.73 0.24 5.64
Delaware 74.06 24.87 1.08 4.78 1.61 0.07 6.46Dist. of Col. 40.24 59.76 0.00 3.98 5.91 0.00 9.89Maryland 63.43 36.07 0.50 3.48 1.98 0.03 5.49New Jersey 51.90 48.10 0.00 2.49 2.30 0.00 4.79Pennsylvania 53.40 46.18 0.41 2.41 2.08 0.02 4.51Virginia 58.10 41.01 0.89 3.36 2.37 0.05 5.79Virgin Islands 10.99 89.01 0.00 0.23 1.88 0.00 2.11West Virginia 48.86 49.44 1.69 2.90 2.94 0.10 5.94
Alabama 24.09 75.91 0.00 0.89 2.79 0.00 3.68Florida 49.88 49.20 0.92 3.59 3.54 0.07 7.19Georgia 33.52 54.22 12.26 1.64 2.65 0.60 4.89Kentucky 55.54 44.09 0.38 2.53 2.01 0.02 4.56Mississippi b/ 56.87 40.76 2.37 1.71 1.22 0.07 3.00No. Carolina 40.80 58.60 0.61 1.21 1.74 0.02 2.97So. Carolina 32.40 67.60 0.00 1.76 3.68 0.00 5.44Tennessee 55.78 44.22 0.00 3.35 2.66 0.00 6.01
Illinois 61.70 38.30 0.00 3.55 2.20 0.00 5.75Indiana 56.26 38.91 4.83 3.70 2.56 0.32 6.58Michigan 74.26 25.36 0.38 5.45 1.86 0.03 7.34Minnesota 64.95 33.63 1.42 4.94 2.56 0.11 7.60Ohio 72.05 25.86 2.09 6.23 2.24 0.18 8.65Wisconsin 83.65 16.35 0.00 4.69 0.92 0.00 5.61
Arkansas 35.23 64.12 0.65 1.91 3.48 0.04 5.43Louisiana b/ 47.11 51.53 1.36 2.75 3.00 0.08 5.83New Mexico 40.71 59.29 0.00 2.44 3.55 0.00 5.99Oklahoma 46.26 53.14 0.60 3.43 3.94 0.04 7.42Texas 61.13 37.67 1.19 3.07 1.89 0.06 5.03
Colorado 72.64 27.36 0.00 5.39 2.03 0.00 7.42Iowa 52.64 44.23 3.13 3.17 2.67 0.19 6.03Kansas 56.39 41.89 1.72 2.46 1.83 0.08 4.37Missouri 63.53 36.47 0.00 3.24 1.86 0.00 5.10Montana 61.02 38.98 0.00 2.47 1.58 0.00 4.05Nebraska 68.54 31.46 0.00 3.05 1.40 0.00 4.45North Dakota 78.21 21.79 0.00 2.81 0.78 0.00 3.59South Dakota 79.61 18.01 2.38 0.95 0.21 0.03 1.19Utah 47.87 52.13 0.00 2.11 2.30 0.00 4.41Wyoming 49.46 45.44 5.10 3.48 3.19 0.36 7.03
Alaska 51.96 44.22 3.82 3.38 2.88 0.25 6.51Arizona 63.84 35.37 0.79 4.86 2.69 0.06 7.61California 75.99 22.26 1.75 4.85 1.42 0.11 6.38Guam 54.46 45.54 0.00 3.38 2.82 0.00 6.20Hawaii 78.72 21.28 0.00 4.43 1.20 0.00 5.63Idaho 77.09 22.91 0.00 6.43 1.91 0.00 8.34Nevada 60.72 37.28 2.00 1.74 1.07 0.06 2.86Oregon 43.21 56.25 0.54 2.47 3.21 0.03 5.71Washington 63.97 36.03 0.00 1.74 0.98 0.00 2.72
U.S. Average 59.13 39.54 1.33 3.45 2.31 0.08 5.84
a/ Agency/Client dollar errors are determined by allotting all errors to the first variance coded.
b/ Fiscal year 2005 official rates for Mississippi and Louisiana were assigned due to Hurricane Katrina. The reported data for Mississippi and Louisiana are based on eight months of sample data.
37
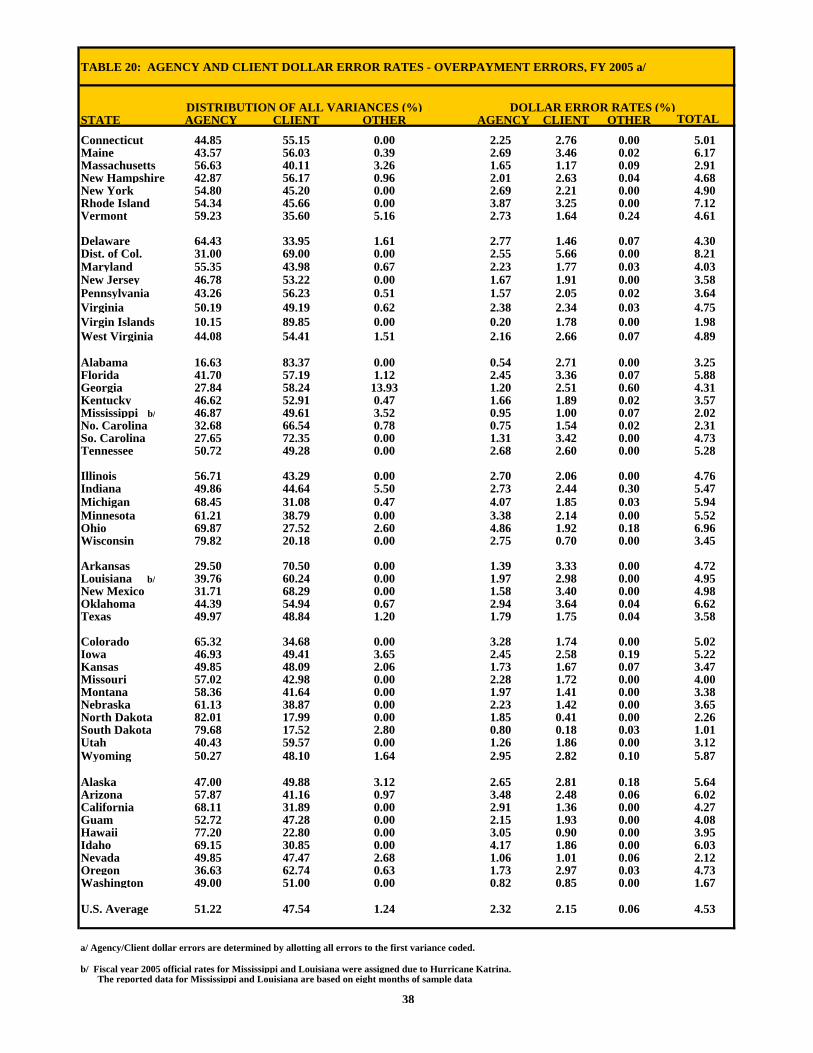
TABLE 20: AGENCY AND CLIENT DOLLAR ERROR RATES - OVERPAYMENT ERRORS, FY 2005 a/
DISTRIBUTION OF ALL VARIANCES (%) DOLLAR ERROR RATES (%)STATE AGENCY CLIENT OTHER AGENCY CLIENT OTHER
Connecticut 44.85 55.15 0.00 2.25 2.76 0.00 5.01Maine 43.57 56.03 0.39 2.69 3.46 0.02 6.17Massachusetts 56.63 40.11 3.26 1.65 1.17 0.09 2.91New Hampshire 42.87 56.17 0.96 2.01 2.63 0.04 4.68New York 54.80 45.20 0.00 2.69 2.21 0.00 4.90Rhode Island 54.34 45.66 0.00 3.87 3.25 0.00 7.12Vermont 59.23 35.60 5.16 2.73 1.64 0.24 4.61
Delaware 64.43 33.95 1.61 2.77 1.46 0.07 4.30Dist. of Col. 31.00 69.00 0.00 2.55 5.66 0.00 8.21Maryland 55.35 43.98 0.67 2.23 1.77 0.03 4.03New Jersey 46.78 53.22 0.00 1.67 1.91 0.00 3.58Pennsylvania 43.26 56.23 0.51 1.57 2.05 0.02 3.64Virginia 50.19 49.19 0.62 2.38 2.34 0.03 4.75Virgin Islands 10.15 89.85 0.00 0.20 1.78 0.00 1.98West Virginia 44.08 54.41 1.51 2.16 2.66 0.07 4.89
Alabama 16.63 83.37 0.00 0.54 2.71 0.00 3.25Florida 41.70 57.19 1.12 2.45 3.36 0.07 5.88Georgia 27.84 58.24 13.93 1.20 2.51 0.60 4.31Kentucky 46.62 52.91 0.47 1.66 1.89 0.02 3.57Mississippi b/ 46.87 49.61 3.52 0.95 1.00 0.07 2.02No. Carolina 32.68 66.54 0.78 0.75 1.54 0.02 2.31So. Carolina 27.65 72.35 0.00 1.31 3.42 0.00 4.73Tennessee 50.72 49.28 0.00 2.68 2.60 0.00 5.28
Illinois 56.71 43.29 0.00 2.70 2.06 0.00 4.76Indiana 49.86 44.64 5.50 2.73 2.44 0.30 5.47Michigan 68.45 31.08 0.47 4.07 1.85 0.03 5.94Minnesota 61.21 38.79 0.00 3.38 2.14 0.00 5.52Ohio 69.87 27.52 2.60 4.86 1.92 0.18 6.96Wisconsin 79.82 20.18 0.00 2.75 0.70 0.00 3.45
Arkansas 29.50 70.50 0.00 1.39 3.33 0.00 4.72Louisiana b/ 39.76 60.24 0.00 1.97 2.98 0.00 4.95New Mexico 31.71 68.29 0.00 1.58 3.40 0.00 4.98Oklahoma 44.39 54.94 0.67 2.94 3.64 0.04 6.62Texas 49.97 48.84 1.20 1.79 1.75 0.04 3.58
Colorado 65.32 34.68 0.00 3.28 1.74 0.00 5.02Iowa 46.93 49.41 3.65 2.45 2.58 0.19 5.22Kansas 49.85 48.09 2.06 1.73 1.67 0.07 3.47Missouri 57.02 42.98 0.00 2.28 1.72 0.00 4.00Montana 58.36 41.64 0.00 1.97 1.41 0.00 3.38Nebraska 61.13 38.87 0.00 2.23 1.42 0.00 3.65North Dakota 82.01 17.99 0.00 1.85 0.41 0.00 2.26South Dakota 79.68 17.52 2.80 0.80 0.18 0.03 1.01Utah 40.43 59.57 0.00 1.26 1.86 0.00 3.12Wyoming 50.27 48.10 1.64 2.95 2.82 0.10 5.87
Alaska 47.00 49.88 3.12 2.65 2.81 0.18 5.64Arizona 57.87 41.16 0.97 3.48 2.48 0.06 6.02California 68.11 31.89 0.00 2.91 1.36 0.00 4.27Guam 52.72 47.28 0.00 2.15 1.93 0.00 4.08Hawaii 77.20 22.80 0.00 3.05 0.90 0.00 3.95Idaho 69.15 30.85 0.00 4.17 1.86 0.00 6.03Nevada 49.85 47.47 2.68 1.06 1.01 0.06 2.12Oregon 36.63 62.74 0.63 1.73 2.97 0.03 4.73Washington 49.00 51.00 0.00 0.82 0.85 0.00 1.67
U.S. Average 51.22 47.54 1.24 2.32 2.15 0.06 4.53
a/ Agency/Client dollar errors are determined by allotting all errors to the first variance coded.
b/ Fiscal year 2005 official rates for Mississippi and Louisiana were assigned due to Hurricane Katrina. The reported data for Mississippi and Louisiana are based on eight months of sample data.
38
TOTAL

TABLE 21: AGENCY AND CLIENT DOLLAR ERROR RATES - UNDERPAYMENT ERRORS, FY 2005 a/
DISTRIBUTION OF ALL VARIANCES (%) DOLLAR ERROR RATES (%)STATE AGENCY CLIENT OTHER AGENCY CLIENT OTHER TOTAL
Connecticut 94.13 5.87 0.00 1.52 0.09 0.00 1.61Maine 67.35 32.65 0.00 0.96 0.47 0.00 1.43Massachusetts 69.34 27.04 3.62 0.67 0.26 0.04 0.97New Hampshire 95.87 0.00 4.13 1.17 0.00 0.05 1.22New York 89.29 8.14 2.57 2.08 0.19 0.06 2.33Rhode Island 91.31 8.69 0.00 2.47 0.24 0.00 2.71Vermont 95.40 4.60 0.00 0.98 0.05 0.00 1.03
Delaware 93.28 6.72 0.00 2.01 0.15 0.00 2.16Dist. of Col. 79.64 20.36 0.00 1.35 0.34 0.00 1.69Maryland 87.84 12.16 0.00 1.27 0.18 0.00 1.45New Jersey 75.21 24.79 0.00 0.91 0.30 0.00 1.21Pennsylvania 97.93 2.07 0.00 0.85 0.02 0.00 0.87Virginia 94.77 3.11 2.12 0.98 0.03 0.02 1.03Virgin Islands 24.00 76.00 0.00 0.03 0.10 0.00 0.13West Virginia 73.49 23.85 2.66 0.77 0.25 0.03 1.05
Alabama 85.91 14.09 0.00 0.37 0.06 0.00 0.43Florida 88.72 11.28 0.00 1.17 0.15 0.00 1.32Georgia 75.23 24.77 0.00 0.44 0.14 0.00 0.58Kentucky 90.39 9.61 0.00 0.89 0.10 0.00 0.99Mississippi b/ 77.36 22.64 0.00 0.76 0.22 0.00 0.98No. Carolina 69.73 30.27 0.00 0.46 0.20 0.00 0.66So. Carolina 64.64 35.36 0.00 0.46 0.25 0.00 0.71Tennessee 93.96 6.04 0.00 0.69 0.04 0.00 0.73
Illinois 89.17 10.83 0.00 0.89 0.11 0.00 1.00Indiana 87.60 10.87 1.53 0.97 0.12 0.02 1.11Michigan 98.78 1.22 0.00 1.39 0.02 0.00 1.41Minnesota 75.18 19.52 5.30 1.56 0.41 0.11 2.08Ohio 80.96 19.04 0.00 1.37 0.32 0.00 1.69Wisconsin 89.25 10.75 0.00 1.93 0.23 0.00 2.16
Arkansas 73.33 21.68 4.99 0.52 0.15 0.04 0.71Louisiana b/ 88.18 2.83 8.99 0.78 0.02 0.08 0.88New Mexico 85.46 14.54 0.00 0.86 0.15 0.00 1.01Oklahoma 61.70 38.30 0.00 0.50 0.31 0.00 0.81Texas 88.09 10.72 1.19 1.29 0.16 0.02 1.46
Colorado 90.28 9.72 0.00 2.17 0.23 0.00 2.40Iowa 86.48 13.52 0.00 0.69 0.11 0.00 0.80Kansas 89.73 10.27 0.00 0.82 0.09 0.00 0.91Missouri 81.97 18.03 0.00 0.89 0.20 0.00 1.09Montana 77.92 22.08 0.00 0.52 0.15 0.00 0.67Nebraska 100.00 0.00 0.00 0.80 0.00 0.00 0.80North Dakota 71.76 28.24 0.00 0.95 0.38 0.00 1.33South Dakota 79.21 20.79 0.00 0.14 0.04 0.00 0.18Utah 65.71 34.29 0.00 0.85 0.44 0.00 1.29Wyoming 45.54 32.43 22.03 0.53 0.38 0.26 1.16
Alaska 83.47 8.22 8.31 0.73 0.07 0.07 0.87Arizona 90.36 9.64 0.00 1.44 0.15 0.00 1.59California 93.66 0.66 5.68 1.99 0.01 0.12 2.12Guam 57.82 42.18 0.00 1.23 0.89 0.00 2.12Hawaii 82.40 17.60 0.00 1.38 0.30 0.00 1.68Idaho 95.74 4.26 0.00 2.21 0.10 0.00 2.31Nevada 92.76 7.24 0.00 0.69 0.05 0.00 0.74Oregon 80.28 19.72 0.00 0.78 0.19 0.00 0.97Washington 90.18 9.82 0.00 0.95 0.10 0.00 1.05
U.S. Average 87.32 10.99 1.68 1.14 0.14 0.02 1.31
a/ Agency/Client dollar errors are determined by allotting all errors to the first variance coded.
b/ Fiscal year 2005 official rates for Mississippi and Louisiana were assigned due to Hurricane Katrina. The reported data for Mississippi and Louisiana are based on eight months of sample data.
39
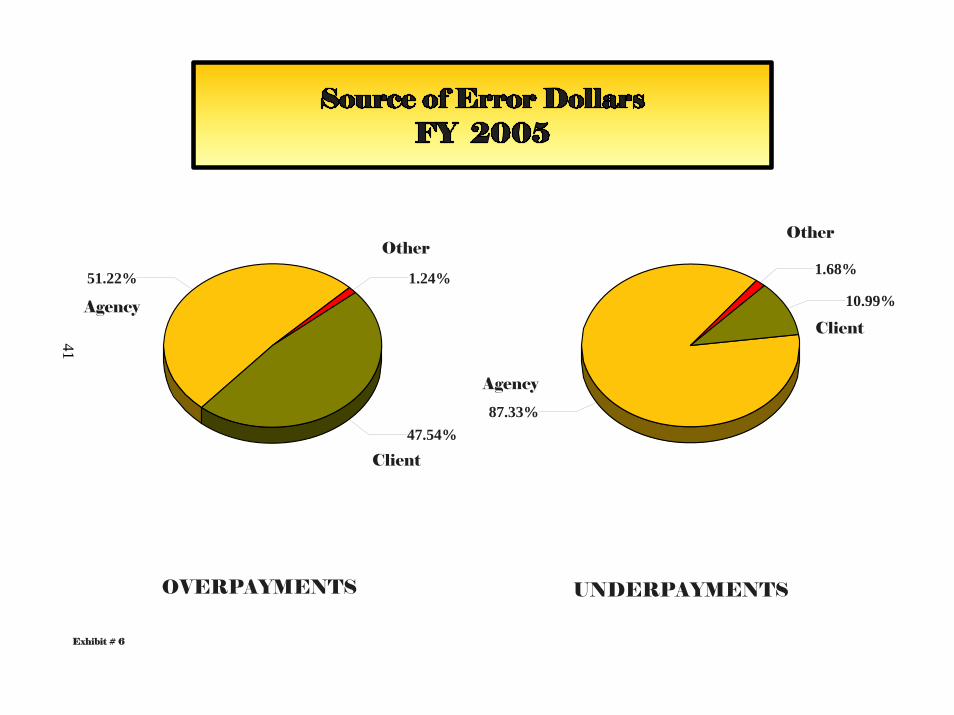
Exhibit # 6
47.54%
51.22% 1.24%
87.33%
10.99%
1.68%
Agency
Client
Agency
Client
OVERPAYMENTS UNDERPAYMENTS
OtherOther
41
PART III:
COMPARISON OF BENEFIT
AND OVERPAYMENT ERROR
DOLLARS BY HOUSEHOLD
CHARACTERISTICS
Part III provides data on the distribution of monthly benefit dollars and overpayment error dollars for
selected household characteristics for each State and on a National basis. This information can be used to
identify error prone household characteristics by comparing the percent of allotments to the percent of
error dollars.

Exhibit # 7
7.41%
92.59%
10.71%
89.29%
BENEFIT DOLLARS ERROR DOLLARS
With Elderly With Elderly
Without Elderly Without Elderly
45

Exhibit # 8
76.93%
23.07%
75.85%
24.15%
BENEFIT DOLLARS ERROR DOLLARS
Without Children Without Children
With Children With Children
47
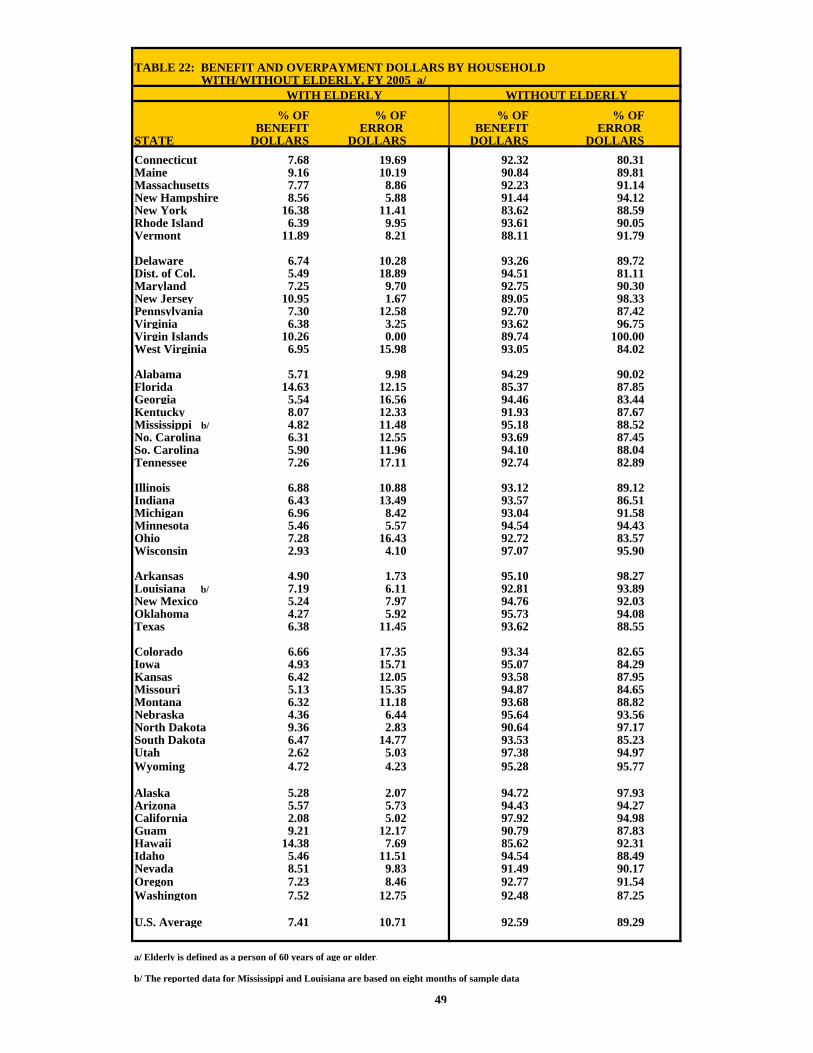
TABLE 22: BENEFIT AND OVERPAYMENT DOLLARS BY HOUSEHOLD WITH/WITHOUT ELDERLY, FY 2005 a/
WITH ELDERLY WITHOUT ELDERLY
% OF % OF % OF % OFBENEFIT ERROR BENEFIT ERROR
STATE DOLLARS DOLLARS DOLLARS DOLLARSConnecticut 7.68 19.69 92.32 80.31Maine 9.16 10.19 90.84 89.81Massachusetts 7.77 8.86 92.23 91.14New Hampshire 8.56 5.88 91.44 94.12New York 16.38 11.41 83.62 88.59Rhode Island 6.39 9.95 93.61 90.05Vermont 11.89 8.21 88.11 91.79
Delaware 6.74 10.28 93.26 89.72Dist. of Col. 5.49 18.89 94.51 81.11Maryland 7.25 9.70 92.75 90.30New Jersey 10.95 1.67 89.05 98.33Pennsylvania 7.30 12.58 92.70 87.42Virginia 6.38 3.25 93.62 96.75Virgin Islands 10.26 0.00 89.74 100.00West Virginia 6.95 15.98 93.05 84.02
Alabama 5.71 9.98 94.29 90.02Florida 14.63 12.15 85.37 87.85Georgia 5.54 16.56 94.46 83.44Kentucky 8.07 12.33 91.93 87.67Mississippi b/ 4.82 11.48 95.18 88.52No. Carolina 6.31 12.55 93.69 87.45So. Carolina 5.90 11.96 94.10 88.04Tennessee 7.26 17.11 92.74 82.89
Illinois 6.88 10.88 93.12 89.12Indiana 6.43 13.49 93.57 86.51Michigan 6.96 8.42 93.04 91.58Minnesota 5.46 5.57 94.54 94.43Ohio 7.28 16.43 92.72 83.57Wisconsin 2.93 4.10 97.07 95.90
Arkansas 4.90 1.73 95.10 98.27Louisiana b/ 7.19 6.11 92.81 93.89New Mexico 5.24 7.97 94.76 92.03Oklahoma 4.27 5.92 95.73 94.08Texas 6.38 11.45 93.62 88.55
Colorado 6.66 17.35 93.34 82.65Iowa 4.93 15.71 95.07 84.29Kansas 6.42 12.05 93.58 87.95Missouri 5.13 15.35 94.87 84.65Montana 6.32 11.18 93.68 88.82Nebraska 4.36 6.44 95.64 93.56North Dakota 9.36 2.83 90.64 97.17South Dakota 6.47 14.77 93.53 85.23Utah 2.62 5.03 97.38 94.97Wyoming 4.72 4.23 95.28 95.77
Alaska 5.28 2.07 94.72 97.93Arizona 5.57 5.73 94.43 94.27California 2.08 5.02 97.92 94.98Guam 9.21 12.17 90.79 87.83Hawaii 14.38 7.69 85.62 92.31Idaho 5.46 11.51 94.54 88.49Nevada 8.51 9.83 91.49 90.17Oregon 7.23 8.46 92.77 91.54Washington 7.52 12.75 92.48 87.25
U.S. Average 7.41 10.71 92.59 89.29
a/ Elderly is defined as a person of 60 years of age or older.
b/ The reported data for Mississippi and Louisiana are based on eight months of sample data.
49
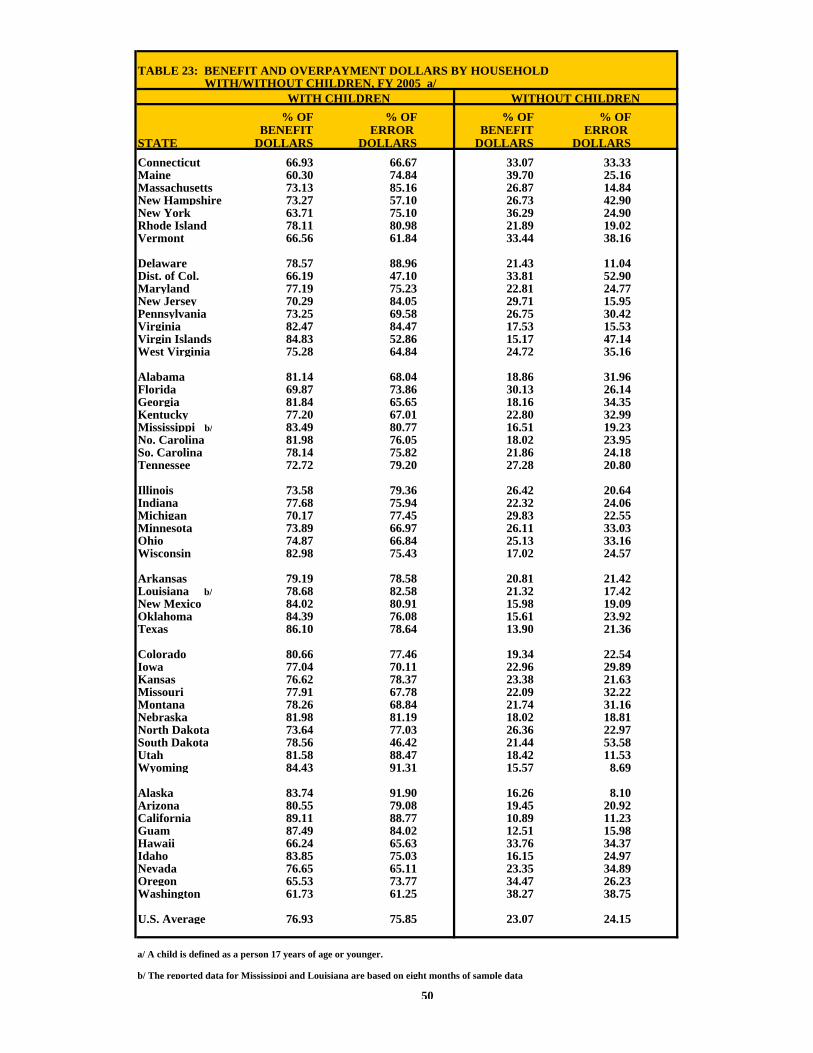
TABLE 23: BENEFIT AND OVERPAYMENT DOLLARS BY HOUSEHOLD WITH/WITHOUT CHILDREN, FY 2005 a/
WITH CHILDREN WITHOUT CHILDREN % OF % OF % OF % OF
BENEFIT ERROR BENEFIT ERROR STATE DOLLARS DOLLARS DOLLARS DOLLARSConnecticut 66.93 66.67 33.07 33.33Maine 60.30 74.84 39.70 25.16Massachusetts 73.13 85.16 26.87 14.84New Hampshire 73.27 57.10 26.73 42.90New York 63.71 75.10 36.29 24.90Rhode Island 78.11 80.98 21.89 19.02Vermont 66.56 61.84 33.44 38.16
Delaware 78.57 88.96 21.43 11.04Dist. of Col. 66.19 47.10 33.81 52.90Maryland 77.19 75.23 22.81 24.77New Jersey 70.29 84.05 29.71 15.95Pennsylvania 73.25 69.58 26.75 30.42Virginia 82.47 84.47 17.53 15.53Virgin Islands 84.83 52.86 15.17 47.14West Virginia 75.28 64.84 24.72 35.16
Alabama 81.14 68.04 18.86 31.96Florida 69.87 73.86 30.13 26.14Georgia 81.84 65.65 18.16 34.35Kentucky 77.20 67.01 22.80 32.99Mississippi b/ 83.49 80.77 16.51 19.23No. Carolina 81.98 76.05 18.02 23.95So. Carolina 78.14 75.82 21.86 24.18Tennessee 72.72 79.20 27.28 20.80
Illinois 73.58 79.36 26.42 20.64Indiana 77.68 75.94 22.32 24.06Michigan 70.17 77.45 29.83 22.55Minnesota 73.89 66.97 26.11 33.03Ohio 74.87 66.84 25.13 33.16Wisconsin 82.98 75.43 17.02 24.57
Arkansas 79.19 78.58 20.81 21.42Louisiana b/ 78.68 82.58 21.32 17.42New Mexico 84.02 80.91 15.98 19.09Oklahoma 84.39 76.08 15.61 23.92Texas 86.10 78.64 13.90 21.36
Colorado 80.66 77.46 19.34 22.54Iowa 77.04 70.11 22.96 29.89Kansas 76.62 78.37 23.38 21.63Missouri 77.91 67.78 22.09 32.22Montana 78.26 68.84 21.74 31.16Nebraska 81.98 81.19 18.02 18.81North Dakota 73.64 77.03 26.36 22.97South Dakota 78.56 46.42 21.44 53.58Utah 81.58 88.47 18.42 11.53Wyoming 84.43 91.31 15.57 8.69
Alaska 83.74 91.90 16.26 8.10Arizona 80.55 79.08 19.45 20.92California 89.11 88.77 10.89 11.23Guam 87.49 84.02 12.51 15.98Hawaii 66.24 65.63 33.76 34.37Idaho 83.85 75.03 16.15 24.97Nevada 76.65 65.11 23.35 34.89Oregon 65.53 73.77 34.47 26.23Washington 61.73 61.25 38.27 38.75
U.S. Average 76.93 75.85 23.07 24.15
a/ A child is defined as a person 17 years of age or younger.
b/ The reported data for Mississippi and Louisiana are based on eight months of sample data.
50
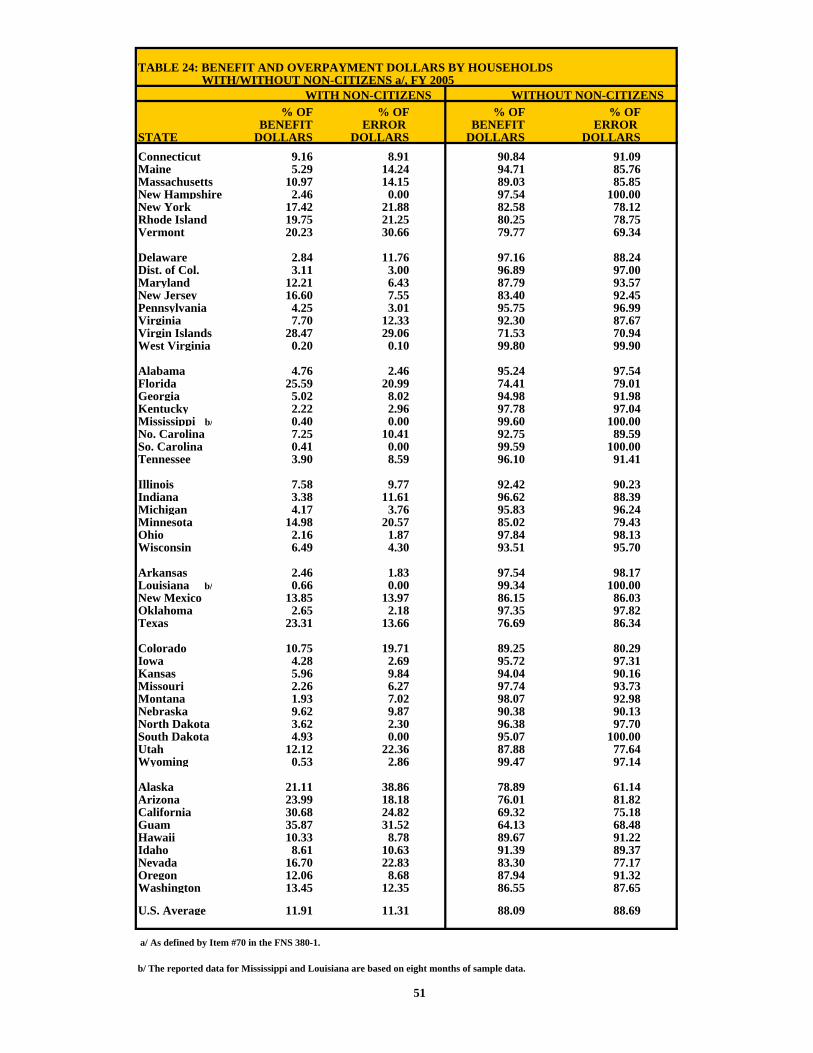
TABLE 24: BENEFIT AND OVERPAYMENT DOLLARS BY HOUSEHOLDS WITH/WITHOUT NON-CITIZENS a/, FY 2005
WITH NON-CITIZENS WITHOUT NON-CITIZENS % OF % OF % OF % OF
BENEFIT ERROR BENEFIT ERROR STATE DOLLARS DOLLARS DOLLARS DOLLARSConnecticut 9.16 8.91 90.84 91.09Maine 5.29 14.24 94.71 85.76Massachusetts 10.97 14.15 89.03 85.85New Hampshire 2.46 0.00 97.54 100.00New York 17.42 21.88 82.58 78.12Rhode Island 19.75 21.25 80.25 78.75Vermont 20.23 30.66 79.77 69.34
Delaware 2.84 11.76 97.16 88.24Dist. of Col. 3.11 3.00 96.89 97.00Maryland 12.21 6.43 87.79 93.57New Jersey 16.60 7.55 83.40 92.45Pennsylvania 4.25 3.01 95.75 96.99Virginia 7.70 12.33 92.30 87.67Virgin Islands 28.47 29.06 71.53 70.94West Virginia 0.20 0.10 99.80 99.90
Alabama 4.76 2.46 95.24 97.54Florida 25.59 20.99 74.41 79.01Georgia 5.02 8.02 94.98 91.98Kentucky 2.22 2.96 97.78 97.04Mississippi b/ 0.40 0.00 99.60 100.00No. Carolina 7.25 10.41 92.75 89.59So. Carolina 0.41 0.00 99.59 100.00Tennessee 3.90 8.59 96.10 91.41
Illinois 7.58 9.77 92.42 90.23Indiana 3.38 11.61 96.62 88.39Michigan 4.17 3.76 95.83 96.24Minnesota 14.98 20.57 85.02 79.43Ohio 2.16 1.87 97.84 98.13Wisconsin 6.49 4.30 93.51 95.70
Arkansas 2.46 1.83 97.54 98.17Louisiana b/ 0.66 0.00 99.34 100.00New Mexico 13.85 13.97 86.15 86.03Oklahoma 2.65 2.18 97.35 97.82Texas 23.31 13.66 76.69 86.34
Colorado 10.75 19.71 89.25 80.29Iowa 4.28 2.69 95.72 97.31Kansas 5.96 9.84 94.04 90.16Missouri 2.26 6.27 97.74 93.73Montana 1.93 7.02 98.07 92.98Nebraska 9.62 9.87 90.38 90.13North Dakota 3.62 2.30 96.38 97.70South Dakota 4.93 0.00 95.07 100.00Utah 12.12 22.36 87.88 77.64Wyoming 0.53 2.86 99.47 97.14
Alaska 21.11 38.86 78.89 61.14Arizona 23.99 18.18 76.01 81.82California 30.68 24.82 69.32 75.18Guam 35.87 31.52 64.13 68.48Hawaii 10.33 8.78 89.67 91.22Idaho 8.61 10.63 91.39 89.37Nevada 16.70 22.83 83.30 77.17Oregon 12.06 8.68 87.94 91.32Washington 13.45 12.35 86.55 87.65
U.S. Average 11.91 11.31 88.09 88.69
a/ As defined by Item #70 in the FNS 380-1.
b/ The reported data for Mississippi and Louisiana are based on eight months of sample data.
51
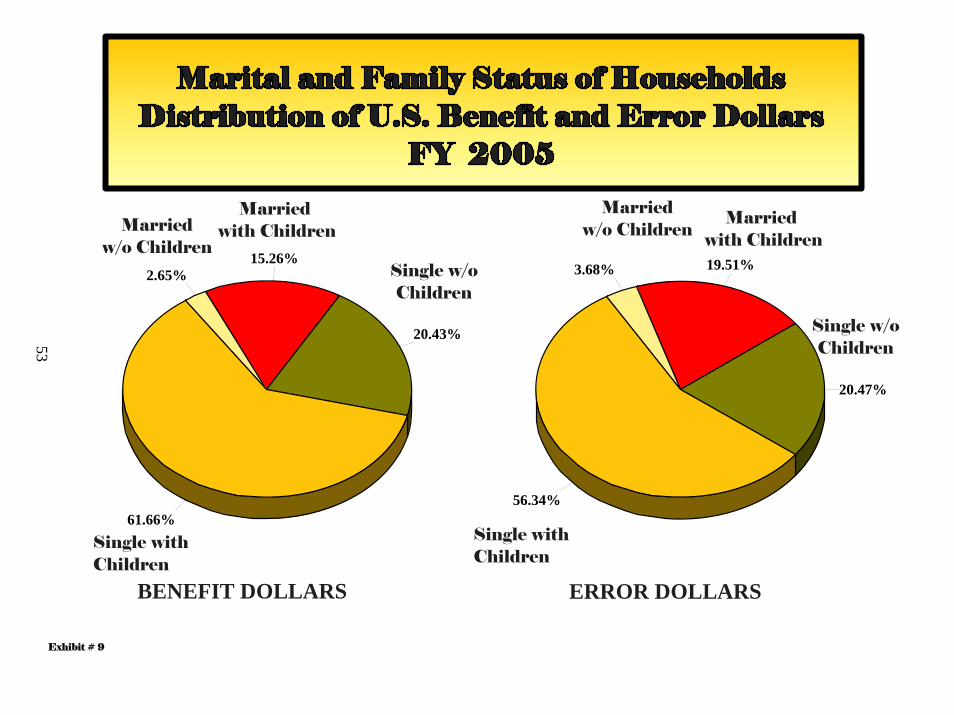
Exhibit # 9
15.26%2.65%
61.66%
20.43%
19.51%3.68%
56.34%
20.47%
BENEFIT DOLLARS ERROR DOLLARS
Marriedw/o Children
Single w/oChildren
Single withChildren
Married with Children
Marriedw/o Children
Single w/oChildren
Single withChildren
Married with Children
53
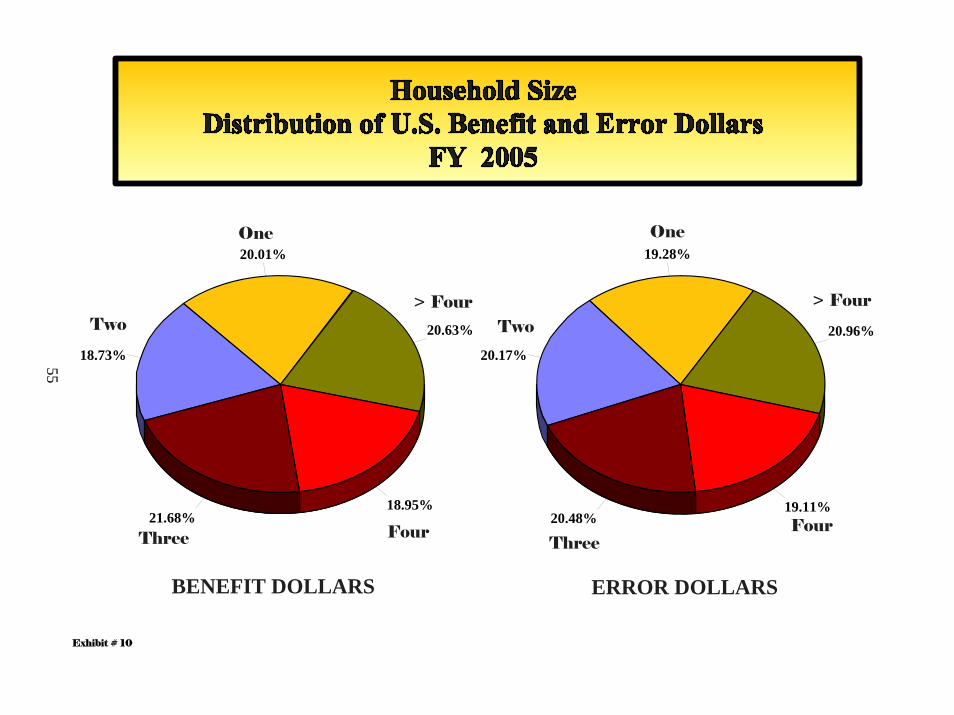
Exhibit # 10
20.01%
18.73%
21.68%18.95%
20.63%
19.28%
20.17%
20.48%19.11%
20.96%
BENEFIT DOLLARS ERROR DOLLARS
One
Two
Three Four
> Four
One
Two
ThreeFour
> Four
55

TABLE 25: BENEFIT AND OVERPAYMENT ERROR DOLLARS BY MARRIED/SINGLE HEAD OF HOUSEHOLD WITH/WITHOUT CHILDREN, FY 2005
With Spouse No Spouse
With Children Without Children With Children Without Children
% OF % OF % OF % OF % OF % OF % OF % OFBENEFIT ERROR BENEFIT ERROR BENEFIT ERROR BENEFIT ERROR
STATE DOLLARS DOLLARS DOLLARS DOLLARS DOLLARS DOLLARS DOLLARS DOLLARSConnecticut 8.76 17.19 2.92 7.87 58.17 49.48 30.15 25.46Maine 20.61 23.57 4.15 4.84 39.70 51.27 35.54 20.32Massachusetts 8.12 9.96 2.34 1.08 65.01 75.20 24.53 13.76New Hampshire 14.77 1.44 2.19 10.53 58.50 55.65 24.54 32.37New York 13.41 21.27 5.25 3.50 50.31 53.83 31.04 21.40Rhode Island 10.71 11.38 1.28 3.04 67.40 69.60 20.61 15.98Vermont 17.21 28.96 5.00 4.62 49.35 32.88 28.44 33.54
Delaware 7.77 30.02 1.36 0.00 70.80 58.94 20.07 11.04Dist. of Col. 2.06 0.00 0.63 0.00 64.13 47.10 33.18 52.90Maryland 9.16 13.23 1.49 0.50 68.03 62.00 21.33 24.27New Jersey 7.08 4.35 3.05 0.00 63.20 79.70 26.66 15.95Pennsylvania 12.74 11.17 2.66 4.66 60.51 58.42 24.09 25.76Virginia 11.20 10.94 2.00 0.00 71.27 73.53 15.53 15.53Virgin Islands 8.77 0.00 1.25 0.00 76.06 52.86 13.91 47.14West Virginia 26.71 27.39 5.00 9.73 48.57 37.46 19.71 25.42
Alabama 11.80 16.15 1.63 5.30 69.35 51.89 17.22 26.66Florida 14.36 21.20 3.72 6.02 55.51 52.67 26.41 20.11Georgia 11.60 15.39 1.89 5.40 70.24 50.26 16.27 28.95Kentucky 24.88 28.36 4.84 7.29 52.32 38.65 17.96 25.70Mississippi a/ 14.27 13.02 1.10 0.00 69.22 67.76 15.41 19.23No. Carolina 12.62 6.46 1.48 2.53 69.36 69.58 16.54 21.42So. Carolina 11.62 14.58 2.21 5.17 66.52 61.24 19.66 19.01Tennessee 18.03 15.64 4.60 4.18 54.69 63.55 22.68 16.62
Illinois 9.30 16.49 2.19 6.51 64.28 62.87 24.23 14.14Indiana 16.12 16.97 1.86 0.81 61.56 58.98 20.46 23.24Michigan 13.23 18.40 2.09 1.26 56.94 59.05 27.75 21.29Minnesota 12.73 11.64 2.28 3.22 61.17 55.32 23.82 29.81Ohio 14.20 6.53 2.61 4.76 60.67 60.31 22.52 28.39Wisconsin 17.56 20.89 1.14 1.15 65.42 54.54 15.88 23.42
Arkansas 20.92 26.57 2.27 1.56 58.26 52.01 18.54 19.87Louisiana a/ 12.44 12.84 2.07 3.24 66.24 69.74 19.25 14.18New Mexico 22.56 29.88 3.04 3.01 61.45 51.04 12.94 16.07Oklahoma 27.23 34.15 3.06 3.19 57.16 41.93 12.55 20.73Texas 21.15 34.07 2.51 4.02 64.95 44.57 11.39 17.34
Colorado 15.99 16.62 2.51 6.00 64.67 60.84 16.82 16.53Iowa 18.04 15.57 1.90 2.50 59.00 54.54 21.06 27.38Kansas 16.24 29.29 1.66 0.00 60.38 49.08 21.72 21.63Missouri 14.91 12.82 2.20 1.15 63.00 54.96 19.90 31.08Montana 23.28 20.58 2.45 0.00 54.98 48.26 19.29 31.16Nebraska 15.71 21.87 1.79 3.17 66.27 59.32 16.24 15.64North Dakota 19.34 33.69 1.73 0.00 54.30 43.34 24.63 22.97South Dakota 15.09 15.36 0.97 0.00 63.46 31.07 20.47 53.58Utah 26.43 28.27 1.54 0.00 55.15 60.20 16.88 11.53Wyoming 17.11 31.85 1.54 5.42 67.32 59.46 14.03 3.27
Alaska 33.60 29.48 1.70 0.00 50.14 62.43 14.57 8.10Arizona 17.55 42.14 2.68 3.28 63.00 36.94 16.78 17.64California 14.78 21.88 0.90 2.09 74.33 66.89 9.99 9.14Guam 33.44 47.32 4.03 0.97 54.05 36.70 8.48 15.01Hawaii 22.13 23.04 5.54 12.82 44.10 42.59 28.22 21.55Idaho 26.33 22.11 2.43 3.47 57.52 52.92 13.72 21.50Nevada 13.04 0.00 3.47 11.74 63.61 65.11 19.88 23.15Oregon 17.40 29.88 3.58 2.46 48.13 43.90 30.90 23.77Washington 15.98 8.93 3.27 1.89 45.75 52.32 35.00 36.87
U.S. Average 15.26 19.51 2.65 3.68 61.67 56.35 20.43 20.47
a/ The reported data for Mississippi and Louisiana are based on eight months of sample data.
57
TABLE 26: BENEFIT AND OVERPAYMENT DOLLARS BY HOUSEHOLD SIZE a/, FY 2005
ONE TWO THREE FOUR > FOUR
% OF % OF % OF % OF % OF % OF % OF % OF % OF % OFBENEFIT ERROR BENEFIT ERROR BENEFIT ERROR BENEFIT ERROR BENEFIT ERROR
STATE DOLLARS DOLLARS DOLLARS DOLLARS DOLLARS DOLLARS DOLLARS DOLLARS DOLLARS DOLLARS
Connecticut 28.57 22.92 18.79 21.77 21.31 22.69 13.10 3.86 18.23 28.76Maine 32.41 19.44 17.72 11.26 20.47 30.16 16.33 11.18 13.06 27.96Massachusetts 24.49 17.07 19.95 19.74 22.51 21.14 17.28 18.73 15.77 23.32New Hampshire 21.53 18.80 23.79 26.59 23.22 41.20 17.46 3.15 13.99 10.26New York 31.60 25.45 20.81 22.12 17.55 11.14 13.51 22.99 16.53 18.30Rhode Island 19.65 13.81 17.05 16.64 26.43 31.47 17.42 18.77 19.45 19.31Vermont 27.70 29.08 20.83 19.45 19.33 23.63 16.32 11.85 15.81 16.00
Delaware 18.36 11.04 20.32 21.04 24.80 23.73 23.54 31.89 12.98 12.31Dist. of Col. 30.83 48.80 19.17 11.71 20.33 15.23 10.68 17.18 18.99 7.08Maryland 20.18 24.58 17.04 18.72 23.30 24.75 18.34 11.10 21.14 20.85New Jersey 27.29 14.28 20.82 41.83 20.33 20.60 16.07 18.08 15.49 5.21Pennsylvania 21.70 19.48 17.07 17.84 22.28 13.53 16.02 27.90 22.94 21.26Virginia 14.80 13.89 21.21 25.95 25.03 19.62 23.13 4.44 15.83 36.10Virgin Islands 11.82 32.97 14.04 32.11 16.10 27.94 25.00 3.19 33.03 3.80West Virginia 17.22 15.02 21.95 29.69 20.45 23.10 22.06 26.97 18.32 5.22
Alabama 14.35 23.16 18.17 23.33 24.12 22.73 25.12 13.64 18.23 17.14Florida 27.82 21.40 18.37 22.68 19.19 11.30 16.16 25.83 18.45 18.79Georgia 14.66 22.46 18.82 19.24 24.15 15.01 20.75 23.87 21.63 19.41Kentucky 16.21 24.98 17.51 14.45 23.70 20.52 22.32 17.55 20.27 22.50Mississippi b/ 13.69 15.37 18.89 14.00 20.62 13.31 25.27 32.21 21.53 25.11No. Carolina 15.69 26.05 20.45 19.20 25.89 1.71 20.41 23.32 17.56 29.72So. Carolina 16.21 14.52 18.31 16.62 27.14 35.05 21.31 21.62 17.04 12.19Tennessee 20.29 16.62 20.41 12.48 23.17 27.05 18.40 22.91 17.72 20.94
Illinois 22.62 13.48 20.24 28.63 19.16 24.60 20.48 20.75 17.50 12.54Indiana 19.07 24.84 15.66 13.76 20.30 19.38 22.05 13.04 22.92 28.97Michigan 24.60 14.26 18.10 21.32 21.59 25.72 14.33 14.98 21.38 23.72Minnesota 25.33 24.87 22.74 27.20 21.78 33.67 14.03 4.37 16.11 9.89Ohio 22.13 27.29 17.60 13.97 21.46 23.57 18.51 17.99 20.29 17.18Wisconsin 15.16 19.16 18.18 27.20 20.81 15.09 19.58 28.14 26.26 10.42
Arkansas 15.88 14.37 15.62 18.89 23.47 16.22 18.75 15.69 26.28 34.83Louisiana b/ 16.21 11.18 17.79 18.46 24.76 39.39 16.56 13.91 24.68 17.05New Mexico 13.14 15.83 17.80 10.16 26.18 13.09 20.25 30.25 22.63 30.67Oklahoma 11.61 14.32 15.98 17.58 22.12 17.52 24.33 24.56 25.97 26.02Texas 12.28 17.49 17.39 18.42 23.33 27.13 22.55 9.98 24.45 26.98
Colorado 16.27 15.08 20.72 22.38 24.81 14.31 18.49 16.83 19.72 31.40Iowa 19.28 19.54 20.06 22.06 21.89 24.40 18.69 9.22 20.07 24.78Kansas 21.16 16.58 15.57 6.87 23.33 26.59 20.66 27.26 19.28 22.70Missouri 18.49 30.02 17.14 16.00 24.79 34.47 20.35 12.48 19.23 7.04Montana 15.29 21.66 18.68 24.79 22.97 19.81 20.94 10.35 22.13 23.39Nebraska 15.28 19.44 21.82 27.40 19.93 8.37 20.67 21.45 22.31 23.34North Dakota 23.42 22.97 18.61 11.43 18.05 12.21 18.51 25.43 21.41 27.96South Dakota 17.61 18.32 16.05 32.53 22.04 12.81 15.35 23.22 28.94 13.11Utah 16.01 8.52 14.93 13.70 16.97 23.53 23.92 32.71 28.17 21.53Wyoming 13.12 9.97 16.22 16.93 27.47 28.35 19.99 28.76 23.20 15.99
Alaska 12.09 9.69 11.92 6.38 13.04 20.50 16.89 12.21 46.07 51.21Arizona 18.43 17.17 18.11 8.66 20.92 13.30 18.52 10.34 24.02 50.53California 14.56 13.29 20.79 28.82 20.39 16.06 21.29 28.70 22.96 13.13Guam 8.54 19.76 7.92 5.40 17.11 10.05 16.55 29.15 49.88 35.64Hawaii 28.86 21.55 15.75 22.23 15.39 19.55 16.14 15.09 23.86 21.58Idaho 13.95 17.95 17.00 20.21 26.11 27.69 19.89 20.23 23.06 13.92Nevada 19.90 23.15 16.86 42.63 17.67 31.06 17.92 3.16 27.64 0.00Oregon 31.11 18.13 19.93 21.43 18.41 13.71 12.87 18.11 17.69 28.62Washington 34.98 29.53 17.81 16.64 16.73 15.56 13.93 9.63 16.55 28.64
U.S. Average 20.01 19.28 18.73 20.17 21.68 20.48 18.95 19.11 20.63 20.96
a/ Cases coded with a HH size of zero are not included in this analysis
b/ The reported data for Mississippi and Louisiana are based on eight months of sample data.
58
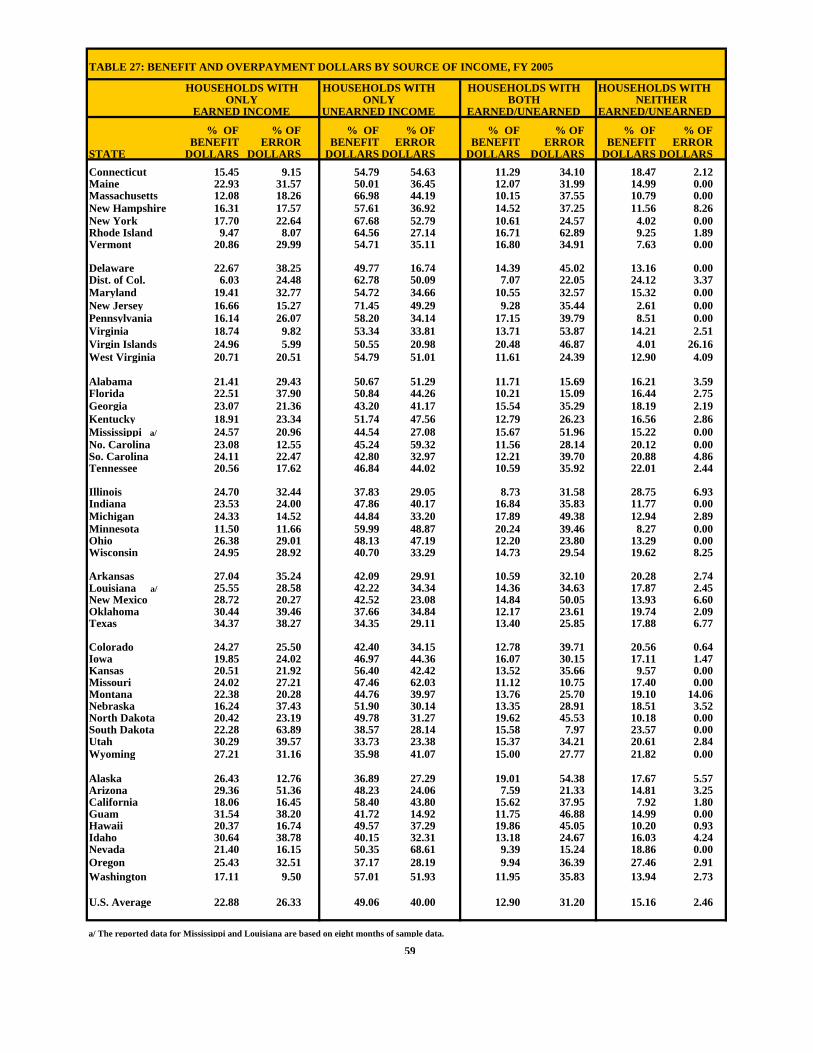
TABLE 27: BENEFIT AND OVERPAYMENT DOLLARS BY SOURCE OF INCOME, FY 2005
HOUSEHOLDS WITH HOUSEHOLDS WITH HOUSEHOLDS WITH HOUSEHOLDS WITHONLY ONLY BOTH NEITHER
EARNED INCOME UNEARNED INCOME EARNED/UNEARNED EARNED/UNEARNED
% OF % OF % OF % OF % OF % OF % OF % OFBENEFIT ERROR BENEFIT ERROR BENEFIT ERROR BENEFIT ERROR
STATE DOLLARS DOLLARS DOLLARS DOLLARS DOLLARS DOLLARS DOLLARS DOLLARSConnecticut 15.45 9.15 54.79 54.63 11.29 34.10 18.47 2.12Maine 22.93 31.57 50.01 36.45 12.07 31.99 14.99 0.00Massachusetts 12.08 18.26 66.98 44.19 10.15 37.55 10.79 0.00New Hampshire 16.31 17.57 57.61 36.92 14.52 37.25 11.56 8.26New York 17.70 22.64 67.68 52.79 10.61 24.57 4.02 0.00Rhode Island 9.47 8.07 64.56 27.14 16.71 62.89 9.25 1.89Vermont 20.86 29.99 54.71 35.11 16.80 34.91 7.63 0.00
Delaware 22.67 38.25 49.77 16.74 14.39 45.02 13.16 0.00Dist. of Col. 6.03 24.48 62.78 50.09 7.07 22.05 24.12 3.37Maryland 19.41 32.77 54.72 34.66 10.55 32.57 15.32 0.00New Jersey 16.66 15.27 71.45 49.29 9.28 35.44 2.61 0.00Pennsylvania 16.14 26.07 58.20 34.14 17.15 39.79 8.51 0.00Virginia 18.74 9.82 53.34 33.81 13.71 53.87 14.21 2.51Virgin Islands 24.96 5.99 50.55 20.98 20.48 46.87 4.01 26.16West Virginia 20.71 20.51 54.79 51.01 11.61 24.39 12.90 4.09
Alabama 21.41 29.43 50.67 51.29 11.71 15.69 16.21 3.59Florida 22.51 37.90 50.84 44.26 10.21 15.09 16.44 2.75Georgia 23.07 21.36 43.20 41.17 15.54 35.29 18.19 2.19Kentucky 18.91 23.34 51.74 47.56 12.79 26.23 16.56 2.86Mississippi a/ 24.57 20.96 44.54 27.08 15.67 51.96 15.22 0.00No. Carolina 23.08 12.55 45.24 59.32 11.56 28.14 20.12 0.00So. Carolina 24.11 22.47 42.80 32.97 12.21 39.70 20.88 4.86Tennessee 20.56 17.62 46.84 44.02 10.59 35.92 22.01 2.44
Illinois 24.70 32.44 37.83 29.05 8.73 31.58 28.75 6.93Indiana 23.53 24.00 47.86 40.17 16.84 35.83 11.77 0.00Michigan 24.33 14.52 44.84 33.20 17.89 49.38 12.94 2.89Minnesota 11.50 11.66 59.99 48.87 20.24 39.46 8.27 0.00Ohio 26.38 29.01 48.13 47.19 12.20 23.80 13.29 0.00Wisconsin 24.95 28.92 40.70 33.29 14.73 29.54 19.62 8.25
Arkansas 27.04 35.24 42.09 29.91 10.59 32.10 20.28 2.74Louisiana a/ 25.55 28.58 42.22 34.34 14.36 34.63 17.87 2.45New Mexico 28.72 20.27 42.52 23.08 14.84 50.05 13.93 6.60Oklahoma 30.44 39.46 37.66 34.84 12.17 23.61 19.74 2.09Texas 34.37 38.27 34.35 29.11 13.40 25.85 17.88 6.77
Colorado 24.27 25.50 42.40 34.15 12.78 39.71 20.56 0.64Iowa 19.85 24.02 46.97 44.36 16.07 30.15 17.11 1.47Kansas 20.51 21.92 56.40 42.42 13.52 35.66 9.57 0.00Missouri 24.02 27.21 47.46 62.03 11.12 10.75 17.40 0.00Montana 22.38 20.28 44.76 39.97 13.76 25.70 19.10 14.06Nebraska 16.24 37.43 51.90 30.14 13.35 28.91 18.51 3.52North Dakota 20.42 23.19 49.78 31.27 19.62 45.53 10.18 0.00South Dakota 22.28 63.89 38.57 28.14 15.58 7.97 23.57 0.00Utah 30.29 39.57 33.73 23.38 15.37 34.21 20.61 2.84Wyoming 27.21 31.16 35.98 41.07 15.00 27.77 21.82 0.00
Alaska 26.43 12.76 36.89 27.29 19.01 54.38 17.67 5.57Arizona 29.36 51.36 48.23 24.06 7.59 21.33 14.81 3.25California 18.06 16.45 58.40 43.80 15.62 37.95 7.92 1.80Guam 31.54 38.20 41.72 14.92 11.75 46.88 14.99 0.00Hawaii 20.37 16.74 49.57 37.29 19.86 45.05 10.20 0.93Idaho 30.64 38.78 40.15 32.31 13.18 24.67 16.03 4.24Nevada 21.40 16.15 50.35 68.61 9.39 15.24 18.86 0.00Oregon 25.43 32.51 37.17 28.19 9.94 36.39 27.46 2.91Washington 17.11 9.50 57.01 51.93 11.95 35.83 13.94 2.73
U.S. Average 22.88 26.33 49.06 40.00 12.90 31.20 15.16 2.46
a/ The reported data for Mississippi and Louisiana are based on eight months of sample data.
59
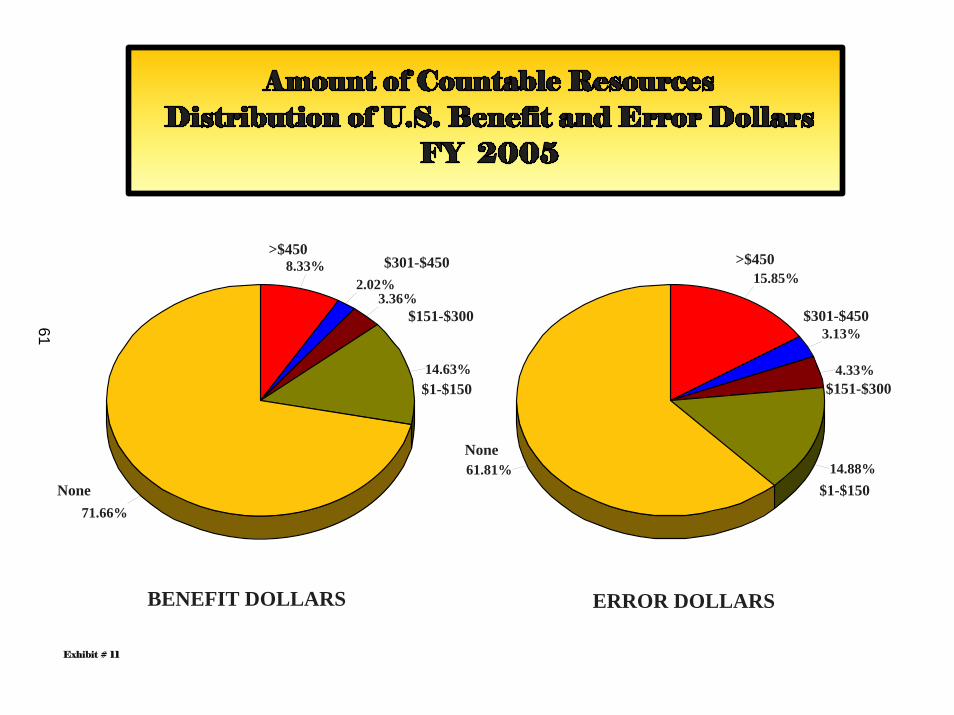
61
Exhibit # 11
71.66%
14.63%
3.36%2.02%
8.33%
61.81% 14.88%
4.33%
3.13%
15.85%
BENEFIT DOLLARS ERROR DOLLARS
None
None
$1-$150
$151-$300
$301-$450>$450
$301-$450
>$450
$151-$300
$1-$150

Exhibit # 12
22.88%
49.06%
12.90%15.16%
26.33%40.00%
31.20%
2.46%
BENEFIT DOLLARS ERROR DOLLARS
HH's with Only
Earned Income
HH's with OnlyUnearned Income
HH's with OnlyUnearned Income
HH's with Only
Earned Income
HH's with BothEarned/Unearned
Income
HH's with Both Earned/Unearned
Income
HH's with NeitherEarned/Unearned
Income
HH's with NeitherEarned/Unearned
Income63
PART IV:
SAMPLE PARAMETERS
Part IV provides information on State sampling parameters of the active and negative universes.
For active cases we have also included completion rates and standard errors for the reported and
regressed payment error rates.
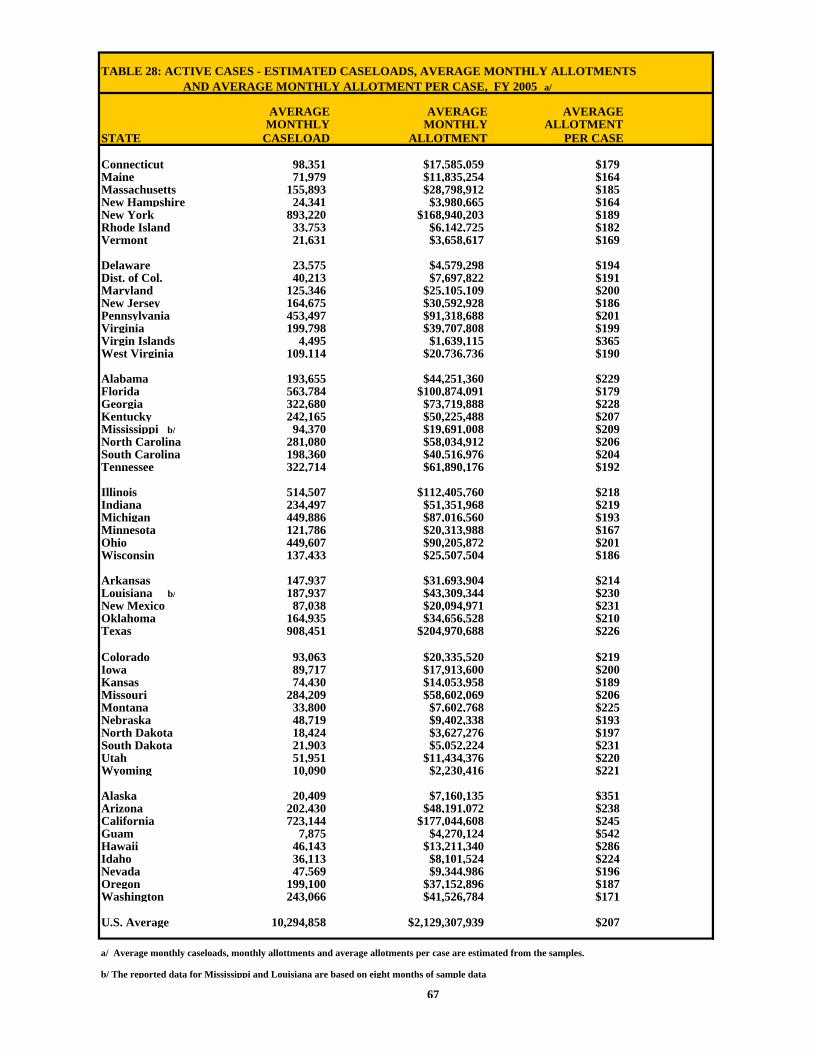
TABLE 28: ACTIVE CASES - ESTIMATED CASELOADS, AVERAGE MONTHLY ALLOTMENTS AND AVERAGE MONTHLY ALLOTMENT PER CASE, FY 2005 a/
AVERAGE AVERAGE AVERAGE MONTHLY MONTHLY ALLOTMENT
STATE CASELOAD ALLOTMENT PER CASE
Connecticut 98,351 $17,585,059 $179Maine 71,979 $11,835,254 $164Massachusetts 155,893 $28,798,912 $185New Hampshire 24,341 $3,980,665 $164New York 893,220 $168,940,203 $189Rhode Island 33,753 $6,142,725 $182Vermont 21,631 $3,658,617 $169
Delaware 23,575 $4,579,298 $194Dist. of Col. 40,213 $7,697,822 $191Maryland 125,346 $25,105,109 $200New Jersey 164,675 $30,592,928 $186Pennsylvania 453,497 $91,318,688 $201Virginia 199,798 $39,707,808 $199Virgin Islands 4,495 $1,639,115 $365West Virginia 109,114 $20,736,736 $190
Alabama 193,655 $44,251,360 $229Florida 563,784 $100,874,091 $179Georgia 322,680 $73,719,888 $228Kentucky 242,165 $50,225,488 $207Mississippi b/ 94,370 $19,691,008 $209North Carolina 281,080 $58,034,912 $206South Carolina 198,360 $40,516,976 $204Tennessee 322,714 $61,890,176 $192
Illinois 514,507 $112,405,760 $218Indiana 234,497 $51,351,968 $219Michigan 449,886 $87,016,560 $193Minnesota 121,786 $20,313,988 $167Ohio 449,607 $90,205,872 $201Wisconsin 137,433 $25,507,504 $186
Arkansas 147,937 $31,693,904 $214Louisiana b/ 187,937 $43,309,344 $230New Mexico 87,038 $20,094,971 $231Oklahoma 164,935 $34,656,528 $210Texas 908,451 $204,970,688 $226
Colorado 93,063 $20,335,520 $219Iowa 89,717 $17,913,600 $200Kansas 74,430 $14,053,958 $189Missouri 284,209 $58,602,069 $206Montana 33,800 $7,602,768 $225Nebraska 48,719 $9,402,338 $193North Dakota 18,424 $3,627,276 $197South Dakota 21,903 $5,052,224 $231Utah 51,951 $11,434,376 $220Wyoming 10,090 $2,230,416 $221
Alaska 20,409 $7,160,135 $351Arizona 202,430 $48,191,072 $238California 723,144 $177,044,608 $245Guam 7,875 $4,270,124 $542Hawaii 46,143 $13,211,340 $286Idaho 36,113 $8,101,524 $224Nevada 47,569 $9,344,986 $196Oregon 199,100 $37,152,896 $187Washington 243,066 $41,526,784 $171
U.S. Average 10,294,858 $2,129,307,939 $207
a/ Average monthly caseloads, monthly allottments and average allotments per case are estimated from the samples.
b/ The reported data for Mississippi and Louisiana are based on eight months of sample data.
67

TABLE 29: ACTIVE CASE SAMPLE SIZES AND COMPLETION RATES, FY 2005
AVERAGE CASES NOT CASES COMPLETED MONTHLY SELECTED SUBJECT NOT CASE COMPLETION
STATE CASELOAD CASES TO REVIEW COMPLETED REVIEWS a/ RATE b/
Connecticut 98,351 1,179 104 70 1,005 93.53Maine 71,979 1,152 75 111 966 89.69Massachusetts 155,893 1,160 73 128 959 88.22New Hampshire 24,341 499 17 15 467 96.89New York 893,220 1,115 70 114 923 89.10Rhode Island 33,753 758 36 90 632 87.53Vermont 21,631 457 20 23 414 94.74
Delaware 23,575 495 35 13 447 94.90Dist. of Col. 40,213 856 102 22 732 97.08Maryland 125,346 1,410 56 189 1,165 85.50New Jersey 164,675 1,117 67 65 985 93.81Pennsylvania 453,497 1,326 41 87 1,198 93.23Virginia 199,798 1,173 41 102 1,030 90.99Virgin Islands 4,495 333 10 3 320 99.07West Virginia 109,114 1,264 38 133 1,093 89.15
Alabama 193,655 1,189 38 100 1,051 91.31Florida 563,784 2,088 180 156 1,752 92.83Georgia 322,680 1,178 82 140 956 87.23Kentucky 242,165 1,341 32 207 1,102 84.19Mississippi c/ 94,370 1,143 31 48 733 71.86North Carolina 281,080 1,143 56 62 1,025 94.30South Carolina 198,360 1,171 91 68 1,012 93.70Tennessee 322,714 1,140 72 144 924 86.52
Illinois 514,507 1,185 40 170 975 85.15Indiana 234,497 1,154 40 49 1,065 95.60Michigan 449,886 1,086 46 100 940 90.38Minnesota 121,786 1,152 38 99 1,015 91.50Ohio 449,607 1,284 77 126 1,081 89.56Wisconsin 137,433 1,138 40 49 1,049 95.54
Arkansas 147,937 1,450 62 55 1,333 96.04Louisiana c/ 187,937 797 22 33 742 72.75New Mexico 87,038 1,176 45 81 1,050 92.83Oklahoma 164,935 1,179 63 47 1,250 96.38Texas 908,451 1,200 62 42 1,096 96.40
Colorado 93,063 1,233 114 87 1,032 92.23Iowa 89,717 1,497 48 187 1,262 87.09Kansas 74,430 1,245 62 115 1,068 90.28Missouri 284,209 1,293 61 228 1,004 81.53Montana 33,800 743 20 117 606 83.82Nebraska 48,719 877 26 54 797 93.65North Dakota 18,424 802 18 23 761 97.07South Dakota 21,903 457 10 10 437 97.76Utah 51,951 1,075 53 65 957 93.64Wyoming 10,090 374 22 7 345 98.01
Alaska 20,409 450 27 23 400 94.56Arizona 202,430 1,373 133 81 1,159 93.47California 723,144 1,277 233 152 892 85.44Guam 7,875 329 14 0 315 100.00Hawaii 46,143 920 48 45 827 94.84Idaho 36,113 899 34 40 825 95.38Nevada 47,569 950 113 79 758 90.56Oregon 199,100 1,188 102 60 1,026 94.48Washington 243,066 1,097 45 24 1,028 97.64
U.S. Total 10,294,858 55,567 3,085 4,338 47,986 90.34 d/
a/ Completed cases are only those cases coded class 1.b/ Completion rates for stratified States are weighted with stratum caseloads.c/ The reported data for Mississippi and Louisiana are based on eight months of sample data.d/ The U.S. completion rate is weighted by State average monthly caseload.
68

TABLE 30: ACTIVE CASE SAMPLE SIZES AND STANDARD ERRORS, FY 2005
STATE FEDERAL
COMPLETED REPORTED STD ERROR (%) COMPLETED REGRESSED STD ERROR (%) STATE COMBINED REP. PAYMENT FEDERAL COMBINED REG. PAYMENT
STATE REVIEWS ERROR RATE ERROR RATE a/ REVIEWS ERROR RATE ERROR RATE a/
Connecticut 1,005 6.49 0.76 432 6.61 0.73Maine 966 7.27 0.81 420 7.59 0.94Massachusetts 959 3.72 0.48 424 3.88 0.35New Hampshire 467 5.82 1.09 233 5.91 1.25New York 923 5.99 0.74 394 7.23 0.78Rhode Island 632 9.21 1.13 284 9.84 1.15Vermont 414 5.38 1.00 217 5.64 0.97
Delaware 447 6.32 1.03 210 6.46 1.23Dist. of Col. 732 8.74 1.11 308 9.89 1.32Maryland 1,165 5.14 0.60 402 5.49 0.61New Jersey 985 3.95 0.60 383 4.79 0.72Pennsylvania 1,198 4.32 0.59 472 4.51 0.56Virginia 1,030 5.57 0.70 407 5.79 0.73Virgin Islands 320 2.11 0.68 160 2.11 0.73West Virginia 1,093 5.68 0.66 430 5.94 0.53
Alabama 1,051 3.83 0.55 412 3.68 0.42Florida 1,752 7.01 0.66 586 7.19 0.69Georgia 956 4.52 0.60 375 4.89 0.72Kentucky 1,102 4.20 0.55 432 4.56 0.59Mississippi b/ 733 3.38 0.54 288 3.00 0.60North Carolina 1,025 2.89 0.56 403 2.97 0.43South Carolina 1,012 5.33 0.67 398 5.44 0.62Tennessee 924 5.75 0.78 390 6.01 0.79
Illinois 975 5.38 0.63 399 5.75 0.60Indiana 1,065 6.44 0.71 420 6.58 0.72Michigan 940 7.06 0.78 415 7.34 0.96Minnesota 1,015 7.43 0.85 410 7.60 0.70Ohio 1,081 8.48 0.79 414 8.65 0.84Wisconsin 1,049 5.39 0.57 427 5.61 0.55
Arkansas 1,333 5.38 0.56 400 5.43 0.57Louisiana b/ 742 6.00 0.79 270 5.83 0.81New Mexico 1,050 5.87 0.67 400 5.99 0.65Oklahoma 1,250 7.36 0.69 403 7.42 0.76Texas 1,096 4.98 0.59 400 5.03 0.53
Colorado 1,032 6.77 0.66 406 7.42 0.68Iowa 1,262 5.27 0.53 419 6.03 0.72Kansas 1,068 5.30 0.68 419 4.37 0.61Missouri 1,004 4.60 0.68 393 5.10 0.77Montana 606 3.68 0.63 270 4.05 0.57Nebraska 797 4.34 0.70 331 4.45 0.61North Dakota 761 3.54 0.51 293 3.59 0.45South Dakota 437 1.17 0.38 210 1.19 0.45Utah 957 4.28 0.59 388 4.41 0.61Wyoming 345 6.84 1.32 166 7.03 1.01
Alaska 400 6.19 1.07 236 6.51 1.06Arizona 1,159 7.63 0.83 416 7.61 0.87California 892 5.87 0.61 385 6.38 0.62Guam 315 6.22 0.94 179 6.20 1.07Hawaii 827 5.50 0.70 328 5.63 0.64Idaho 825 8.24 0.96 296 8.34 1.21Nevada 758 2.42 0.46 330 2.86 0.33Oregon 1,026 5.94 0.75 429 5.71 0.85Washington 1,028 2.87 0.47 411 2.72 0.49
U.S. Total 47,986 5.57 0.13 19,123 5.84 0.14
a/ The listed standard errors can be used in conjunction with the FY- 04 error rates to calculate confidence intervals for the combined payment error rate. The 95% lower confidence limit is 1.96 standard errors less than the corresponding value, the upper 95% confidence limit is 1.96 standard errors greater than the value.
b/ The reported data for Mississippi and Louisiana are based on eight months of sample data.
69
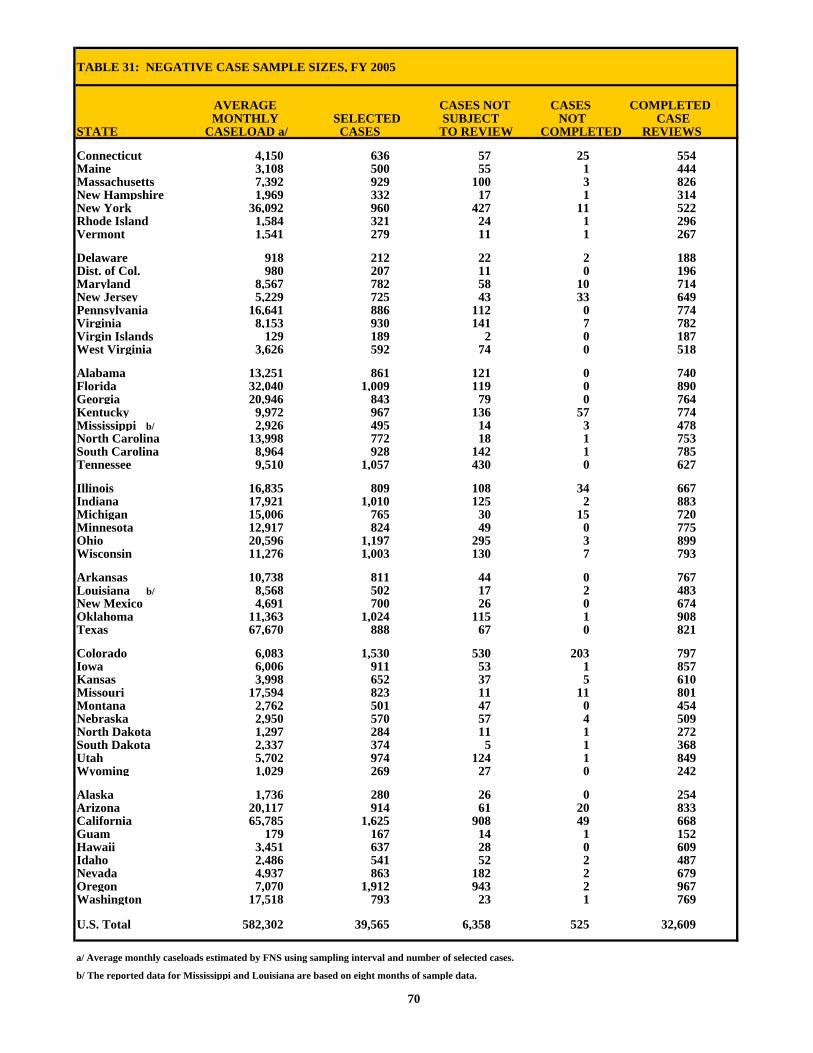
TABLE 31: NEGATIVE CASE SAMPLE SIZES, FY 2005
AVERAGE CASES NOT CASES COMPLETEDMONTHLY SELECTED SUBJECT NOT CASE
STATE CASELOAD a/ CASES TO REVIEW COMPLETED REVIEWS
Connecticut 4,150 636 57 25 554Maine 3,108 500 55 1 444Massachusetts 7,392 929 100 3 826New Hampshire 1,969 332 17 1 314New York 36,092 960 427 11 522Rhode Island 1,584 321 24 1 296Vermont 1,541 279 11 1 267
Delaware 918 212 22 2 188Dist. of Col. 980 207 11 0 196Maryland 8,567 782 58 10 714New Jersey 5,229 725 43 33 649Pennsylvania 16,641 886 112 0 774Virginia 8,153 930 141 7 782Virgin Islands 129 189 2 0 187West Virginia 3,626 592 74 0 518
Alabama 13,251 861 121 0 740Florida 32,040 1,009 119 0 890Georgia 20,946 843 79 0 764Kentucky 9,972 967 136 57 774Mississippi b/ 2,926 495 14 3 478North Carolina 13,998 772 18 1 753South Carolina 8,964 928 142 1 785Tennessee 9,510 1,057 430 0 627
Illinois 16,835 809 108 34 667Indiana 17,921 1,010 125 2 883Michigan 15,006 765 30 15 720Minnesota 12,917 824 49 0 775Ohio 20,596 1,197 295 3 899Wisconsin 11,276 1,003 130 7 793
Arkansas 10,738 811 44 0 767Louisiana b/ 8,568 502 17 2 483New Mexico 4,691 700 26 0 674Oklahoma 11,363 1,024 115 1 908Texas 67,670 888 67 0 821
Colorado 6,083 1,530 530 203 797Iowa 6,006 911 53 1 857Kansas 3,998 652 37 5 610Missouri 17,594 823 11 11 801Montana 2,762 501 47 0 454Nebraska 2,950 570 57 4 509North Dakota 1,297 284 11 1 272South Dakota 2,337 374 5 1 368Utah 5,702 974 124 1 849Wyoming 1,029 269 27 0 242
Alaska 1,736 280 26 0 254Arizona 20,117 914 61 20 833California 65,785 1,625 908 49 668Guam 179 167 14 1 152Hawaii 3,451 637 28 0 609Idaho 2,486 541 52 2 487Nevada 4,937 863 182 2 679Oregon 7,070 1,912 943 2 967Washington 17,518 793 23 1 769
U.S. Total 582,302 39,565 6,358 525 32,609
a/ Average monthly caseloads estimated by FNS using sampling interval and number of selected cases.
b/ The reported data for Mississippi and Louisiana are based on eight months of sample data.
70