New Nanoporous Materials - COnnecting REpositories · New Nanoporous Materials 2009年IA ... cyl...
72
(千葉大学学位申請論文) Characterization and Adsorption P New Nanoporous Materials 2009年IA 千葉大学大学院自然科学研究科 物質高次科学専攻 物質科学 奥野 悠
Transcript of New Nanoporous Materials - COnnecting REpositories · New Nanoporous Materials 2009年IA ... cyl...

(千葉大学学位申請論文)
Characterization and Adsorption Propenies of
New Nanoporous Materials
2009年IA
千葉大学大学院自然科学研究科
物質高次科学専攻 物質科学
奥野 悠

Index
C血apter 1 Gener紐血tm血。tioL…………・……・・…………・……1 1」Intro duction of Nanoporous Materials_____.___._1
1.2Nanoporous Materials____..___..___.__3 References....-1....蟹曜,..........,..曹...-..1........⇔.,,.嘩.,.,6
Chapter 2 Charactertza“on Metho“s____._._._____11 References .......,....,........,尋...1.......,...督....,..,.... 17
C.hapter 3 Nanostructured Metal .___._,_.._____._20 3」,Introducti on .................................壷..暫.......... 20
3.2Experimental ........._._、..._....。。.._。._._...__...21
33Resuts&Discussion...._..,..................。..........,..22
3.3.1Nanostructured Nickel................,..............22
3.3.2Na血ostructured lron.................................26
3,3.3 Na nostructured Ni/Fe alloy.,__.、__....__....30
3.3.4Comparison ofNanoporosity ofNS-metals._._..._36
3.4Conclusio皿 .....層..,......_1...........-..,...........勝... 38
References..量.........曽....,.................,.......,....昏..39
Chapter 4 Vapor GroWth Spherical Carbon._.._.、...._..._.__.__
4.lIntro duction ........鱈.......,,.看.。....、.,.岬,.畳..,、.........
4.2Preparation ofVGS C...、_..._____,.,.._..、......__.
4.3Charactert乙ation....,............,.........1.⇔............_
4.4Conclusion.............曽...,.........噸....,....,.φ.,匂..._
References....騨.,.........騨....曹..1..1.1..馴........層..曹......
Chapter 5 Carbon Nanoribbon.__,__、........_._.__...,........51
5.ユintroductio皿 ..,.........畢.............._..1..,,章..,.....,. 51
5.2]Experimenta1 ..._.__...._.._........__。..、.._.,_.、.52
5.3Characterization ,,.,....,.....
5.4Conclusion ...,..............
.......,.冒『...,,..,.......舶.. 52
.....孕,...書...。嘗...........噛.. 63

References....,...........
General Conclusion_.._...._._
A也㎞owledgement..._.._ ,。三,
...;.........ゆ.......,..,......,... 65
.......,.,......。....1.-..... _... 67
....1,,..,.......,..薗.∴....6...響...-69

Chapter 1
General Introdu¢tion
1.1 lntroduction of Nanoporous Materials
Nanoporous materials have gathered a great attention getting because of their
interesting Properties, especially their adsorption properties. The adsorp廿on properties
are derived from 1arge surface area and presence of na:nopores. h nanopores, molecules
are adsorb ed very strongly and they show extraordinary phenomena and properties such
as quantum effect, reduced coordination皿㎜ber, formation of cluster,皿agnetism,
elevatio皿of melting point and so on[1]一[15].
These results are derived f士om overlapping of molecule-wall interaction. A
molecUle which approaches to surface of solid intera.cts With the surface. The strength of
interaction between a molecule and the atoms of the surface is determined by
Len皿ard-Jones potential.
E(r)=・4s
o(9)’2-〔多)6}
Where r is the distance betWeen the molecule and surface,εis depth of the
e皿ergy well, andσdi stance at which the interactio皿energy E(r)change s from positive
to negative energy, that is E(r)=0. The surface-atom一エnolecUle palr lnteractlons are
integrated oΨer the effective solid sur face regio皿, leading to a consi derably strong
mOlecure・surface interaction.
1

E(r)
Fi gure:14 Le㎜ard-Jones potenti al
Theエnolecule-sur face interactions fbr opPosite pore walls of the slit-shaped
overlap each other, deepening the interaction potentia正waU. Molecules are strongly
adsorbed in nanopores. This enhanced interaction potential in nanopores is shown in the
schcme b elow. Potential well becomes deeper as the Width of nanopore becomes smaller
[16」.
Fig肛e:1 -2 Overlapping of Lennard-Jones potentia1
There are many kinds of nanoporous materials. The indivi dual pores may vary
greatly both i皿size and in shape wi廿豆n a given materi…al, f士om one solid phase to
another. Even a defi皿ite mate㎡als such as activated carbon has distribution in pore siZe,
pore shape, and pore connection. Although there are aViViety of pore shapes, slit and
cylindrical pores are reprosentative ones. The slit Width of the slit pore and diameter of
cyl indri ca1 pre are defined the pore width w. IUPAC classified pores into micropores,
mesopores, and macropores according to w as fbllows. Here, micropores and small
mesopores are often called nanopores recently.[17][18」.
2

Micropores
Mesopores
Macrop ores
w<2nm2nm 〈w<50㎜
50㎜くw
hmicropores of which pore size is of molecular dimension, the interaction
between the pore and molecule is enhanced due to overlapping of interactions
mentioned above, causing the strong adsorption from low pressure region, which is
called micropore fillin、g The micropores are subdivided into ultramicropores of w<
O.7nm and superrnicropores of O,7㎜〈w<2nm[19]{21}α7㎜is the傭e of
dia neter of a nitrogen molecUle. Consequently a serious entrance blocking often occurs
in ultramicropores.1n the mesopole range, adsorption with capillaエy condensation
whose adsorption isotherm has an adsorption hysteresis, takes place.工n macropores
molecules are adsorbed on the macropore sur魚ce with multi-layer adsorption
mechanism. In this research we fbcus on nanopores which exhibit the enhanced
molecule-pore wall interaction.
1.2 Nanoporous Materials
Nanoporous materials are applied to the various fields such as adsorptioq
separation, catalysts, electric devices, gas storage and so on. Many nanoporous
materials are actively stUdied all over the world.
Silica gel
Silica gel is a granUlar, porous form of silica made syn止e翻1y丘om sodium
silicate. Particle size and surface area are controlled by conditi ons of pH, tempereture,
and so on. Silica gel is sphere shape蜘cles㎝d it have丘。m 2 to 20rm in diameter.
Silica gel have high surface area about 800 m2/g and the sutface llave-OH group.
Therefbre it can absorb water strongly, and it is usefUl as a desiccant Particles fbrmate
Si-0-Si bond with neibor panicles. Therefbre sintering does not cause and nanpores
structure are created.
Activated alumina
Ac廿vated認㎜ina is a hi帥ly porous alum ina manUfactured from alummium
3

hydroxide by dehydroxylating. This material have a su血cc area about l 50-500 m2/g,
The compound is used as a desiccant, catalyst support, filter of fluoride, arsenic and
selenium in drinking water. Activated alumina has a lot of nanopores, almost like
tumels, that run throughout it. Activated alumina is also used as template of preparetion
of nanoporous materials[22】[23],
Activated carbon
Activated carbon is a fb㎜of carbon that is processed to make it ex廿emely
porous and thus to have a very large surface area available fbr adsorption or chemical
reactions. Activated carbon is produced丘om carbonaceous souroe materials like
nutshells, wood and coal and so o皿. The precursor is pyrolysed at temperatures in the
range 950-1350 K in absence of air(argon orエritrogen)and activated with steam. or
carb on dioXide. Many kinds of activated oarbon are prepared and their properties are
various. There are not only carbon which have about l OOO-1200 m2/g but also carbon
which have 2000-3000 m2/g. Pore size is about 1.Onm, mea nwhile there is mesopOres
carbon(w = 3.Onm)by usi皿g zeolite MCM-48 as template[24】. Activated carbon has
surface fU皿ctional group such as carbo)ryl group, hydroxy正group, and ketone group;
accordingly it contains about 10%of oxygen、 Surface of carbon expect the fU皿ctional
group i s hydropho『bic and i s superior to adsorpti on of organic molecules[25-30].
Activated carbon fiber
Activated carbon fiber(ACF)is fi『ber-shape activated carbon. The na皿opore s of
ACF can adsorb hydrogen very strongly. It is expected to be applied as hydrogen
strorage in fUel celI, Slit-shaped pores are apPlied as nanospace to observe the properties
of molecules in皿anopores[31]一[40].
There are many way to improve ACF such as modificati o皿, activate, doping,
and so on. Many researchers reported new ACF whi ch have high surface area or gas
adsorbability[41]一[51].
Zeolite
Ze。lites are aluminosilicate miner田s鋤d have a nanoporous struc鵬
Compositon of zeolite is(xAl2・ySiO2・zH20). It is natural material and had been
discovered in l 756,175 unique zeolite fヒameworks have been identified, and over 80
4

naturally occurring zeolites are known. Zeolites have a porous structure that can
accominodate a Wide variety of cations, such as Na+, K+, Ca2+, M{罫+and others. These
positive ions are rather loosely held and can readily be excha皿ged for others in a contact
solution. Entrance of nanopores are composed by 4-12 membered ring and width of
na皿opore i s deterrnined strictly. Thus, ze olite has molecUlar sieVing effect. Zeolites are
also apPlied as template ofnanoporous materials[52}[551.
There are many variation in composition, nanopore stuructUre, and crystalline
structUre. Allnost of them are hydrophilic. Since anifical zeolite was synthesized加
1949,a lot of kdndS of zaolites ware applicated血many way[56][57エ.
Metal organic frameworks
Metal-Orga皿i c Frameworks(MOFs)are crystalline compounds consisting of
meta1 i ons or clusters co ordinated to often rigid organic molecUles to form one-, two-, or
three-dimensional structures that oan be nanoporous. The pores are stable and can be
used fbr the storage of gases such as llydrogen, carbon dioxide, argon, methan and so on
[581{60].The MOF whioh was synthesized by「血ghi has very lhgh su血oe area(2900
m2/g)Emd micropore volume(054-0.61 gt。m3)[61], MOFs are eXpect to be applied as
gas storage,catalysち and molecUlar sieVing[62][63}
A MOF shows unique adsony)tion properties that arnou皿t of ads orption shai:[〕1y
uprise in high pressure although the sample hardly adsorbed moIecules i皿law pressure
[64][65].
Ever now, many researchers are studying nanoporous materials a皿d new
nanoporous materilas are prepared all over the world. In this paper, three new
nanostrucred materials were reported. Na皿ostructured Metals Will be described in
Chapter 3, Vapor Growth Spherical Carbon(VGSC)Wi11 be described in Chapter 4, and
Carbon Nanoribbon Wi11 be describ ed in Chapter 5.
5

References
[1]T, Ohba, H.Kanoh, K.Kaneko,.」. Phys. Ch em.、B,108,14964-14969(2004)
[2]TOh㎞b o, Y Hattori, H. Kanoh, T. Konishi, T. F曝kawa, K. Kaneko,1, Phys.
Che〃z. B,107,1361643622 (2003)
[3]H.Tanaka, H. Kanoh, M. E.-Merraoui, W. Steele, M Yudasaka, S.Iij ima, K.
Kaneko,」:」Phys. Chem. B,108,17457-17465(2004)
[4]YMa㎡wa, H Kataura, M. Abe, A. Udaka, S. Suzuki, Y Achiba, H. Kira, K.
Matsuda, H. Kadowaki, Y Okabe, Chem’cal、Physics Letters,401,534-538(2005)
[5]H.Kanoh and K. Kaneko,」. Phys. Chem,99,5746-5749(1995)
[6]H.Kanoh, and K. Kaneko, Chem. Phys. Lett.,237,329-333(1995)
[7]H.Kanoh aエ1d K. Kaneko,」. Phys, Chem.,100,755-759(1996)
[8]H.K鋤oh, Asako Zamma, N, S etoyama, Y. Hanzawa and K. Kaneko, Langm uir,13,
1047-1053(1997)
[9]Todoh and K. Kaneko, Chem. PhJ~s.、乙ett.,340,33-38(2001)
[10]H.Tanaka, J. Fan. H、 Kanoh, M. Yudasaka, S. Iij ima, and K. Kaneko, Mol. Simul.,
31,465(2005)
[11]H.Tanaka, H. Kanoh, M. Yudasaka, S.珂ima, and K. Kaneko,」. Am. Chem. Soc.,
127,7511(2005)
[12]T.Ohb a, H. Kanoh, and K. Kaneko, Nano」L(7tt.,5,227(2005)
[13]YHattori, H. Tanaka, F Okino, H. Touhara, Y Nakahigashi, S. Utsumi, H. Kaエ10h,
K二.Ka血eko,」:Phソs.(訪θ〃L五},110,9764(2006)
[14]D.Noguchi, H. Tanaka, A, Kondo, H. Kaj iro, H Noguchi, T. Ohba, H. Kanoh, K,
Kaneko,」二Amen Ch8m. Soc.,130,6367-6372(2008)
[151K. Kaneko, T. Iiyama, Z. Wiang and Y Hanzawa, Advances in Porous Materials
(MRS 371),401-412(1995)
6

[16]S.GGregg, K S. W Sing,!Idsorption, Academic press(1982)
[171K S. W Sing, D.旺Evere廿, R. A. W Hau1, L Moscou, R A. Piero廿i,工Rouquerol,
and T. Siemieniewska, Pure Appl. Chem.,57,3603(1985)
[18]J.Rouquerol, D. Avnir, C. W Fairblidge, D. H. Everett, J. H. Haynes, N. P emi core,
工D.ERamsa弘KS. W Sing, and K K Unger, Pure Appl. Chem.,66,1739
(1994)
[19]S,Brunauer,加‘‘Sur face area Deten皿ination”, Proc, Int, Symp.1969(eds. D. H.
Everett and R. H. Ottewil1), p.90 Butterworths, London(1970)
[20]M. M. Dubinrin,加‘℃haracterization of Porous S olids”, Proc, ht, Symp.1978(eds.
S.工Gregg a皿d K S. W Sing and H. E Stroeclldi), p.1Soc. Chem. Ind., London
(1979)
[21]S.J. Gregg and K. S. W Sing, in‘‘Adsorption, Surface Area and porosity”2皿d
edition, Academic press, London(1979)
[221Y Lei, W Chim, Z. Zhang, T. Zhou. L. Zhang, G Meng, E Phillipp, Chemioal
P、hysics L召tters,380,313-318(2003)
[23]C,TLin, T H. Chen, T. S. Chin, C. Y Lee, H. T. Chiu. Carbon,46,741-746(2008)
[24]R.Ryoo, S. H. Joo, S.J㎜,」. Phys. Chem.B.,103,7743(1999)
[25]S.Manzi, D, ValIadares, J, Marchese, G Zgrablich, Adsorption Sci. Technol.,15,
301(1997)
[26]D.Lozano-Caste116, D. Cazorla-Amor6s, A Linares-Solano and D. E Qui㎜,
Cαハうo刀,40,989(2002)
[27]Z.Ma, T. Kyotani, Z. Liu. O. Terasaki, A. T()mita, Chem Maten,13,4413(2001)
[28]ERodoriguez-Reinoso,」、 Mar廿i且一Martinez, M, Molina-Sabio, R. Torregrosa and J.
Garrido-Segovia,」. Collo id」lnterface Sci.,106,3正5(1985)
[29ユN.Setoyama, K. Ka血eko and E Rodoriguez-Reinoso,」. Phys, Chem、,100,10331
(1996)
[30]T.liyarna, K. Nishikawa, T. Otowa a血d K. Kaneko, J.」Plrys. Chem.,99,10075
(1995)
[31]K,Kaneko and K. Kakei,」. Co〃oゴゴ、rnterface Sci.,129.583(1989)
7

[32]YF円’iwara, K Nishikawa, T. Iij ima and K. Kaneko, J. Chem. Soc. Faraday Trans.,
87,2763-2768(1991)
[331M Jaroniec, R. K Gilpin, K. Kaneko and工Choma, Langmuか,7, 2719(1991)
[34]NSetoyama, M Ruike, T. Kasu, T. Suzuki and K. Ka皿eko, Lagmuir,9,2612
(1993)
[35]MRuike, T. Kasu, N. Setoyama, T. Su加ld and K. Kaneko,1. Phys Chem.,98,
9594(1994)
[36]YKaneko, K Ohbu, N Uekawa, K, F uj ie and K. Kaneko,加ngmuか,11,708-710
(1995)
【37]T. liyarna, T. Suzuki and K. Kaneko, Che〃乳P勿霊一Lett.,259,37-40(1996)
[38】MS. Dresselhaus, A. W P Fung, A. M. Rao, S. L. dli Vittorio, K.. Kuriyama, G
Dresselhaus, and M. Endo, Carbon,30,1065(1992)
[391K Kaneko, C Ishii, M Ruike, and H Kuwabara, Carbon,30,1075(1992)
[40]KKaneko, T. Katori, K. S himizu, N. Shindo and T. Maeda,」. Chem. Soc. Faraday
Trans」,88,1305-1309(1992)
[41]K,Kaneko, N. S etoyama, G Li, E OIdno, T. Ishikawa, M. Kanda and H. Touhara,
㎜0,187,71-76(1999)
[42]C.M.「Yang and K. Kaneko, Carbon,39,1075-1082(2001)
[431C. M, Yang and K. Kaneko,1, Collo id ln彪rface Sc i.,246,34-39(2002)
[44]J.Miyamoto, H. Kanoh, K, Kaneko, Carb on,43,855-857(2005)
[45]A.Matsumoto, M Ruike, T. Suz面㎜d K. Kaneko, Collo ids Surf A,74,15-21
(1993)
[46ユGXH, K. Kaneko, S. Ozeki, F. Oldno and H. To曲a,」. Collo id lnterface Sci.,
172,539(1995)
[47]GX. Li, K. Kaneko, S. Ozeki, F Okino R. Ishikawa, M. Kanda a皿d H Touhara,
Langmuか,11,716(1995)
[48]N.Setoyam亀 G X. H, K. Kaneko, E Okino R. Is臆awa, M. Kanda and且. Tonhar亀
Adsorlフtion,2,293(1996)
8

[49]YNishi, T. Suzuki and K Kaneko,」. Phys. Chem.、B,101,1938-1939(1997)
[50]A.Oya, S. Ybshida, and Y Abe, Carbon,31,71(1993)
[51]A.Oya, S. Ybshida, J. AIcaniz-Monge and A. Linares-Solano, Carbon,34,53
(1996)
[521Z. Ma, T. Kyotani, A. Tbmita, Carbon,40,2367-2374(2002)
[53]K.Matsuoka, Y Yamagi shi, T. Yarnazaki, N. S etoyama, A. Tomita, T Kyotani,
Carb on,43,876-879(2005)
[54]J.Koloczek, A. Brodka, A. Burian, J.C. Dore, V Honkimaki, T Kyotani, Diamond
and Relatedルlaterials,15,1036-1040(2006)
[55ユJ.1.Paredes, A Mardnez-AIonso, J, M. D. Tasc6n, T Yiamaz{iEki, K. Matsuoka, T.
Kyotani, Mieropon Mesopon Ma彪n,87,268-271(2006)
[56]EMFIanige几」. M Benne賃, R. W Grose, J. P Coh鉱R. L Pa廿on, R. M.
Kirchner,1>ね’z∫アθ,271,512-516(1978)
[57]C.T.]Kresge, M. E. Leonowicz, W J. Roth,工C. V滋tuli, J. S. Beck, Nature,359,
710(1992)
[58]N.L. Rosi,工Eckert, M. Eddaoudi, D. T.~Vodak, J. Kim, M. O’Keeffe,0. M, Yaghi,
8{:ゴence,300,1127(2003)
[59】S.Noro, R. Kitaura, M. Kondo, S,Kitagawa, T Ishii, H. Matsuzaka, M. Yamashit4
」:.~lmen CJ2{ヲm Soc.,124,2568(2002)
[60ユM.Eddaoudi, D. Moler, H. Li, T M. Rei皿eke, M. O’Keeffe,0. M.『Yaghi, Acc.
Chem. Res.,34,319(2001)
[61]M.Eddaou(五.工Kim, N. Rosi, D. Vodakg J. Wacher, M.0’Keeffe,0. M. Yaghi,
Science,295,469(2002)
[62ユD.Li and K. Kaneko,1. Plrys. Chem.,104,8940-8945(2000)
[63]A.Kondo, T. Daimaru, H. Noguchi, T Ohba, K, Kaneko, H. Kanoh,」. Collo id
Intelプ2ace Sci.,314,422(2007)
[641S. Ohnishi, T. Oimori, T. Ohlaib o, H. Noguchi, L. Di, Y. Hanzawa, H. Kanoh, K
Kaneko, Appl.8urf Sci.,196,81-88(2002)
9

[651A. Ko血do, H. Noguchi, L. carlucci, D. M ProserPio, G ciani, H. Kajiro, T. ohba,
H.Kanoh, K. Kaneko,」. Am.(hem. Soc.,129,12362(2007)
10

Chapter 2
Characterization Methods
In this chapter, characterization methodS to Ilanoporous materials are
introduced.
Gas adsorption
Porous materials are characterized using various procedures. One of them is
gas adsorption[1-3]. In pa rticuliiul, nitrogen adsorption in 77K can characterize the
speci行c surface area, pore volurnes, and pore size. The pore size distribution ob面ned
by many method ofpore size allalysis is carried out fbr comparison of porous materials.
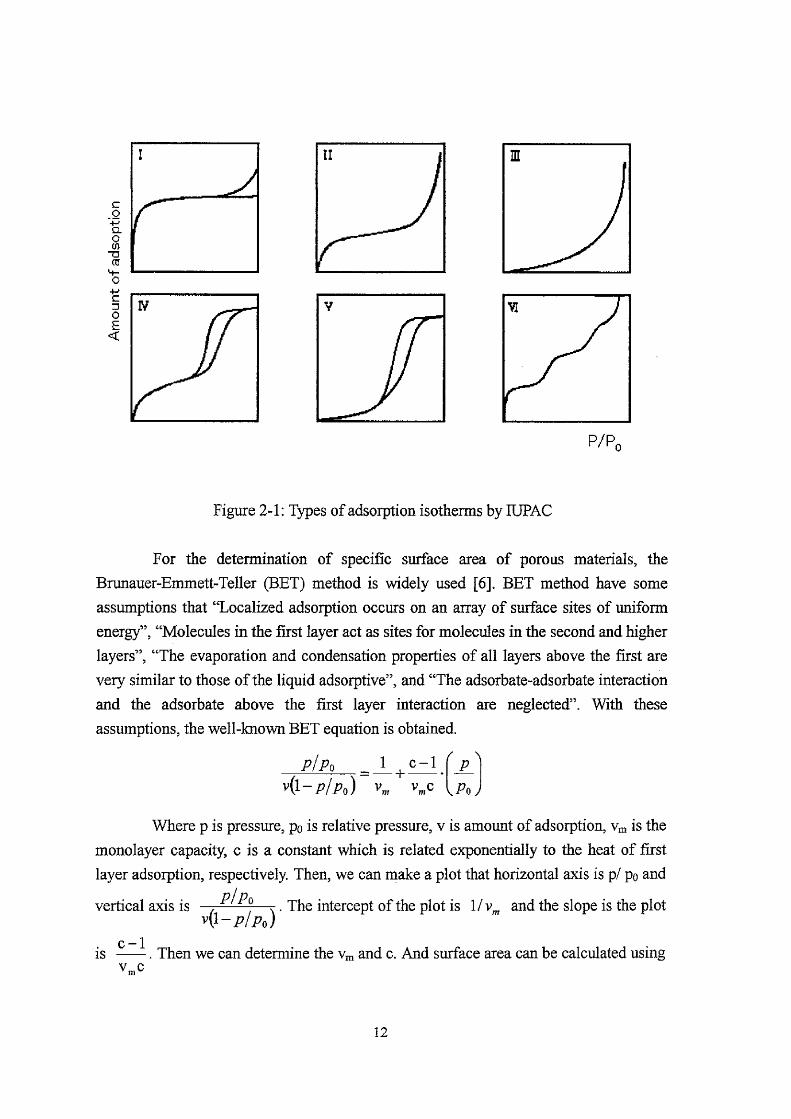
IUPAC cl…rssi丘ed the a(蛤orption isothe㎜s into 6加es[4][5]. The essen亘al
features of these types are indicated in Fig2-1. The type I isorhem is derived from
exlstence of micropores. The sharp uprising at low pressure is due to the micropore
filli皿g and 1miting upris血g i s dependent o皿伽accessible microp。re vol ume. Type II
isotherrn is the normal form of isotherm derived from a nonporous or macroporous
adsorbent T}胆e H isotherm represents unrestricted layer-by-layer adsorption. The
appearance of shoUlder at low pressure indicates completion of monolayer coverage and
the onset of multilayer development, Type HI isothemユis generally associated with
weak adsorbenレadsorbate and relatively strong adsorbate-adSorbate interactions. ln this
case cooperative effectS lead to the deveIopment of patches of mUltilayer befbre a
uniform monolayer has been fbmled. The adsorption of water vapor on a nonporous
carb on surface i s an example of type III. Characteri stic feature of type IV i sotherm i s
hysteresis loop, it is caused by capillary condensation in mesopores. Low pressure
region of type IV isotherm is same as type ll i sotherm, Type IV isotherm is obta ined
from material which have mesoporous and relatively strong adsorbent-adsorbate
interactions. Type V isotheml is also obtained丘om mesoporous materials. The
adsorbent-adsorbate interactions are exceptionally weak in comparison with the strength
of the adsorbent-adsorbate interac廿on. Type V【isotherm have stepwise multilayer
adsolption on a unifbr[n nonporous surface.
ll
P/Po
Figure 2-1;Types of adsorption isotherms by IUPAC
For the detemination of specific su血ce area of porous materials, the
Brunauer-Emmett-TeUer (BET)method is Widely used[6]. BET me血od have some
assumptions that“LocaliZed adsorption occurs on an array of surface sites of uniform
energy”,“Molecules in the fhst layer act as sites fbr molecu玉es in the second艮nd higher
layers”,‘‘The evaporation and condensation properties of all Iayers above the first are
very similar to tho se of the liquid adsorptive”, and‘‘The adsorbate-ads orbate interacti6n
and the adsorbate above the frrst layer interac面n aIe neglected”. With these
assumptions, the we11-known BET equation is obta ined.
轟.)÷1調
Where p is pressure, po is relative pressure, v is amount of adsorption, vm is the
monolayer capacity, c is a constant which is related cxponentially to the heat of first
layer adsolption, respective玉y. Then, we cam口ake a plot that horizontal axis is p/po and
PIP。
.The intercept ofthe plot is l/v鷹 and the slope is the plotVertiCal aXiS iS v(1 一・ P/P。)
is c-1.Then、we、can、determine血e v. and c. And、surface、area、can、be、calcUlated、using
VmC
12

equatlon
aBur = v.σL
whereσis cross-section area of an adsorbed molecule. Cross-section area of nitrogen
atom at 77K is O.162 nm2. L i s the Avogadro’s number.
Dubinin-Radushkevich(DR)analysis was used to determine the micropore
volume[7][81. The DR equation is
l…ln帆諾。〕2
where W is the皿icropore vol㎜.e, E。 is characteristic adsorPtion energy and A
is Polanyi’s adsorption potential defined as !歪=1~T ln(Po/∫フ).βis affinity coeffrlcient
related to the adsorbate-adsorbent interaction. In the oase of njtrogen,β=0.33. DR-plot
of lnW vs.1n2(P〔ゾP)1。ads to determination of Wo and Eo. Isosteric heat of adsorption
(qsg e=1/e)can be calculated by using this equation
9。,,θ。1ノ。ニムHvap+β8。
△HΨap iS enthalpy of vaporization. In the case of N2,△H田p=558kJ/mol.
Themlogravimetry
ThermograVimetry(TG)is a kind o舳e㎜田翻ysis. Sample is placed in
fUrnace, and the weight of sarnpl e and the temperature in ti te appaエatUs are measured at
one time.1n N2/02 ambient, carbon,nicke1, and iron are oxidized to CO2, NiO, and
Fe203 respeotively, The chemical reaction is prese皿ted as blow Then the content of
metal in carbo皿一metal composite can be determined by calcUlating of change of weight
after oxidized reaction.
Nix[C]y+(1/2x+y)02 → 】姻iO+yCO2
2Fex[C】y+(3/2x+2y)02 → 2x Fe203+2y CO2
X-ray diffi’action、
X・ray dif丑action(XRD)technjques are based on the eiastic scattering of
13

X-rays from structures that have long range order. XRD is a technique used to
characterize the crystallographic structure, clystal lite size,and preferred orientation in
poly。rystal line or powdered solid samples. XRD is commonly used to ide皿ti取㎜㎞o㎜
substances, by comparing diffiraction data against a database[9}[12].
XRD pattern is composed with angle(horizontal axis:2e)and intensity
(vertical axis). It shows some peaks when the angles and interlayer distance satisfシthe
Brag9’s law.
nλ=2dsinθ
Where O is the center angle of the peakλis wave lengぢh ofX-ray. ih this paper,
Two騨es of X-ray was used. CtKα(λ=1541㎜)and synchrotron X-Ray in SPring8
(λニ1.002㎜).n i s integer determined by the order given. d is interlayer distance[13].
The peak width of a specific phase of a皿aterial ralates to the mean crystallite
size of that material. They are explained by Sherrer’s Equation[14】.
KZ L=
Bcosθ
Where L is crystallite size, K is a constant, B is the width of the peak at half
maximurn intensity, respectively This equation can calcU late the ciystallite size of the
material.
X-ray photoelectron spectroscopy
XPS lneasures the elemelltal composition, empirical formu]a, chemical state
a皿delectronic state ofthe elements that exist wi廿血amaterial. XPS is sur据ace chemical
analysis technique(from l to 10 nm). It can be used to analyze the surface chemistry of
血ematehal. XPS de飴c圃1 eleme皿ts except hydrogen and heli㎜. XPS mesurement
requires Ultra high vacuum condition. Because止e energy of a脚icular X-ray
wavel eng血equals a㎞own quan廿ty, we c…m determine the el ectron binding energy
σ3E)of each of出e emitted electrons. Chemj caI bindings shift the peaks ofXPS spectra,
so we can㎞ow the chelnical conditions of the surface atoms[15]{20]. I refbred
reference [21]fbr deconvolutio皿of Cls peak. If argon etching is irmovated in XPS
measuエement, XPS also c…m measurement i㎜er parts. Argon etching can etch tlユe
surface of materials several ten nanometers.
Scanning electron microscope
Sca血ng electron microscope(SEM)is a kind of electron microscope .that
14
images the sample sur face by scanr匪ng it with a high-energy beam of electrons in a
raster scan pattern. The electrons interact with. the atoms that make up the sample
producing signals that conta血information about the samplels s漁ce topography. The
SEM images are obtaind by analysis of secondaτy electron, back scattered electrons,
characteristic X-rays, fluorescence light, and transmitted electrons、 Its Iesolution is
about 2㎜.
Transmission electron microscope
Transmi ssion electron microscope(TEM)detects tra血smitted elec廿ons. TEM
image i s formed from the interaction of the electrons transmitted t hrrough the specim en,
which is magnified and focused by an obj ective lens. ResoI面on of TEM can reaoh
order of subnanometeエIt can observe surface morphorogy, crystallite structures and
their defヒ…cts, and so on.
X-ray ab so]4)tion fine structUre
X-ray absorption fine structure(XAF S)measures absorption intensity of X-ray.
X-ray absolp廿o皿began in l 970s a皿d have developed[22}[25]. Many researchers
contributed to establisiment of theories of XAF S[261{29]. Analysis of the XAF S can
supply the looal structure and the unoccupied electronic states. X-ray absorption spectra
are diVided in tWo parts. They are X-ray absorption neal edge structure()ζANES)and
Extended X-ray absorption fine structure(EXAFS)」h XANES region, there is sharp
upris孟ng which depend on the element. So we can identify the ele血ent by XANES.
EXAFS spectra shows wave-1ike vibration w短ch are derived from interfere with
backscattered electron waves emitted by neighbor atoms. The丘equency, amplitude, and
attenuation of wave are dete㎜ined by complex combination of distance of nearest
atoms, coor(㎞a廿。n number, Debye-Waller factor, and meart free path of photoelectron.
We can obtain these infbmlations by analysis of EXAFS data. XAFS measurement and
their analysis give us many inforrnation of nanostructure[30]一[34].
Raman Spectroscopy
Raman speotroscopy is a speotroscopic technique used in condensed matter
physics and chemistry to study vibrational, rotationa l, and other low-frequency modes
in a system. This method relies on inelastic scattering, or Raman scattering, of
15

monochromat三c light[351. Wave length of scattered light is bolow 4000 cm’1. Because
molecules and crystals have inherent vibration enegy, Raman spectroscopy with
monochrome laser can identify the material by camparison With datebase of Raman.
Raman spectro scopy can discriminate between graphite and amorphous carbon.
Graphite gives G-band and amorphGus carbon give D-band in Raman spect㎜.
Therefbre Rama皿spectroscopy is used to consider structure of carbon materials.
16
References
[1] K.Kaneko a皿d K. Kakei,.兀Collo idノカ∫θ〃eace Sc’.,129.583(1989)
[21K. Kaneko, C. Ishii and T. Rybolt,加‘℃haracterization of Porous S olids IIr’(eds. J.
Rouquero1, E Rodo㎡guez-Reinoso, K S. W Sing…md K K Unber), p.583,
Elsevier, Amsterdom(1994)
[3]S.J. Gτegg a且d K S. W Sing,加‘‘Adsorptio几Surface Area and porosity”2nd
edition, Academic press, London(1979)
[4]KS. W Sing, D』. Evere廿, R. A. W Haul, L. Moscou. R. A. Pierot亘, J. RouqueroL
and T. Siemieniewska,、Pure Appl. Chem.,57,3603(1985)
[5]K. S.WSing, in“Porosity in Carbon”(edJ、 W Pa伽ck), p.49, Edward Amold,
Lo皿don(1995)
[6]S.Brunauer, P H. Emmett and E. Teller, J./Amen Chem. Soc.,60,309(1938)
[7]M.M. Dubinin, Chem. Rev.,60,235(1960)
[8]M.M. Dubinin,加“Chemistry and Physics of Carbon”(ed. P工. Walker), Vbl.2, p.
51,Marcel Dekker, New Ybrk(1966)
[9]RWJames, in‘‘The Optical Principles of the DifEiraction of ×-rays”, B. Bell&
Sons, London(1954)
[10]R.工Weiss, in‘‘X-ray Deterrnination ofEIectron Distribtttio血s”, American EIsevier
Pub., New YDrk(1996)
[11】H.PKユug and L. E. Alexander,’ガ‘X-ray Dif資abtion Procedures”2nd Edition,
Wiley&Sons inc.,New Ybrk(1974)
[121B. D. CUIity, iガ‘EIementals of X-ray Diff}action”Addison-Wesley Pub., Reading,
Massachusetts(1978)
[13】WL. Bragg, Proceedings of the Cambridge i)h ilosoρh ical Socie与ノ,17,43-57(1913)
[141工Goodisman, and W KIemperer,」. Chem. Phys.,38,721(1963)
17

[15]S.Hagstr6m, C. Nordling, K. Siegba㎞, P伽’03蝕∫θr8,9,235-236(1964)
[16]KHamrin, G Johans son, A Fahlman, C. Nordling, K. Siegbahn, B. Lindb erg,
Ch召〃i icα1 Physics」「.etters,1,557-559(1968)
[17]KHam血, G Johansson, U. Gelius, A Fahlman, C. Nordling, K, Siegbahn,
Chemical P、妙8’c5 Letters,1,613-615(1968)
[18]YBaer, P Filip Hed6n, J. Hed血an, M KIasson, C. Nordling, K. Siegbahn, Solid
State Com〃2 un ications,8,517-519(1970)
[19]KSiegba㎞, U Gelius, H Siegba㎞, E.01son, Physics Letters A,32,221-222
(1970)
[20]KSiegbahn. loumal of Electron Spectrosco2アand Related Phenomena,5,3-97
(1974)
[21]S.Utsumi, H Ho皿da, Y Hattori, H. Kano玩K. Takahashi, H Sakai, M. Ab e, M.
YUdas aka, S、 lij ima, K. Kaneko,1. Phys. Chem. C,111,5572(2007)
[22]D.Sayers, E Lytle, and E Stem,!望ぬXπ{y肋α此,13,248(1970)
[23]B.MKincaid a血d P Eisenberger, Phys. Rev. Lett.,34,1361(1975)
[241E W Lytle,」:Sソnchrotron 1~ad.,6,123(1999)
[251K Lu and E A. Stem,ハ勉o孟加か〃η7. Methods,212,475(1983)
[26]LHedin and B.1工undqvi st,」. Phys. C,4,2064(1971)
[27]T. Fuj ikawa and L. Hedin, Phγs. Rev. B,40,11507(1989)
[28」工WCook and D. E Sayers, X Appl. Phys., 52, 5024(1981)
[29エB.K. Teo,」./Am Chem、800.,103,3990(1981)
[301T・Ybkoyama and T。 Ohta,」. P厘ソs. Soc. Jpn.,65,3909(1996)
[31]K.ASa㎞ra, Y Iwasawa, and H Kuroda, Bull. Chem. Soc. Jpn.,59,647(1986)
[32]KAsakura K K. Bando, Y Iwasawa, H. Arakawa, and K. Isobe,1./Am. Chem. Soc.,
112,9096(1990)
[33]T. Yokoyama, T. Ohta,0. Sato, and K. Hashimoto,1〕Jrys. Rev. B,58, 8257(1998)
18

[34ユMFemanderz-Garcia, C. M. Aユvalez, and G. L. Haller,」. Phys; Chem,,99,12565
(1995)
[35]C.VRaman and K S. Krishnam, Nature,121,501-502(1928)
19

Chapter 3
Nanostructured Metals
3.1 1ntroduction
Meta1㎜oparticles and nanocrystals play an importaロt ro正e in many different fields
and have been extensively studied reccntly because of such unique・properties[1]一[111.
Fu前he㎜ore, nanestructured solids have been focused on not only because of their
apPlicability to various industrial fields but also their uniqueness due to nanospace they
have. Molecules can interact stro且gly with nanopores, which induce a quasi-1亘gh
pressure effect on the molecules that leads to a self-assembIy stnユcturo fbmユation fbr
small molecules, such as H20, Xe, and O2, and the acceleration of the chemical reaction
[12].Thus, nanoporous solids have b een expected to create new scientific brealCthrough
and technology. So far, maj or nanoporous solids are limited to insUlators and
se血conductors. There are many reports of nanoporous metal oxide[13}[18】. If we can
prepare nano structUred metals and the characteristics of the nanopores can be donated to
important metals, the application areas fbr nanoporous solids could be extended
intensively. However, since metals can be easily oXidiZed in general, the preparation of
nanostructured metals should be cha11enged. The sintering is one of the most likely
factors that make it difliricult te prepare porous metallic materials.
Nanoporous Au a皿d Pt have been alr6ady reported For example, Attard and
co-workers have synthe siZed nanoporous platinum by using lyotropic liqUid crystal as a
template[19H23], Pileni and co-workers also have synthesized nanometer order sized
crystallites of metals and senlico皿ductors us血g surfactant solutions[24][25], Erlebaher
and co-workers have prepared nanoporous gold by dealloying of Au-Ag alloy[26], and
Asai have prepared highly nanoporous platinum by using nonporous silica nanoparticles
as a template[27]. But these methods require that eIements of nanoporous metals are
chemically stable such as gold and platin㎜. Therefbre these methods can not be
apPlied in the case of other transition rnetals.
Ho wever, we s uccessfU皿y synthesized nanostructured metaUic Ni using a poIy(viny1
20

alcohol)(PVA)as the polylner precursor by Hattori[28]. A small amount of residual
carbon in these nanoporous materials plays an important role in preventing the
nano structured meta豆s ffom sinter血g or oxidation. Thus, a reducing atmosphere caused
by the carbon should be suitable fbr producing nanostructured metals.
工nthis paper,1 report new nanostructured Fe(NS-Fe)and Nanostructured Ni and Fe
alloy(NS-Ni/Fe)synthesized by PVA. precursor method. The nanostructured al loys of
Ni and Fe were also studied from the viewpoint of catalysis[29】and magnetic
properties[30], but the porosity of the nanostructured metals has not been considered
befbre.
These nanostmctured metals are characterized by N2 adsorption at 77K,
ThemユograVimetry, X-ray diffraction(XRD), X-ray photoelectron spectroscopy(XP S),
Sca皿ning electron microscope(SEM), Tra皿s血ssion electron microscope(TEM), and
X-ray absorption fine structure(XAFS),
3.2 Experimenta1
A10 wt%PVA(degree of polymerization:1500)aqueous solution was used to
prepare the PVA. films. The PVA、 films were ’垂窒?垂≠窒?п@by casting on a glas s substrate.
PVA films were dried fbr a week at room temperatUre. The dried PVA films, whose
thic㎞ess was about l mm, were soaked in 20 wt%Ni2+nitrate solution,13 wt%Fe3+
nitrate, and also in mixed solutions of Ni2+and Fe3+soh血ons, respective1}~fbr a week.
By the control of Ni+20r Fe3+solution, carbon content of NS-Ni or NS-Fe can be
co皿troIled. Molar ratios ofNi to Fe of the mixed solutions were:[Ni:Fe1=10:0,8:2,5:5,
2:8,andα10. in this process, metal ions are loaded血to the PVA matrix[31」正321. The
metal-doped fil皿s became green and brown fbr Ni2+and Fe3+, respectively, and also
mixed color for Ni-Fe alloys. Then, the metal-doped fiims were immersed in 1 M NaOH
aqueous solutions fbr three days to fbrm Ni hydroxide and Fe hydroxide, and double
hydroxides, respectively. The alkali-treated丘㎞s were heated at 923 K(in the case of
Ni)or 973 K(in the case of Fe or NiFe alloy)㎜der nitrogen-gas flow of 100 mYmin.
The thermal decomposition of the Ni hydroXide, Fe hy(iroXide, double hy(iroXt de, and
PVA gave the resulting nanostructured materials. They are composite of carbon and
metaユ. Each nanostructured metal is named NS-Ni fbr[Ni:Fe]貫正:0, NS-Fe[Ni:Fe]=
0:1,respectively, and NS-NiFe(x/y)fbr[Ni:Fe}=x:y(atomic ratio), e. g. NS-NiFe(8/2)
fbr[Ni:Fe]=8:2.
21

3.3 Results&Discussion
3。3.lNanostmctured Nickel
Fig 3-1 is TG spectrum of PVA film which vvas d。ped Ni(OM2 (Ni-PVA) under
N2 gas flow Heating rate i s 5 K/min. Reference[33]insists that decrease of weight of
PVA film begi皿s in 498K and the weight ofPVA became half about 643K DTG line has
tWo peaks ab out 570K and 670K. F ormer peak denotes weight Ioss of PVA film. Latter
peak denotes reduction ofNi(OH)2.
100
80
^60 oト 40
20
0300 500 700
Temp.(K)
一TG-一… cTG
900
Figure 3-1:TG spectrum ofNi-PVA. N立gas was flowed 50 ml/min.
Heating rate is s K/min
Fig.3-2 is a resuIt of N2 adsorptio皿of NS-Ni. The adSorption isothem show
uprisi皿g i皿10w pressure and difference of adsorbed amou皿t of adsorption and
desorption(this is called hysteresis). This resUlt means that NS-Ni has micropores and
mesopores. According to BET metho¢Specific surface area of NS-Ni is 111 m2/g.
According to other reports, mesoporous Pt by lyotropic Iiquid crystal template has 23
m2/g[20], nanoporous Au by dealloying has 2 m2/g[26], and nanoporous Zn by
22

electrodeposition has 25 m2/g[34]. Surface area of NS-Ni is much larger than that of
other nanoporous materials.
60
喜5。
暑4。
§
曇3°
韮2・
iOO
..…呈亀1q°°
●●o●
もも9●
も(i亀
999
● Ad so rpti on
Desorption
0.2 O.4 O.6 0.8 {
P’Po
Figure 3-2:Adsorption i sotherm ofNS-Ni
Fig.3-3 is distribution of diameter of nanopores calculated by BJH method.
This result shows that NS-Ni has mesopores of 4 nm and micropores about 1 nm. DR
analysis deterエnined that total pore volulne(Wo)and characteristic energy of adsorption
(Eo)are O.039 cm3/g and 2154 kJ/mo1, respectively.
0 5 10 15
diameter (nm}
20
Fi gure 3-3:Pore size distributio皿of NS-Ni
The SEM image of NS-Ni is shown in Fig.3-4. This indicates that most of the
particles are sphe]rical and non-uniform, and the dialneter of the particles is found to be
in the range of 30--100 nm.
23

Figure 3-4:SEM㎞age ofNS-Ni
Fig.3-5 is XRD pattem denotes nickel crystal structUre. Peak of 2θ=44.67
degree suggests nicke1. Crystallite size is 26 nm calcUlated from peak profile using the
Scherrer’s equation.
旧oゆ
≠Q三
20 30 40 50 60 2θ
70 80 90
Figure 3-5:XRD pattem of NS-Ni. X-ray is C豆Kα
24

NS-Ni contains 85 wt%of Ni analyzed by TG Content of Ni can be contro五1ed
by the c・nce煎ati。n・fNi2+・f s・luti・n, NS-Ni prepared by 25 Wt%Ni(NO3)2 s・1uti。n
(NS-Ni-2)conta血s 93 wt%of Ni and has 13 m2/g sur face area. S urface area of NS-Ni-2
is significantly smaller than NS-Ni.
60
50@40 30 20 10
0 0
NS-NiNS-Ni-2
.Blrl:爵警
i oo’ミ i’ つ ト
るも・・1°i
り き ;
..
堰D.....……-i_読.1..
6・・繋Q°°
ロロ
日「
…・…ョ ■
隔ヂ……’
O.2 0.4 O.6 O.8 1
P’P O
Figure 3-6:Adsorptio皿isotherms of NS-Ni(●)a皿d NS-Ni-2(■)
Fig.3-7 is plot of sui face area vs. Content of Ni for 4 types of NS-Ni. Surface
area is represented by the u皿it of‘‘m2/mol”and Content of Ni is represented by wt%.
NS-Ni which contain over 10%carbon have large surface area, but Specific su菰ace
area of NS-Ni2 much smaller tha皿other NS-Ni. Small sur face area is not du.e to weight
of Ni, is due to lost of nanostructUre. Carbon atoms prevent from sinte血g, but NS-Ni-2
can not keep nanopores because content of carbon is too small. These results means that
NS-Ni must contain moderate carbon to keep nanostruct re.
25

4000
2000
0
50 60 70 80 90 100
Percent of N i
FiguTe 3-7:P1・t・f・Surface・area(m2/m・1)vs. C・ntent・fNi(Wt%)鉛r 4卿es・fNS-Ni
3.3.2 Nano structUred lron
Result of N2 adsorption ofNS-Fe is shown as Fig.3-8. Surface area of NS-Fe is
84m2/gby BET meth・d.・The is・the㎜㎞切steresis and upds血g in l・w pressure is n。t
sharp. These results denote that NS-Fe has mesopores and no micropores。 W。 a皿d Eo are
O.029cm3/g and l 7.84 kJ/mol by DR analysis.
200
Adsorp廿onDesorption
。。oecN)°°
ooooo
● O o
● ●
o●●
o
●
o
●
o
●
o
●
O O O、2 0.4. 0β 0.8 1
P’Po
Fig肛e 3-8;Adsorption isotherm ofNS-Fe
Fig.3-9 is XRD pattem denotes iron crystal structure. Peak of 2e=44,67 degree
suggests iron(110)and peak of 2e=26.37 degree suggests graphite(002). Crystallite
26

size is 44nm calculated from peak profile using the Scherrer’s equation.
20 30 40 50 60 70 80 90
2θ
Figure 3-9:XRD pattem of NS-Fe
The SEM血nage of NS-Fe is shown in Fig.3-10. This stmcture is similar to
NS-Ni, but the diameter of the particles is 1arger than NS-Ni and fbmd to be in the
range of 5(ト100㎜.
Figure 3-10:SEM image ofNS-Fe
27

Fig.3-11(a)is TEM image of NS-Fe and(b)is zoomed in image. These images
indicate that iron particle is covered by carbon thickness of about 10nm.
盆.∫㌣.
雪も
瀞ぐ’,・◎)軍
}碗麺幽
・ …複二 ・ をf
㌧,轟・葱・ぺ
-10nm
帥騨舳鯛 噂.蘭南蝋ゆ. et・,の レゆロ
へ. ド ロ騨噂■陶、 @ 「鞭 噛囎■r■■レ y風・
や 7 ㌔鴨
1闇■㎞ 「●r- 6貞h犀. ・.鵬ら 卿 暫●聰L
t一卿k 「■」
Figure 3-11:TEM images ofNS。Fe.(b)is magnified image of(a)
28
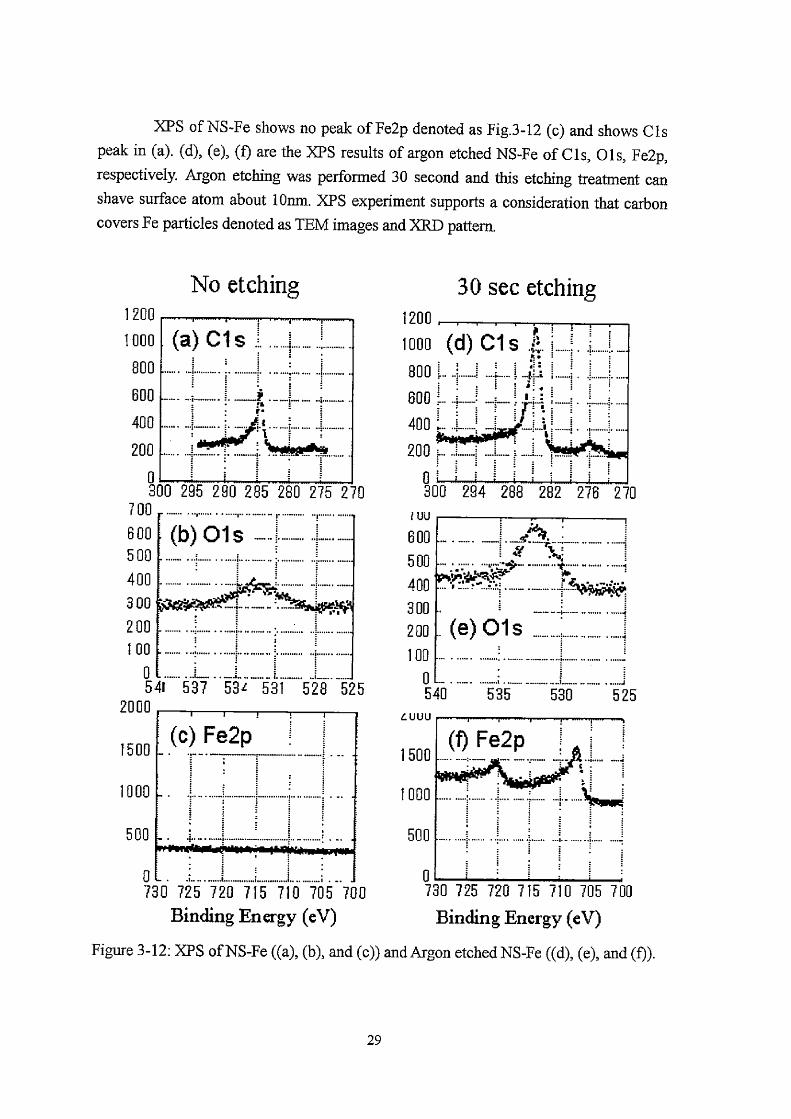
XPS ofNS-Fe shows no peak of Fe2p denoted as Fig.3-12(c)and shows C l s
peak in(a)・(d)・(e)・(D are the IX]?S results・f arg・n etched NS-Fe。f Cls, Ols, Fe2P,
respectively. Argon etc㎞g was performed 30 second alld this etc垣ng treatment can
shave surface atom about l O㎜. XPS experiment supports a consideration that carbon
covers Fe pa rticles denoted as TllM images and XRD pattem.
No etching
1200
1 ooo
800
600
406
200
0 300 295 290 285 280 275 27〔〕
700
600
500
400
300
200
100
0 54且 537 53t 531 528 525
2000
1500
1000
SOO
(c)Fe2P
0
73[〕 725 720 715 710 705 7G〔l
Binding En ergy(eV)
1200
1000
30sec etching
800≧、,_≡_,_i
600i…
400
20eL.,.i__i
9:
3DO
luu
600
500
40D
300
2go
lOO
〔〕
540
Luuu
1500
1000
SOO
294 288 282 276 270
535 530 525
o
唱730 725 720 715 710 705 700
Binding Energy(eV)
Figure 3-12:XP S of NS-Fe((a),(b), and(c))and Argon etched NS・Fe((d),(e), and(f)).
29

NS-Fe is a nanocomposite of nanoparticle iron and 10 nm thickness ofcarbon,
It has mesopores and surface area of 84 m2/9 】[ron particles have bcc struct皿re and
calbon have about 201ayers of graphite structure. Carbon conte皿t of NS-Fe is 58 wt%.
This is obviously smaller than that of NS-Ni probably because the afHnity of Fo to
carb on i s hi gher than that of Ni
3.3.3 NanostructUred Ni/Fe alloy
NS-NiFe(8/2), NS-NiFe(5/5), and NS・-NiFe(2/8)gave the carbon co皿tent of 36
wt%・57 Wt%, a皿d 62 wt%, respectively. Thus, the alloy with a higher ra{io of Fe
contains a larger amount of carbon probably because former reason.
The XRD pattems in(li cate that NS-Nl, NS-NiFe(8/2), NS-NiFe(5/5), and
NS-NiFe(2/8)form a face-centered cubic(fcc)structUre, whereas NS-Fe o皿ly a
body-centered cubic stmcture. Fig3-13 shows XRD patterns a皿d Hg3-14 shows
d-values calcUlated f}om the peaks around 2θ=45 deg for the nanostructured metals,
indicating that Ni-Fe alloys fbnll a wider structural parameter tllan a pure Ni or Fe does,
probably because a packing of the alloys becomes Iooser than the pure metals.
Reference[29],[30], and[35j reported similar change of the latti㏄parameter for
NiFe(5/5)alloy. Because NS-NjFe(8/2)is supposed to behave as solid solutio血,
mtenslty ofXRD pattem is very smal1.
30

l
mS・Fe
NS-NIFe 218)
NS・MFe{5∬5》
NS・MFe{8’2)
NS・Ni1
20 30 40 50 60 70 80 90
20’deg{Cu Kα)
Figure 3-13:XRD patterns of NS-Ni, NS-Fe, and NS-NMe(x/y):x/y =8/2,5/5, and 2/8.
31

2.08
2.07
2.06
2.05
2.04
2.03
2.02
2,のZ (逗巴o』Z・のZ
㊥」,のZ
Figure 3-14:d values evaluated from the XRD data for nanostructured metals.
Crystallite sizes for the particles were ca lcUlated f}om the peak profile using
the Scherrer equation and tabUlated in Table 3-1, indicating the crystallite size is in the
range of 10-45 nm. All compo㎜ds showed similar morphology irrespective of
different Ni/Fe mole ratios.
Table 3-1;Crystallite size of nanostructured metals(㎜)
NS.Ni NS-NiFe(8/2) NS-NiFe(5/5) NS-NiFe(2/8) NS-FE
25 10 23 30 45
XPS of NS-NiFe(5/5)shows no peaks of Fe2p and Ni2p denoted as Fig.3-15
(a)and(b). Fig.3・-15(c),(d)are the XPS spectra of argon etched NS-NiFe(5/5)of Fe2p,
and Ni2P, respectively. Spectrum of figure(c)shows 707 eV peak which denotes
metallic iron.(d)shows 853 eV peak which denotes metallic Ni、 Argon etching was
32

performed 30 second and this etching treatment can shave surface atom about 10nrn.
At・micエati・・f Fe and Ni in NS-NiFe(5/5)is ab・ut 5:5 calcUlated・fr・m peak贈a。f
XPS spectra.
No etching2000
{500
P000
T0b
鰭湾博.…- i } i多一を一層一←一トー一⊥一繭il_し
…iil’穿30 72572071571。7古57。
3000
2500
2000
1500
tOOO
500
到i2P;
2000
1500
1000
500
93。
3000
2500
2000
1500
1000
500
30sec etching
(c)i
塗1.
700
蜘噸
亀8・87587・86586・85585。84598。87587。86586。85585。845
Binding贈rgy{eV} Binding・energy{eV)
Figure 3一工5:XPS of NS-N工Fe(5/5)raw sarnple((a)and(b))and Argon etched
NS-NiFe(5/5)((c)and(d)).
The radial stmctUre fi nctions(RSFs)calculated from the EXAF S signal s of the
nanostructured metals are shown in Fig3-16(a)fbr Ni K edge and in Fig.3-16(b)fbr
Fe K edge. The coordination structures around Ni in a II Ni-Fe alIoys ale very simiIar to
bulk Ni fbil irrespective of Ni/Fe ratio, as shown in Fig3-16(a)and Table 3-2, which
gives a coordination number(N)and coordination distanoe(R)around the Ni atom.ハr
33

aroimd Ni atom ofNS-Ni or NS-NiFe alloy is smaller than that ofNi fbil because of the
characteristics of the nanostnlcture, whereas 1~around Ni atom is similar fbr all metals
(0.248一α250㎝)、In contrast, the coordination structures around Fe of the NS-MFe
alloys diffbr from that of Fe fbil, as Fig.3-16(b)and Table 3-3. Itsハl value is quite
smaller than tha‡of Fe foil and al so R around Fe becomes Wider With increasing the Ni
colltent The Debye-Wa ller factor(σ)ofNS-Fe is markedly Iarger than that of the Fe fbi1,
suggesting the degradation of止e s伽otures in Fe clusters. The drastic decrease in西「of
the NS-Fe can also be observed, oWing to the formation of t le very smal1 clusters,
加dicating less cエystalli皿ity, Since smaU clusters with㎜ometer-dimensions have a
significant fraction ofthe atoms located on the sur face, the RSF shows a reduction inハL
The less crystallinity of these nanostmctures metals can be supported丘om the results of
XRD measurements described above. Thus, introductioll of Fe atoms into the crystal
structure ofNi causes disordered stmcture with respect to the Fe atoms, although the Ni
atoms tend to keep the元r original structure.
R/A R/A
Figure 3-16:Figure(a)shows radial distributioll fUnctions from Ni K-edge EXAFS
spectra of Ni fbil, NS-Ni, NS-NiFe(8/2), NS-NiFe(5/5), and NS-NiFe(2/8), respectively,
from the bottom. Figure(b)shows radia1 distribution functions from Fe K-edge EXAFS
spectra of Fe foil, NS-Fe, NS-NiFe(2/8), NS-NiFe(5/5), and NS-NiFe(8/2), respectively,
丘om the bottom.
34

Tabl e 3-2:Coordination parameters aro und Ni atom
NS-Ni NS-NiFe(8/2) NS-NiFe(5/5) NS-NiFe(2/8) Ni fbi1
.R/10’1 nm
07t lo”i nm2
7.9
2,48
6.86
6.8
2.49
6.86
8.7
2.50
7.88
10.5
2.50
7.89
11.1
2.48
6.59
N coordination number around Ni atom
R:coordination distance to the 1 st neighbor atom from Ni atom
a. Debye-Waller factor
Table 3-3:Coordinati on parameters around Fe atom
NS-NiFe(8/2) NS-NiFe(5/5) NS-NiFe(2/8) NS-Fe Fe foil
R/工0層]㎜
σ1 10’1 nm2
4.7
2.51
5.12
4.8
2.52
5.60
2.3
2.53
5.90
4.1
2.49
9.67
7.2
2.50
4.48
N coordination number around Fe atom
1~:coordimation distance to the 1 st neighbor atom from Fe atom
σDebye-Waller factor
Ionizati o皿tendency of Fe i s stronger tlian that of Ni. Thi s means that Fe is less
reductive and needS higher temperature in the heating process than Ni. Thi s causes the
formatio皿of Ni meta】at the earlier stage, and then the crystal structロre of the a110ys can
be dominated by the crystal structure of Ni metal. Therefbre, NS-NiFe(2/8)can form a
fcc structure, which pure Fe metal does not fbrm, although the Fe content is much
higher than that ofNi.
35
120
80
40
0
Adsorption
Desorption
o oO ●
o ●
aii33a388:・°°°’
o
o● o
oo ●
0 0.2 O.4 0.6 O.8 1
P’Po
Figure 3-17:N2 adsorption isotherm of NS-NiFe(5/5)
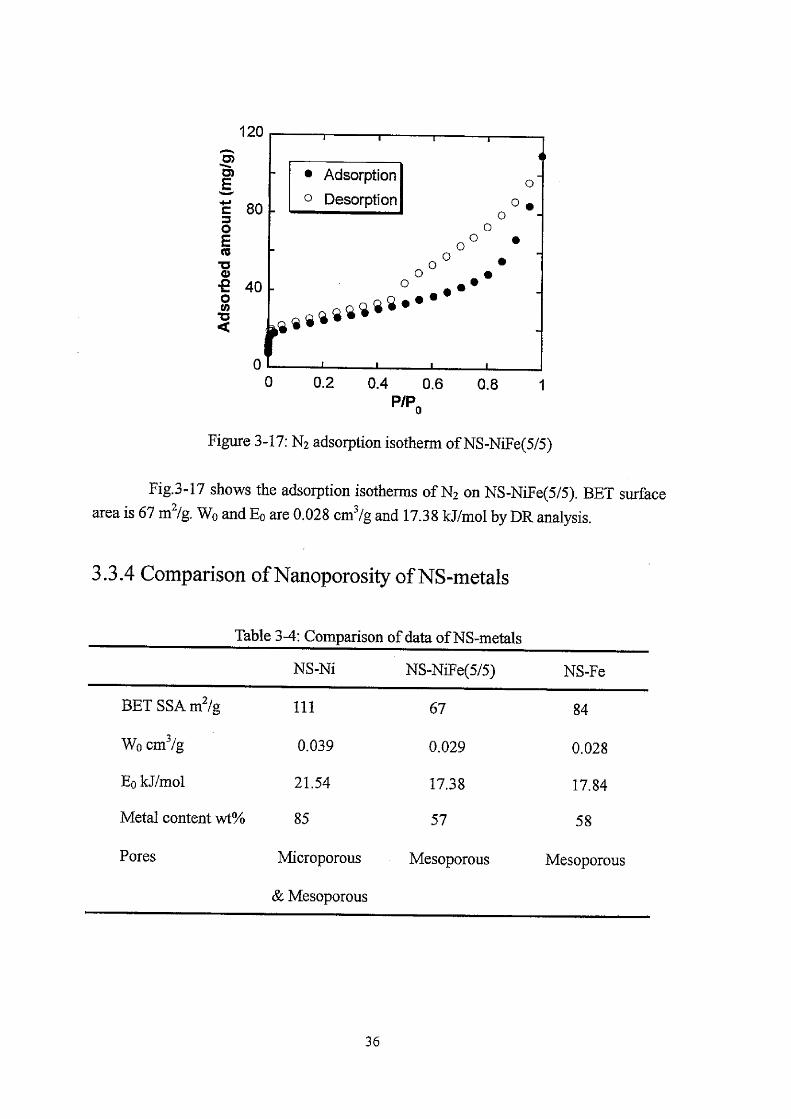
Fig3-17 shows the adsorption isotherrns of N20n NS-NiFe(5/5). BET surface
area is 67 m2/9・ W・andE。 are O.028 cm3/9 and 17.38 kJ/m・1 by DR analysis.
3.3.4Comparison of Nanoporosity of NS-Inetals
Table 3-4:Comparison of data ofNS-metals
NS-Ni NS-NiFe(5/5) NS-Fe
BET SSA m2/g
Wo cm3/9
Eo kJ/mol
Metal co皿tent wt%
Pores
111
0.039
21.54
85
Microporous
&Mesoporous
67
0、029
17,38
57
Mesoporous
84
0.028
17.84
58
Mesoporous
36

NS-NiFe(5/5)and NS-Fe als・has mes・P・res・f a similar p・re size. BET
surface area = 84 and 67 m2/9 for NS-NiFe(5/5)and・NS-Fe, respectively, because the
mesopores become Iess grow皿. This is probably related to the more conte皿t of carbon in
the NS-NiFe With a higher rati・・fFe, because the part c・nsis廿ng・fn・np。r。us c肛b。n
P「・bably has li廿le c・皿血buti・n t・血e mes・P・r・sity, whereas the mes・P・r・sity sh。Uld
°ゴ幽e丘・m止e㎜・structured・metals・In c・n廿ast, m・re血cr。P・res, wh・se presence
can be indicated in the steep uprise at very 1・w relative pressure in the is。therm, are
developed in the materials with a higher content of Fe. The interaction between carbon
and Fe should be significantly dif匠brent from that between carbon and Ni. Fe atoms
mteract more strongly with carb on. Such proper症es should affect the nanostructures of
the a110ys. Table 3-4 shows that nanoporo sity ofNS-Ni differ from NS-Fe and NS-NiFe,
Fig 3-18 is a plot of surface area vs Content of each metai in each NS-metals. Carbon
content of some NS-Ni and NS-Fe are a(哲usted by a(加stmellt of concentration of Ni2+
・rFe3+s・luti・n. Surface area is represented by the nh it。f“m2/m。r・and.C。ntent。f
met訓is represe皿ted by帆%・“m2/m・r’・fNS-Fe鯉NS-NiFe(5/5)are clearly 1。wer
than that of NS-Ni. This figure also shows that nanostructure of NS-Ni differ丘om that
ofNS-Fe and NS-NiFe.
Lo∈閥∈、$詰8薯=の
5000
4000
3000
2000
1000
00 20 40 60 80
Metal「atio(%}
1eo
Figure 3-18:PIot of suri7ace area per mol vs metal content of eaoh NS-metal s, Su㎡ace
area of NS-Ni are higher than that ofNS-Fe and NS・NiFe.
37

3.4 Conclusion
Nan。stm伽red Ni・Fe・and Ni-Fe al正・ys were successfUlly prepared by a
templating metho d using a PVA film as a template matrix. The carbon atoms which are
de「ived fr・m PVA prevent fr・m sintering and・xidati・n. The nan・structured Ni keeps its
own crystal structure of fcc, although三t somewhat shows characteristics of the
nanostmc加re.工n oontrast, the nanostructured Fe shows a marked behavior sirnilar to
that often observed in the cluster formation such as the decrease in coordination nurnber
.and crystallini‡y. The PVA templating methods donate the nanostructured metals to
nanoporoslty, especlally mesopores. This method is so easily used fbr the preparation as
t・be apPlicable t・the synthetic meth。ds・f・r・man・P・r・us metals usefU1 f・r catalysts。r
hydrogen storing metals.
38
Refe rences
[1]LA. Dick, A. D. McFarl and, C. L Haynes, and R. P. Van Duyne,」. Phys. Chem. B,
106,853(2002)
「2】MA. El-Sayed. Acc. Chem. Res.,34,257(2001)
〔3]PVKamat,1. Phys. C乃θ〃、」B,106,7729(2002)
[4]LNLewis,(1993)Chem 1~ev.,93,2693(1993)
[5]S.AMaier, M L Brongersma, P G Klk, S. MeItzer, A. A. G Requicha, and H. A
Atwater, A dU. Maten,13,1501(2001)
[61C. B. Murray, S. Sun, H. Doyle, and T. B etley, MRS Bull.,26,985(2001)
[7]S.Nie, and S. R. Emory, Science,275,1102(1997)
[8]MPPileni, Adv.ルfaten,11,323(2001)
[9]MPPileni, Z Plps. C伽1. B,105,3358(2001)
[10]AC. Templeton, W P Wuelfing, and R. W Murray, Acc. Ch召〃. Res.,33,27
(2000)
[11]1.Mkami, Y「Yb shinaga,工0㎞hara, Apρ1. Catal. B,49173-179(2004)
[12]工加ai, M S ouma, T. Suzuki, S. Ozeki, and K. Kaneko,」. Phys. C伽.95,9955
(1995)
[13]LChen, X. Sun, Y Liu, K. Zhou and Y Li, Journal(~fAllの,s and Compounds,376,
257-261(2004)
[141」.Jiu, K K㎜ada㎝d M. Tanigaki, Journal of Non-C脚lline Solids,325,
124-132(2003)
[15]S.Pavasupree, Y Suz樋d, S. P Art and S.『Yoshikawa. Ceramics」rnternationul,31,
959-963(2005)
[16]Y-H.Cho a,工一K. Yang, B-H. Kim, Y-K. Jeong, J.-S Lee, T. Nakayaina,]二Sekino,
KNiihara,」. Magη.ルfagn.ルlater.,226,12(2003)
39

[17]S.Pavasupree, Y Suzuki, S. Pivsa-Art and S. Ybshikawa, Science and Technologソ
(~fA d・vanced、へdater’als,6,224-229(2005)
[18]Z.Liu, T. Fan, W Zhang, D. Zhang, Micr()pon Mesopon Mater.,85,82-88(2005)
[19エGS. A廿aτd, C. G G61tner,ハrature,378,366(1995)
[201G s・Attard, P N Bartlett, N R. B. coleman,工MEllio廿,工Rowen, J, H. wang,
Science,278,838(1997)
[21】GS. Attar¢ C. G G61tner,工MCorker, S. Hehke, R-HT伽pler, Angew. Chem.
Int.、Ed.,36,1315(1997)
[22]J.MElliott, G S. A廿ar¢PN. Bartle廿, N. R. B. Coleman, D. A. S. Mercke1, J. R.
Owen, Chθm, Maten,11,3602(1999)
[231P A. Nelson, J. M EIIiott, G S. Attard,工R. Owen, Chem Ma彪n 2002,14,524
(2002)
[24]P. Andre, B. W Ninham, M P Pileni, Adv Colloid」Tn彪rface Sci.,89,155(2001)
[25】Fila血kembo, P Andr6,1. Lisiecki, C. Petit, T, GUIik-Krzywicki, B. W Ninham, M P
Pileni, Collo ids Sηプ A174,221(2002)
[26】J.Erlebacher, M.J. Aziz, A Ka㎜a, N Di血trov, K. Sieradzki,1悔厩,410,450
(2001)
[27]MAsai, T. Onoe, H Kanoh, and K. Ka皿eko, Colloids and Surfaces A:
Phys icochem.」Eng.253,199(2005)
[28]YHattori, T. Koni shi, H. Kanoh, S. Kawasaki, and K. Kaneko, Adv.ハ4切θr.,15,
529(2003)
[29]A Dj ekoun, A. Otnani, B. Bouzabata, L. B echiri, N. Randrianantoandro, and J. M.
Greneche, Catα1.ヱbday,113,235(2006)
[301A. Gui廿o㎜a, A. Layadib, A. B ourzan tib, H. Tafatc, N. Sα㎜ia, S、 B outai faiad.
and D. Lacour,」〔漁gη. Magn.ルlatert 320,1385(2008)
[311M Kakihana, M. Ybshimura, H. Maz撮d, H. Yasuoka, L. Bll esson,」. Appl. .Phys.,
71,3904(1992)
40

[32]NUekawa, K Kaneko,」. Phys. Chem.,B102,8719(1998)
[331Q・wai ng, L. He,・Po{遡εr,38,3931(1997)
[34]EJia, Y Hu, Y Tang, L Zhang,. Powder Technorogソ,176,130-136(2007)
[351R恥FKang, D. C ai, C. Wang, J. Gu. K. Wang, D. Wu, Journal{)fPhysics and
(:乃ε吻な妙(ゾSolids,69,1213-1217(2008)
41

Ch.apter 4
V繍por Growth Spherical Carbon
4.1 1ntroduction
Recently, materials which have nanopores have gathered a great attentioエ1 such
as activated carbon fiber and zeo胱e. They have far out properties fヒom common carbe血.
or silica.正n nanopores, special highlighted potential fields were built up by interaction
of inner pore walls.
Many㎜ostructured calbo皿s such as fUIIerenes[1], carbon nanotubes[2]一[4],
carbon nanohorns[5], and activated carb on f董bers[6]{15]are studied all over the world.
They have nanopores whose diameter is below 2 nm Emd interesting properties such as
adsorbability. electric conduction母nd so on. They are expected to be apPlied as energy
storage, catalyst supPort, capacitor, and so on.
There are some vvays to prepare nanostuctured carb ons,1aser ablation is one of
theln[16-24]. Laser ablation is a process to remove surface materiaI fbom solid When
surface material is irradiated by l aser, the surface is heated and fused or vaporized. Then,
Atoms, ions, and clusters…are s cattered. VaporiZed carbon atoms for m nanostructure by
the contribution of catalyst and coo㎞g. UsualIy, Nd:YAG pulsed iasers are used fbr
preparation of nanostructured carbons,
Laser abユation method can obtain nanocarbon which is high purit¥
NanostructUre of prepared carbon depends on conditions such as laser strengtin, pressure
of gas, temperature of chamber, and so on. This method have a defect that yield of
nanostructured carbon is very small. However, laser ablation of hydrocarbon can
achieve high yield
ln this section, preparation and characterizati on of new nanostructured carbon孟s
reported・It is ge皿erated in gas chalnber that is charged acetylene gas and SF6. When
argo血ion正aser is irradiateq fluffy carbon grows slowly. The fiuf取carbon is caUed
vapor-grown spherical carbon(VGSC).
42

4.2 Preparation of VGSC
Synthesis of VGSC is carried out in gas chamber Mixed gas which is
compOsed by 160 torr ofC2H2 and 240 torr ofSF6 filled the chamber. 514 nm argon ion
laser is radiated to basis, then the basis emit the orange light and black and fluffy carbon
material is synthesized. If there is not S F6 gas in chamber, synthesiZed carbon has 1inear
strUC加re.
A丘er heat treatment, adsorption properties of VGSC are dramatically changed.
By XPS, heat treatment removes the SF6 contained in VGSC. Heat-treated VGSC is
called HT-VGSC.
4.3 Characterization
SEM image of VGSC is shown as Fig.4-1. There are nanosized spherical
structUres and the sample looks spOngy.
Figure 4-1:SEM image of VGSC
Fig.4-2(a)and(b)are TEM images of VGSC observed by Ms. Shuhara・Layer
43

structure is observed from(a)and spherical and amorphous structure is observed from
(b).
灘潔
腿
ミ5ミN
悪
’一@t
謬
o
,
ぢ o
繭
、
、D
護遥歌蒙圃
愛了童
瞬貿毯}望
嚢霞戦熟慶
o
の
漣 し
鰻撚護ぎ藍昏
へぐ捉葦甘鴛儀
議螺げずぎ
『バン
認 び
’も
℃
,
。.9
1°
騰購
72A“.
,1
鶴
郵
探
;k,‘ , ’・
鐵
講・
●
隷鑛鑛藻灘
灘
■
サ.ρ ・
」 r
’
轄・鐵
’
鴇・解禰 ‘ψ A
灘撃
げ
●
ら
M
虫 ’ 幡 ゜
t
o
雛
1
’(b)
,
Figure 4-2:TEM images of VGSC.(a)shows layer structure and(b)shows spherica1
structUre.
44

N2 adsorption at 77K is Fig4-3. BET surface area is 517 m2/g According to
Dubinin-Radushkevich equation, the mioropore volume is O.193 cm3/g and
characteristic・adso・ption energy is 15.01 k伽ol.
1500
0
0 0.2 0.4 0.6 0.8 1
P’Po
Figure 4-3:N2 Adsorption isotherm ofVGS C
Fig.44 i s Raman spectrum of VGSC. Peak aエea ratio of D-band and G-band i s
DIG=1.75. Amo]「phous and spherical carbons(Fig.4-2 a)give D-band and layer carbons
(Fig4-2b)give G-band.
2500
2000
oo15窃=㊥だ■
1000
SO№ngt1200 1400 1600
Raman shift (cm’t}
1800
Figure 44:Raman spectrumL of VGSC
45

Heat-treated VGSC(HT・VGSC)have high surface area and pore volume. Heat
t「eaセnent ls camed out in argon gas now(100 mymin)and the temperature is increased
to 873K(heating rate is 3 K/㎡n). TG measurelnent shows that there is weight decrease
of VGSC. Then, removal of atoms is occulre己Final1}~weight of VGSC was increased
about half of befbre heat・treated VGSC.
100
90
80
A》700ト
60
50
40 300 400 500 600 700 800 900
Temp, (K)
Figure 4-5: TG measurement of VGSC under argon gas flow. Hea血g rate is 3 K/mi11
Fig.4-6 is N2 adsorption at 77K of HT-VGSC. BET sur face area is 1132 m2/g.
There is a remarkable increase of adsorbed amount and surface area. According to DR
equati・卿icr・P・re v・lume is O.443 cm3/g Speci丘c su血ce area and micr・P・re v・1ume
are about 2.3 times as Iarge as VGSC.
46
OOO5
0 0 0.2 0.4 0.6 0.8 1
P’Po
Figure 4-5:N2 adsorption at 77K of HT・・VGSC
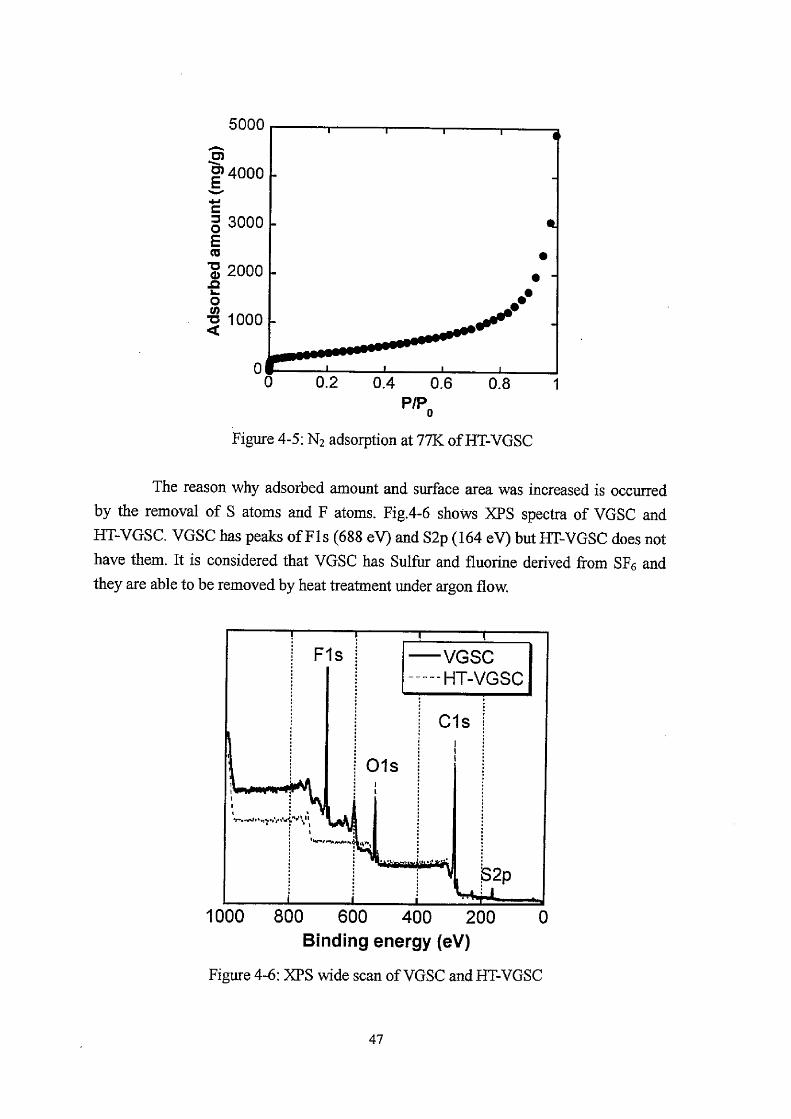
The reaso血why adsorbed amount and surface area was increased is occurred
by the removal of S atoms and F atoms. Fig.4-6 shows XPS spectra of VGSC and
HT-VGSC VGSC has peaks of F l s(688 eV)and S2p(164 eV)but HT-VGSC does not
have them. It is considered that VGSC has SUIfUr and fluo血e derived from SF6 and
they are able to be removed by heat treatment u皿der argon flowI
VGSC
-一… gT-VGSC
S2P
10eO 800 600 400 200 0
Binding energy(eV)
Figure 4-6:XPS wide scan of VGSC and HT・VGSC
47

Ms. Shuhara pe㎡formed H2 adsorption at 77K, Table 4-1 is amou皿t of H2
adso]4)tion atα1MPa. HTLVGSC denoted very high adsorption ability about 3.4 times
・fVGSC・37・5 mgtcm3 is higher tlian Activated carb・n・fiber(1700m2/9,29 mg/ cm3).
Table 4-1:H2 adsorbed amount ofVGSC and H r・VGS C at O.1MPa
VGSC HT・VGS C
Adsorbed amount(皿g/g)
Adsorbed amount(mg/cm3)
4.92
37.3
16.6
37.5
4.4 Conclusion
VGSC is consisted both layer structUre and spherical structure according to
TEM images. Former structure denotes G-band in Raman spectro scopy. From XP S
spectra, SF6 is present on surface of VGSC. By heat treatment under Ar gas fl ow, SF6 i s
romoved and inclease surface area and micropore volume about 2.3 thnes. Adsorbed
amount of hydrogen of H [:-VGSC i s about 3.4 t㎞es before heat-treatment. HT-VGSC
has a lot of possibilities of apPlication to adsorbent.
48

References
[1]HWKroto,」. R. Heath, S. C O’Brien, R E Curl, R E. Smalley,ハrature,318,
162-163(1985)
[2]A.Oberlin, M。 Endo, and T. Koyama,」. C弓2st. Growth,32,335-349(1976)
[31T. W. Ebbesen, P. M. Aj ayan,ハrature, 358,220-221(1992)
[41S. lij ima,、Matztre,354.56-58(1991)
[51S. Iij ima, M. Yudasaka, R. Yiamada, S. B andow, K. Suenaga, E Kokai, K. Takahashi,
Chem. P/llys.」r.ett.,309,165-170(1999)
[61K. Kaneko and K. Kakei,1. Collo id lnterface Sci.,129.583(1989)
[71YFuj iwara, K. Nishikawa, T. lij ima and K. Kaneko,」. Chem. Soc. Faraday Trans.,
87,2763-2768(1991)
[8]M.Jaroniec, R. K. Gilpin, K, Kaneko and J. Choma, Langmuir,7,2719(1991)
[91N. Setoyama, M. Ruike, T. Kasu, T. Suzuld and K. Kaneko, Lagmuir,9,2612
(1993)
[101M. Rujke, T. Kas馬N. S etoya皿a, T. Suzuki and K. Kaneko, J.・Phys Chem.,98,
9594(1994)
[11]YKaneko, K. Ohb↓」N. Uekawa, K. Fuj ie and K. Kalleko,」r.angmuか,11,708-710
(1995)
[12]T.Iiyama, T. Suzuki and K. Kaneko, Chem. Phys.、Lett.,259,37-40(1996)
[13]MS. Dresselhaus, A. W P Fmg, A. M. Rao, S. L. di Vlttorio, K. Kuriyama, G
Dresselhaus, and M. Endo, Carbon,30,1065(1992)
[141K Kaneko, C Ishii, M. Ruike, and H. Kuwabara, Carbon,30,1075(1992)
[151K Kaneko, T. Katori, K Sh三mizu, N Sh孟ndo and「r Maeda,」・Chem. Soc・Faradaソ
7ンans.,88,1305-1309(1992)
49

[161E capPelli, c・sci正1etta, s・orlando, v「valentini, M. servidori, ApPlied surface
Science, In Press, Corrected Proof, Available online 280ctober 2008
[17]J.B. Park, S. HJeong, M S. Jeong,工YKim, B, K. Cho, Carbon,46,1369-1377
(2008)
[ユ81G Radiiakrist晦 P. M Adams. L S. B ernstein. Applied S勿face Science,253,
7651-7655(2007)
[19]C.Scilletta, M S erVidori, S. Orl ando, E. Cappelli, L. B arba, P. Ascarelli, Applied
Sπ吻cθScienee,252,4877-4881(2006)
[20]Dt Bolgiaghi, A. Motello, P
2122-2127(2005)
Mosaner, PM Ossi, G Radnoozi, Carbon,43,
[21]ECappelli, C. SciUe廿a, S. Orlando, R. FIa㎜血, S. Iacobucci, P AscareIIi, Thin
Solid Films,482,305-310(2005)
[22]EKokai, A. Koshio, M Shiraishi, T. Mat瓢a, S. Shimoda, M. Ishihara, Y Koga, H.
Deno,、Oiαmond and Related Materials,14,724-728(2005)
[23】AKoshio, M. Sh丘aishi, Y Kobayashi, M. Ishihara, Y. Kogeg S。 Bandow, S.珂ima,
F.Kokai,(]hemica1 Phγsics、Letters,396,410-414(2004)
[241L Gavrila-Flores叫工. Morj an, E. Popovici,1. sand馬1. voicu, 1. Di且ca, A. stefa n,
C.Serghie, L. Dumitrache, C. Nistor, V, Stefan, S. S erban, D. Donescu, G Prod鋤,
VCiupina, Ma旋irials Science and」P., ngineering’C,27,1010-1014(2007)
50

噛
Ch紐pter 5
C鎚rbon N3mribbon
5.1 1ntroduction
Nowadays, nallomaterials have gathered a great attention. Particularly, many
nano structured carbons such as fUllerenes [1], carbon 血anotubes [2]{41, carb on
nanohoms[5]are researched by numerous scientists. Carb。n materials are very
available due to their physical and che血cal properties. For e㎜ple, high purity, small
weight, conductivi卑mechanical strength,10w cost, and so o皿. They are expected to
apPly as catalysts, molecular sieving, energy storage, dru.g delivery system,
supercapacitor, a皿d so on. Now, many resealchers sy皿thesiZe皿ew nanostmctured
carbo皿s such as carbon com[6], nanodisc[7], nanofiber[8]一[10], graphite ribbon 111],
troidal structure s[12][13], carbon nanob elt[14], and so on.
Carbon materials have vaτious properties depending on their nanostructure.
Carbon materials can form vai ious morphology such as tUbe-1ike, spherical, fiber-like,
ribbon-l ike, and so on. ln view of lmit structure, carbon atoms ca n form b oth crystal
structure a血d amorPhous structure. There are si血91e graphene sheet, double graphene
sheet, and mUlti graphene sheet. lf carbon material has nanopores, the adsorbability and
surface properties of carboll material is affected by the size ef nanopores, shape of
nanopore s, and network of nanopores.
GTaphite has basal plane and edge plane. The pIane which is formed by sp2
bonding carbon is called basal plane. This plane denotes(002)plane in XRD pattern・
The side of basal plane is ca11ed edge plane. Edge plalle have different properties i.]n
adSprbability. R且m.all spectru田薩, and so on. Several results of experiments denote that
carbon nanoribbon have edge plane of graphene structしrre.
Recently, Mauricio Terrones and co-workers prepared new nanocarbon, This
nanocarbon have shape of ribbon whose width is about 75 nanometers. So Terrones a皿d
co-workers nam.ed it carbon nanoribbonL[15].
51

5.2 Experimental
The synthesis・fcarb・n nan・ribb・n・was・carried・ut using the aer・s・l pyr・lysis
process・280 mL of ethanol solution containing 2.80 g of ferrocene and O.266 mL of
thi・phene is a carb・n s・urce・An aer・s・1 was generated by ultras・nic and was carried by
argon flow into a quartz tube l㏄ated inside a two-fUrnace system heated to 1223K.
A負er 30 minutes, ultrasonic was tUrned off, the Ar flow was decreased and fUrnace ware
cool to room temperature. Black powder material was scrapped fヒom the walls of the
tube in the quar屹tu1)e. It is carbon nanoribbon.
Cafbon nanoribbon was characterized by N2 adsorption at 77K, H2 adsorption
at 77K, CO2 adsorption, X-ray diffraction(XRD), X-ray photoelectron spectroscopy
(XPS), S caming electron microscope(SEM), and Raman spectroscopy.
5.3 Characterization
Fig.5-1 is SEM image of carbon nanoribbon. According to this image, carbon
nanoribbon have about 75 nm in Width and several micrometers in 1ength. Nanoscale
graphite are stacked and strung. They form ribbon as a whole.
52

Figure 5-1:SEM image。f carb on nanribbon. Wi dth is about 75 um,
length is several micrometers.
Fig・5-2 is XRD pattem of carbon nanoribbon and Table 5-1 is parameters of carbon
nanoribbon. Wave Iength of X-ray is O.1002㎜(This measurement was curried out in
SPring 8)・This result denotes carbon nanoribbon have highly crystalline graphite-like
structuエe, whi ch revealed the presence of the(002),(100),(004)and(110)reflections,
respectively[16][17]. Stacking wid血is about 13㎜by Sherrer’s equation. lt
corresponds to about 401ayers of graphene layer
旧ω
<ウ芒■
10 20 0θ32
40 50
Figure 5-2 XRD pattern of carbon nanoribbon.λ=O.1002㎜.
Table 5-1 XRD parameters:crysta llite size i s ana]yzed by Sherrers’s equatio皿.
(002) (100) (004) (110)
20 17.15 27.99 34.71 48.11
“value(nm) 0.3360 0.2072 0.1679 0.1228
Crysta夏胱e size(nm) 13 7 10 47
Fig.5-3(a)is N2 adsorption isotheim of carbon nanoribbon and(b)is its log
plot. This isotherm is II typ e and there is not difference of adsorption arnount between
adsorption branch and desorption branch. This result means that carbon nanoribbon
d。es n。t have b。th mes・P・res and micr・P・res. Specific surface area is s9 m2/9
53

calculated by BET method and characteristic adsorption energy is 16.4 kJ/mo1.
Dr. Ohba performed N2 adsorption simulation on graphite basal plane. Fig,5-3
(c)is comparison plot carbon nanoribbon vs simulation of N2 adsorption on graphite
basal plane・Vertical axis is adsorption aエnount of carbon na血oribbon, and horizontal
axis is adsorption amount of adsorption simulation on graphite basal plane. When
adS・rPti・n am・unt is O289/tn2, adS・・bed N2 m・lecUles f・rm m・n・layer・n c肛b。n
nanoribbon. When adsorption amount is smaller than O.28 g/m2, pl ot appears under
diagonal line. This means interaction between N2 molecu正es and carbon nanoribbon is
weaker than graphite basal pla皿e. This suggests that surface property of carbo皿
nanoribbon is affected by edge carbon of graphene sheet.
At lowest pressure of Fig.5-3(c), there are 3 points above the diagonal line.
They c・rresp・皿d t・PrP・=・104-10’5. A si皿Ulati・n(協血i廊血t de魚cts・n 9raphite
basal plane occur increase of adsorption. amount丘om P/Po=104 to P/Po=1α5[18],
Carb on nanoribbon may have defects on graphite basal pla ne.
200
o
(a)
OAds。rption
ODeSOiption
.●a
ee●●●・
.●●●●●●
e
O●
200
50 00 50
0 O.2 0.4
P’Po
O.6 0.8 1o-5 一4 ・3 ・2
109‘PIPo}
で
“ o
54

1.5
1
0.5
(c)
Second layer
Monolayer
0 0 0.5 1 1.5
Simulation on graphite basal plane{mg’m2}
Figure 5-3:(a)is adsorption isotherm of carbon nanoribbo皿. Solid symboI is adso1ption,
hollow symbol is desorptio皿. Su出ace area is 59 m2/g by BET method.(b)is log plot of
(a).(c)is compari s on plot carbon nanoribb on vs adsorption simUlation on graphite basal
Plane. Unit of adsorption amount is mg/m2.
Dr. Ohba a lso perforrned N2 adsorption sinU lation on graphite which have『both
basal plane a皿d edge plane. Fig,5-4(a)is the adsorPtion isotherm,(b)is its log Plot, and
Fig.5-5 is snapshotS of simUlation. This siniulation shows that adSorbed amount on edge
pla皿e is much smaller than that on basal plane. These results denote that ilteraction
between N2 molecules and edge plane is weaker than graphite basal plane. This is
evidence of connibuti on of edge plane in N2 adSorPtion.
55

{◎
0
1一
一2
一3
一5
一6
0 10G 200 300 PIP o
400 500
500
400
300
200
鷹OO
o
1・g{pm。〕
Fig5-4:(a)is adsorption isotherm of simulation on graphite which have both basa1 ・pla皿e
and edge Plane.(b)is log Plot of(a).
56

P/Po=8.20×10-6 P/Po=7.87×10’5
P∠Po=1.12×10⁴ P/Po=2.23×10°3
P/Po=1.97×10-2
D
,
●
PIPo=2.16×10’1 ワ
噌
Figure 5-5:snapshots of N2 adsorption sim Ul ati on on graphite which have both basaI
Plane and edge plane. Isotherm of this simUlation is Fig.5-4
57

Fig5-6 is XPS spectrum of C l s.)〈PS spectrum of C l s regton can be diVided
into sp2, sp3,0xidized carbon[19]一[21]. Result of deconvolutio皿is showed in Table 5-2.
Method of deconvolution is based on refbrence[22]. According to deconvolution, it i s
fbu皿d that the material contained sp2 and sp3 hybridized carbon atoms(39%sp2 and
39%sp3)and oxidized carb on atoms which eXist as surface ftmctional group. Reference
[23]shows that carbon atoms of basal plain and edge plain can be distinguished by XPS.
W6 can suppose that sp3 carbon atoms are edge carbons.
〉湯5芒
290 285Binding energy(eV)
280
、
Figure 54:XPS spectrum of C l s. Splitting i s derived from eXi stence of sp2 and sp3
Table 5-2 Ratio of carbon atoms calculated by deconvolutio且
Peak(eV) %
C(s2) 284.1 39
3Cs285.1 27
C(53) 285.7 12.
C-0 286.6 8
C=0 2872 9
COO 289.2 凸5
58

Fig・5-7 is Raman spectrum of carbon nanoribbon. This was measured by YA.G
laser 532㎜. Although XRD pattern denotes crystalline of carbon nanoribb on, D-band
is bigger than G-ba皿d Peak area ofDIG=・1.57. This suggests that graphite have defect
or edge carbons contribute to result of Raman. D-band peak can be divided into
am・orphous carbon and edge carbon[23][24]. Aエnorphous carbon gives peak of 1360
cm”1 and edge carbon gives peak of 1351 cm齢1. Peak of 1620 cm’1 is al so derived fヒorn
edge carb on[25][26】. Fi g,5-8 i s curve fitting of Ram、an spectrum of carb on nanoribb on.
ユ351cm.-1 peak which denotes edge carbon is larger than another peak which denotes
amorPhous carbon
一望」ε』
1000 1200 1400 1600
Raman shift(cm’t)
1800
Figure 5-7:Raman spec加皿n of carbon nanoribbon.
D-ba皿d(1360 cm-1)is bigger than. G-band(1598 cm帽1)
59

個oり=9三
1000 1200 1400 1600
Raman・shift(cm凸1}
Figure 5-8:Curve fitting of Rama皿spectrum
1soe
Fig.5-9 is H2 adsorption at 7刀くof carbon nano曲bon. This isothe㎜shows
Characteristic of Henry-type, however, 面s isotherm al so have curve Iike
Langmuir-type isotherm blow 200 torr This curve is given a fact that H2 adsorption
energy on graphite edge plane is larger than that of graphite basal plane[27]. Saturation
amount on.edge pla皿e is O.44 mg/g a皿alyzed by Langmuir plot with an assumption that
this is Langmu血一type isothe㎜below 200 toπ.59 m2 is covered by 1.6 mg hy(irogen.
0.44mg is 27.5%of it. Graphite edge plane is stipposed to occupy 27.5%of surface
alea.
60

1 ,2
0o
・Ads。rpti・n ノ゜Des°「pti°n
!
y
eO
200’@ 400 600
Pressure(torr}
800
Figure 5-9:耳2 adSorPtion at 77K of carbon nanoribbo皿
Interaction betWeen CO2 molecUIe and edge plane is stronger than basa1 plane.
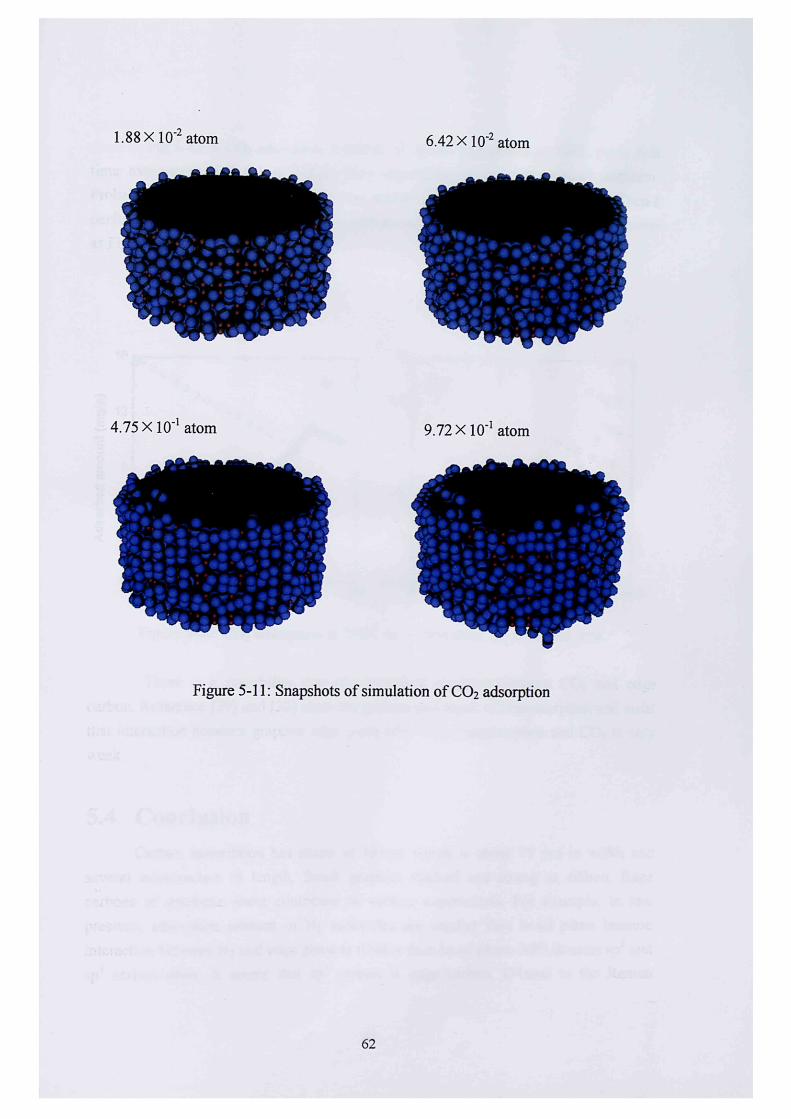
Edge plane can adsorb about g times of CO2 as much as basal PIa皿e[28]. Ohba’s
simUlation also shows s血ilar resUlt. Fig.5-10 is adSorption isothemm of CO2 simUlation.
at 273K and Fig.5-11 is snapshots of simulation. Almost CO2 molecUles are adsorbed on
edge plane.
061
@
Q0@ 80 40
o O O.2 0.4 0.6 0.8 1
P「essu「e(tor「}
Figure 5-10:Simulatio且of CO2 adsorption at 273K
61
1.88×10⁻²atom 6.42×10⁻²atom
4.75×10⁻¹atom 9.72×10’iatom
Figuire 5-11:Snapshots of simUlation of CO2 adSorption
62

Fig,5-12 is CO2 adsorPtion isotherrn of carbon nanoribbo皿at 298K.(a)is first
time experilnent and(b)is second time expe血1ent.(a)shows unusual isothenn.
Probably, eqUilibriur皿thnes of adsorption are too short to denete colrect result. Then I
performed same experiment, however, carb o皿nanoribbon hardly adsorbed CO2 shown
as Fig.5-12(b).
16
1
ノン
’
2
1.5
1
0.5
0
舘も
Oo●
OOo∂
0 -O.5 0 200 400 600 800 0 200 400 600 800
Pressure{to rr) Pressure⊂torr〕
Figule 5-12:CO2 adsorption at 298K.(a)is first time,(b)is socond time.
There is a possibility that chemisorption occurred between CO2 and edge
carbon. Reference[29]and[30]show the process a皿d resuユt of chemisorption alld insist
that interaction betWeen graphite edge plane after CO2 chemisorption a nd CO2 is very
weak.
5.4 Conclusion
Carbon nanoribbon has shape of rtbbon which is about 75 nm in Width and
several microrneters in length. Small graphite stacked and strung as ribbon. Edge
carbons of graphene sheet contribute to various experiments. For example, in low
pressure, adsorption amount of N2 molecules are smaller than basal plane because
interacti。n betWeen N2 and edge plane is weaker than basal plane. XPS den・tes sp2 and
sp3 carb・n at・m. lt seems that sp3 carb・n is edge carb・n. D-band in the Raman
63

spectrum suggests existence of edge carbon・H2 adsorption and CO2 adsorption also
show the contribution of edge carbon.
Possibility of application of caエbon nanoribbon has never been reveale(L But
carbon nanoribbon may be apPlied as gas se皿sor and electrode because edge carbon
atoms have excellent therma1 conductivity a皿d electrical conductivity[31].
64

Refe rences
[1]H.W. Kroto,工RHeath, S. C.0’Brie且, R F. Curl, R. E. SmalIey, Nature,318,
162一ユ63(1985)
[2]A.Ober1虹M. E且do, and T. K.oyama, Z C那ムαow吻,32,335-349(1976)
[3]T.WEbbesen, P M Ajayan,ハxature,358,220-221(1992)
[4} S.工ijiエna,1>ね’卸rβ,354,56--58(1991)
[5]S.珂irna, M Yudasaka, R Yiamada, S. Bandow, K. Suenaga, E Kokai, K. Takahashi,
Chεm. P/tys. Leit.,309,165-170(1999)
[6}J,J. Li, Q. Wiang, C.Z. Gu,θ1tramicroscop;ソ,107,861-864(2007)
[71A. Krishnan, et aL,Nature,388,451-454(1997)
[8]GB. Zheng, H. Sano, Y Uchiyama, Carbon,41,853(2003)
[9]GBzhe皿9, K Kouda, H. Sano, Y Uchiyama, Y E Shi, H. J. Quan, Carbon,42,
635-640(2004)
[10]P. Li, Ting Li, J. H. Zhou, Z. J. Sui, Y.C. Dai, W. K. Yuan, D. Chen,翅oκ四
Mesopon・Mater.,95,1-7(2006)
{川M.Kyotani, C. Yamaguchi, A. Goto, K. Sasaki, H. Matsui, and Y Koga, S7nth eがe
Metals,121,1237-1238(2001)
[12]ぎ.Liu, H. Dai,工H. Hafher, D, T. Colbert, R E Sma11ey, S. J. Tans, and C Dekker,
ハZature,385,780-781(1997)
[131R. Martel, U R Shea, and P Avo面s, Nature,398,299-299(1999)
[14】C、T. Lin, T. H. Chen, T. S. Chil1, C. Y Lee, H. T. Chiu. Carbon,46,741-746(2008)
【15]工Campos-Delgado,工MRomo-Herrer亀XJiζD.んCullen, H. MuramatSeq Y A.
㎞,THayashi, Z. Ren, D,工Smith, Y Okuno, T. Ohba, H Kanoh, K K狂neko, M
Endo,}1. Terrones, M. S. Dresselhaus, a且d M. Terrones, Nano Letters,8,2773-2778
(2008)
65

[161YHishiya1na, M. Nakamura. Carbon.,33,1399-1403(1995)
[17ユPMAdams, K A Katzman, G S. Rellick*and G W Stupian, Carbon,36,
233-245(1998)
[181A. R. T㎜er andNQu廿ke, Cα加,36,1439-1446(1998)
[19]A.Proctor a血d Peter M. A. Sherwoo4 Journal of Electron Spectroscopy and
Related1〕henomena,27,39-56(1982)
[20]工Li, Y Huang, Z. Xu. Z. Wiang, Materials C舵溺∫3砂and Pltysics,94,315-321
(2005)
[211F. Mohammadi, P. TimbreIl, S. Zhong, C. Padeste, M. Skyllas-Kazacos, Je urnal()f
P・wer S・urces・52・61-68(1994)
[22]S.Utsumi, H. Honda, Y HEttori, H. Kano駕K. Takahashi, H. Sakai, M. Ab e, M.
Ylldasaka, S.1導㎞匙K. Kaneko,1.」P/tys. Chem C,111,5572(2007)
[23]MNakahara, S.0㎞uld, H. Takahashi, and Y Sanada, Cαrゐo刀,34,397-402(1996)
[24]GKatagiri, H. Ishida, A.王shitani, Carbon,26,565-571(1988)
[25]GCompagn血i,0. Puhlisi, and G Foti, Carbon,35,1793-1797(1997)
[26]YKawashima, alld G Katag痘,、Phys. 1~ev. B,52,10053-10059(1995)
[27]EH. Yang, R. T. Yang, Carbon,40,437-444(2002)
【28]S.GChen and R. T. Yang, Langmor’r,9,3259(1993)
[29]PA. Gauden, M. WiSniewski, Applied Surface Scienee,253,5726-5731(2007)
[301A. Montoya, E Mo曲agon, T. N. Truong,. Carbon,41,29(2003)
[311E. R. Lowe, C. E. Bahks, R. G Compton,!歪nal. Bieanal. Chem,,382,1169-1174
(2005)
66

General Conclusion
Recently new nanostrucred materials have been develope¢ because
environmentally firiend techmologies need a b etter performance than the traditional
nanoporous materials. Nanopores have specific interaction fie亘ds with molecules and
ions and thereby a variety of Inaterials having the pore wall chemistry and pore
geometry have been developed. In this paper, three new nanostrucred materials were
reported. Nanostructured metals, Vapor Growth Spheri cal Carbon(VGS C), and Carbon
Nanoribb on.
Maj or nanoporou.s materi als are insulative or serniconductive except for carbon
nanotube石amilies.正f we can develop nanoporous met組s of high conductivity, those
nanoporous metals should widen the application of nanoporous systems, conhibution to
the environmentally friend technologies. Generally speaking, metals are highly reactive
With oxygen and they have low melting points, i皿ducing an easy sinte血g among metal
particles. Consequently. it is quite difiicult to prepare st4ble nanoporous metals,
although they are promising in sustainable chemistry. There is a new method to prepare
na皿ostmctured nickel using Poly(Vinyl alcohol)(PVA). This method resolves sintering
and oXidation of metals because carbo皿atoms which i s derived from PVA. prevent them,
Nanostmctured nickel prepared by PVA method has excellent large surface area(111
m2/g)compared with other nano metals.
This method can prepare not only nickel but also other皿anostructured metals.
Nanostnエctured iron can be synthesized and it has mesopore. NanostructUred iron
contains much carbon because iroll atoms have strong interaction with carbon atoms・.
Ab out 201ayers of graphite ware formed on iron nanopanicles. Nanostructured Ni/Fe
alloy also can be synthesized. It has fcc structure similar to nickel metal. It was
analyzed by XRD and EXAFS.
VGSC i s synthesized by laser radiation and it has nanosized spherical structure.
It is synthesized under C2H2 and SF, gas flow. VGSC has both layer structure and
amorphous spherical structure. Forrner structure is simiIar to graphite. VGSC has l arge
surface area(517 m~/g)and micropore volume(0.193 cm3/g)and high adsorption ability.
On the surf盗ce, there aτe S and F atoms derived f}om SF6. Heat treatment umder argon
67

flow increase the surface area and micropore volume of VGSC(about 2,3 times)by
removing the S and F atoms. Heat-treated VGSC is expected to be applied as gas
storage.
Carbon Nanoribbon was prepared by Professor Terrones and co・workers in
Mexi co, PICYT. This nanoribb on has a stacking structure consisting of n ticrographitic
layers smaller than l OO皿m in Width and several micrometers血length, which were
confrirmed by SEM observation. The graphitic stmcture coUld al s o be observed by
XRD:Stacking width is about 13㎜(about 30401ayers). Graphite edge carbon atoms
contribute to results. For example, N2 adSorbed amount i皿Iow pressure is smaユler than
graphite edge Plane, Hi and Cb2 were adsorbed largely or occurred cheエnisorPtion,
Raman spectrum has strong D-band which denotes edge carbon, and XPS spectrum
de皿oted sp3 carboIL
68

Ac㎞owledgement Ithank to my supervisor, Professor]i(atsumi Ka皿eko, Pぎofessor H三rof曲i
Kanoh, and Assistant professor Tomonori Ohba. I thank f(〕r their d三reotion, suppGrt,
encouragement, and discussion.
1 would like to thank to the follow scientists:
Associate professer Ybshiyuki Hattori(Shinshu Uhiversity)fbr direct重on of
NS-Ni preparation method, analysis of EXAFS, and all his helps.
Assistant profbssor Shigeno践Uts㎜i(TokCyo University of Science)fbr TEM
observation and XP S analysis.
Ms. Ai Shuhara fbr preparation of VGSC and its data of hy(irogen adsorption.
Professor Mauricio Terrone s and co-workers(IPICYT, Mexico)f{)r donation of
carbon nanoエibbon
Experiments an.d measurements were performed by follow appara加ses or facilities,
ThermograVimetric analysis was caπied out with an EXSTAR 6000 system
(SEIKO instruments正nc.). The sca血ng electron microscope(SEM)i.i皿ages of the
products were observed with a JEOL JSM-6330F. The XRD patterns were reoorded
With an X-ray diffractometer(Riga㎞MiniFlex)using Cu Kα(30 kV 16 mA)radiation.
XRD measule皿ent was also perfbrmed in SPring 8 with synchrotron X・ray. XPS
measurements were carried out using a JEOL JPS-9010MX X-ray photoeleotron
spectroIneter which use MgKαradiation. Raman spectra were measured by a JASCO
RS-3100 Las er Ralnan Spectroplloton且1eteL The EXAFS measurements were
perforrned on b oth Ni and Fe K・edges for the alkali-treated films at the National
Laboratory for High Energy Accelerator Research Organ ization(KEK)in Tsukuba The
EXAF S spectra ofthe corresponding fbils were皿easured for comparison. The structure
determination was carried out by the curve fitting of the reverse Fourier transfbrmed
function of the lst shell in each radial structure fUnction(RSF)with theoretical
paraエneters calculated by FEFF code・
69