New method for railway track quality identification ... · New method for railway track quality...
11
1 3 J Braz. Soc. Mech. Sci. Eng. DOI 10.1007/s40430-015-0471-9 REVIEW New method for railway track quality identification through the safety dynamic performance of instrumented railway vehicle Roberto Spinola Barbosa 1 Received: 30 January 2014 / Accepted: 9 December 2015 © The Brazilian Society of Mechanical Sciences and Engineering 2015 Keywords Railway · Track · Quality · Safety · Vehicle · Dynamic 1 Introduction Railway companies seek to operate transport systems with greater confidence. Tracks should be reliable, available for use and easy to maintain (reliability–availability–main- tainability and safety—RAMS as defined by the European Union—UIC). To guarantee safe traffic conditions, the operator should keep track geometry standards at the high- est quality possible, for an inspection time interval. This maintenance process is expensive due to tamping, ballast cleaning or renewal, sleeper replacement, joint repair, rail grinding or replacement and substructure treatment and other maintenance interventions. Railways also seek to establish explicit processes for decision-making regard- ing various activities to be undertaken to keep the track infrastructure in satisfactory condition or within desirable (required) condition/operational limits. Jovanovic [19] pro- posed a track maintenance management system where the Track Quality Index (TQI) is one of the conditions to be met, to apply maintenance resource more effectively. The Track Expert Group of UIC reveals in the report “Future of railway monitoring in Europe” [27] an increasing vehicle- based measuring systems rather than trackside or manual that will enable comparison and trend identification, lead- ing to deeper understanding of asset behaviour: “This can help optimise maintenance strategy”. Track quality is traditionally quantified with a special- ized-on-moving measuring car that measures track geomet- ric basic parameters. Usually, the inspection car measures and records the variation of the track gage, vertical and lat- eral alignments and cross-level (angular variation on a track Abstract Track geometry locations that exceed geom- etry-standardized limits do not necessarily cause poor vehicle performance. However, there are locations under geometric limits that promote unsafe dynamic vehicle performance. To handle this dichotomy, a new method for track inspection is proposed to complement the traditional ones. An inertial measuring system and a specialized data treatment method is presented to evaluate the railway track quality, observed from the vehicle dynamic performance point of view. With inertial devices the system measures the vehicle dynamic movements during transit along an irregular track. Values measured are used in an inertial navigation algorithm with a Kalman filter, to identify the full vehicle attitude, including angular positions and accel- erations. System equations for the inverse vehicle dynamic problem, augmented with the suspension torsion equation, is solved to directly estimate the wheels driving forces that are directly correlated with the vehicle safety. An adi- mensional Safety Index (SI) is proposed to evaluate track quality. Values obtained are used to quantify track harm- ful locations. Results of two test campaign travelling on the irregular track in a conventional train identify the full vehicle attitude and movement. The SI and the location of the most potential hazard region for track maintenance purposes were identified. Good correlation between SI and measured track geometry is observed being a promising technique. * Roberto Spinola Barbosa [email protected] 1 Depto. Eng. Mecânica, POLI - USP, Escola Politécnica da Universidade de São Paulo, São Paulo, SP 05508-900, Brazil
Transcript of New method for railway track quality identification ... · New method for railway track quality...
1 3
J Braz. Soc. Mech. Sci. Eng.DOI 10.1007/s40430-015-0471-9
REVIEW
New method for railway track quality identification through the safety dynamic performance of instrumented railway vehicle
Roberto Spinola Barbosa1
Received: 30 January 2014 / Accepted: 9 December 2015 © The Brazilian Society of Mechanical Sciences and Engineering 2015
Keywords Railway · Track · Quality · Safety · Vehicle · Dynamic
1 Introduction
Railway companies seek to operate transport systems with greater confidence. Tracks should be reliable, available for use and easy to maintain (reliability–availability–main-tainability and safety—RAMS as defined by the European Union—UIC). To guarantee safe traffic conditions, the operator should keep track geometry standards at the high-est quality possible, for an inspection time interval. This maintenance process is expensive due to tamping, ballast cleaning or renewal, sleeper replacement, joint repair, rail grinding or replacement and substructure treatment and other maintenance interventions. Railways also seek to establish explicit processes for decision-making regard-ing various activities to be undertaken to keep the track infrastructure in satisfactory condition or within desirable (required) condition/operational limits. Jovanovic [19] pro-posed a track maintenance management system where the Track Quality Index (TQI) is one of the conditions to be met, to apply maintenance resource more effectively. The Track Expert Group of UIC reveals in the report “Future of railway monitoring in Europe” [27] an increasing vehicle-based measuring systems rather than trackside or manual that will enable comparison and trend identification, lead-ing to deeper understanding of asset behaviour: “This can help optimise maintenance strategy”.
Track quality is traditionally quantified with a special-ized-on-moving measuring car that measures track geomet-ric basic parameters. Usually, the inspection car measures and records the variation of the track gage, vertical and lat-eral alignments and cross-level (angular variation on a track
Abstract Track geometry locations that exceed geom-etry-standardized limits do not necessarily cause poor vehicle performance. However, there are locations under geometric limits that promote unsafe dynamic vehicle performance. To handle this dichotomy, a new method for track inspection is proposed to complement the traditional ones. An inertial measuring system and a specialized data treatment method is presented to evaluate the railway track quality, observed from the vehicle dynamic performance point of view. With inertial devices the system measures the vehicle dynamic movements during transit along an irregular track. Values measured are used in an inertial navigation algorithm with a Kalman filter, to identify the full vehicle attitude, including angular positions and accel-erations. System equations for the inverse vehicle dynamic problem, augmented with the suspension torsion equation, is solved to directly estimate the wheels driving forces that are directly correlated with the vehicle safety. An adi-mensional Safety Index (SI) is proposed to evaluate track quality. Values obtained are used to quantify track harm-ful locations. Results of two test campaign travelling on the irregular track in a conventional train identify the full vehicle attitude and movement. The SI and the location of the most potential hazard region for track maintenance purposes were identified. Good correlation between SI and measured track geometry is observed being a promising technique.
* Roberto Spinola Barbosa [email protected]
1 Depto. Eng. Mecânica, POLI - USP, Escola Politécnica da Universidade de São Paulo, São Paulo, SP 05508-900, Brazil
J Braz. Soc. Mech. Sci. Eng.
1 3
section—cant or super elevation). Additionally, the cross-level variation per meter (track twist) can be calculated depending on the data sample rate. Some systems also use the three-point middle-chord technique as a device for par-ticular measurement [14]. Values recorded are confronted with standard recommended limits and harmful regions are identified for maintenance planning. These measuring tech-niques are focused on measuring the track geometry and local irregularities and compare values to normalize lim-its. The average geometric variation associated with track quality is also used for track classification purposes (e.g. [13] or [9]). To assess track geometry quality, Li et al. [23] use the dynamic track–vehicle simulations on the spec-tra wave-length irregularity spectral domain to access the track–vehicle dynamic and indicate the use of second-order derivatives of track vertical irregularity for assessing track geometry quality [24].
Most of the track measuring systems identify only the track geometry variation within short wavelength identifi-cation (3–25 m, [16]). Also these systems do not deform the track during the measuring process. Therefore, the real deformed track geometry with the vehicle fully loaded is not recovered. An initiative to overcome these restrictions is the Track Machine Guidance project (TMG) developed by the UIC committee. For this purpose, requirements for a real-time machine guiding system were established based on absolute references and co-ordinate-based definition of the track geometry, using satellite positioning. The pri-mary benefit is cost reduction for measurements absolute positioning, levelling, lining and tamping of the tracks [11]. Another complementary technique employed is the Ground Penetrating Radar (GPR) to evaluate the track substructure.
In addition to the well-known geometric measuring methods, researches related to the vehicle response char-acterization, when travelling over the track irregulari-ties, are observed. Correlation metrics between the track roughness characteristic and the dynamic vehicle behav-iour is the key for these methods. Several researchers [22, 28] discuss the detection of rail track irregularities, based on the measurements of the bearing box vertical accel-eration during the operation of rail vehicles. Wilson and Ketchum [32] develop a performance-based track geom-etry (PBTG), an inspection method based on an acceler-ometer installed on a conventional track geometry inspec-tion vehicle. The method calculates the vehicle behaviour in real-time based on the measured track geometry input. Kawazaki and Youcef-Toumi [20], Czop et al. [6], Sun et al. [29] and Tsunashima et al. [30] proposed a procedure-based system identification technique that solves an inverse dynamic problem, estimating track irregularities from the measured acceleration applied to the vehicle model of the frequency domain. English and Moynihan [8] also used a real-time processing inverse wagon linear model excited
with measured track frequency content to predict wheel–rail contact forces.
An instrumented iron-ore wagon was proposed by Darby et al. [7] to measure the suspension spring deflection, lat-eral side frame acceleration, brake pipe pressure, inter-car separation, longitudinal wagon acceleration; coupler force and structural stress. Despite using various sensors, it is essentially a simple captive system, based only on meas-urements of deflection and some particular accelerations of a wagon to indirectly evaluate the track quality.
The use of instrumented wheel-set is another method to evaluate the effect caused by the track irregularity over the vehicle behaviour in traffic. In spite of being an expensive and laborious instrument, the quantification of the wheel-rail contact force ratio is an indication of track quality [15] and, therefore, the vehicle safety. Also portable accelerom-eters are employed for passenger comfort measurements [2] based on the ISO-2631 and UIC-513 Standards.
Inertial measurement devices (IMU) are new technolo-gies developed in the aerospace industry with widespread application in military equipment. These devices are now available in the automotive industry and are particularly used in automotive control systems. Examples of use of this new technology can be found in Feldmann et al. [12] who propose to detect the vertical track settlement and deterioration using frequency domain transformation from the inertial measurements of the vehicle behaviour. Weston et al. [31] uses rate gyros and lateral acceleration for track curvature and alignment monitoring. Xia et al. [33] used an inverse vehicle model to estimate high-frequency wheel–rail contact forces from measurements of sensors installed in a track-recording car. One can observe in the temporal results, the difficulty of vehicle dynamics correlation with the wheel forces due to high-frequency movements of the body with reduced weight (e.g. wheelset, side frame, etc.). However. at low frequencies vehicle mass has predomi-nance over the system movements and can be used for a particular application, which is the object of this work. Hung et al. [18] report that peak threshold of the pitch angular rate and the integral threshold of the roll angular rate of the vehicle truck frame are closely related to vehicle unsafe conditions. Heirich et al. [17] use an inertial device in the vehicle to infer the track features such as bank, bank change, slope, slope change, relative heading, curva-ture and basic track elements. Luber et al. [25] propose a method for track geometry assessment taking into account the vehicle/track interaction. The method is supported with vehicle vertical and lateral transfer function used for the prediction of the vehicle reaction forces. The results show a significant enhancement of the correlation between the track assessment quantities and the vehicle reaction forces. Although use of transfer function related to the parameters of the track (Track Geometry Assessment TGA [10, 16]) is
J Braz. Soc. Mech. Sci. Eng.
1 3
restricted to only two translational directions (vertical and lateral) and a wavelength range of 3–25 m, and not include rotational aspects. These aspects reinforce the need to broaden the spectrum of evaluation that is the proposal here presented.
Track geometry should be designed to meet the require-ments of the fleet of car or wagons that uses it. During its service life, a perfect track develops irregularities that cause vehicle oscillation. In the extreme case, the vehi-cle can lose its guidance. Defects and failure of the track superstructure and vehicle dynamic performance may be mixed and cause these undesirable derailment events [11]. Focusing on the track geometry defects, structural elastic-ity, vehicle suspension characteristics and train speed, all these are potential possible contribution causes and should therefore be evaluated together to minimize hazard risk improving safe traffic.
Conversely, track geometry locations that exceed the standardized limits often do not cause obligatory poor vehi-cle performance. On the contrary there are good track loca-tions under geometric limits that promote unsafe dynamic vehicle performance [21]. Additionally track stiffness does affect the passing vehicle dynamic. The larger the irregu-larities, the stronger the dynamic interaction effects. This process is auto propelled and increases the track defects at each passing vehicle. Additionally, depending on the train speed, a particular track roughness wavelength excites the vehicle modal resonance that substantially magnifies the dynamic effect. Safety is a complex phenomenon and depends simultaneously on the vehicle dynamic character-istics and on the track system response and geometry. To optimise track maintenance, would be of interest to include vehicle performance on the track evaluation method. It would be of interest to also identify the problems as they arise rather than waiting for the scheduled inspection campaign.
To handle this subject a new method for track inspection is proposed to complement the traditional ones. Track irreg-ularities excite vehicle vibrations main modes and produce translational and angular movements. Wheel/rail contact forces that support the vehicle vertical load and produce the lateral directioning guiding forces cause these move-ments. The guiding forces are directly related to the vehi-cle accelerations. Hence, the results of the vehicle dynamic behaviour can be employed to evaluate the track geometry adequacy. Complementarily to the traditional measuring method, the vehicle dynamic performance can be used to identify the potential place of low safety on the track. The evaluation of these results can be used as metrics to priori-tise location of maintenance on the already measured track geometry. This methodology can even more optimise main-tenance intervention and improve the vehicle traffic safety.
2 Methodology
The methodology adopted to quantify track quality is to identify where it is more aggressive to vehicle safety. The specific circumstance for this scenario is three general types of vehicle unsafe conditions. The first condition is the wheel-climb derailment at a low speed on sharp curves. Another such condition is related to vehicle main body large movements. The latter condition is relative to a spe-cific speed and a particular type of track irregularities.
The first condition is mainly related with vehicle suspen-sion stiffness and load distribution. The second is related with the vehicle unsprung mass dynamic movements and directioning bogie/wheelset properties. The third is related to the track evenness wavelength, the vehicle natural fre-quencies and train speed [4]. Although there are other types of unsafe conditions, including the accidental and com-ponent failure ones, those described here are only related to the vehicle body low frequency movements and small energy dissipation.
The new methodology proposed and presented here is based on detection of signs of unsafe railway vehicle per-formance, mainly related to the second and third described types, when travelling on the track evenness. These signs are used to identify the location along the track and pri-oritise the pertinent track geometry correction in the most harmful irregularity to the vehicle safety.
For this purpose, the metric adopted to identify the potential harmful location is associated with the vehicle safety. This adimensional index is directly correlated to the traditional ratio between the wheel lateral (L) and vertical (V) contact force. The wheel forces are quantified from the measurement of the vehicle attitude and its overall dynamic behaviour. Using an inertial measuring device (IMU) with ten high-resolution transducers and a GPS signal, the Safety Index (SI) can be directly estimated from the wheel driving forces. This task is performed with an inverse vehi-cle dynamic model, fed with data acquired from complete vehicle instrumentation, during the transit journey and an inertial navigation algorithm (INS) for attitude recognition.
3 Vehicle dynamics
The wheel-rail contact force, due to the vehicle dynamic behaviour, is a function of the track roughness where the vehicle is travelling above. To identify the acting contact forces that produce the vehicle directioning movements, it is necessary to solve an inverse dynamic problem. The vehi-cle dynamics is governed by a set of differential equations obtained from the Newton–Euler theorems applied to the car body (considered as a rigid body) valid for a fixed reference
J Braz. Soc. Mech. Sci. Eng.
1 3
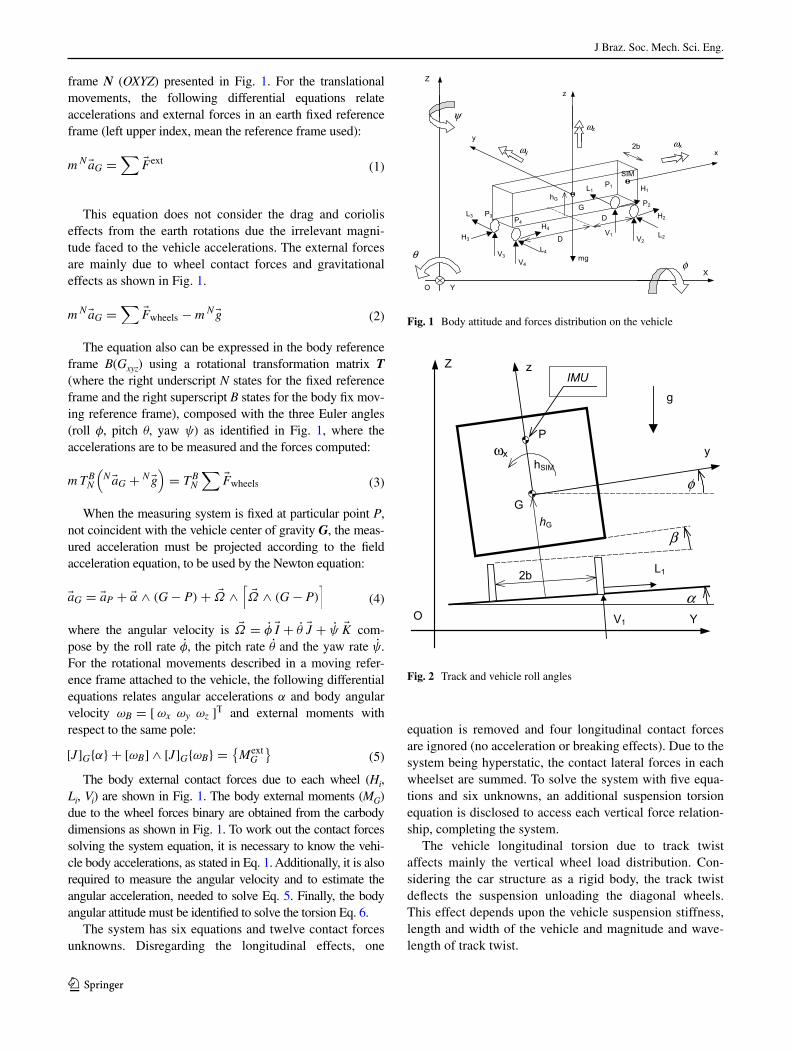
frame N (OXYZ) presented in Fig. 1. For the translational movements, the following differential equations relate accelerations and external forces in an earth fixed reference frame (left upper index, mean the reference frame used):
This equation does not consider the drag and coriolis
effects from the earth rotations due the irrelevant magni-tude faced to the vehicle accelerations. The external forces are mainly due to wheel contact forces and gravitational effects as shown in Fig. 1.
The equation also can be expressed in the body reference frame B(Gxyz) using a rotational transformation matrix T (where the right underscript N states for the fixed reference frame and the right superscript B states for the body fix mov-ing reference frame), composed with the three Euler angles (roll φ, pitch θ, yaw ψ) as identified in Fig. 1, where the accelerations are to be measured and the forces computed:
When the measuring system is fixed at particular point P, not coincident with the vehicle center of gravity G, the meas-ured acceleration must be projected according to the field acceleration equation, to be used by the Newton equation:
where the angular velocity is Ω = φ I + θ J + ψ K com-pose by the roll rate φ, the pitch rate θ and the yaw rate ψ. For the rotational movements described in a moving refer-ence frame attached to the vehicle, the following differential equations relates angular accelerations α and body angular velocity ωB = [ ωx ωy ωz ]
T and external moments with respect to the same pole:
The body external contact forces due to each wheel (Hi, Li, Vi) are shown in Fig. 1. The body external moments (MG) due to the wheel forces binary are obtained from the carbody dimensions as shown in Fig. 1. To work out the contact forces solving the system equation, it is necessary to know the vehi-cle body accelerations, as stated in Eq. 1. Additionally, it is also required to measure the angular velocity and to estimate the angular acceleration, needed to solve Eq. 5. Finally, the body angular attitude must be identified to solve the torsion Eq. 6.
The system has six equations and twelve contact forces unknowns. Disregarding the longitudinal effects, one
(1)mN aG =∑
Fext
(2)mN aG =∑
Fwheels − mN g
(3)mTBN
(
N aG + N g)
= TBN
∑
Fwheels
(4)aG = aP + α ∧ (G− P)+ Ω ∧[
Ω ∧ (G− P)]
(5)[J]Gα + [ωB] ∧ [J]GωB =
MextG
equation is removed and four longitudinal contact forces are ignored (no acceleration or breaking effects). Due to the system being hyperstatic, the contact lateral forces in each wheelset are summed. To solve the system with five equa-tions and six unknowns, an additional suspension torsion equation is disclosed to access each vertical force relation-ship, completing the system.
The vehicle longitudinal torsion due to track twist affects mainly the vertical wheel load distribution. Con-sidering the car structure as a rigid body, the track twist deflects the suspension unloading the diagonal wheels. This effect depends upon the vehicle suspension stiffness, length and width of the vehicle and magnitude and wave-length of track twist.
G
X
Z
Y
ωzy
x
z
ωxωy
D
D
2b
P1
P2
P3P4
hG
mg
V2L2
H2
V1
L1 H1
V4
L4
H4
V3
L3
H3
SIM
φ
ψ
θ
O
Fig. 1 Body attitude and forces distribution on the vehicle
G
Y
Z
O
y
z
V1
L1
ωx
2b
hG
g
IMU
hSIM
α
φ
P
β
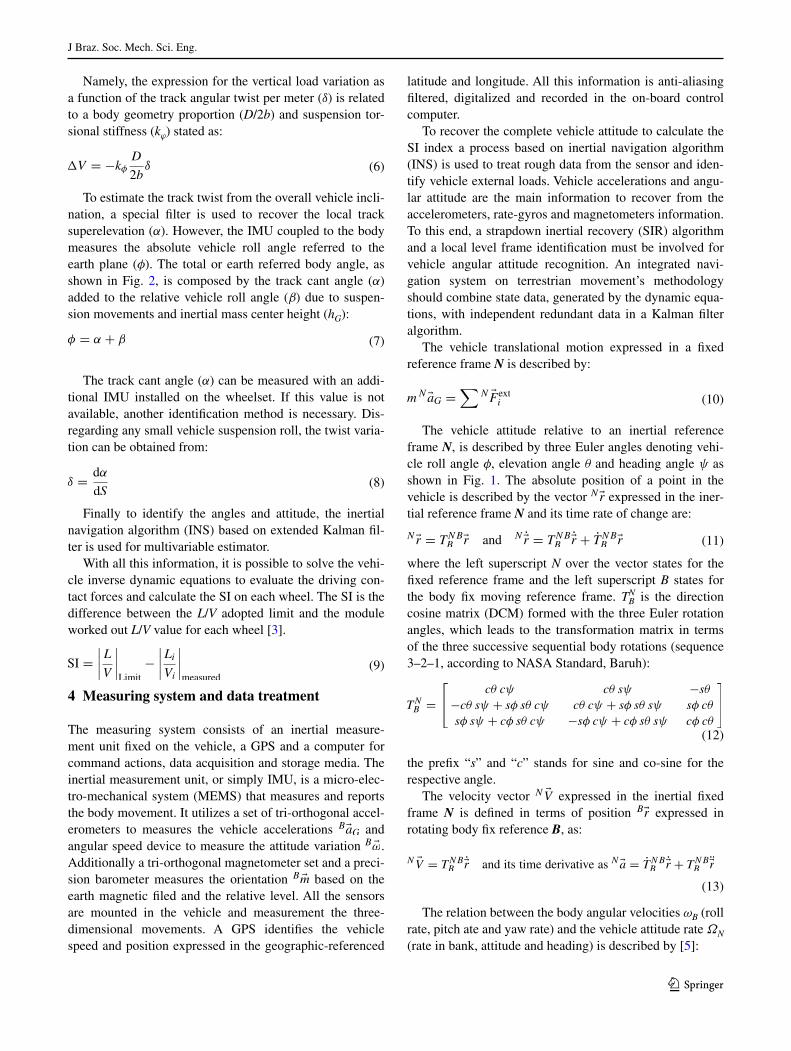
Fig. 2 Track and vehicle roll angles
J Braz. Soc. Mech. Sci. Eng.
1 3
Namely, the expression for the vertical load variation as a function of the track angular twist per meter (δ) is related to a body geometry proportion (D/2b) and suspension tor-sional stiffness (kϕ) stated as:
To estimate the track twist from the overall vehicle incli-nation, a special filter is used to recover the local track superelevation (α). However, the IMU coupled to the body measures the absolute vehicle roll angle referred to the earth plane (φ). The total or earth referred body angle, as shown in Fig. 2, is composed by the track cant angle (α) added to the relative vehicle roll angle (β) due to suspen-sion movements and inertial mass center height (hG):
The track cant angle (α) can be measured with an addi-tional IMU installed on the wheelset. If this value is not available, another identification method is necessary. Dis-regarding any small vehicle suspension roll, the twist varia-tion can be obtained from:
Finally to identify the angles and attitude, the inertial navigation algorithm (INS) based on extended Kalman fil-ter is used for multivariable estimator.
With all this information, it is possible to solve the vehi-cle inverse dynamic equations to evaluate the driving con-tact forces and calculate the SI on each wheel. The SI is the difference between the L/V adopted limit and the module worked out L/V value for each wheel [3].
4 Measuring system and data treatment
The measuring system consists of an inertial measure-ment unit fixed on the vehicle, a GPS and a computer for command actions, data acquisition and storage media. The inertial measurement unit, or simply IMU, is a micro-elec-tro-mechanical system (MEMS) that measures and reports the body movement. It utilizes a set of tri-orthogonal accel-erometers to measures the vehicle accelerations BaG and angular speed device to measure the attitude variation B ω . Additionally a tri-orthogonal magnetometer set and a preci-sion barometer measures the orientation B m based on the earth magnetic filed and the relative level. All the sensors are mounted in the vehicle and measurement the three-dimensional movements. A GPS identifies the vehicle speed and position expressed in the geographic-referenced
(6)V = −kφD
2bδ
(7)φ = α + β
(8)δ =dα
dS
(9)SI =
∣
∣
∣
∣
L
V
∣
∣
∣
∣
Limit
−
∣
∣
∣
∣
Li
Vi
∣
∣
∣
∣
measured
latitude and longitude. All this information is anti-aliasing filtered, digitalized and recorded in the on-board control computer.
To recover the complete vehicle attitude to calculate the SI index a process based on inertial navigation algorithm (INS) is used to treat rough data from the sensor and iden-tify vehicle external loads. Vehicle accelerations and angu-lar attitude are the main information to recover from the accelerometers, rate-gyros and magnetometers information. To this end, a strapdown inertial recovery (SIR) algorithm and a local level frame identification must be involved for vehicle angular attitude recognition. An integrated navi-gation system on terrestrian movement’s methodology should combine state data, generated by the dynamic equa-tions, with independent redundant data in a Kalman filter algorithm.
The vehicle translational motion expressed in a fixed reference frame N is described by:
The vehicle attitude relative to an inertial reference frame N, is described by three Euler angles denoting vehi-cle roll angle φ, elevation angle θ and heading angle ψ as shown in Fig. 1. The absolute position of a point in the vehicle is described by the vector Nr expressed in the iner-tial reference frame N and its time rate of change are:
where the left superscript N over the vector states for the fixed reference frame and the left superscript B states for the body fix moving reference frame. TB
N is the direction cosine matrix (DCM) formed with the three Euler rotation angles, which leads to the transformation matrix in terms of the three successive sequential body rotations (sequence 3–2–1, according to NASA Standard, Baruh):
the prefix “s” and “c” stands for sine and co-sine for the respective angle.
The velocity vector N V expressed in the inertial fixed frame N is defined in terms of position Br expressed in rotating body fix reference B, as:
The relation between the body angular velocities ωB (roll rate, pitch ate and yaw rate) and the vehicle attitude rate ΩN (rate in bank, attitude and heading) is described by [5]:
(10)mN aG =∑
N Fexti
(11)Nr = TNBBr and N r = TN
BBr + TN
BBr
(12)
TN
B=
cθ cψ cθ sψ −sθ
−cθ sψ + sφ sθ cψ cθ cψ + sφ sθ sψ sφ cθ
sφ sψ + cφ sθ cψ −sφ cψ + cφ sθ sψ cφ cθ
(13)
N V = TN
B
Br and its time derivative as N a = TN
B
Br + TN
B
Br
J Braz. Soc. Mech. Sci. Eng.
1 3
and the time rate of change of the transformation matrix TBN
is:
where ωi are the three angular speeds components described in the skew symmetric rotating matrix expressed on the body reference frame.
The problem of attitude determination involves deter-mining the transformation matrix that maps the on-board sensed information with model transformation to the geo-graphic frame magnetic and gravity field components. For the body-referenced magnetic sensor to match the local geographic-referenced magnetic field, and for the body-referenced accelerometer sensor to match the local geo-graphic-referenced acceleration then:
Assuming these two vectors are not parallel, a third orthogonal vector can be produced by the cross product. The matrix formed using these three vectors as columns (superscript T over the vector states for transposed vector) can be associated to:
The matrix on the left-hand side is composed by known geographic-referenced information. The matrix on the right-hand side is composed by sensed information. There-fore, the unknown DCM orthogonal matrix can be obtained from:
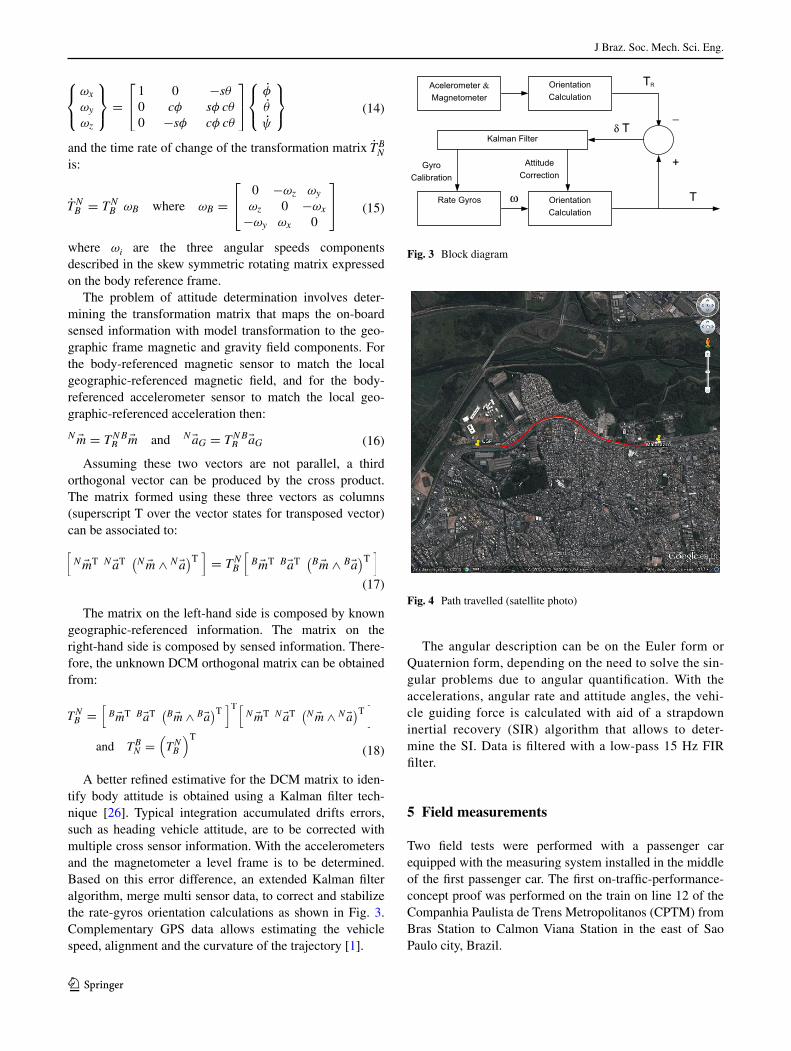
A better refined estimative for the DCM matrix to iden-tify body attitude is obtained using a Kalman filter tech-nique [26]. Typical integration accumulated drifts errors, such as heading vehicle attitude, are to be corrected with multiple cross sensor information. With the accelerometers and the magnetometer a level frame is to be determined. Based on this error difference, an extended Kalman filter algorithm, merge multi sensor data, to correct and stabilize the rate-gyros orientation calculations as shown in Fig. 3. Complementary GPS data allows estimating the vehicle speed, alignment and the curvature of the trajectory [1].
(14)
ωx
ωy
ωz
=
1 0 −sθ
0 cφ sφ cθ
0 −sφ cφ cθ
φ
θ
ψ
(15)TNB = TN
B ωB where ωB =
0 −ωz ωy
ωz 0 −ωx
−ωy ωx 0
(16)N m = TNBB m and N aG = TN
BBaG
(17)
[
N mT N aT(
N m ∧ N a)T
]
= TNB
[
B mT BaT(
B m ∧ Ba)T
]
(18)
TN
B=
[
B mT BaT(
B m ∧ Ba)T
]T[
N mT N aT(
N m ∧ N a)T
]
and TB
N=
(
TN
B
)T
The angular description can be on the Euler form or Quaternion form, depending on the need to solve the sin-gular problems due to angular quantification. With the accelerations, angular rate and attitude angles, the vehi-cle guiding force is calculated with aid of a strapdown inertial recovery (SIR) algorithm that allows to deter-mine the SI. Data is filtered with a low-pass 15 Hz FIR filter.
5 Field measurements
Two field tests were performed with a passenger car equipped with the measuring system installed in the middle of the first passenger car. The first on-traffic-performance-concept proof was performed on the train on line 12 of the Companhia Paulista de Trens Metropolitanos (CPTM) from Bras Station to Calmon Viana Station in the east of Sao Paulo city, Brazil.
Acelerometer &Magnetometer
Orientation Calculation
Rate Gyros Orientation Calculation
Kalman Filter
−
T
TR
+
δ T
Attitude Correction
Gyro Calibration
ω
Fig. 3 Block diagram
Fig. 4 Path travelled (satellite photo)
J Braz. Soc. Mech. Sci. Eng.
1 3
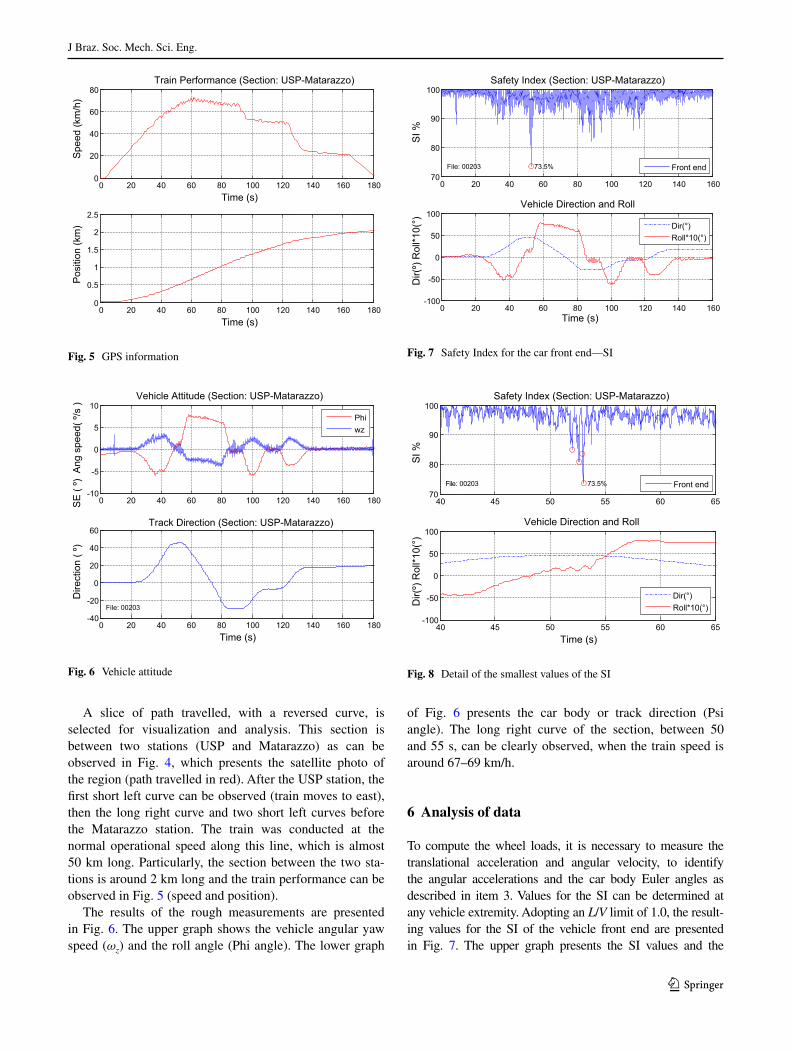
A slice of path travelled, with a reversed curve, is selected for visualization and analysis. This section is between two stations (USP and Matarazzo) as can be observed in Fig. 4, which presents the satellite photo of the region (path travelled in red). After the USP station, the first short left curve can be observed (train moves to east), then the long right curve and two short left curves before the Matarazzo station. The train was conducted at the normal operational speed along this line, which is almost 50 km long. Particularly, the section between the two sta-tions is around 2 km long and the train performance can be observed in Fig. 5 (speed and position).
The results of the rough measurements are presented in Fig. 6. The upper graph shows the vehicle angular yaw speed (ωz) and the roll angle (Phi angle). The lower graph
of Fig. 6 presents the car body or track direction (Psi angle). The long right curve of the section, between 50 and 55 s, can be clearly observed, when the train speed is around 67–69 km/h.
6 Analysis of data
To compute the wheel loads, it is necessary to measure the translational acceleration and angular velocity, to identify the angular accelerations and the car body Euler angles as described in item 3. Values for the SI can be determined at any vehicle extremity. Adopting an L/V limit of 1.0, the result-ing values for the SI of the vehicle front end are presented in Fig. 7. The upper graph presents the SI values and the
0 20 40 60 80 100 120 140 160 1800
20
40
60
80Train Performance (Section: USP-Matarazzo)
Time (s)
Spe
ed (k
m/h
)
0 20 40 60 80 100 120 140 160 1800
0.5
1
1.5
2
2.5
Time (s)
Pos
ition
(km
)
Fig. 5 GPS information
0 20 40 60 80 100 120 140 160 180-10
-5
0
5
10Vehicle Attitude (Section: USP-Matarazzo)
SE
( º)
Ang
spe
ed( º
/s )
Phiwz
0 20 40 60 80 100 120 140 160 180-40
-20
0
20
40
60
Time (s)
Dire
ctio
n ( º
)
Track Direction (Section: USP-Matarazzo)
File: 00203
Fig. 6 Vehicle attitude
0 20 40 60 80 100 120 140 16070
80
90
100Safety Index (Section: USP-Matarazzo)
SI %
File: 00203 73.5% Front end
0 20 40 60 80 100 120 140 160-100
-50
0
50
100
Dir(
º) R
oll*1
0(°)
Time (s)
Vehicle Direction and Roll
Dir(°)Roll*10(°)
Fig. 7 Safety Index for the car front end—SI
40 45 50 55 60 6570
80
90
100Safety Index (Section: USP-Matarazzo)
SI %
%5.3730200:eliF Front end
40 45 50 55 60 65-100
-50
0
50
100
Dir(
º) R
oll*1
0(°)
Time (s)
Vehicle Direction and Roll
Dir(°)Roll*10(°)
Fig. 8 Detail of the smallest values of the SI
J Braz. Soc. Mech. Sci. Eng.
1 3
lower graph, the vehicle movements. Reduced SI values are observed in the first reversed curves before the long right turn.
Figure 8 presents a closed look of the most critical region. The upper graph presents the SI and the extreme values are identified (red circles). As can be seen, the smallest SI value is 73.47 % at time 53.03 s, probably due to track twist in the straight track between the first reversed curves that promote roll movement oscillations of the car body. Other large values are observed next to 52.95; 52.63 and 52.00 s (SI values of 83, 7, 80.9 and 84.9 % respec-tively). This method point out exactly the place of reduced safety of the track, from the vehicle point of view and rein-forces the recommendation for track maintenance on the geometric and irregularity properties in this location.
The exact location of the critical region is: Latitude: −23.484347° (23°29′3.65″S); Longitude: −46.496272° (46°29′46.58″O); Altitude: 737.949 m; Speed: 68.0 km/h; Heading: 43.45°; Time: 2013-02-20 T12:20:30Z (minus 3 h in this country).
The second test was performed at line 11 from Luz Sta-tion at Sao Paulo center to Guaianazes Station also on the east bound of the city. On this evaluation results measured were compared to the real track geometry measurements performed with a specialized car (EM-100 from Plasser).
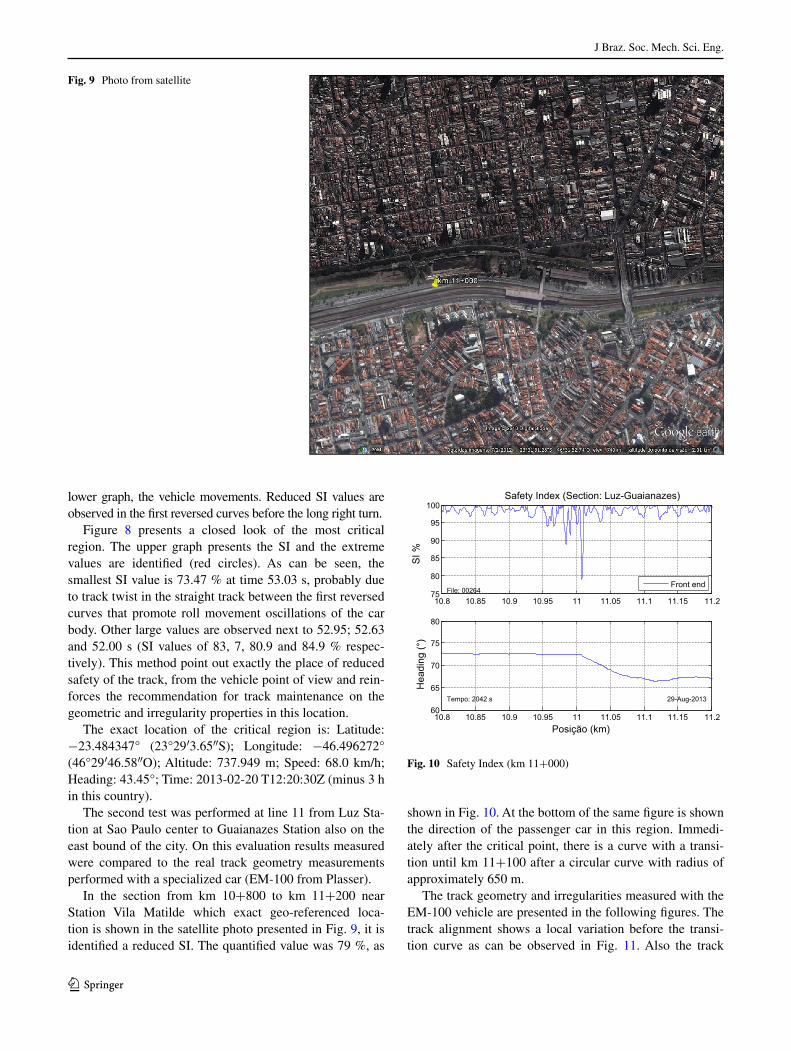
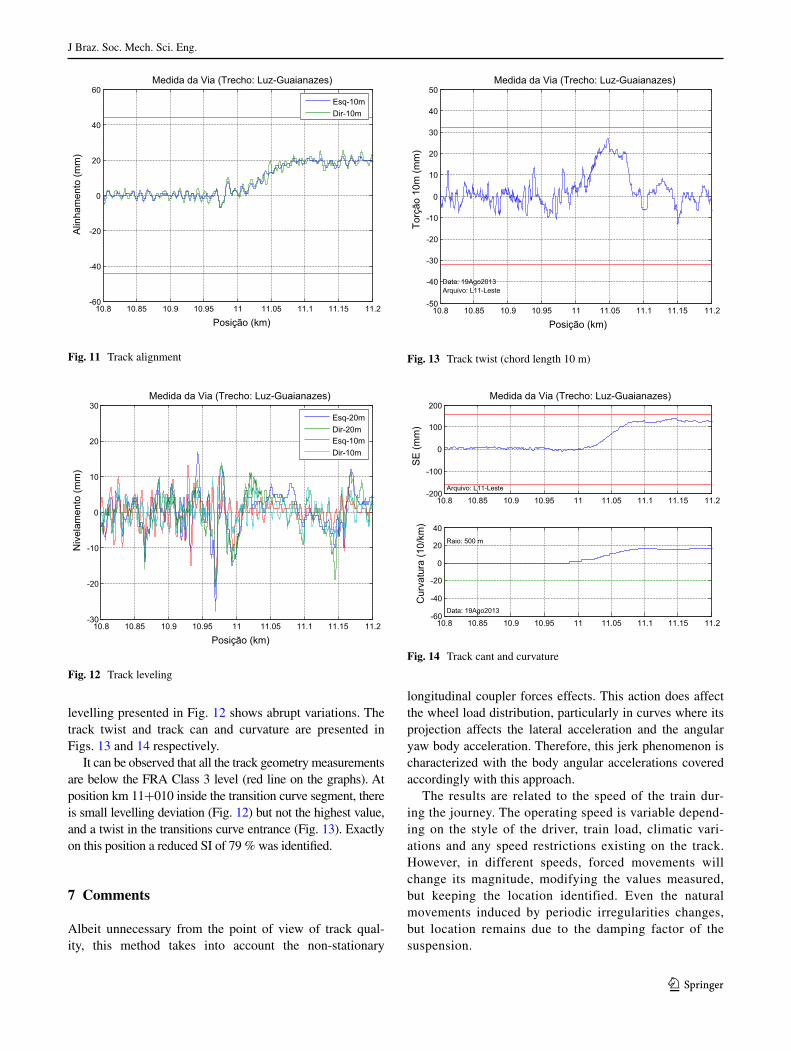
In the section from km 10+800 to km 11+200 near Station Vila Matilde which exact geo-referenced loca-tion is shown in the satellite photo presented in Fig. 9, it is identified a reduced SI. The quantified value was 79 %, as
shown in Fig. 10. At the bottom of the same figure is shown the direction of the passenger car in this region. Immedi-ately after the critical point, there is a curve with a transi-tion until km 11+100 after a circular curve with radius of approximately 650 m.
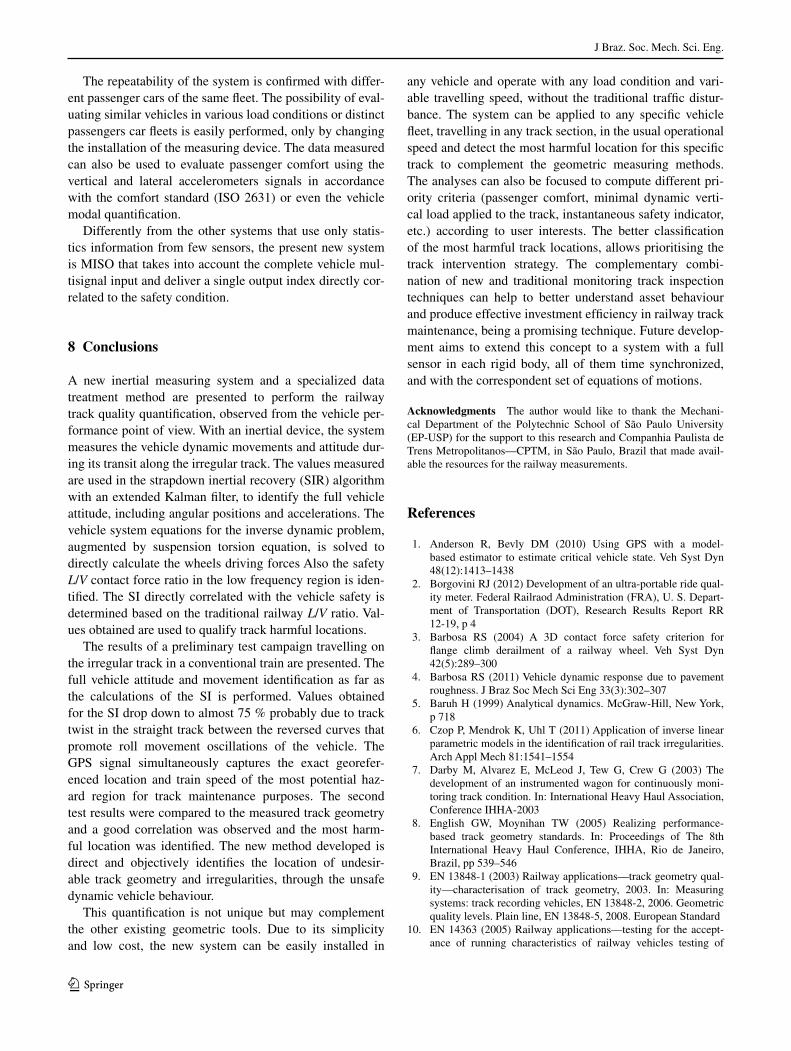
The track geometry and irregularities measured with the EM-100 vehicle are presented in the following figures. The track alignment shows a local variation before the transi-tion curve as can be observed in Fig. 11. Also the track
Fig. 9 Photo from satellite
10.8 10.85 10.9 10.95 11 11.05 11.1 11.15 11.275
80
85
90
95
100Safety Index (Section: Luz-Guaianazes)
SI %
File: 00264Front end
10.8 10.85 10.9 10.95 11 11.05 11.1 11.15 11.260
65
70
75
80
Posição (km)
Hea
ding
(°)
29-Aug-2013 Tempo: 2042 s
Fig. 10 Safety Index (km 11+000)
J Braz. Soc. Mech. Sci. Eng.
1 3
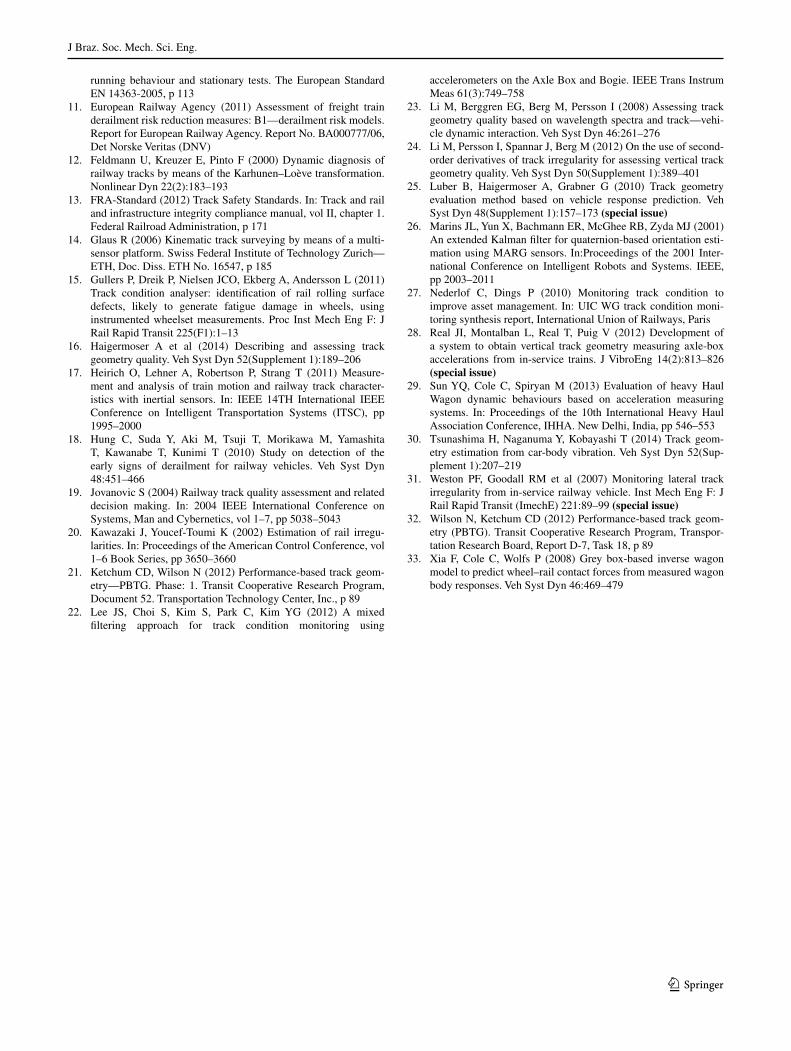
levelling presented in Fig. 12 shows abrupt variations. The track twist and track can and curvature are presented in Figs. 13 and 14 respectively.
It can be observed that all the track geometry measurements are below the FRA Class 3 level (red line on the graphs). At position km 11+010 inside the transition curve segment, there is small levelling deviation (Fig. 12) but not the highest value, and a twist in the transitions curve entrance (Fig. 13). Exactly on this position a reduced SI of 79 % was identified.
7 Comments
Albeit unnecessary from the point of view of track qual-ity, this method takes into account the non-stationary
longitudinal coupler forces effects. This action does affect the wheel load distribution, particularly in curves where its projection affects the lateral acceleration and the angular yaw body acceleration. Therefore, this jerk phenomenon is characterized with the body angular accelerations covered accordingly with this approach.
The results are related to the speed of the train dur-ing the journey. The operating speed is variable depend-ing on the style of the driver, train load, climatic vari-ations and any speed restrictions existing on the track. However, in different speeds, forced movements will change its magnitude, modifying the values measured, but keeping the location identified. Even the natural movements induced by periodic irregularities changes, but location remains due to the damping factor of the suspension.
10.8 10.85 10.9 10.95 11 11.05 11.1 11.15 11.2-60
-40
-20
0
20
40
60Medida da Via (Trecho: Luz-Guaianazes)
Posição (km)
Alin
ham
ento
(mm
)
Esq-10mDir-10m
Fig. 11 Track alignment
10.8 10.85 10.9 10.95 11 11.05 11.1 11.15 11.2-30
-20
-10
0
10
20
30Medida da Via (Trecho: Luz-Guaianazes)
Posição (km)
Niv
elam
ento
(mm
)
Esq-20mDir-20mEsq-10mDir-10m
Fig. 12 Track leveling
10.8 10.85 10.9 10.95 11 11.05 11.1 11.15 11.2-50
-40
-30
-20
-10
0
10
20
30
40
50Medida da Via (Trecho: Luz-Guaianazes)
Posição (km)
Torç
ão 1
0m (m
m)
Arquivo: L11-LesteData: 19Ago2013
Fig. 13 Track twist (chord length 10 m)
10.8 10.85 10.9 10.95 11 11.05 11.1 11.15 11.2-200
-100
0
100
200Medida da Via (Trecho: Luz-Guaianazes)
SE
(mm
)
Arquivo: L11-Leste
10.8 10.85 10.9 10.95 11 11.05 11.1 11.15 11.2-60
-40
-20
0
20
40
Cur
vatu
ra (1
0/km
)
Data: 19Ago2013
Raio: 500 m
Fig. 14 Track cant and curvature
J Braz. Soc. Mech. Sci. Eng.
1 3
The repeatability of the system is confirmed with differ-ent passenger cars of the same fleet. The possibility of eval-uating similar vehicles in various load conditions or distinct passengers car fleets is easily performed, only by changing the installation of the measuring device. The data measured can also be used to evaluate passenger comfort using the vertical and lateral accelerometers signals in accordance with the comfort standard (ISO 2631) or even the vehicle modal quantification.
Differently from the other systems that use only statis-tics information from few sensors, the present new system is MISO that takes into account the complete vehicle mul-tisignal input and deliver a single output index directly cor-related to the safety condition.
8 Conclusions
A new inertial measuring system and a specialized data treatment method are presented to perform the railway track quality quantification, observed from the vehicle per-formance point of view. With an inertial device, the system measures the vehicle dynamic movements and attitude dur-ing its transit along the irregular track. The values measured are used in the strapdown inertial recovery (SIR) algorithm with an extended Kalman filter, to identify the full vehicle attitude, including angular positions and accelerations. The vehicle system equations for the inverse dynamic problem, augmented by suspension torsion equation, is solved to directly calculate the wheels driving forces Also the safety L/V contact force ratio in the low frequency region is iden-tified. The SI directly correlated with the vehicle safety is determined based on the traditional railway L/V ratio. Val-ues obtained are used to qualify track harmful locations.
The results of a preliminary test campaign travelling on the irregular track in a conventional train are presented. The full vehicle attitude and movement identification as far as the calculations of the SI is performed. Values obtained for the SI drop down to almost 75 % probably due to track twist in the straight track between the reversed curves that promote roll movement oscillations of the vehicle. The GPS signal simultaneously captures the exact georefer-enced location and train speed of the most potential haz-ard region for track maintenance purposes. The second test results were compared to the measured track geometry and a good correlation was observed and the most harm-ful location was identified. The new method developed is direct and objectively identifies the location of undesir-able track geometry and irregularities, through the unsafe dynamic vehicle behaviour.
This quantification is not unique but may complement the other existing geometric tools. Due to its simplicity and low cost, the new system can be easily installed in
any vehicle and operate with any load condition and vari-able travelling speed, without the traditional traffic distur-bance. The system can be applied to any specific vehicle fleet, travelling in any track section, in the usual operational speed and detect the most harmful location for this specific track to complement the geometric measuring methods. The analyses can also be focused to compute different pri-ority criteria (passenger comfort, minimal dynamic verti-cal load applied to the track, instantaneous safety indicator, etc.) according to user interests. The better classification of the most harmful track locations, allows prioritising the track intervention strategy. The complementary combi-nation of new and traditional monitoring track inspection techniques can help to better understand asset behaviour and produce effective investment efficiency in railway track maintenance, being a promising technique. Future develop-ment aims to extend this concept to a system with a full sensor in each rigid body, all of them time synchronized, and with the correspondent set of equations of motions.
Acknowledgments The author would like to thank the Mechani-cal Department of the Polytechnic School of São Paulo University (EP-USP) for the support to this research and Companhia Paulista de Trens Metropolitanos—CPTM, in São Paulo, Brazil that made avail-able the resources for the railway measurements.
References
1. Anderson R, Bevly DM (2010) Using GPS with a model-based estimator to estimate critical vehicle state. Veh Syst Dyn 48(12):1413–1438
2. Borgovini RJ (2012) Development of an ultra-portable ride qual-ity meter. Federal Railraod Administration (FRA), U. S. Depart-ment of Transportation (DOT), Research Results Report RR 12-19, p 4
3. Barbosa RS (2004) A 3D contact force safety criterion for flange climb derailment of a railway wheel. Veh Syst Dyn 42(5):289–300
4. Barbosa RS (2011) Vehicle dynamic response due to pavement roughness. J Braz Soc Mech Sci Eng 33(3):302–307
5. Baruh H (1999) Analytical dynamics. McGraw-Hill, New York, p 718
6. Czop P, Mendrok K, Uhl T (2011) Application of inverse linear parametric models in the identification of rail track irregularities. Arch Appl Mech 81:1541–1554
7. Darby M, Alvarez E, McLeod J, Tew G, Crew G (2003) The development of an instrumented wagon for continuously moni-toring track condition. In: International Heavy Haul Association, Conference IHHA-2003
8. English GW, Moynihan TW (2005) Realizing performance-based track geometry standards. In: Proceedings of The 8th International Heavy Haul Conference, IHHA, Rio de Janeiro, Brazil, pp 539–546
9. EN 13848-1 (2003) Railway applications—track geometry qual-ity—characterisation of track geometry, 2003. In: Measuring systems: track recording vehicles, EN 13848-2, 2006. Geometric quality levels. Plain line, EN 13848-5, 2008. European Standard
10. EN 14363 (2005) Railway applications—testing for the accept-ance of running characteristics of railway vehicles testing of
J Braz. Soc. Mech. Sci. Eng.
1 3
running behaviour and stationary tests. The European Standard EN 14363-2005, p 113
11. European Railway Agency (2011) Assessment of freight train derailment risk reduction measures: B1—derailment risk models. Report for European Railway Agency. Report No. BA000777/06, Det Norske Veritas (DNV)
12. Feldmann U, Kreuzer E, Pinto F (2000) Dynamic diagnosis of railway tracks by means of the Karhunen–Loève transformation. Nonlinear Dyn 22(2):183–193
13. FRA-Standard (2012) Track Safety Standards. In: Track and rail and infrastructure integrity compliance manual, vol II, chapter 1. Federal Railroad Administration, p 171
14. Glaus R (2006) Kinematic track surveying by means of a multi-sensor platform. Swiss Federal Institute of Technology Zurich—ETH, Doc. Diss. ETH No. 16547, p 185
15. Gullers P, Dreik P, Nielsen JCO, Ekberg A, Andersson L (2011) Track condition analyser: identification of rail rolling surface defects, likely to generate fatigue damage in wheels, using instrumented wheelset measurements. Proc Inst Mech Eng F: J Rail Rapid Transit 225(F1):1–13
16. Haigermoser A et al (2014) Describing and assessing track geometry quality. Veh Syst Dyn 52(Supplement 1):189–206
17. Heirich O, Lehner A, Robertson P, Strang T (2011) Measure-ment and analysis of train motion and railway track character-istics with inertial sensors. In: IEEE 14TH International IEEE Conference on Intelligent Transportation Systems (ITSC), pp 1995–2000
18. Hung C, Suda Y, Aki M, Tsuji T, Morikawa M, Yamashita T, Kawanabe T, Kunimi T (2010) Study on detection of the early signs of derailment for railway vehicles. Veh Syst Dyn 48:451–466
19. Jovanovic S (2004) Railway track quality assessment and related decision making. In: 2004 IEEE International Conference on Systems, Man and Cybernetics, vol 1–7, pp 5038–5043
20. Kawazaki J, Youcef-Toumi K (2002) Estimation of rail irregu-larities. In: Proceedings of the American Control Conference, vol 1–6 Book Series, pp 3650–3660
21. Ketchum CD, Wilson N (2012) Performance-based track geom-etry—PBTG. Phase: 1. Transit Cooperative Research Program, Document 52. Transportation Technology Center, Inc., p 89
22. Lee JS, Choi S, Kim S, Park C, Kim YG (2012) A mixed filtering approach for track condition monitoring using
accelerometers on the Axle Box and Bogie. IEEE Trans Instrum Meas 61(3):749–758
23. Li M, Berggren EG, Berg M, Persson I (2008) Assessing track geometry quality based on wavelength spectra and track—vehi-cle dynamic interaction. Veh Syst Dyn 46:261–276
24. Li M, Persson I, Spannar J, Berg M (2012) On the use of second-order derivatives of track irregularity for assessing vertical track geometry quality. Veh Syst Dyn 50(Supplement 1):389–401
25. Luber B, Haigermoser A, Grabner G (2010) Track geometry evaluation method based on vehicle response prediction. Veh Syst Dyn 48(Supplement 1):157–173 (special issue)
26. Marins JL, Yun X, Bachmann ER, McGhee RB, Zyda MJ (2001) An extended Kalman filter for quaternion-based orientation esti-mation using MARG sensors. In:Proceedings of the 2001 Inter-national Conference on Intelligent Robots and Systems. IEEE, pp 2003–2011
27. Nederlof C, Dings P (2010) Monitoring track condition to improve asset management. In: UIC WG track condition moni-toring synthesis report, International Union of Railways, Paris
28. Real JI, Montalban L, Real T, Puig V (2012) Development of a system to obtain vertical track geometry measuring axle-box accelerations from in-service trains. J VibroEng 14(2):813–826 (special issue)
29. Sun YQ, Cole C, Spiryan M (2013) Evaluation of heavy Haul Wagon dynamic behaviours based on acceleration measuring systems. In: Proceedings of the 10th International Heavy Haul Association Conference, IHHA. New Delhi, India, pp 546–553
30. Tsunashima H, Naganuma Y, Kobayashi T (2014) Track geom-etry estimation from car-body vibration. Veh Syst Dyn 52(Sup-plement 1):207–219
31. Weston PF, Goodall RM et al (2007) Monitoring lateral track irregularity from in-service railway vehicle. Inst Mech Eng F: J Rail Rapid Transit (ImechE) 221:89–99 (special issue)
32. Wilson N, Ketchum CD (2012) Performance-based track geom-etry (PBTG). Transit Cooperative Research Program, Transpor-tation Research Board, Report D-7, Task 18, p 89
33. Xia F, Cole C, Wolfs P (2008) Grey box-based inverse wagon model to predict wheel–rail contact forces from measured wagon body responses. Veh Syst Dyn 46:469–479