NCTS Industrial Statistics Research Group Seminar Electron Industrial Control Lab Department of...
56
Page 1 of 56 NCTS Industrial Statistics Research Group Seminar Electron Industrial Control Lab Department of Electrical and Control Engineering, NCTU Statistical Process Control Implementation in Semiconductor Manufacturing Tzu-Cheng Lin 林林林 Advanced Control Program/ IIPD/ R&D Taiwan Semiconductor Manufacturing Company, Ltd [email protected], [email protected] March 26, 2010 March 26, 2010
-
date post
22-Dec-2015 -
Category
Documents
-
view
215 -
download
1
Transcript of NCTS Industrial Statistics Research Group Seminar Electron Industrial Control Lab Department of...

Page 1 of 56NCTS Industrial Statistics Research Group Seminar
Electron Industrial Control Lab
Department of Electrical and
Control Engineering, NCTU
Statistical Process Control Implementation
in Semiconductor Manufacturing
Tzu-Cheng Lin 林資程Advanced Control Program/ IIPD/ R&D
Taiwan Semiconductor Manufacturing Company, Ltd
[email protected], [email protected]
March 26, 2010March 26, 2010

Page 2 of 56NCTS Industrial Statistics Research Group Seminar
Electron Industrial Control Lab
Department of Electrical and
Control Engineering, NCTU
1. MVA application: Advanced Bi-Variate Semiconductor Process Control Chart.
2. MVA application: Yield2Equipment Events Mining.
3. PLS application: Virtual Metrology of Deep Trench Chain.
4. Time series application: KSI-Based to Predict Tool Maintenance.
5. Survival application: Advanced Queue-Time to Yield Monitoring System.
6. SPC chart application: Smart Process Capability Trend Monitoring System.
This presentation will cover the following topics:
Agenda:
Leadership in Analytics

Page 3 of 56NCTS Industrial Statistics Research Group Seminar
Electron Industrial Control Lab
Department of Electrical and
Control Engineering, NCTU
Case(1): MVA application Advanced Bi-Variate Semiconductor Process Control Chart.

Page 4 of 56NCTS Industrial Statistics Research Group Seminar
Electron Industrial Control Lab
Department of Electrical and
Control Engineering, NCTU
Advanced Bi-Variate Semiconductor Process Control Chart
Process Variation = (Process Metrology Value) + (Tool Healthy Quality) + (Metrology Tool Calibration)
SPC monitoring system FDC monitoring system MSA calibration scheme
Motivation:
As you know, In Line Process Control is a great important task on semiconductor manufacturing. We usually use the SPC system to monitor the process measurement data, and use the FDC system to monitor the tool healthy index. Although engineers via theses two regular systems, they could check the process is stable or not ?? BUT it is time consuming for engineers, ……..
FDCSPC
Innovative idea !!If we could build up the Bi-Variate Process Control Chart which based on the relationships between In-Line metrology data and FDC tool parameter monitoring data, and provide the Ellipse Control Region to real time tell engineers what’s current status for the latest process capability is stable or not?? In this way, it will give a big hand for engineers not only to monitor the SPC chart , but also to monitor the FDC chart at the same time.

Page 5 of 56NCTS Industrial Statistics Research Group Seminar
Electron Industrial Control Lab
Department of Electrical and
Control Engineering, NCTU
Advanced Bi-Variate Semiconductor Process Control Chart
Innovative idea profile:
(1) The box is showing the process information on this chart. (2) X-axis is the In-Line metrology value (X). (3) Y-axis is the FDC summary value (Y). (4) The light-gray area is the Ellipse Control Region with 1 sigma. (5) The mid-gray area is the Ellipse Control Region with 2 sigma. (6) The dark-gray area is the Ellipse Control Region with 3 sigma. (7) The red point is contributed from (X,Y) and draw it on this specific control chart. (8) When the point is out of 3 sigma area, it’ll give a ‘x’ symbol to represent the OOC case. (9) When the point is OOC, it’ll also provide the Wafer_ID nearby it. (10) The ‘green’, ‘yellow’, and ’red’ light will point out the degree of stability on this process.
In-Line Metrology Value (X)
FD
C S
um
mar
y V
alu
e (Y
)
8
9
Process_A
(X,Y)
(1)
(2)
(3)
(6)(5)
(4)
(7)
(9)
(8) (10)
Remarks:

Page 6 of 56NCTS Industrial Statistics Research Group Seminar
Electron Industrial Control Lab
Department of Electrical and
Control Engineering, NCTU
Full-Line Bi-Variate Semiconductor Process Control Chart
Via this advanced process control chart, we’d be more easily to check the process status.
It can integrate semiconductor full-line process & tool information into one system, and to be a kind of real time control tool for modern 12” iFab.

Page 7 of 56NCTS Industrial Statistics Research Group Seminar
Electron Industrial Control Lab
Department of Electrical and
Control Engineering, NCTU
Case study
0 5 10 15 20 25 30 350.9
0.95
1
1.05
1.1
1.15
1.2
1.25
Run#
Dep
th (n
m)
ALDA102 - PM4
Target
UCL
LCL
ALD NOLA Depth is a new process for new generation. So, we’re going to use this “Advanced Bi-Variate Semiconductor Process Control Chart” to monitor this critical process:
1) In-line metrology value: Depth (nm).
2) Equipment FDC parameters: Var1-Var25.
3) 34 raw data sets.
ALDA102-PM4
Trial data looks like…

Page 8 of 56NCTS Industrial Statistics Research Group Seminar
Electron Industrial Control Lab
Department of Electrical and
Control Engineering, NCTU
Step(1): Select Key Steps and Parameters
Due to for ALDA equipment has so many tool parameters, we need the engineers/ vendors to provide the key process steps (some critical steps in the recipe) and parameters where measurements have significant effect on product quality.
Process step
Variab
les
: the key parameter in corresponding step.
Identify the key steps and variables.

Page 9 of 56NCTS Industrial Statistics Research Group Seminar
Electron Industrial Control Lab
Department of Electrical and
Control Engineering, NCTU
Step(2): T-Score Transformation
TOOL: ALDA102/PM4
ChamberPressurePumpingPressureMFC1GasLineHeater1TempStageHeaterInTempStageHeaterOutTempSource1HeaterTempSource2HeaterTempThrottleValveHeaterTempPumpingLineHeaterTempChamberWallHeaterTempChamberBottomHeaterTempSHInletHeaterTempVATValveHeaterTempSource1_Outlet_Pressure……….…………..…...
),( 12
nxxfT *FDC Summary Value:*Huge data reduce to only ONE index:
)()( 12 xxSxxT
…..
Matrix [34X25]
Based on each wafer, we’d provide the one index- FDC summary value, which could represents all tool parameters healthy status.

Page 10 of 56NCTS Industrial Statistics Research Group Seminar
Electron Industrial Control Lab
Department of Electrical and
Control Engineering, NCTU
An ellipse centered at the point (h,k) and having its major axis parallel to the x-axis may be specified by the equation
This ellipse can be expressed parametrically as
where t may be restricted to the interval
Step(3): Ellipse Control Region
So, we based on the historical raw data (w/ good wafers), to set up the Ellipse control region, and use the Confident-Interval concept to calculate the 1 to 3 sigma alarm region to be the SPC-like, Bi-Variate process control chart.
Ellipse Equations:

Page 11 of 56NCTS Industrial Statistics Research Group Seminar
Electron Industrial Control Lab
Department of Electrical and
Control Engineering, NCTU
Step(4): Simulation for NOLA Depth process
These two points are OOC!!
These four points are in warning control region.
Bi-Variate Semiconductor Process Control Chart:
SPC+FDC information.
The 1 to 3 sigma Ellipse control region.
(1)
(2)
(4)
(3)

Page 12 of 56NCTS Industrial Statistics Research Group Seminar
Electron Industrial Control Lab
Department of Electrical and
Control Engineering, NCTU
Conclusions
From the simulation testing, it seems that our innovative proposal Advanced Bi-Variate Semiconductor Process Control Chart can monitor the semiconductor process variation successfully.
Advanced Bi-Variate Semiconductor Process Control Chart approach not only can be used to monitor the Process Information (SPC Chart) , but also to monitor the Tool Information (FDC Chart) at the same time.
The degree of process capability (like Traffic Lights) for specific critical process also can be known via this novel Bi-Variate process control chart. In this way, the engineers could control process more easily and efficiently.

Page 13 of 56NCTS Industrial Statistics Research Group Seminar
Electron Industrial Control Lab
Department of Electrical and
Control Engineering, NCTU
Case(2): MVA application Yield2Equipment Events Mining.

Page 14 of 56NCTS Industrial Statistics Research Group Seminar
Electron Industrial Control Lab
Department of Electrical and
Control Engineering, NCTU
Yield2Equipment Events Mining
PM PM
Tool-A
time/date
‧‧ ‧‧ ‧‧ ‧‧ ‧‧ ‧‧
‧‧‧ ‧‧‧ ‧‧ ‧‧ ‧ ‧‧ ‧‧‧ ‧‧ ‧‧‧ ‧‧ ‧ ‧‧‧ ‧ ‧‧‧ ‧
‧ ‧‧
YB Yield
T-Score
Trend Down
Trend Up
MVA T-Score
Novel Idea:
)()( 1 xxSxxT
T-Score is an index to represent all tool parameters status. If the T-Score is larger than specific limit we can say that this data point is significant different from the normal condition.
During this PM cycle, the Yield and T-Score have high correlation and T-Score is bigger than normal condition.
In this way, we can induce that this may occur some critical issues in this specific time period.
Another way to point out the abnormal tool !!

Page 15 of 56NCTS Industrial Statistics Research Group Seminar
Electron Industrial Control Lab
Department of Electrical and
Control Engineering, NCTU
Variable & Key Stepselection
Data transformation to T-Score
•Key Step: certain time period•Variable: critical recipe/ process parameters
•MVA Principal Component Analysis •MVA T-Score calculation •MSPC Hotelling T2 control limit set up [0, UCL]
Correlation analysis between
Yield & Tool Events
•Yield & T-score trend up/down monitoring•Pearson Correlation Analysis•Highlight the HIGH correlation PM Cycle to conduct Yield2Equipment Events Mining
Invention Program Flowchart
Root Cause Analysis •Identify suspected ill-parameters

Page 16 of 56NCTS Industrial Statistics Research Group Seminar
Electron Industrial Control Lab
Department of Electrical and
Control Engineering, NCTU
Step(1): Select Key Steps and Parameters
Due to for each equipment has so many tool parameters, we need the engineers/ vendors to provide the key process steps (some critical steps in the recipe) and parameters where measurements have significant effect on product quality.
Process step
Variab
les
: the key parameter in corresponding step.
Identify the key steps and variables.

Page 17 of 56NCTS Industrial Statistics Research Group Seminar
Electron Industrial Control Lab
Department of Electrical and
Control Engineering, NCTU
Step(2): T-Score Transformation
),( 12
nxxfT
TOOL: ALDA102 / PM5ChamberPressure
PumpingPressureMFC1GasLineHeater1TempStageHeaterInTempStageHeaterOutTempSource1HeaterTempSource2HeaterTempThrottleValveHeaterTempPumpingLineHeaterTempChamberWallHeaterTempChamberBottomHeaterTempSHInletHeaterTempVATValveHeaterTempSource1_Outlet_Pressure……….…………..…...
*T2 Score
*Huge data reduce to ONLY one index
)()( 12 xxSxxT

Page 18 of 56NCTS Industrial Statistics Research Group Seminar
Electron Industrial Control Lab
Department of Electrical and
Control Engineering, NCTU
Step(3): Correlation Analysis
n
ii
n
ii
n
iii
yyxx
yyxxr
1
2
1
2
1
)()(
))((
In this step, we’ll conduct the Pearson’s linear correlation analysis to find out the most important PM Cycle in this process and it will be our Highlight issues.
It has high significant correlation !! And then we can put more emphasized eyes on this PM Cycle!!
Correlation Analysis Table
Pearson linear correlation analysis equationPM
Tool-A
time/date
‧‧
‧‧ ‧‧ ‧‧‧ ‧‧
‧‧
‧ ‧
‧
‧
YB Yield
T-Score
‧
‧ ‧
‧ ‧‧ ‧‧‧ ‧‧ ‧‧ ‧
‧ ‧‧ ‧‧‧ ‧‧ ‧‧ ‧‧ ‧
‧‧ ‧ ‧ ‧‧

Page 19 of 56NCTS Industrial Statistics Research Group Seminar
Electron Industrial Control Lab
Department of Electrical and
Control Engineering, NCTU
Step(4): RCA-Root Causes Analysis
),( 12
nxxfT
PCA Index
Raw Data
T1 Chart
Root Cause Analysis via Multi-Variate Analysis
Highlight the suspected issued parameter based on MVA Index!!

Page 20 of 56NCTS Industrial Statistics Research Group Seminar
Electron Industrial Control Lab
Department of Electrical and
Control Engineering, NCTU
Conclusions
From the simulation results, it seems that our proposal Yield2Equip Events Mining module can monitor PM Events on Yield effects obviously.
The Yield2Equip Events Mining approach not only can be used to monitor PM performance, but also it is useful to do RCA tasks when the T-Score and Yield have HIGH correlation relationship.

Page 21 of 56NCTS Industrial Statistics Research Group Seminar
Electron Industrial Control Lab
Department of Electrical and
Control Engineering, NCTU
Case(3): PLS application Virtual Metrology of Deep Trench Chain.

Page 22 of 56NCTS Industrial Statistics Research Group Seminar
Electron Industrial Control Lab
Department of Electrical and
Control Engineering, NCTU
Virtual metrology of deep trench chain
• DT Chain Process DT Chain Process Flow: Flow:
If we could set up the virtual metrology model according to DT Litho CD, DT PHMO CD, and DTMO CD to predict DT final CD. It will be more helpful to assist in on-line process control.
As you know, the deep trench control is more critical for process engineers. Due to the process time between DTMO Etch to DT Etch is about 1.5 days, during this time period no one can be aware of the quality of DT final CD.
Innovative idea !!DT DT
LithoLitho
CDCD
DT DT
PHMOPHMO
CDCD
DT DT
MOMO
CDCD
DT DT
ETCHETCH
CDCD
predictedpredicted
),,( 321 xxxfy
1.5 days

Page 23 of 56NCTS Industrial Statistics Research Group Seminar
Electron Industrial Control Lab
Department of Electrical and
Control Engineering, NCTU
Methodology introduced-PLS modeling overview

Page 24 of 56NCTS Industrial Statistics Research Group Seminar
Electron Industrial Control Lab
Department of Electrical and
Control Engineering, NCTU
Methodology introduced-PLS modeling geometric interpretation

Page 25 of 56NCTS Industrial Statistics Research Group Seminar
Electron Industrial Control Lab
Department of Electrical and
Control Engineering, NCTU
RMSE Error Rate
PLSR 0.0017766 1.211%
LSER 0.0023455 1.618%
Tool: D90 OXEC103-chamber A
nY
YY
RateError
YYn
RMSE
n
i
n
i
1
1
2
)ˆ
(-)2(
)ˆ(1
)1(
Simulation(1)-Predicted DT final CD via PLS/LSE
*From the chart, it seems that we could get the better DTME predicted CD via PLS modeling technical.
Formula:

Page 26 of 56NCTS Industrial Statistics Research Group Seminar
Electron Industrial Control Lab
Department of Electrical and
Control Engineering, NCTU
Tool: T90 OXEC107-chamber A
Simulation(2)-SPC for virtual metrology of DT final CD
It can correctly catch the process alarm message !!
1) PLS model predicts the virtual metrology values by the pre-process metrology data.2) At the same time, SPC scheme will monitor the prediction value of metrology parameter. 3) It will also give alarms to engineers when the prediction value is out of the specification. → So, via this virtual scheme, we could ensure that the process is within specification.
Summary:

Page 27 of 56NCTS Industrial Statistics Research Group Seminar
Electron Industrial Control Lab
Department of Electrical and
Control Engineering, NCTU
Virtual Metrology of deep trench chain. DT Chain Healthy Index set up. Early alarm/detection system.• Process grouping for following process.• Improve throughputs for critical process.• Improve line stability.
Conclusions

Page 28 of 56NCTS Industrial Statistics Research Group Seminar
Electron Industrial Control Lab
Department of Electrical and
Control Engineering, NCTU
AppendixAppendix

Page 29 of 56NCTS Industrial Statistics Research Group Seminar
Electron Industrial Control Lab
Department of Electrical and
Control Engineering, NCTU
• Abstract: When the number of X is large compared to the number of observations, the multiple linear regression is no longer feasible ( because of multicolinearity). In order to solve the problem, several approaches have been developed. One is principal component regression (PCR) and the other is Partial least squares regression (PLSR)
• Goal:To solve multicolinearity problem To reduce data dimensionTo predict Y from X and to describe their common structureTo get important X variables
• Difference between PLSR and PCR: PLSR finds components from X that are also relevant for Y
Partial least squares regression (PLSR)page.1

Page 30 of 56NCTS Industrial Statistics Research Group Seminar
Electron Industrial Control Lab
Department of Electrical and
Control Engineering, NCTU
) of valueeigenv theis , ofr eigenvecto theis (c
00
0...0
c s.t. c ,
...
)(
) of valueeigenv theis , ofor eigen vect theis (w
00
0...0
ws.t. w ,
...
)(
222
1
22T
21
11211
2
111
1
11T
21
11211
1
R
RcYCov
R
RwXCov
nnnnn
n
nnnnn
n
t = Xw Cov(t) = Cov(Xw) = wTCov(X)w = u = Yc Cov(u) = Cov(Yc) = cTCov(X)c = 2
To find two sets of weights w and c in order to create (respectively) a linear combination of the columns of X and Y such that their covariance is maximum!!
page.2
Basic concept

Page 31 of 56NCTS Industrial Statistics Research Group Seminar
Electron Industrial Control Lab
Department of Electrical and
Control Engineering, NCTU
Nonlinear Iterative Partial Least Squares Algorithm (NIPALS)
1
1
1
( )
j
j
j
aT T
jj
aT T
jj
aT T
jj
X TP E t p E
Y UQ F u q F
Y UQ F u q F U TB
T is score matrix
The columns of T are the latent vectors
P is loading matrix
j=0, E0=Xn×m , F0=Yn×p , uj=any column of Y matrix, t = Xw, u = Yc
1 1
1
,1 , 1
,
1
. .(1) (5) (10) 1, min( , )
. .
(2) . (6)
.(3)
T Tj j j j
j jT Tj j j j
j old Tj j j j new j j j j
j old
Tj j
j
E u E tw p j j to j m n
E u t t
pt E w p E E t p
p
F tc
F
, , , 11
1 , , ,
(7) . , .
(4) . (8) . When E is a null matrix then stop
( . is Euc
Tj jT
j new j old j old j j j j j jT Tj j j j
j j j j new j old j old
u tt t p F F b t c b
t t t
u F c w w p
lidean norm or 2-norm)
page.3

Page 32 of 56NCTS Industrial Statistics Research Group Seminar
Electron Industrial Control Lab
Department of Electrical and
Control Engineering, NCTU
Case(4): Time series application
KSI-Based to Predict Tool Maintenance.

Page 33 of 56NCTS Industrial Statistics Research Group Seminar
Electron Industrial Control Lab
Department of Electrical and
Control Engineering, NCTU
KSI-Based to Predict Tool Maintenance
Once this KSI is greater than a pre-scribed limit (threshold).
Call for engineers &Call for tool maintenance !!
KSI: Key Sensitive Index.
PM PMThreshold
KS
I
Time
Idea of invention:
However, we all know that correct trend monitoring via tool signals can be used to determine approaching timing for preventive maintenance. In this way, our innovative idea can be described as following:
Due to the tool maintenance schedule is usually arranged by date, wafer run counts, RF hours, and for the furnace process it will also consider the equipment sidewall film thickness, but all of them are not sensitive to catch tool real status which need to conduct PM or not?.

Page 34 of 56NCTS Industrial Statistics Research Group Seminar
Electron Industrial Control Lab
Department of Electrical and
Control Engineering, NCTU
Invention Program Flowchart
Variable & Key Stepselection
Correlation analysis
•Key Step: certain time period•Variable: critical recipe/ process parameters
•Correlation: the quantity of variables•Screen out key parameter & key step•Extract out the signal characteristics
Time series model
•Time series models fit the trend of variables•Auto-correlation: the q of MA model•Partial Auto-correlation: the p of AR model•Defined Time Series ARIMA(p,d,q) model•KSI would decide when to call tool maintenance

Page 35 of 56NCTS Industrial Statistics Research Group Seminar
Electron Industrial Control Lab
Department of Electrical and
Control Engineering, NCTU
Step(1): Select key steps and parameters
Due to for each equipment has so many tool parameters, we need the engineers/ vendors to provide the key process steps (some critical steps in the recipe) and parameters which measurements have significant effects on product quality.
Process step
Variab
les
: the key parameter in corresponding step.
Identify the key steps and variables.

Page 36 of 56NCTS Industrial Statistics Research Group Seminar
Electron Industrial Control Lab
Department of Electrical and
Control Engineering, NCTU
The KSV (Key Sensitive Process Variables), may not be the measurements itself in corresponding key step. However, we can transform the original tool signals into some statistic quantity, such as slop, area, maxima and minima…,etc., which can really represent the characteristics of tool status.
Step(2): Extract out KSV from tool signals
How to extract out the useful tool signal information ?? Tool signals
1. Time Length
2. Mean
3. Stdev
4. Median
5. Max
6. Min
7. Area
8. Quantile……………….

Page 37 of 56NCTS Industrial Statistics Research Group Seminar
Electron Industrial Control Lab
Department of Electrical and
Control Engineering, NCTU
Step(3): Correlation analysis
In this step, we’ll conduct the Pearson’s linear correlation analysis to find out the most important KSV in this process and it will be our Time Series Modeling variable.
It has high significant correlation !! And then we can use it to be modeling item.
Correlation Analysis Table
n
ii
n
ii
n
iii
yyxx
yyxxr
1
2
1
2
1
)()(
))((
Pearson linear correlation analysis equation

Page 38 of 56NCTS Industrial Statistics Research Group Seminar
Electron Industrial Control Lab
Department of Electrical and
Control Engineering, NCTU
0 50 100 150 200 250 300 350 400 450 500-5
0
5
10
Wafer#
Varia
ble
3__S
tdev
Step(4): Fitted the Time Series model to get KSI
21
1
1
358.0657.01)(
873.01)(
)1(),()()()(
qqqC
qqA
qteqCtyqA
Model: ARIMA(1,1,2)
Trend chart for Variable_3 - Stdev
Fitted Time Series Model
How to fit this Time Series model ??
According to the previous study, we can realize that
(Step_4)+(Variable_3)+(Stdev)
is the KSV in this process, and correct trend monitoring can be used to determine appropriate timing for preventive maintenance.

Page 39 of 56NCTS Industrial Statistics Research Group Seminar
Electron Industrial Control Lab
Department of Electrical and
Control Engineering, NCTU
0 50 100 150 200 250 300 350 400 450 500-5
0
5
10
Wafer#
Var
iab
le 3
__S
tdev
Step(5):Compute KSI & Simulation
ARIMA(1,1,2) predicted model
Time Series Model can catch the tool KSV decayed trend. In this work, the KSI (Key Sensitive Index) based approach is proposed for process trend monitoring.
Based-on KSI and Threshold limit we can predict when to do Preventive Maintenance !!
0 200 400 600 800 1000 1200 1400 1600 18001800-5
0
5
10
Wafer#
Vari
ab
le 3
__S
tdev
0 200 400 600 800 1000 1200 1400 1600 18001800-5
0
5
10
Wafer#
KS
I In
dex
KSI-Based
PM PM PM PM
KSI KSI KSI
Threshold

Page 40 of 56NCTS Industrial Statistics Research Group Seminar
Electron Industrial Control Lab
Department of Electrical and
Control Engineering, NCTU
Conclusions
From the simulation results, it seems that our proposal KSI can catch the tool decayed trend, and when the KSI is greater than users defined threshold, then we can suggest engineers to do PM jobs.
The KSI-Based to Predict Tool Maintenance approach not only can be used for Furnace and Etch tools to assist engineers in when to call for Preventive Maintenance, but also it is useful to do process trend monitoring in FDC system.

Page 41 of 56NCTS Industrial Statistics Research Group Seminar
Electron Industrial Control Lab
Department of Electrical and
Control Engineering, NCTU
Case(5): Survival applicationAdvanced Queue-Time to Yield Monitoring System.

Page 42 of 56NCTS Industrial Statistics Research Group Seminar
Electron Industrial Control Lab
Department of Electrical and
Control Engineering, NCTU
As you know, Q-Time Process Control is a great important task on semiconductor manufacturing. In Fabs, the following processes are also involved in Q-Time issues:
1. DT ME → Change FOUP (Q-Time < 3hrs) 2. HSG Depo → HSG Recess (Q-Time < 10hrs) 3. RC1a → Poly1b (Q-Time < 6hrs) …,and so on.
Nowadays, we usually set the Q time < k hours monitoring scheme to control these critical processes.
Survival Function Based-Advanced Q-Time2Yield Morning System
Motivation:
Process AProcess A Process BProcess B
Process A end time (t1) Process B start time (t2)
…
Q-Time = [t2 - t1]
Queue Time Definition:
Innovative idea !!
If we could build up the Survival Function Model which based on the relationships between Q-Time and Yield decayed process, and provide the probability of risks-degrees to real time tell engineers what’s the current status for yield detractor and how long could we wait for next process starting.
In this way, it will give a big hand for not only Q-Time process control, but also productivity scheduling and cycle time improvement.
For chemical processes, they usually put the criteria for Q-Time control to avoid excursions. If the Q-Time longer than the specific specification, we can induce that this may occur some critical issues in this specific time period.
Page 43 of 56NCTS Industrial Statistics Research Group Seminar
Electron Industrial Control Lab
Department of Electrical and
Control Engineering, NCTU
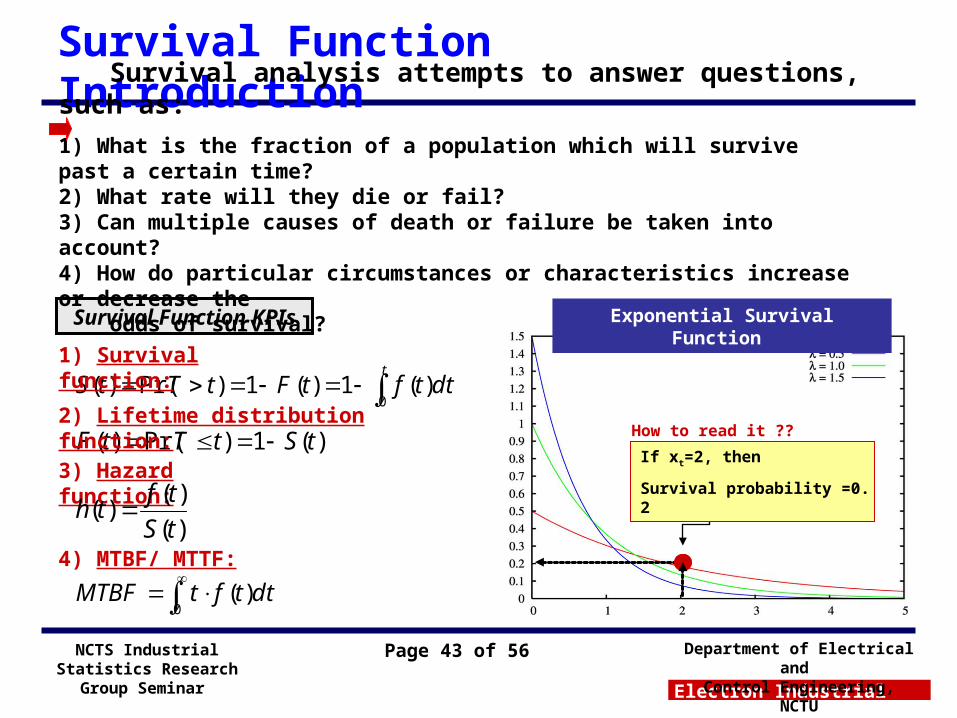
Survival Function Introduction
t
dttftFtTtS0
)(1)(1)Pr()(
)(1)Pr()( tStTtF
Survival Function KPIs
1) Survival function:
2) Lifetime distribution function:
3) Hazard function:
Exponential Survival Function
If xt=2, then
Survival probability =0.2
How to read it ??
)(
)()(
tS
tfth
4) MTBF/ MTTF:
0)( dttftMTBF
Survival analysis attempts to answer questions, such as:
1) What is the fraction of a population which will survive past a certain time? 2) What rate will they die or fail? 3) Can multiple causes of death or failure be taken into account? 4) How do particular circumstances or characteristics increase or decrease the odds of survival?

Page 44 of 56NCTS Industrial Statistics Research Group Seminar
Electron Industrial Control Lab
Department of Electrical and
Control Engineering, NCTU
Q-Time and Yield datacollecting/mapping
Model parameters fitting
based on distribution
•Key process selecting from engineers Know-How.•Variable: critical WAT/ Yield data.
•Likelihood function to fit parameters. •Kaplan-Meier estimator. •Reliability theory.
Survival distributions selecting
•RMSE/ MME/ TMSE evaluated. •Survival model validation.
Invention Program Flowchart
Survival function KPIs calculating
•Survival function.•Lifetime distribution function.•Hazard Function. •MTTF/ MTBF.

Page 45 of 56NCTS Industrial Statistics Research Group Seminar
Electron Industrial Control Lab
Department of Electrical and
Control Engineering, NCTU
OP_1 OP_2 OP_3 OP_4 OP_5
WAT_1
WAT_2
WAT_3
WAT_4
WAT_5
WAT_6
Step(1): Q-Time and Response Data Mapping
From engineers Know-How, we could collect the specific Q-Time control processes, and related WAT (electrical testing data)/ Yield data.
And then, we are going to conduct the Rank Correlation Analysis to find out the variables which are higher correlation between process and WAT parameters.
Q-Time control process
WA
T
Var
iab
les
: the highly correlation relationship.
Identify the sensitivity process and variable.

Page 46 of 56NCTS Industrial Statistics Research Group Seminar
Electron Industrial Control Lab
Department of Electrical and
Control Engineering, NCTU
Step(2): Survival Distribution Selecting
2.219
Normal
2.579
Exponential
2.179
Lognormal base e
2.172
Weibull
Anderson-Darling (adj)99
9590807060504030
20
10
5
3 2
1
10010
Weibull
Pe
rce
nt
99
95
80
7060504030
20
10
5
1
1000100
Lognormal base e
Pe
rce
nt
99
98
97
95
90
80
706050
3010
8007006005004003002001000
ExponentialP
erc
en
t
99
95
80706050403020
10
5
1
3002001000
Normal
Pe
rce
nt
Four-way Probability Plot for weibML Estimates - Complete Data
Weibul distribution
Lognormal distribution
Exponential distribution
Normal distribution
Model identification:For the Survival function distribution identification, we usually choose 4 popular distributions: 1) Weibul distribution 2) Lognormal distribution 3) Exponential distribution 4) Normal distribution to be the initial testing model,and based on the “Anderson-Darling value”, we could select the best fitted distribution as the Survival function.
Probability Plots for 4 Survival distributions
Which one is better ??

Page 47 of 56NCTS Industrial Statistics Research Group Seminar
Electron Industrial Control Lab
Department of Electrical and
Control Engineering, NCTU
After identified the process decayed distribution, we need to estimate the model parameters. Currently, there are two popular methods to figure out the model parameter estimations:
1) Kaplan-Meier estimator:
2) Maximum Likelihood estimation(MLE):
Step(3): Model Parameters Fitting
Fitted parameters to data:
such that Find *)}|({max)|ˆ( * xLxL
for MLE called is ˆ*
)1
()(ˆRankMean A)( )(
n
itF i
)4.0
3.0()(ˆRankMedian )( )(
n
itFB i
5 6 7 8 9 10 11 12 13 14 150
0.1
0.2
0.3
0.4
0.5
0.6
0.7
0.8
0.9
1
K-M cdf
Normal cdf
From below CDF charts, it ‘s obviously to see that K-M estimator could estimate the survival function from life-time data as good as original distribution.

Page 48 of 56NCTS Industrial Statistics Research Group Seminar
Electron Industrial Control Lab
Department of Electrical and
Control Engineering, NCTU
Step(4): Survival Function KPIs Calculating
Survival KPIs:
1) Survival probability:
2) Lifetime distribution function:
3) Hazard function:
4) MTBF/ MTTF:
We set Xt=10 to evaluate each KPI.
0.4346
0.0362
0.0833
12
10 20 30 40 50 600
0.1
0.2
0.3
0.4
0.5
0.6
0.7
0.8
0.9
1Survival function for Q - Time controlled process
Q - Time ( hours )
Sur
viva
l Fun
ctio
n S
(t)
Xt
Simulation Result:We set the Q-Time controlled process belongs to Exp(Θ=12) distribution, and its Survival function is also shown here.
So, if the Lot queuing time in critical process is 10 hours, its Survival probability is 0.4346. At the same time, RTD could reference this Survival probability to dispatch FOUPs.

Page 49 of 56NCTS Industrial Statistics Research Group Seminar
Electron Industrial Control Lab
Department of Electrical and
Control Engineering, NCTU
Conclusions
From the simulation results, it seems that our innovative proposal Survival Function Based-Advanced Q-Time2Yield Morning System can estimate the Q-Time controlled process decayed behavior successfully.
The Survival Function Based-Advanced Q-Time2Yield
Morning System approach not only can be used to monitor queuing time between process ended to next process starting, but also give the Survival probability function for risks-degrees if wafer waited for a long time.
The Cycle Time and Productivity Scheduling efficiency will also be improved, if Fab RTD System could reference this Survival probability value to work logistic dispatch.

Page 50 of 56NCTS Industrial Statistics Research Group Seminar
Electron Industrial Control Lab
Department of Electrical and
Control Engineering, NCTU
Case(6): SPC chart application
Smart Process Capability Trend Monitoring System.

Page 51 of 56NCTS Industrial Statistics Research Group Seminar
Electron Industrial Control Lab
Department of Electrical and
Control Engineering, NCTU
Smart Process Capability Trend Monitoring System
Problem:Currently, we only can find problems when a tool violates Western Electric rules. We can’t provide the pre-alert system when tools have potential problem. Although our Yield system provide the Cpmk index to monitor the tool health, but there are no monitoring rules like SPC in it.
How:Here we will use the CUSUM (Cumulative sum control chart) method to transform the Cpmk value of tool in our Yield system. We not only provide the monitoring rules and can find the trend down situation of tools.
At present, we use the SPC (Statistical Process Control) to monitor process capability and so on. The SPC charts use Western Electric rule to monitor tools real-time alert.
USL
LSL
CL
UCL
LCL
One point out of control limit (3 Sigma)
Hold
Western Electric rule
Hold
USL
LSL
CL
UCL
LCL
7 points increasing or decreasing

Page 52 of 56NCTS Industrial Statistics Research Group Seminar
Electron Industrial Control Lab
Department of Electrical and
Control Engineering, NCTU
Method Introduction
Cusum ( Cumulative sum control chart )It is out of control situation, that the upper sum higher than H (decision interval) or the lower sum lower than H. Normally
) (if , 22
||K
0CC where
])(,0max[C cusum sidelower
])(,0max[C cusum sideupper
0101
00
10i
10i
ii
ii
Cxk
Ckx
5H
Cusum Concept:
Key Concept:The Cusum method will calculate the upper cusum value and lower cusum value which base on last cusum value. So we just need to monitor the cusum value of each period that there is trend down situation in condition periods.
Cpmk limit
Mean
Period/date
Cp
mk
Valu
e
Small trend down situation
Method equation:

Page 53 of 56NCTS Industrial Statistics Research Group Seminar
Electron Industrial Control Lab
Department of Electrical and
Control Engineering, NCTU
Simulation
• Tool A • FAB: Cross Fab• Date range: 4/15-5/13• Condition 4 periods• Analysis result:There is a trend down situation in periods 1-17 and periods 32-50.

Page 54 of 56NCTS Industrial Statistics Research Group Seminar
Electron Industrial Control Lab
Department of Electrical and
Control Engineering, NCTU
Conclusions
Provided a new monitor index (CUSUM) for tools’ health and pre-alert model when tools have potential problems that engineers can handle tools’ health conveniently & prevent tools from occurring significant problems.

Page 55 of 56NCTS Industrial Statistics Research Group Seminar
Electron Industrial Control Lab
Department of Electrical and
Control Engineering, NCTU
Thank You.Questions & Answers…

Page 56 of 56NCTS Industrial Statistics Research Group Seminar
Electron Industrial Control Lab
Department of Electrical and
Control Engineering, NCTU
Published Papers


![[NCTU 2011 I-DO Camp] Taiwan introduction](https://static.fdocument.pub/doc/165x107/55d4aa25bb61eb1e348b459a/nctu-2011-i-do-camp-taiwan-introduction.jpg)