NCME Diagnostic Measurement Workshop Handout€¦ · NCME Diagnostic Measurement Workshop Handout 7...
24
NCME Diagnostic Measurement Workshop Handout 1 Obtaining Diagnostic Classification Model Estimates with Mplus Syntax and Output Handout NCME Diagnostic Measurement Workshop To demonstrate how Diagnostic Classification Models (DCMs) can be estimated using Mplus, input syntax and output are included in this document. Analysis Data Set – Based on DTMR Data from Session 3 (simulated so it is distributable): 28 items Four attributes 990 respondents Analysis/ECPE Q‐matrix: Item Attribute 1 Attribute 2 Attribute 3 Attribute 4 1 1 0 0 0 2 0 0 1 0 3 0 1 0 0 4 1 0 0 0 5 1 0 0 0 6 0 1 0 0 7 1 0 0 0 8a 0 0 1 0 8b 0 0 1 0 8c 0 0 1 0 8d 0 0 1 0 9 1 0 0 0 10a 0 0 0 1 10b 0 0 0 1 10c 0 0 0 1 11 1 0 0 0 12 1 0 0 0 13 0 1 0 1 14 1 1 0 0 15a 1 0 0 1 15b 1 0 0 0 15c 1 0 0 0 16 1 0 0 0 17 1 1 0 0 18 1 1 0 0 19 0 0 1 0 21 1 0 0 0 22 1 1 0 0
Transcript of NCME Diagnostic Measurement Workshop Handout€¦ · NCME Diagnostic Measurement Workshop Handout 7...

NCME Diagnostic Measurement Workshop Handout 1
Obtaining Diagnostic Classification Model Estimates with Mplus Syntax and Output Handout
NCME Diagnostic Measurement Workshop
To demonstrate how Diagnostic Classification Models (DCMs) can be estimated using Mplus, input syntax and output are included in this document.
Analysis Data Set – Based on DTMR Data from Session 3 (simulated so it is distributable):
28 items
Four attributes
990 respondents
Analysis/ECPE Q‐matrix:
Item Attribute 1 Attribute 2 Attribute 3 Attribute 4
1 1 0 0 0
2 0 0 1 0
3 0 1 0 0
4 1 0 0 0
5 1 0 0 0
6 0 1 0 0
7 1 0 0 0
8a 0 0 1 0
8b 0 0 1 0
8c 0 0 1 0
8d 0 0 1 0
9 1 0 0 0
10a 0 0 0 1
10b 0 0 0 1
10c 0 0 0 1
11 1 0 0 0
12 1 0 0 0
13 0 1 0 1
14 1 1 0 0
15a 1 0 0 1
15b 1 0 0 0
15c 1 0 0 0
16 1 0 0 0
17 1 1 0 0
18 1 1 0 0
19 0 0 1 0
21 1 0 0 0
22 1 1 0 0
NCME Diagnostic Measurement Workshop Handout 2
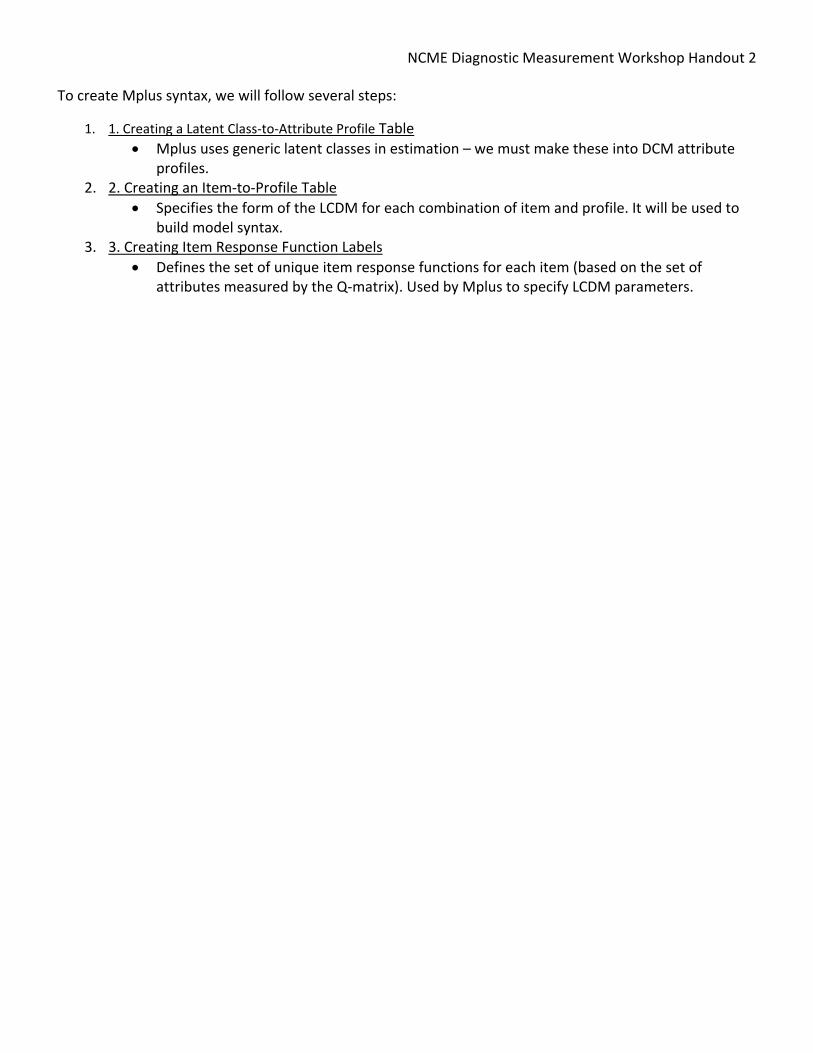
To create Mplus syntax, we will follow several steps:
1. 1. Creating a Latent Class‐to‐Attribute Profile Table
Mplus uses generic latent classes in estimation – we must make these into DCM attribute profiles.
2. 2. Creating an Item‐to‐Profile Table
Specifies the form of the LCDM for each combination of item and profile. It will be used to build model syntax.
3. 3. Creating Item Response Function Labels
Defines the set of unique item response functions for each item (based on the set of attributes measured by the Q‐matrix). Used by Mplus to specify LCDM parameters.

NCME Diagnostic Measurement Workshop Handout 3
4. 4. Creating the Structural Model
For limiting the number of correlational parameters needed; aids in estimation speed and convergence.
5. 5. Specifying Initial Mplus Syntax
Commands for input and parsing of data files. 6. 6. Building Mplus MODEL Command Syntax
Places labels on all Mplus parameters (thereby enforcing confirmatory model on classes). 7. Building Mplus MODEL CONSTRAINT Command Syntax
Specifies LCDM model parameters.
NCME Diagnostic Measurement Workshop Handout 4
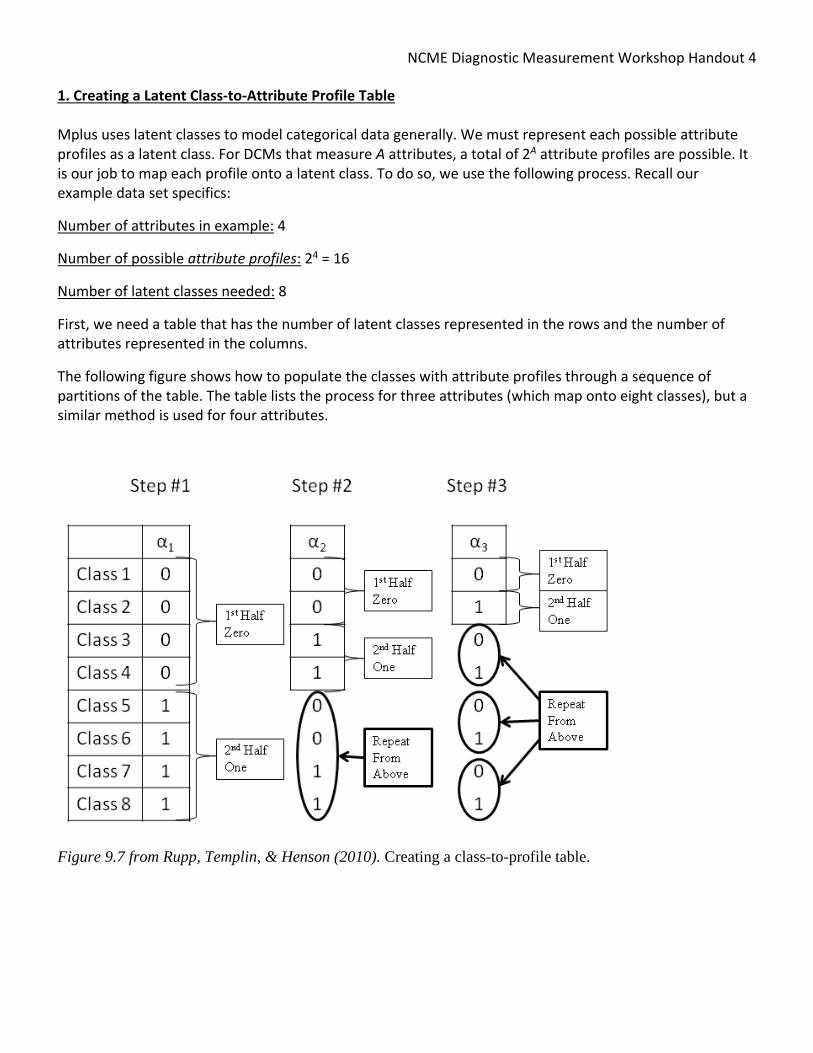
1. Creating a Latent Class‐to‐Attribute Profile Table
Mplus uses latent classes to model categorical data generally. We must represent each possible attribute profiles as a latent class. For DCMs that measure A attributes, a total of 2A attribute profiles are possible. It is our job to map each profile onto a latent class. To do so, we use the following process. Recall our example data set specifics:
Number of attributes in example: 4
Number of possible attribute profiles: 24 = 16
Number of latent classes needed: 8
First, we need a table that has the number of latent classes represented in the rows and the number of attributes represented in the columns.
The following figure shows how to populate the classes with attribute profiles through a sequence of partitions of the table. The table lists the process for three attributes (which map onto eight classes), but a similar method is used for four attributes.
Figure 9.7 from Rupp, Templin, & Henson (2010). Creating a class-to-profile table.

NCME Diagnostic Measurement Workshop Handout 5
2. Creating an Item‐to‐Profile Table
The next step is to develop the LCDM model specification for each combination of items and attribute profiles, the item response function for respondents with a given attribute profile. In DCMs, not all attributes are measured by each item. Therefore, there will be repeated item response functions. This table will help to denote which are redundant and therefore able to be omitted. We will use the Q‐matrix to help form what model parameters should be present for each combination of item and attribute profile.
Analysis Q‐matrix (rearranged to reflect items measuring same set of attributes):
Items Attribute 1 Attribute 2 Attribute 3 Attribute 4 Set Number
1, 4, 5, 7, 9, 11, 12, 15b, 15c, 16, 21
1 0 0 0 1
3, 6 0 1 0 0 2
2, 8a, 8b, 8c, 8d, 19 0 0 1 0 3
10a, 10b, 10c 0 0 0 1 4
14, 17, 18, 22 1 1 0 0 5
15a 1 0 0 1 6
13 0 1 0 1 7

NCME Diagnostic Measurement Workshop Handout 6
Item‐to‐Profile Table (first subscript denotes set – change for each item number)
Class c1 c2 c3 c4 c5 c6 c7 c8
c [0, 0, 0, 0] [0, 0, 0, 1] [0, 0, 1, 0] [0, 0, 1, 1] [0, 1, 0, 0] [0, 1, 0, 1] [0, 1, 1, 0] [0, 1, 1, 1]
Set 1 λ1,0 λ1,0 λ1,0 λ1,0 λ1,0 λ1,0 λ1,0 λ1,0
Set 2 λ2,0 λ2,0 λ2,0 λ2,0 λ2,0 + λ2,1,(2)
λ2,0 + λ2,1,(2)
λ2,0 + λ2,1,(2)
λ2,0 + λ2,1,(2)
Set 3 λ3,0 λ3,0 λ3,0 + λ3,1,(3)
λ3,0 + λ3,1,(3)
λ3,0 λ3,0 λ3,0
+ λ3,1,(3) λ3,0
+ λ3,1,(3)
Set 4 λ4,0 λ4,0 + λ4,1,(4)
λ4,0 λ4,0 +λ4,1,(4)
λ4,0 λ4,0 + λ4,1,(4)
λ4,0 λ4,0 + λ4,1,(4)
Set 5 λ5,0 λ5,0 λ5,0 λ5,0 λ5,0 +λ5,1,(2)
λ5,0 + λ5,1,(2)
λ5,0 + λ5,1,(2)
λ5,0 + λ5,1,(2)
Set 6 λ6,0 λ6,0 + λ6,1,(4)
λ6,0 λ6,0 + λ6,1,(4)
λ6,0 λ6,0 + λ6,1,(4)
λ6,0 λ6,0 + λ6,1,(4)
Set 7 λ7,0 λ7,0 + λ7,1,(4) λ7,0 λ7,0 + λ7,1,(4) λ7,0 + λ7,1,(2) λ7,0 + λ7,1,(2) + λ7,1,(4) + λ7,2,(2,4)
λ7,0 + λ7,1,(2) λ7,0 + λ7,1,(2) + λ7,1,(4) + λ7,2,(2,4)
Class c9 c10 c11 c12 c13 c14 c15 c16
c [1, 0, 0, 0] [1, 0, 0, 1] [1, 0, 1, 0] [1, 0, 1, 1] [1, 1, 0, 0] [1, 1, 0, 1] [1, 1, 1, 0] [1, 1, 1, 1]
Set 1 λ1,0 + λ1,1,(1) λ1,0 + λ1,1,(1)
λ1,0 + λ1,1,(1)
λ1,0 + λ1,1,(1)
λ1,0 + λ1,1,(1) λ1,0 + λ1,1,(1)
λ1,0 + λ1,1,(1)
λ1,0 + λ1,1,(1)
Set 2 λ2,0 λ2,0 λ2,0 λ2,0 λ2,0 + λ2,1,(2) λ2,0 + λ2,1,(2)
λ2,0 + λ2,1,(2)
λ2,0 + λ2,1,(2)
Set 3 λ3,0 λ3,0 λ3,0 + λ3,1,(3)
λ3,0 + λ3,1,(3)
λ3,0 λ3,0 λ3,0
+ λ3,1,(3) λ3,0
+ λ3,1,(3)
Set 4 λ4,0 λ4,0 + λ4,1,(4)
λ4,0 λ4,0 +λ4,1,(4)
λ4,0 λ4,0 + λ4,1,(4)
λ4,0 λ4,0 + λ4,1,(4)
Set 5 λ5,0 + λ5,1,(1)
λ5,0 + λ5,1,(1)
λ5,0 + λ5,1,(1)
λ5,0 + λ5,1,(1)
λ5,0 + λ5,1,(1) + λ5,1,(2) + λ5,2,(1,2)
λ5,0 + λ5,1,(1) + λ5,1,(2) + λ5,2,(1,2)
λ5,0 + λ5,1,(1) + λ5,1,(2) + λ5,2,(1,2)
λ5,0 + λ5,1,(1) + λ5,1,(2) + λ5,2,(1,2)
Set 6 λ6,0 + λ6,1,(1)
λ6,0 + λ6,1,(1) + λ6,1(4) + λ6,2,(1,4)
λ6,0 + λ6,1,(1)
λ6,0 + λ6,1,(1) + λ6,1(4) + λ6,2,(1,4)
λ6,0 + λ6,1,(1)
λ6,0 + λ6,1,(1) + λ6,1(4) + λ6,2,(1,4)
λ6,0 + λ6,1,(1)
λ6,0 + λ6,1,(1) + λ6,1(4) + λ6,2,(1,4)
Set 7 λ7,0 λ7,0 + λ7,1,(4) λ7,0 λ7,0 + λ7,1,(4) λ7,0 + λ7,1,(2) λ7,0 + λ7,1,(2)+ λ7,1,(4) + λ7,2,(2,4)
λ7,0 + λ7,1,(2) λ7,0 + λ7,1,(2) + λ7,1,(4) + λ7,2,(2,4)

NCME Diagnostic Measurement Workshop Handout 7
3. Creating Item Response Function Labels
The next step in the process is to label each unique item response function for each item in the Item‐to‐Profile table. In the table below, we use the first number to represent the set of items from the Item‐to‐Profile table. In code, this will change to be the item number. The labeling convention we will use will follow the form of t[i]_[#]:
t represents that label is a threshold (Mplus definition for LCDM item response function)
[i] is the item used (omit brackets)
[#] is the index for unique item response function for an item.
The labels are created by reading left‐to‐right for each row of the Item‐to‐Profile table. The first entry for the first cell of the first item receives the label t1_1, as do all other entries that are the same. The next unique entry receives the label t1_2, as do all other entries that look the same. The process continues until all labels have been assigned.

NCME Diagnostic Measurement Workshop Handout 8
Item Response Function Labels
c1 c2 c3 c4 c5 c6 c7 c8
c [0,0,0,0] [0,0,0,1] [0,0,1,0] [0,0,1,1] [0,1,0,0] [0,1,0,1] [0,1,1,0] [0,1,1,1]
set 1 T1_1 T1_1 T1_1 T1_1 T1_1 T1_1 T1_1 T1_1
set 2 T2_1 T2_1 T2_1 T2_1 T2_2 T2_2 T2_2 T2_2
set 3 T3_1 T3_1 T3_2 T3_2 T3_1 T3_2 T3_2 T3_2
set 4 T4_1 T4_2 T4_1 T4_2 T4_1 T4_2 T4_1 T4_2
set 5 T5_1 T5_1 T5_1 T5_1 T5_2 T5_2 T5_2 T5_2
set 6 T6_1 T6_2 T6_1 T6_2 T6_1 T6_2 T6_1 T6_2
set 7 T7_1 T7_2 T7_1 T7_2 T7_3 T7_4 T7_3 T7_4
c9 c10 c11 c12 c13 c14 c15 c16
c [1,0,0,0] [1,0,0,1] [1,0,1,0] [1,0,1,1] [1,1,0,0] [1,1,0,1] [1,1,1,0] [1,1,1,1]
set 1 T1_2 T1_2 T1_2 T1_2 T1_2 T1_2 T1_2 T1_2
set 2 T2_1 T2_1 T2_1 T2_1 T2_2 T2_2 T2_2 T2_2
set 3 T3_1 T3_1 T3_2 T3_2 T3_1 T3_2 T3_2 T3_2
set 4 T4_1 T4_2 T4_1 T4_2 T4_1 T4_2 T4_1 T4_2
set 5 T5_3 T5_3 T5_3 T5_3 T5_4 T5_4 T5_4 T5_4
set 6 T6_3 T6_4 T6_3 T6_4 T6_3 T6_4 T6_3 T6_4
set 7 T7_1 T7_2 T7_1 T7_2 T7_3 T7_4 T7_3 T7_4

NCME Diagnostic Measurement Workshop Handout 9
4. Creating the Structural Model [Optional]
The next step is to define the structural model – the model that produces estimates of the probability any respondent has a given attribute profile. The structural model is how attribute association (i.e., correlation) is modeled in DCMs.
This step is optional as Mplus will fit a saturated model if none is specified. Specification of the structural model, however, will improve estimation speed and convergence. Mplus uses a log‐linear model for the structural component, meaning the model itself will look like a linear model with intercepts, main effects, and interactions. These terms are all specific to attributes and not to the interaction of attributes to produce item responses.
By definition (and for identification), Mplus sets the value of the last class to zero, causing a few inconveniences in syntax building. The table below shows the label for each structural model parameter along with the actual modeling term used. Note that the first row is a new parameter created to be the intercept (defined because the last term is fixed at zero).
Note: a reasonable approach to a structural model would be to have all main effects and two‐way interactions, allowing all attributes to be correlated.

NCME Diagnostic Measurement Workshop Handout 10
Structural Model Specification Table
Class Attribute Profile
Mplus Label
Saturated Log‐linear Model
‐ ‐ g0 , , , , , , , , , ,
, , , , , , , , , , , ,
, , , , , , ,
1 α1 = [0,0,0,0] m1
2 α2 = [0,0,0,1] m2 ,
3 α3 = [0,0,1,0] m3 ,
4 α4 = [0,0,1,1] m4 , , , ,
5 α5 = [0,1,0,0] m5 ,
6 α6 = [0,1,0,1] m6 , , , ,
7 α7 = [0,1,1,0] m7 , , , ,
8 α8 = [0,1,1,1] m8 , , , , , , , , , , , ,
9 α9 = [1,0,0,0] m9 ,
10 α10 = [1,0,0,1] m10 , , , ,
11 α11 = [1,0,1,0] m11 , , , ,
12 α12 = [1,0,1,1] m12 , , , , , , , , , , , ,
13 α13 = [1,1,0,0] m13 , , , ,
14 α14 = [1,1,0,1] m14 , , , , , , , , , , , ,
15 α15 = [1,1,1,0] m15 , , , , , , , , , , , ,
16 α16 = [1,1,1,1] None: FIXED
0

NCME Diagnostic Measurement Workshop Handout 11
5. Specifying Initial Mplus Syntax
The initial Mplus syntax contains information about the data set, items, and types of variables.
Note: this comes from file chapter9c.inp
Mplus Syntax Comments TITLE: LCDM Estimation simulated DTMR data set.
Provides the title for the analysis that appears in output.
DATA: FILE = data.dat;
Provides location of input data file. Assumes same folder as input file if no path given.
VARIABLE: NAMES = ID I1 I2 ... I22; USEVARIABLE = I1 I2 ... I22; CATEGORICAL = I1 I2 ... I22; CLASSES = c(16); IDVARIABLE = ID;
The variable section lists details about the data – variables and their types.
NAMES: labels variables in data file (real data will not have c)
USEVARIABLE: defines which variables are used in the analysis CATEGORICAL: lists which variables are categorical (default is continuous)
CLASSES: provides number of latent classes to be estimated – 2A for A measured attributes
IDVARIABLE: identification number for each respondent ANALYSIS: TYPE=MIXTURE; STARTS=0; PROCESSORS=64;
The analysis section lists details about the estimation procedure.
TYPE: Mixture indicates latent classes will be used – mandatory for DCMs
STARTS: Turns off default multiple random starts option
PROCESSORS: Uses multithreaded algorithm, if computer has more than one processor
OUTPUT: TECH1 TECH5 TECH8 TECH10;
Requests additional output statistics (convergence history; goodness of fit).
SAVEDATA: FORMAT IS f10.5; FILE IS respondent_lcdm.dat; SAVE = CPROBABILITIES;
Instructs Mplus to save respondent estimates to file named respondent_lcdm.dat. File located in same folder as input syntax file.
The remaining two sections provide annotated Mplus syntax for the rest of the analysis.
NCME Diagnostic Measurement Workshop Handout 12
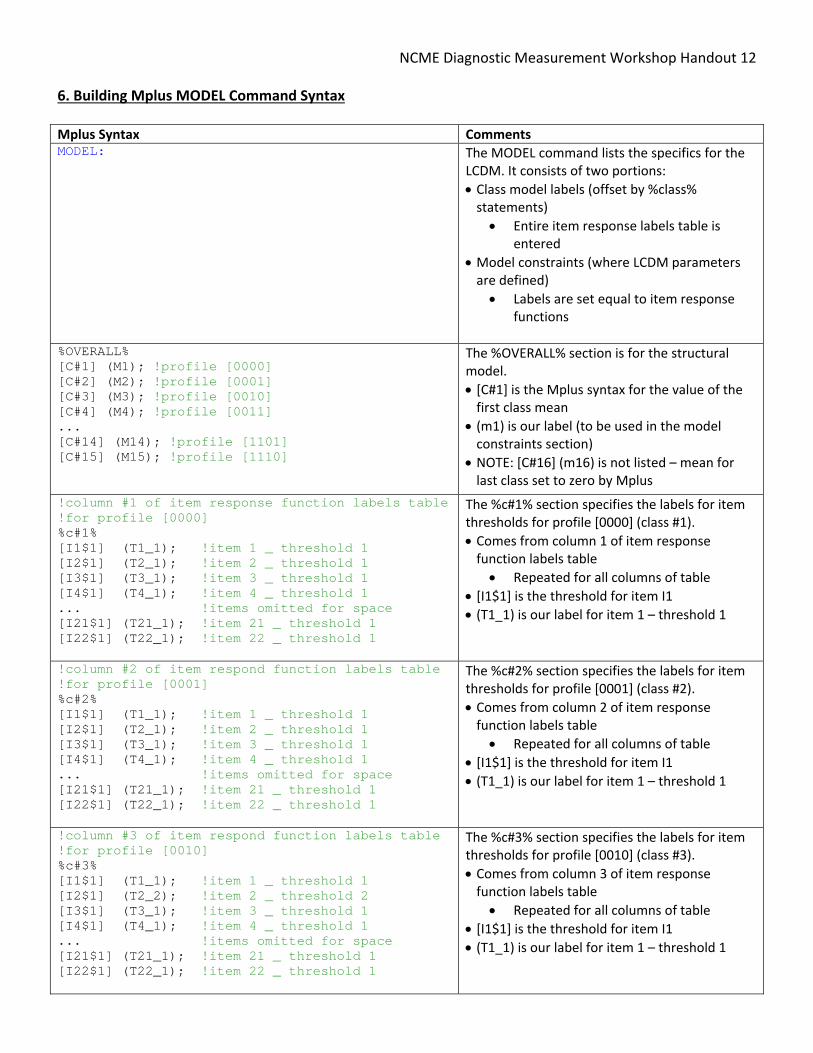
6. Building Mplus MODEL Command Syntax
Mplus Syntax Comments MODEL:
The MODEL command lists the specifics for the LCDM. It consists of two portions:
Class model labels (offset by %class% statements)
Entire item response labels table is entered
Model constraints (where LCDM parameters are defined)
Labels are set equal to item response functions
%OVERALL% [C#1] (M1); !profile [0000] [C#2] (M2); !profile [0001] [C#3] (M3); !profile [0010] [C#4] (M4); !profile [0011] ... [C#14] (M14); !profile [1101] [C#15] (M15); !profile [1110]
The %OVERALL% section is for the structural model.
[C#1] is the Mplus syntax for the value of the first class mean
(m1) is our label (to be used in the model constraints section)
NOTE: [C#16] (m16) is not listed – mean for last class set to zero by Mplus
!column #1 of item response function labels table !for profile [0000] %c#1% [I1$1] (T1_1); !item 1 _ threshold 1 [I2$1] (T2_1); !item 2 _ threshold 1 [I3$1] (T3_1); !item 3 _ threshold 1 [I4$1] (T4_1); !item 4 _ threshold 1 ... !items omitted for space [I21$1] (T21_1); !item 21 _ threshold 1 [I22$1] (T22_1); !item 22 _ threshold 1
The %c#1% section specifies the labels for item thresholds for profile [0000] (class #1).
Comes from column 1 of item response function labels table
Repeated for all columns of table
[I1$1] is the threshold for item I1
(T1_1) is our label for item 1 – threshold 1
!column #2 of item respond function labels table !for profile [0001] %c#2% [I1$1] (T1_1); !item 1 _ threshold 1 [I2$1] (T2_1); !item 2 _ threshold 1 [I3$1] (T3_1); !item 3 _ threshold 1 [I4$1] (T4_1); !item 4 _ threshold 1 ... !items omitted for space [I21$1] (T21_1); !item 21 _ threshold 1 [I22$1] (T22_1); !item 22 _ threshold 1
The %c#2% section specifies the labels for item thresholds for profile [0001] (class #2).
Comes from column 2 of item response function labels table
Repeated for all columns of table
[I1$1] is the threshold for item I1
(T1_1) is our label for item 1 – threshold 1
!column #3 of item respond function labels table !for profile [0010] %c#3% [I1$1] (T1_1); !item 1 _ threshold 1 [I2$1] (T2_2); !item 2 _ threshold 2 [I3$1] (T3_1); !item 3 _ threshold 1 [I4$1] (T4_1); !item 4 _ threshold 1 ... !items omitted for space [I21$1] (T21_1); !item 21 _ threshold 1 [I22$1] (T22_1); !item 22 _ threshold 1
The %c#3% section specifies the labels for item thresholds for profile [0010] (class #3).
Comes from column 3 of item response function labels table
Repeated for all columns of table
[I1$1] is the threshold for item I1
(T1_1) is our label for item 1 – threshold 1

NCME Diagnostic Measurement Workshop Handout 13
Mplus Syntax Comments !column #4 of item respond function labels table !for profile [0011] %c#4% [I1$1] (T1_1); !item 1 _ threshold 1 [I2$1] (T2_2); !item 2 _ threshold 2 [I3$1] (T3_1); !item 3 _ threshold 1 [I4$1] (T4_1); !item 4 _ threshold 1 ... !items omitted for space [I21$1] (T21_1); !item 21 _ threshold 1 [I22$1] (T22_1); !item 22 _ threshold 1
The %c#4% section specifies the labels for item thresholds for profile [0011] (class #4).
Comes from column 4 of item response function labels table
Repeated for all columns of table
[I1$1] is the threshold for item I1
(T1_1) is our label for item 1 – threshold 1
!column #5 of item respond function labels table !for profile [0100] %c#5% [I1$1] (T1_1); !item 1 _ threshold 1 [I2$1] (T2_1); !item 2 _ threshold 1 [I3$1] (T3_2); !item 3 _ threshold 2 [I4$1] (T4_1); !item 4 _ threshold 1 ... !items omitted for space [I21$1] (T21_1); !item 21 _ threshold 1 [I22$1] (T22_2); !item 22 _ threshold 2
The %c#5% section specifies the labels for item thresholds for profile [0100] (class #5).
Comes from column 5 of item response function labels table
Repeated for all columns of table
[I1$1] is the threshold for item I1
(T1_1) is our label for item 1 – threshold 1
!column #6 of item respond function labels table !for profile [0101] %c#6% [I1$1] (T1_1); !item 1 _ threshold 1 [I2$1] (T2_1); !item 2 _ threshold 1 [I3$1] (T3_2); !item 3 _ threshold 2 [I4$1] (T4_1); !item 4 _ threshold 1 ... !items omitted for space [I21$1] (T21_1); !item 21 _ threshold 1 [I22$1] (T22_2); !item 22 _ threshold 2
The %c#6% section specifies the labels for item thresholds for profile [0101] (class #6).
Comes from column 6 of item response function labels table
Repeated for all columns of table
[I1$1] is the threshold for item I1
(T1_1) is our label for item 1 – threshold 1
!column #7 of item respond function labels table !for profile [0110] %c#7% [I1$1] (T1_1); !item 1 _ threshold 1 [I2$1] (T2_2); !item 2 _ threshold 2 [I3$1] (T3_2); !item 3 _ threshold 2 [I4$1] (T4_1); !item 4 _ threshold 1 ... !items omitted for space [I21$1] (T21_1); !item 21 _ threshold 1 [I22$1] (T22_2); !item 22 _ threshold 2
The %c#7% section specifies the labels for item thresholds for profile [0110] (class #7).
Comes from column 7 of item response function labels table
Repeated for all columns of table
[I1$1] is the threshold for item I1
(T1_1) is our label for item 1 – threshold 1
!column #8 of item respond function labels table !for profile [0111] %c#8% [I1$1] (T1_1); !item 1 _ threshold 1 [I2$1] (T2_2); !item 2 _ threshold 2 [I3$1] (T3_2); !item 3 _ threshold 2 [I4$1] (T4_1); !item 4 _ threshold 1 ... !items omitted for space [I21$1] (T21_1); !item 21 _ threshold 1 [I22$1] (T22_2); !item 22 _ threshold 2
The %c#8% section specifies the labels for item thresholds for profile [0111] (class #8).
Comes from column 8 of item response function labels table
Repeated for all columns of table
[I1$1] is the threshold for item I1
(T1_1) is our label for item 1 – threshold 1
NCME Diagnostic Measurement Workshop Handout 14
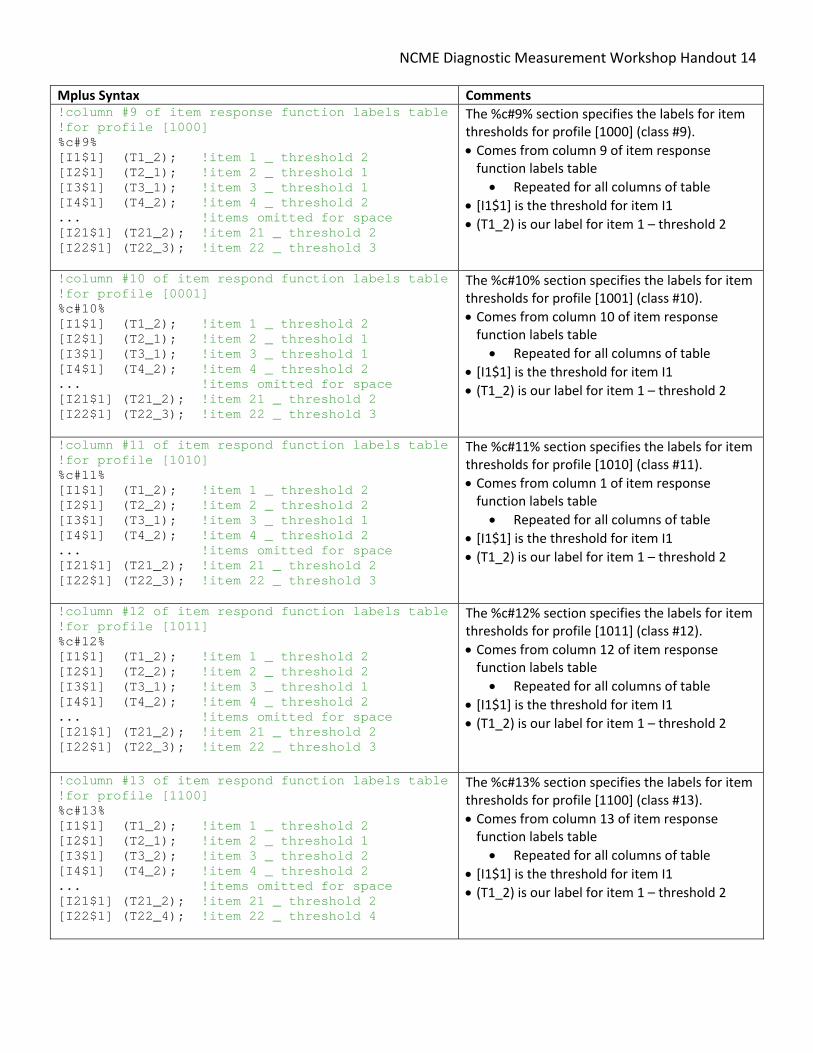
Mplus Syntax Comments !column #9 of item response function labels table !for profile [1000] %c#9% [I1$1] (T1_2); !item 1 _ threshold 2 [I2$1] (T2_1); !item 2 _ threshold 1 [I3$1] (T3_1); !item 3 _ threshold 1 [I4$1] (T4_2); !item 4 _ threshold 2 ... !items omitted for space [I21$1] (T21_2); !item 21 _ threshold 2 [I22$1] (T22_3); !item 22 _ threshold 3
The %c#9% section specifies the labels for item thresholds for profile [1000] (class #9).
Comes from column 9 of item response function labels table
Repeated for all columns of table
[I1$1] is the threshold for item I1
(T1_2) is our label for item 1 – threshold 2
!column #10 of item respond function labels table !for profile [0001] %c#10% [I1$1] (T1_2); !item 1 _ threshold 2 [I2$1] (T2_1); !item 2 _ threshold 1 [I3$1] (T3_1); !item 3 _ threshold 1 [I4$1] (T4_2); !item 4 _ threshold 2 ... !items omitted for space [I21$1] (T21_2); !item 21 _ threshold 2 [I22$1] (T22_3); !item 22 _ threshold 3
The %c#10% section specifies the labels for item thresholds for profile [1001] (class #10).
Comes from column 10 of item response function labels table
Repeated for all columns of table
[I1$1] is the threshold for item I1
(T1_2) is our label for item 1 – threshold 2
!column #11 of item respond function labels table !for profile [1010] %c#11% [I1$1] (T1_2); !item 1 _ threshold 2 [I2$1] (T2_2); !item 2 _ threshold 2 [I3$1] (T3_1); !item 3 _ threshold 1 [I4$1] (T4_2); !item 4 _ threshold 2 ... !items omitted for space [I21$1] (T21_2); !item 21 _ threshold 2 [I22$1] (T22_3); !item 22 _ threshold 3
The %c#11% section specifies the labels for item thresholds for profile [1010] (class #11).
Comes from column 1 of item response function labels table
Repeated for all columns of table
[I1$1] is the threshold for item I1
(T1_2) is our label for item 1 – threshold 2
!column #12 of item respond function labels table !for profile [1011] %c#12% [I1$1] (T1_2); !item 1 _ threshold 2 [I2$1] (T2_2); !item 2 _ threshold 2 [I3$1] (T3_1); !item 3 _ threshold 1 [I4$1] (T4_2); !item 4 _ threshold 2 ... !items omitted for space [I21$1] (T21_2); !item 21 _ threshold 2 [I22$1] (T22_3); !item 22 _ threshold 3
The %c#12% section specifies the labels for item thresholds for profile [1011] (class #12).
Comes from column 12 of item response function labels table
Repeated for all columns of table
[I1$1] is the threshold for item I1
(T1_2) is our label for item 1 – threshold 2
!column #13 of item respond function labels table !for profile [1100] %c#13% [I1$1] (T1_2); !item 1 _ threshold 2 [I2$1] (T2_1); !item 2 _ threshold 1 [I3$1] (T3_2); !item 3 _ threshold 2 [I4$1] (T4_2); !item 4 _ threshold 2 ... !items omitted for space [I21$1] (T21_2); !item 21 _ threshold 2 [I22$1] (T22_4); !item 22 _ threshold 4
The %c#13% section specifies the labels for item thresholds for profile [1100] (class #13).
Comes from column 13 of item response function labels table
Repeated for all columns of table
[I1$1] is the threshold for item I1
(T1_2) is our label for item 1 – threshold 2

NCME Diagnostic Measurement Workshop Handout 15
!column #14 of item respond function labels table !for profile [1101] %c#14% [I1$1] (T1_2); !item 1 _ threshold 2 [I2$1] (T2_1); !item 2 _ threshold 1 [I3$1] (T3_2); !item 3 _ threshold 2 [I4$1] (T4_2); !item 4 _ threshold 2 ... !items omitted for space [I21$1] (T21_2); !item 21 _ threshold 2 [I22$1] (T22_4); !item 22 _ threshold 4
The %c#14% section specifies the labels for item thresholds for profile [1101] (class #14).
Comes from column 14 of item response function labels table
Repeated for all columns of table
[I1$1] is the threshold for item I1
(T1_2) is our label for item 1 – threshold 2
!column #15 of item respond function labels table !for profile [1110] %c#15% [I1$1] (T1_2); !item 1 _ threshold 2 [I2$1] (T2_2); !item 2 _ threshold 2 [I3$1] (T3_2); !item 3 _ threshold 2 [I4$1] (T4_2); !item 4 _ threshold 2 ... !items omitted for space [I21$1] (T21_2); !item 21 _ threshold 2 [I22$1] (T22_4); !item 22 _ threshold 4
The %c#15% section specifies the labels for item thresholds for profile [1110] (class #15).
Comes from column 15 of item response function labels table
Repeated for all columns of table
[I1$1] is the threshold for item I1
(T1_2) is our label for item 1 – threshold 2
!column #16 of item respond function labels table !for profile [1111] %c#16% [I1$1] (T1_2); !item 1 _ threshold 2 [I2$1] (T2_2); !item 2 _ threshold 2 [I3$1] (T3_2); !item 3 _ threshold 2 [I4$1] (T4_2); !item 4 _ threshold 2 ... !items omitted for space [I21$1] (T21_2); !item 21 _ threshold 2 [I22$1] (T22_4); !item 22 _ threshold 4
The %c#16% section specifies the labels for item thresholds for profile [1111] (class #16).
Comes from column 16 of item response function labels table
Repeated for all columns of table
[I1$1] is the threshold for item I1
(T1_2) is our label for item 1 – threshold 2

NCME Diagnostic Measurement Workshop Handout 16
7. Building Mplus MODEL CONSTRAINT Command Syntax (with representative example items shown)
Mplus Syntax Comments MODEL CONSTRAINT: The MODEL CONSTRAINT command is where the
LCDM parameters are defined and the item response function is given for each label.
Structural model given [optional]
Syntax needed for all items !STRUCTURAL MODEL PORTION; !define structural model parameters: !NOTE: ANALYSIS USES UP 2-WAY INTERACTION PARAMETERS ONLY NEW(G_0 G_11 G_12 G_13 G_14 G_212 G_213 G_214 G_223 G_224 G_234); m1= - (G_11+G_12+G_13+G_14+ G_212+G_213+G_214+G_223+G_224+G_234); m2= G_14 - (G_11+G_12+G_13+G_14+ G_212+G_213+G_214+G_223+G_224+G_234); m3= G_13 - (G_11+G_12+G_13+G_14+ G_212+G_213+G_214+G_223+G_224+G_234); m4= G_13+G_14+G_234-(G_11+G_12+G_13+G_14+ G_212+G_213+G_214+G_223+G_224+G_234); m5= G_12 - (G_11+G_12+G_13+G_14+ G_212+G_213+G_214+G_223+G_224+G_234); m6= G_12+G_14+G_224-(G_11+G_12+G_13+G_14+ G_212+G_213+G_214+G_223+G_224+G_234); m7= G_12+G_13+G_223-(G_11+G_12+G_13+G_14+ G_212+G_213+G_214+G_223+G_224+G_234); m8= G_12+G_13+G_14+G_223+G_224+G_234 - (G_11+G_12+G_13+G_14+ G_212+G_213+G_214+G_223+G_224+G_234); m9= G_11 - (G_11+G_12+G_13+G_14+ G_212+G_213+G_214+G_223+G_224+G_234); m10= G_11+G_14+G_214-(G_11+G_12+G_13+G_14+ G_212+G_213+G_214+G_223+G_224+G_234); m11= G_11+G_13+G_213-(G_11+G_12+G_13+G_14+ G_212+G_213+G_214+G_223+G_224+G_234); m12= G_11+G_13+G_14+G_213+G_214+G_234 - (G_11+G_12+G_13+G_14+ G_212+G_213+G_214+G_223+G_224+G_234); m13= G_11+G_12+G_212 - (G_11+G_12+G_13+G_14+G_212+G_213+G_214+ G_223+G_224+G_234); m14= G_11+G_12+G_14+G_212+G_214+G_224 - (G_11+G_12+G_13+G_14+ G_212+G_213+G_214+G_223+G_224+G_234); m15= G_11+G_12+G_13+G_212+G_213+G_223 - (G_11+G_12+G_13+G_14+ G_212+G_213+G_214+G_223+G_224+G_234);
The structural model section.
Taken from structural model specification table
NEW: creates new parameters for Mplus to use in estimation
G_[ea1…]: label for gamma parameter; structural model effect parameter
e: effect level (0‐ intercept; 1‐ main effect; 2 – two way interaction…)
a1…: attribute(s) to which effect applies; number of attributes is equal to effect level e
NCME Diagnostic Measurement Workshop Handout 17
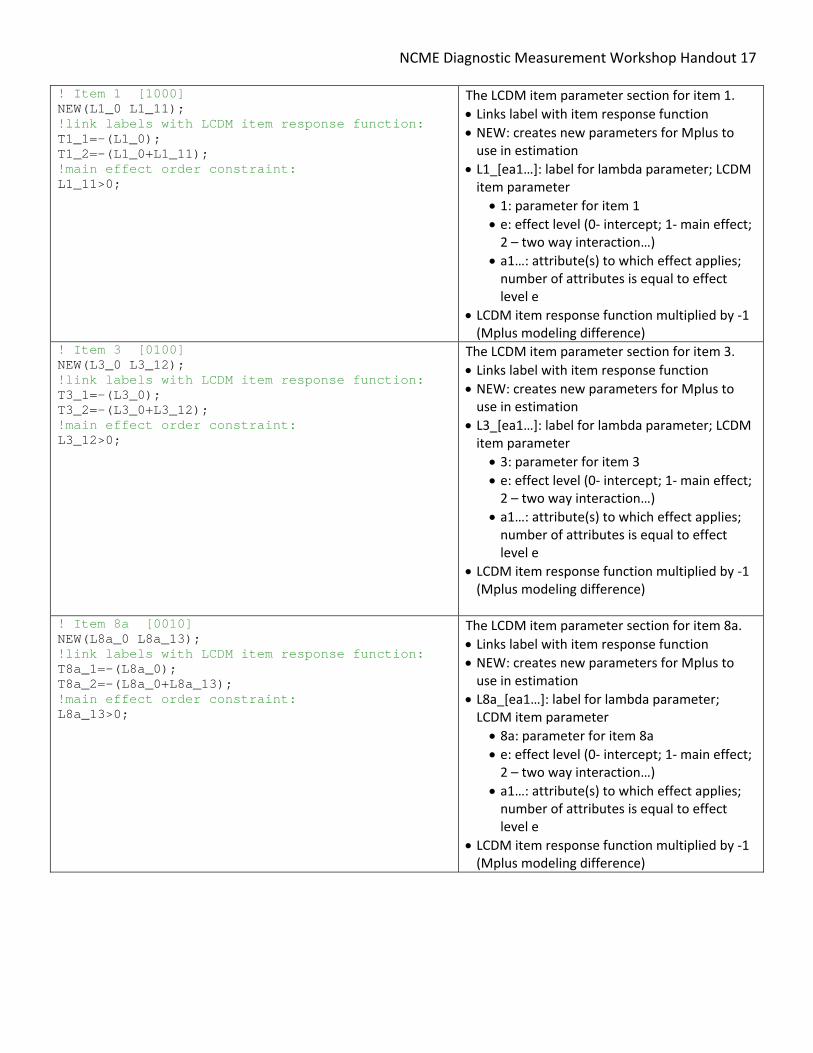
! Item 1 [1000] NEW(L1_0 L1_11); !link labels with LCDM item response function: T1_1=-(L1_0); T1_2=-(L1_0+L1_11); !main effect order constraint: L1_11>0;
The LCDM item parameter section for item 1.
Links label with item response function
NEW: creates new parameters for Mplus to use in estimation
L1_[ea1…]: label for lambda parameter; LCDM item parameter
1: parameter for item 1
e: effect level (0‐ intercept; 1‐ main effect; 2 – two way interaction…)
a1…: attribute(s) to which effect applies; number of attributes is equal to effect level e
LCDM item response function multiplied by ‐1 (Mplus modeling difference)
! Item 3 [0100] NEW(L3_0 L3_12); !link labels with LCDM item response function: T3_1=-(L3_0); T3_2=-(L3_0+L3_12); !main effect order constraint: L3_12>0;
The LCDM item parameter section for item 3.
Links label with item response function
NEW: creates new parameters for Mplus to use in estimation
L3_[ea1…]: label for lambda parameter; LCDM item parameter
3: parameter for item 3
e: effect level (0‐ intercept; 1‐ main effect; 2 – two way interaction…)
a1…: attribute(s) to which effect applies; number of attributes is equal to effect level e
LCDM item response function multiplied by ‐1 (Mplus modeling difference)
! Item 8a [0010] NEW(L8a_0 L8a_13); !link labels with LCDM item response function: T8a_1=-(L8a_0); T8a_2=-(L8a_0+L8a_13); !main effect order constraint: L8a_13>0;
The LCDM item parameter section for item 8a.
Links label with item response function
NEW: creates new parameters for Mplus to use in estimation
L8a_[ea1…]: label for lambda parameter; LCDM item parameter
8a: parameter for item 8a
e: effect level (0‐ intercept; 1‐ main effect; 2 – two way interaction…)
a1…: attribute(s) to which effect applies; number of attributes is equal to effect level e
LCDM item response function multiplied by ‐1 (Mplus modeling difference)
NCME Diagnostic Measurement Workshop Handout 18
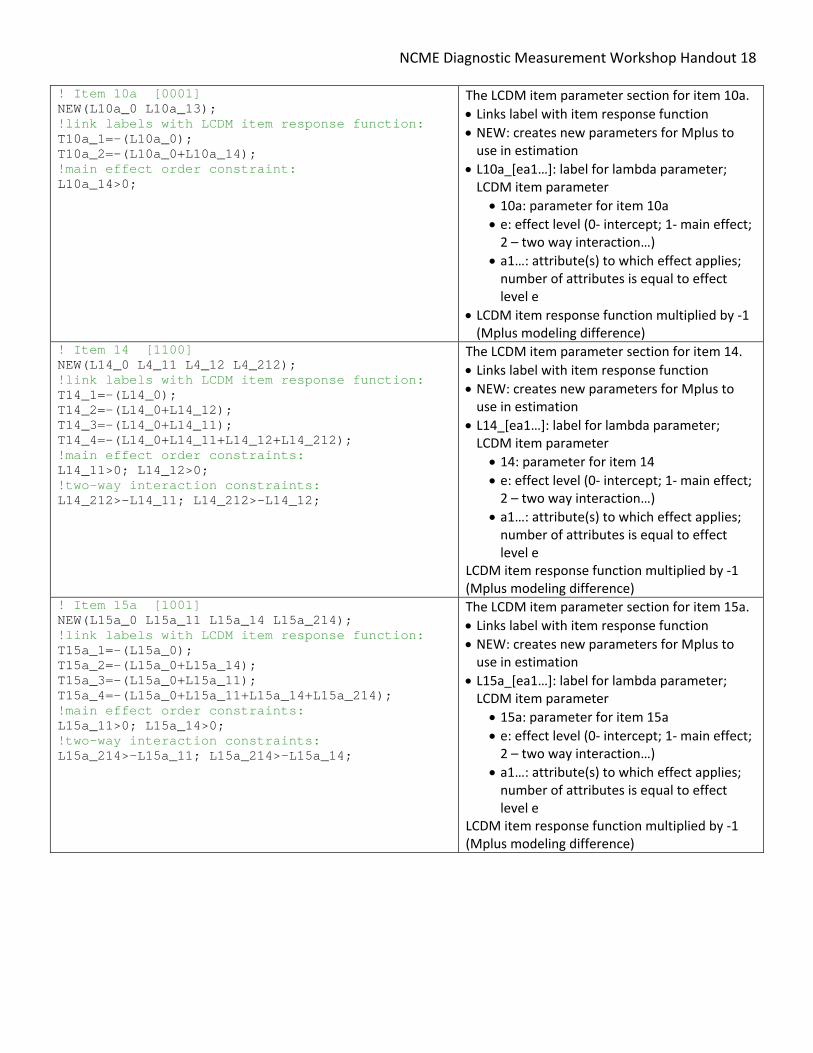
! Item 10a [0001] NEW(L10a_0 L10a_13); !link labels with LCDM item response function: T10a_1=-(L10a_0); T10a_2=-(L10a_0+L10a_14); !main effect order constraint: L10a_14>0;
The LCDM item parameter section for item 10a.
Links label with item response function
NEW: creates new parameters for Mplus to use in estimation
L10a_[ea1…]: label for lambda parameter; LCDM item parameter
10a: parameter for item 10a
e: effect level (0‐ intercept; 1‐ main effect; 2 – two way interaction…)
a1…: attribute(s) to which effect applies; number of attributes is equal to effect level e
LCDM item response function multiplied by ‐1 (Mplus modeling difference)
! Item 14 [1100] NEW(L14_0 L4_11 L4_12 L4_212); !link labels with LCDM item response function: T14_1=-(L14_0); T14_2=-(L14_0+L14_12); T14_3=-(L14_0+L14_11); T14_4=-(L14_0+L14_11+L14_12+L14_212); !main effect order constraints: L14_11>0; L14_12>0; !two-way interaction constraints: L14_212>-L14_11; L14_212>-L14_12;
The LCDM item parameter section for item 14.
Links label with item response function
NEW: creates new parameters for Mplus to use in estimation
L14_[ea1…]: label for lambda parameter; LCDM item parameter
14: parameter for item 14
e: effect level (0‐ intercept; 1‐ main effect; 2 – two way interaction…)
a1…: attribute(s) to which effect applies; number of attributes is equal to effect level e
LCDM item response function multiplied by ‐1 (Mplus modeling difference)
! Item 15a [1001] NEW(L15a_0 L15a_11 L15a_14 L15a_214); !link labels with LCDM item response function: T15a_1=-(L15a_0); T15a_2=-(L15a_0+L15a_14); T15a_3=-(L15a_0+L15a_11); T15a_4=-(L15a_0+L15a_11+L15a_14+L15a_214); !main effect order constraints: L15a_11>0; L15a_14>0; !two-way interaction constraints: L15a_214>-L15a_11; L15a_214>-L15a_14;
The LCDM item parameter section for item 15a.
Links label with item response function
NEW: creates new parameters for Mplus to use in estimation
L15a_[ea1…]: label for lambda parameter; LCDM item parameter
15a: parameter for item 15a
e: effect level (0‐ intercept; 1‐ main effect; 2 – two way interaction…)
a1…: attribute(s) to which effect applies; number of attributes is equal to effect level e
LCDM item response function multiplied by ‐1 (Mplus modeling difference)
NCME Diagnostic Measurement Workshop Handout 19
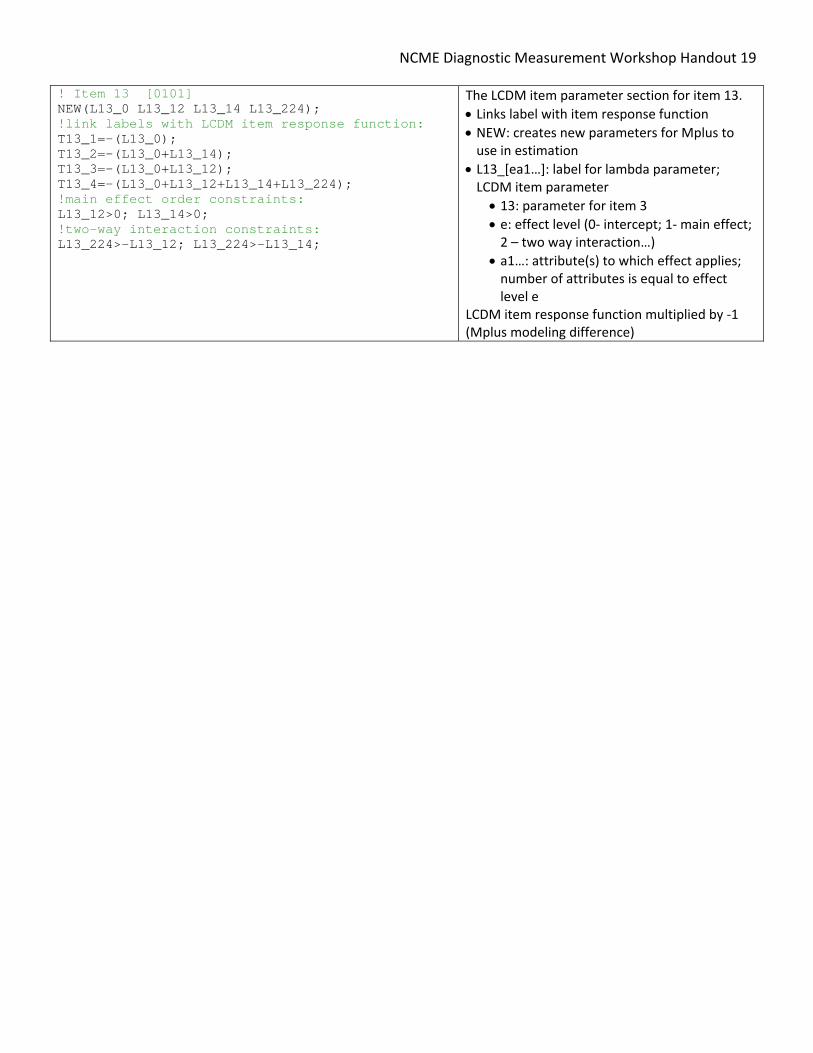
! Item 13 [0101] NEW(L13_0 L13_12 L13_14 L13_224); !link labels with LCDM item response function: T13_1=-(L13_0); T13_2=-(L13_0+L13_14); T13_3=-(L13_0+L13_12); T13_4=-(L13_0+L13_12+L13_14+L13_224); !main effect order constraints: L13_12>0; L13_14>0; !two-way interaction constraints: L13_224>-L13_12; L13_224>-L13_14;
The LCDM item parameter section for item 13.
Links label with item response function
NEW: creates new parameters for Mplus to use in estimation
L13_[ea1…]: label for lambda parameter; LCDM item parameter
13: parameter for item 3
e: effect level (0‐ intercept; 1‐ main effect; 2 – two way interaction…)
a1…: attribute(s) to which effect applies; number of attributes is equal to effect level e
LCDM item response function multiplied by ‐1 (Mplus modeling difference)

NCME Diagnostic Measurement Workshop Handout 20
Understanding Mplus Output
Once the syntax has been built and Mplus finishes estimating the model, the Mplus output contains all the
information needed to evaluate the model run. Mplus syntax is voluminous in its size, with only a few
sections of interest (and many that are redundant). Each section is discussed in the following pages, in
order of appearance in the output file.
1. Tests of Model Fit Output Section
2. Final class counts and proportions
3. New/Additional parameters
4. Technical 10

NCME Diagnostic Measurement Workshop Handout 21
Tests of Model Fit Output Section
MODEL FIT INFORMATION Number of Free Parameters 71 Loglikelihood H0 Value -14257.169 H0 Scaling Correction Factor 1.063 for MLR Information Criteria Akaike (AIC) 28656.338 Bayesian (BIC) 29004.075 Sample-Size Adjusted BIC 28778.576 (n* = (n + 2) / 24)
Provides basic model fit information
Information Criteria: Used to compare model fit for non‐nested models (smaller is better)
NCME Diagnostic Measurement Workshop Handout 22
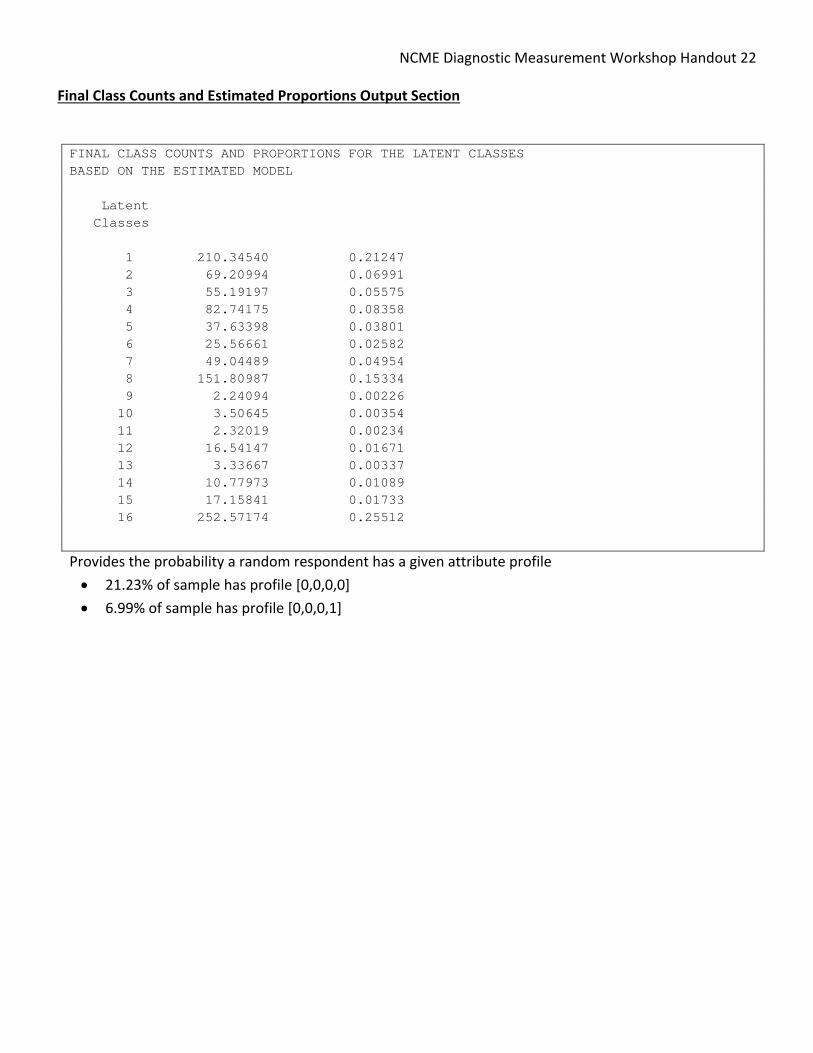
Final Class Counts and Estimated Proportions Output Section
FINAL CLASS COUNTS AND PROPORTIONS FOR THE LATENT CLASSES BASED ON THE ESTIMATED MODEL Latent Classes 1 210.34540 0.21247 2 69.20994 0.06991 3 55.19197 0.05575 4 82.74175 0.08358 5 37.63398 0.03801 6 25.56661 0.02582 7 49.04489 0.04954 8 151.80987 0.15334 9 2.24094 0.00226 10 3.50645 0.00354 11 2.32019 0.00234 12 16.54147 0.01671 13 3.33667 0.00337 14 10.77973 0.01089 15 17.15841 0.01733 16 252.57174 0.25512
Provides the probability a random respondent has a given attribute profile
21.23% of sample has profile [0,0,0,0]
6.99% of sample has profile [0,0,0,1]
NCME Diagnostic Measurement Workshop Handout 23
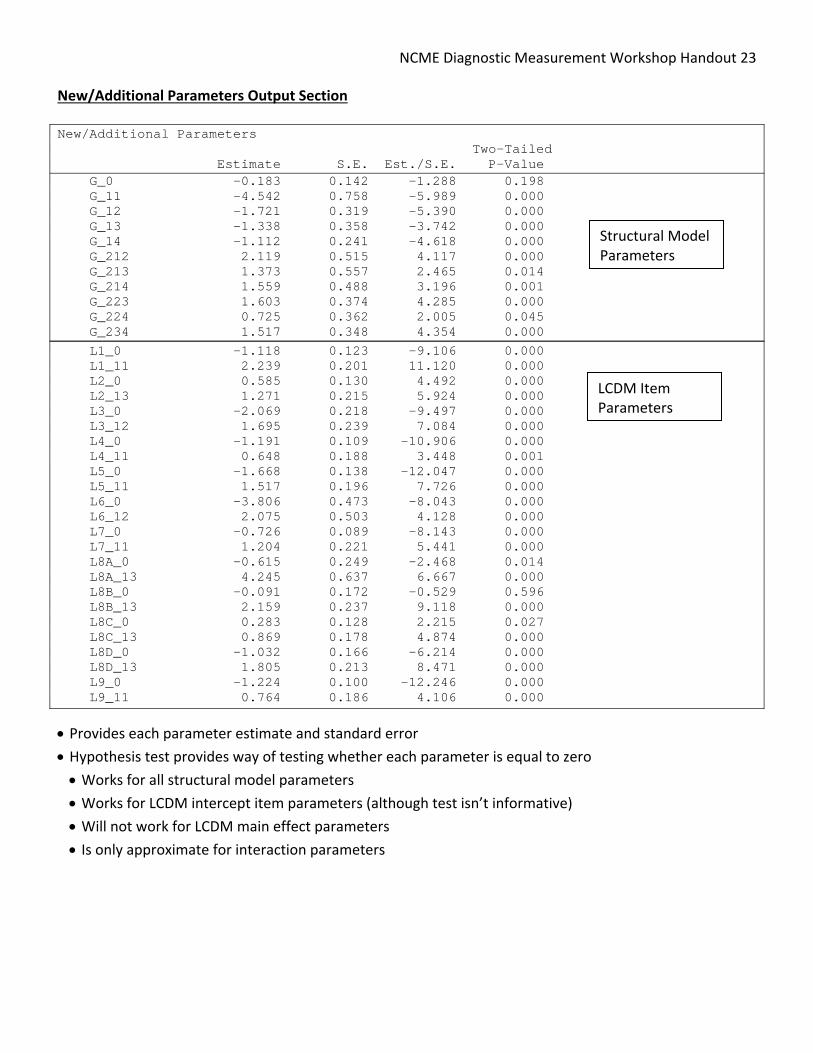
New/Additional Parameters Output Section
New/Additional Parameters Two-Tailed Estimate S.E. Est./S.E. P-Value G_0 -0.183 0.142 -1.288 0.198 G_11 -4.542 0.758 -5.989 0.000 G_12 -1.721 0.319 -5.390 0.000 G_13 -1.338 0.358 -3.742 0.000 G_14 -1.112 0.241 -4.618 0.000 G_212 2.119 0.515 4.117 0.000 G_213 1.373 0.557 2.465 0.014 G_214 1.559 0.488 3.196 0.001 G_223 1.603 0.374 4.285 0.000 G_224 0.725 0.362 2.005 0.045 G_234 1.517 0.348 4.354 0.000
L1_0 -1.118 0.123 -9.106 0.000 L1_11 2.239 0.201 11.120 0.000 L2_0 0.585 0.130 4.492 0.000 L2_13 1.271 0.215 5.924 0.000 L3_0 -2.069 0.218 -9.497 0.000 L3_12 1.695 0.239 7.084 0.000 L4_0 -1.191 0.109 -10.906 0.000 L4_11 0.648 0.188 3.448 0.001 L5_0 -1.668 0.138 -12.047 0.000 L5_11 1.517 0.196 7.726 0.000 L6_0 -3.806 0.473 -8.043 0.000 L6_12 2.075 0.503 4.128 0.000 L7_0 -0.726 0.089 -8.143 0.000 L7_11 1.204 0.221 5.441 0.000 L8A_0 -0.615 0.249 -2.468 0.014 L8A_13 4.245 0.637 6.667 0.000 L8B_0 -0.091 0.172 -0.529 0.596 L8B_13 2.159 0.237 9.118 0.000 L8C_0 0.283 0.128 2.215 0.027 L8C_13 0.869 0.178 4.874 0.000 L8D_0 -1.032 0.166 -6.214 0.000 L8D_13 1.805 0.213 8.471 0.000 L9_0 -1.224 0.100 -12.246 0.000 L9_11 0.764 0.186 4.106 0.000
Provides each parameter estimate and standard error
Hypothesis test provides way of testing whether each parameter is equal to zero
Works for all structural model parameters
Works for LCDM intercept item parameters (although test isn’t informative)
Will not work for LCDM main effect parameters
Is only approximate for interaction parameters
Structural Model Parameters
LCDM Item Parameters

NCME Diagnostic Measurement Workshop Handout 24
Technical 10 Output Section
BIVARIATE MODEL FIT INFORMATION Estimated Probabilities Standardized Variable Variable H1 H0 Residual (z-score) I1 I2 Category 1 Category 1 0.148 0.140 0.744 Category 1 Category 2 0.446 0.456 -0.629 Category 2 Category 1 0.069 0.077 -0.986 Category 2 Category 2 0.338 0.328 0.678 Bivariate Pearson Chi-Square 1.898 Bivariate Log-Likelihood Chi-Square 1.922
Provides quick goodness of fit check for pairs of items – similar to raw residuals in SEM