
NCHRP Report 772: Evaluating the Performance of Corridors...
34
5/1/2015 1 NCHRP Report 772: Evaluating the Performance of Corridors with Roundabouts Transportation Education Series April 28, 2015 – Juneau April 29, 2015 – Anchorage April 30, 2015 – Fairbanks Photo: Lee Rodegerdts Contractors • Kittelson & Associates, Inc. – Lee Rodegerdts - Principal Investigator – Brian Ray, Pete Jenior, Zachary Bugg • Institute for Transportation Research & Education (North Carolina State University) – Bastian Schroeder • Texas Transportation Institute (Texas A&M University) – Marcus Brewer • Write Rhetoric – Danica Rhoades
Transcript of NCHRP Report 772: Evaluating the Performance of Corridors...

5/1/2015
1
NCHRP Report 772: Evaluating the
Performance of Corridors with
Roundabouts
Transportation Education
Series
April 28, 2015 – Juneau
April 29, 2015 – Anchorage
April 30, 2015 – Fairbanks
Ph
oto
: Le
e R
od
eg
erd
ts
Contractors
• Kittelson & Associates, Inc.
– Lee Rodegerdts - Principal Investigator
– Brian Ray, Pete Jenior, Zachary Bugg
• Institute for Transportation Research & Education (North
Carolina State University)
– Bastian Schroeder
• Texas Transportation Institute (Texas A&M University)
– Marcus Brewer
• Write Rhetoric
– Danica Rhoades

5/1/2015
2
Project Panel
• Phil Demosthenes, consultant (chair)
• Stephen Bass, Kansas DOT
• Wylie Bearup, City of Phoenix, AZ
• Sarah Bowman, Walkable Communities, Inc.
• Robert Fenton, Ohio State University
• Theron Knause, Virginia DOT
• Mark Lenters, Ourston Roundabout Engineering, Inc.
• Avijit Maji, Maryland State Highway Administration
• Dina Swires, Washington State DOT
• Rich Cunard, TRB
• Hillary Isebrands, FHWA
• Lori Sundstrom, NCHRP Program Officer
Presentation overview
• Project objective
• Project scope
• Corridors and data
collection
• Project products
Ph
oto
: Le
e R
od
eg
erd
ts

5/1/2015
3
Project Objective
• Focus on three or more roundabouts in series
Ph
oto
: Le
e R
od
eg
erd
tsProject Scope
• Document existing roundabout corridors
– Collect and evaluate field data
– Identify “lessons learned” from agencies
• Prepare methods and guidance for alternatives
evaluations
– Prepare predictive methods based on observed field data
for incorporation into key resource documents such as
HCM
– Prepare “Corridor Comparison Document” to
demonstrate broader evaluation process

5/1/2015
4
Site Selection
• 58 roundabout corridors identified in US (as of
2011)
• Nine corridors selected
• Geographically dispersed across the U.S., with some
grouping for data collection efficiency
• Mix of urban, suburban, and rural environments
• Mix of single-lane and multilane roundabouts
• Wide range of circumstances leading to each
corridor
Roundabout Corridors in US (as of 2011)

5/1/2015
5
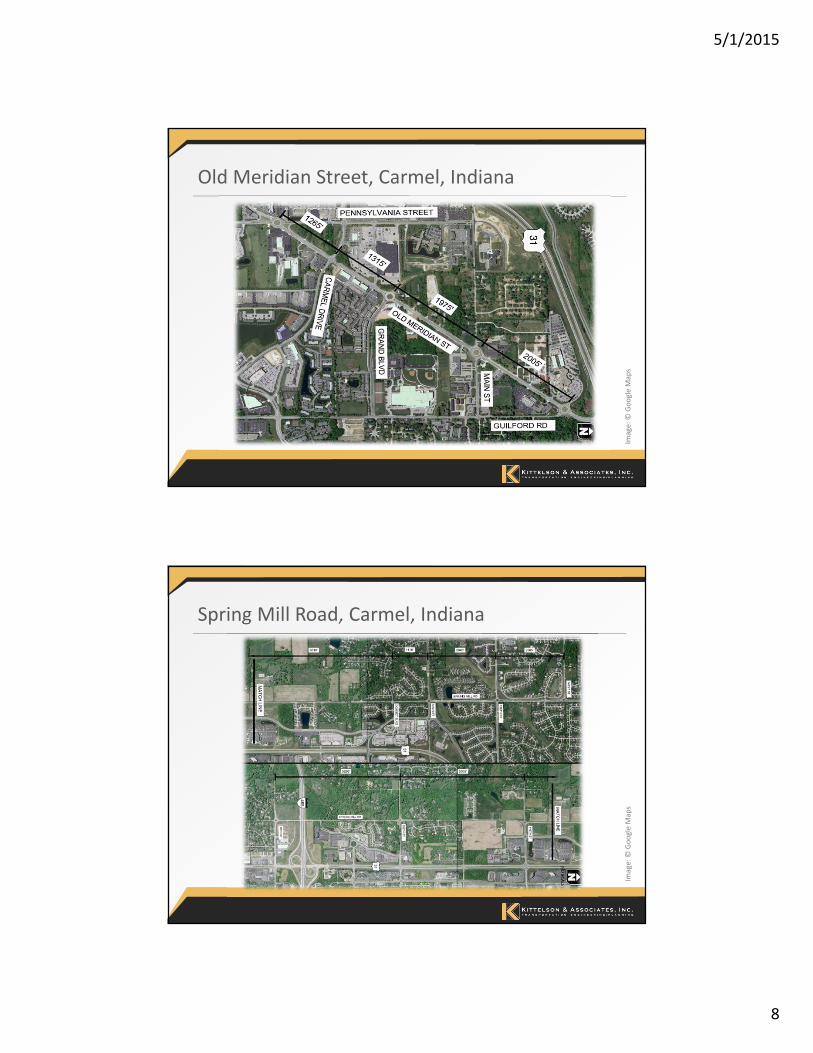
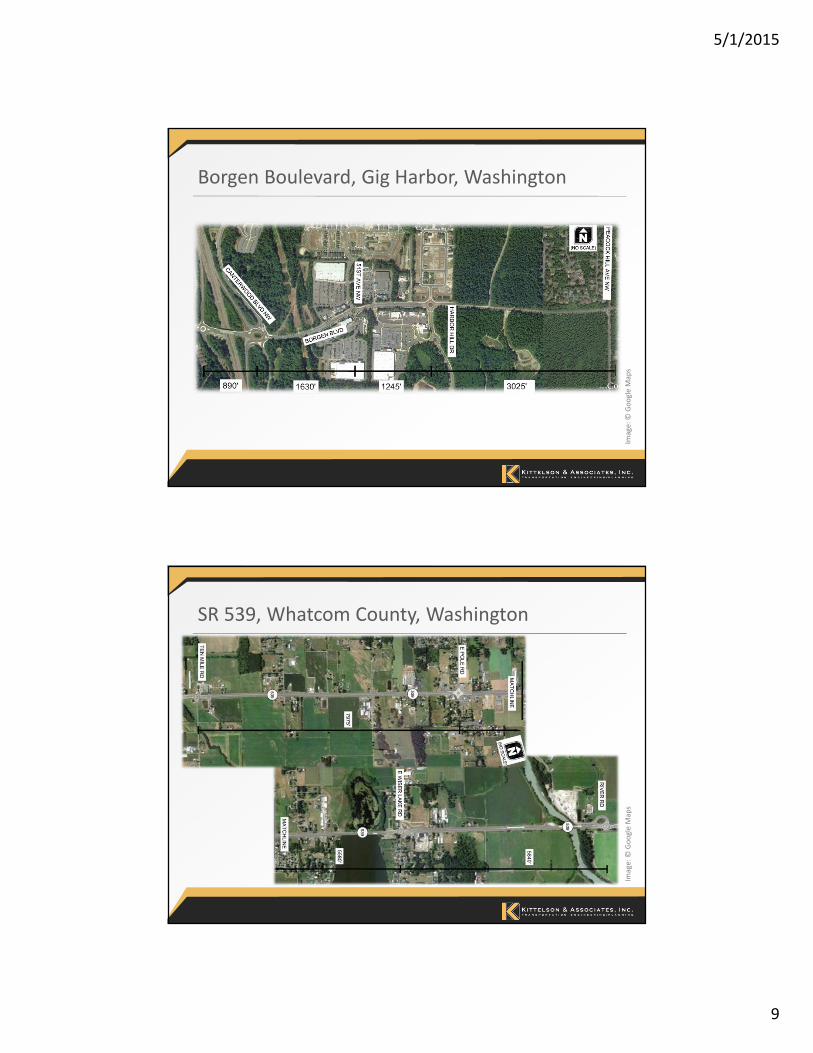
Data Collection Corridors
• MD 216, Scaggsville, MD (pilot study site)
• La Jolla Boulevard, San Diego, CA (pilot study site)
• Old Meridian Street, Carmel, IN
• Spring Mill Road, Carmel, IN
• Borgen Boulevard, Gig Harbor, WA
• SR 539, Whatcom County, WA
• Golden Road, Golden, CO
• Avon Road, Avon, CO
• SR 67, Malta, NY
Data Collection Methods
• Travel time runs using GPS
• Bluetooth™ data collection (pilot sites only)
• Video recording of intersections (primarily for peak hour turning movement extraction)
• Spot speed samples
• Photographs and field notes
• Interviews with corridor owners/operators
• Data collection methods refined after pilot study locations (focused on GPS instead of Bluetooth)

5/1/2015
6
MD 216, Scaggsville, Maryland
Ima
ge
: ©
Go
og
le M
ap
s
La Jolla Boulevard, San Diego, CaliforniaIm
ag
e:
© G
oo
gle
Ma
ps

5/1/2015
7
Example Time-Space Trajectory
(La Jolla Boulevard SB, San Diego, CA)
Example Speed Profile for Urban Corridor
(La Jolla Boulevard SB, San Diego, CA)
5/1/2015
8
Old Meridian Street, Carmel, Indiana
Ima
ge
: ©
Go
og
le M
ap
s
Spring Mill Road, Carmel, IndianaIm
ag
e:
© G
oo
gle
Ma
ps
5/1/2015
9
Borgen Boulevard, Gig Harbor, Washington
Ima
ge
: ©
Go
og
le M
ap
s
SR 539, Whatcom County, WashingtonIm
ag
e:
© G
oo
gle
Ma
ps

5/1/2015
10
Example Speed Profile for Rural Corridor
(SR 539 NB, Whatcom County, WA)
Golden Road, Golden, ColoradoIm
ag
e:
© G
oo
gle
Ma
ps

5/1/2015
11
Avon Road, Avon, Colorado
Ima
ge
: ©
Go
og
le M
ap
s
SR 67, Malta, New YorkIm
ag
e:
© G
oo
gle
Ma
ps

5/1/2015
12
Example Speed Profile through Interchange
(SR 67 EB, Malta, NY)
Corridor Owner/Operator Interviews
• Wide variety of experiences leading to development
of corridors
• Reinforces motivation of Corridor Comparison
Document to evaluate corridors on case-by-case
basis

5/1/2015
13
Corridor Owner/Operators – Lessons Learned
• Once several roundabouts built on a corridor, more
are likely
– Increased acceptance of roundabouts
– Concerns about signal queue spillback
– Access management
– Consistency within corridor
• Traffic analysis typically analyzed roundabouts in
isolation
• Agency champion is key
Modeling
• New predictive tools for estimating operational
performance of roundabout corridors
• Created for incorporation into HCM to enable
signals-versus-roundabouts predictive comparisons
• Process of incorporating into HCM is underway with
development of HCM 2010 Major Update

5/1/2015
14
Modeling Framework
Modeling Framework
• New models developed by
this project:
– Free-flow speed (Step B)
– Roundabout Influence Area
Length (Step C)
– Geometric Delay (Step H)
– Impeded Delay (Step I) –
analogous to control delay
• Fits into existing Urban
Streets Procedure

5/1/2015
15
Segment and Sub-Segment Definitions
Operations Comparisons with “Equivalent Signalized
Corridors”
• High-level comparison to suggest trends if any
• “Equivalent” signalized corridors developed for each
roundabout corridor
• Estimate travel time (TT) performance using HCM-
based and simple simulation-based analysis
• Compare estimated TT to field-measured
roundabout performance
5/1/2015
16
Operations Comparisons with “Equivalent Signalized
Corridors” (cont.)
• Neither control option consistently results in
reduced travel time or delay for through routes
• Site-specific evaluation is key
• Roundabouts tends to improve travel time for routes
with a left turn onto or off a corridor
• Roundabouts are more likely to improve travel time
with irregular intersection spacing
Corridor Comparison Document
• Chapter 1: Introduction
• Chapter 2: Users of Arterials
• Chapter 3: Project Planning Process
– 3.1 Project Initiation (incl. understanding of context)
– 3.2 Concept Development
– 3.3 Alternatives Analysis
• Chapter 4: Performance Measures
• Chapter 5: Example Applications

5/1/2015
17
Understanding of
Context
• Select performance
metrics that are
important for the
corridor being
studied
• Develop and
evaluate reasonable
alternatives
Potential Performance
Measures
• Categories:
– Quality of Service
– Safety
– Environmental
– Costs
– Community Values
– Other
5/1/2015
18
Example Applications
• Show use of:
– Corridor Comparison Document
– Roundabout travel time model developed for this project
• Examples
– New suburban greenfield corridor
– Community enhancement on existing urban corridor
– Existing rural corridor in context sensitive, suburbanizing
area
– Existing suburban corridor undergoing operations and
safety evaluation
Questions?P
ho
to:
Lee
Ro
de
ge
rdts

5/1/2015
19
Lee A. Rodegerdts
FHWA TOPR 34: Accelerating
Roundabout Implementation in the
United States
Motivation for Research
• Roundabouts are one of FHWA’s Nine Proven
Countermeasures
• Nearly 15 years since first edition of Roundabouts:
An Informational Guide, roundabouts have yet to be
fully embraced by many agencies
• FHWA observed need for strategic undertaking to
accelerate roundabout implementation

5/1/2015
20
Goal of TOPR 34
• Uncertainty about a small number of key issues
seemed to be hampering more widespread
roundabout implementation
• FHWA well-positioned to undertake evaluations of
these key issues that will result in better guidance to
practitioner community
• Emphasis on real world, field-based data
TOPR 34 Tasks
• Assessment of Rectangular Rapid Flashing Beacons
(RRFB) for accessibility at multilane roundabouts
• Reassessment of capacity models for the Highway
Capacity Manual
• Assessing emissions characteristics of roundabouts
compared to signalized intersections
• Evaluation of fatal and severe injury crashes

5/1/2015
21
TOPR 34 Tasks (cont.)
• Evaluation of geometric parameters for trucks
• Assessment of crosswalk location and design
• Assessment of traffic control device treatments at
multilane roundabouts
Contractors
• Virginia Tech Transportation Institute
– Ron Gibbons, Contract Manager
• Kittelson & Associates, Inc.
– Lee Rodegerdts, Principal Investigator
• Institute of Transportation Research and Education
(ITRE) at North Carolina State University
– Bastian Schroeder, Co-Principal Investigator
• Task Leaders from all three organizations

5/1/2015
22
Reassessment of Roundabout
Capacity Models for the HCM
Ph
oto
: Le
e R
od
eg
erd
ts
Motivation for Research
• New capacity models for roundabouts added to
HCM 2010 based on NCHRP Report 572 (2007)
• Concern throughout user community that capacities
are lower than currently being observed
• Results of perceived capacity underestimation is
either oversizing roundabouts or avoiding them
altogether

5/1/2015
23
Purpose of Research Effort
• Collect new set of national field data (2012-2013)
– NCHRP Report 572 data: 2003
• Determine fit of HCM 2010 model to new data
• Determine best course of action to improve fit as
needed within constraints of time and budget:
– Calibrate using critical headway and follow-up time
– Develop new exponential or linear regression model
– Identify flow-based or geometric-based factors if
beneficial in improving model fit
Site Selection
• 23 intersections across the United States:
– Colorado (5)
– Indiana (7, all in Carmel)
– New York (2)
– Virginia (1)
– Vermont (1)
– Washington (7)
• Each approach studied at a given intersection is
considered a “site” for this analysis

5/1/2015
24
Data Collection
• Video recording of 48 hours at each site (2012-2013)
• Cameras focused on entering-circulating-exiting area
• Back of queue not always observed
– Camera angles
– Saturated but slowly rolling queues
Conditions for Data to be Usable
• Looking only for data periods that represent
capacity conditions: continuous queuing over the
entire study interval (1 min)
• Two criteria examined:
– Minimum queue recorded (where possible)
– Maximum move-up time <= 6 s
• Camera angle prevented visibility of queue, or
• Conditions saturated but rolling queue
• Generally consistent with NCHRP Report 572
methods

5/1/2015
25
Usable Data for Capacity Analysis
• Single-lane sites: 876 minutes
• Multilane sites: 1,285 minutes (all types)
– Multilane 1x2: 56
– Multilane 2x1: 231 right lane, 288 left lane
– Multilane 2x2: 365 right lane, 345 left lane
• NCHRP Report 572: single-lane 318 minutes, multilane 383 minutes (all types)
• Significantly larger dataset than for NCHRP Report 572
���� � 216
�2010:
Fit of HCM 2010 Model: Single-Lane
5/1/2015
26
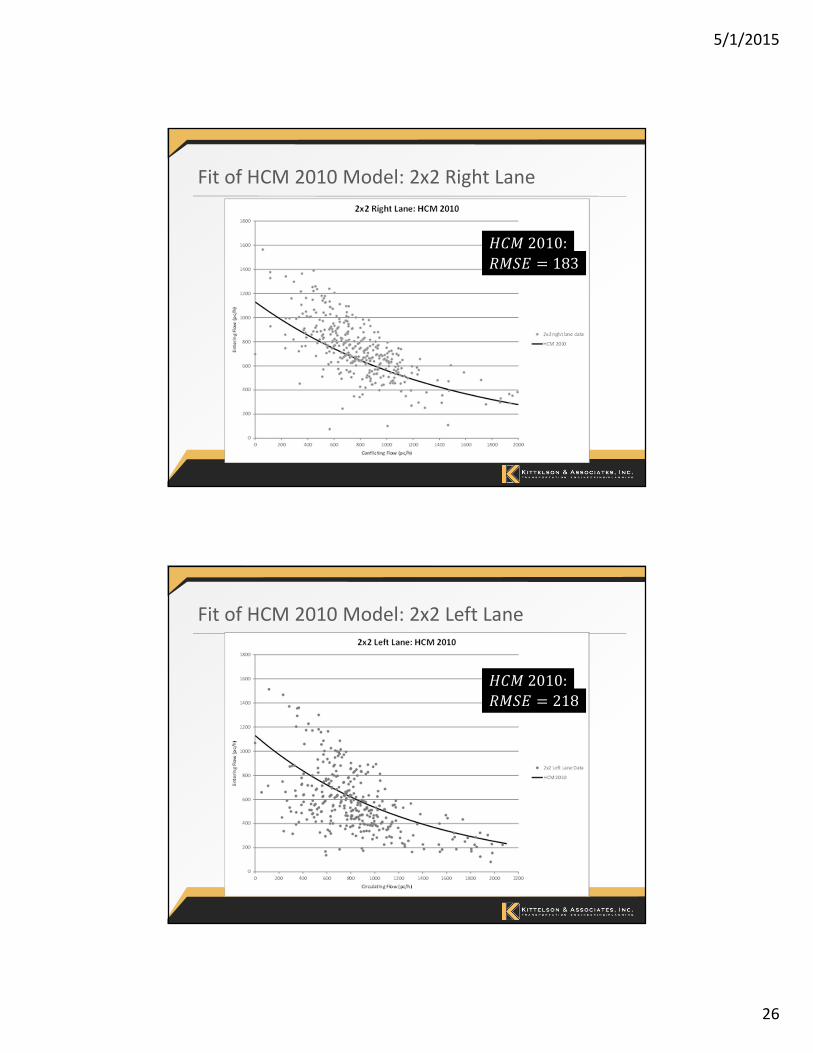
Fit of HCM 2010 Model: 2x2 Right Lane
���� � 183
�2010:
Fit of HCM 2010 Model: 2x2 Left Lane
���� � 218
�2010:

5/1/2015
27
Fit of HCM 2010 Model: 2x1 Right Lane
���� � 255
�2010:
Fit of HCM 2010 Model: 2x1 Left Lane
���� � 224
�2010:

5/1/2015
28
Modeling Techniques
• Basic model forms analyzed:
– Exponential: �� � ������
– Linear: �� � � � ���
• Gap acceptance parameters for HCM 2010
calibration (measured under queued conditions)
– Critical Headway (��)
– Follow-Up Time (��)
• Model parameters set to minimize Root Mean
Square Error (RMSE) when allowed to vary
���� � 182
���. �� !�""#$%:
Example of Regression: Single-Lane Sites
Desire anchor for intercept
���� � 186
&#%�'!�� !�""#$%:

5/1/2015
29
Follow-Up Time Field Measurements
• Measured under queued conditions
• Outliers greater than mean+ 3 s.d. removed
• Intercept A = 3600/tf
State Number
Observations
Mean Standard
Deviation
Intercept
Single-Lane 2,647 2.6 1.0 1,380
2x2 Right Lane 1,964 2.5 1.0 1,420
2x2 Left Lane 1,563 2.7 1.2 1,350
2x1 Right Lane 886 2.3 0.9 1,560
2x1 Left Lane 948 2.1 0.6 1,710
1x2 318 2.5 0.9 1,440
Single-Lane Sites: Calibrated to National Follow-Up
Time
���� � 190
���. �� !�""#$%:
���� � 223
&#%�'!�� !�""#$%:
5/1/2015
30
0
200
400
600
800
1000
1200
1400
1600
1800
0 200 400 600 800 1000 1200 1400 1600 1800 2000
En
teri
ng
Flo
w (
pc/
h)
Conflicting Flow (pc/h)
2x2 Right Lane: Calibration to tf
2x2 Right Lane Data
Exp Regr
Linear Regr
HCM 2010
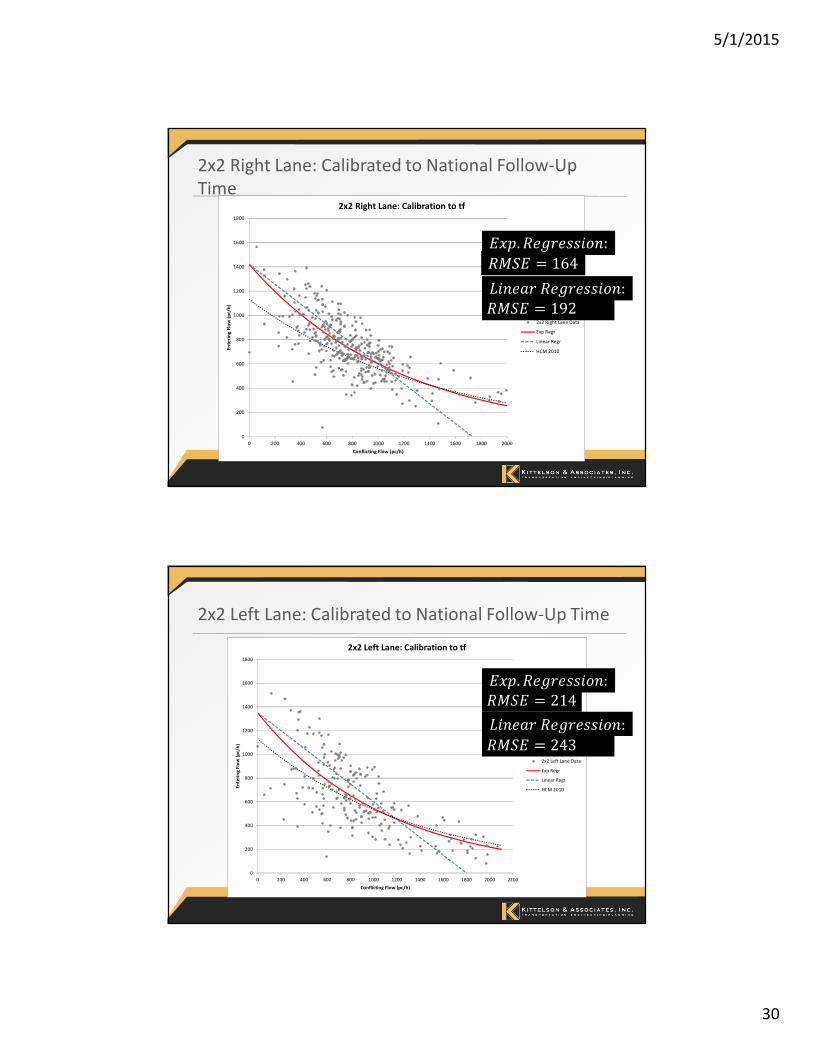
2x2 Right Lane: Calibrated to National Follow-Up
Time
���� � 164
���. �� !�""#$%:
���� � 192
&#%�'!�� !�""#$%:
0
200
400
600
800
1000
1200
1400
1600
1800
0 200 400 600 800 1000 1200 1400 1600 1800 2000 2200
En
teri
ng
Flo
w (
pc/
h)
Conflicting Flow (pc/h)
2x2 Left Lane: Calibration to tf
2x2 Left Lane Data
Exp Regr
Linear Regr
HCM 2010
2x2 Left Lane: Calibrated to National Follow-Up Time
���� � 214
���. �� !�""#$%:
���� � 243
&#%�'!�� !�""#$%:

5/1/2015
31
0
200
400
600
800
1000
1200
1400
1600
1800
0 200 400 600 800 1000 1200 1400 1600
En
teri
ng
Flo
w (
pc/
h)
Conflicting Flow (pc/h)
2x1 Combined Right + Left Lanes: Match intercept to 2x2 right lane
2x1 Right+Left Lane Data
Exp Regr
Linear Regr
HCM 2010
2x1 Sites: Use 2x2 Right Lane Intercept
���� � 153
���. �� !�""#$%:
���� � 161
&#%�'!�� !�""#$%:
Geometric Effects
• Explored relationships between follow-up time and
key geometric parameters:
– Inscribed circle diameter
– Entry lane width
– Entry angle
– Splitter island width (for exiting effect)
• Conclusion: Trends are apparent but not strong
enough to include in the capacity model

5/1/2015
32
Geometric Effects (cont.)
R² = 0.0026
0
0.5
1
1.5
2
2.5
3
3.5
4
4.5
0 50 100 150 200 250 300
Fo
llo
w-U
p T
ime
, tf
(s)
Inscribed Circle Diameter, D (ft)
Follow-Up Time vs. Inscribed Circle Diameter
R² = 0.0345
0
0.5
1
1.5
2
2.5
3
3.5
4
4.5
8 10 12 14 16 18 20 22 24
Fo
llo
w-U
p T
ime
, tf
(s)
Entry Lane Width (ft)
Follow-Up Time vs. Entry Lane Width
ICD
Entry Lane Width
R² = 0.025
0
0.5
1
1.5
2
2.5
3
3.5
4
4.5
0 10 20 30 40 50 60 70
Foll
ow
-Up
Tim
e,
tf (
s)
Splitter Island Width (ft)
Follow-Up Time vs. Splitter Island Width
R² = 0.0586
0
0.5
1
1.5
2
2.5
3
3.5
4
4.5
0 10 20 30 40 50 60 70
Fo
llo
w-U
p T
ime
, tf
(s)
Entry Angle (degrees)
Follow-Up Time vs. Entry Angle
Geometric effects (cont.)
• Trends in intuitive direction but too weak to use
Correlation = 0.24
R2 = 0.06
Splitter Island
WidthEntry Angle

5/1/2015
33
Trends over Time: Sites in common with NCHRP
Report 572 study
0
200
400
600
800
1,000
1,200
1,400
1,600
0 100 200 300 400 500 600 700 800
En
teri
ng
Flo
w (
pc/
h)
Conflicting Flow (pc/h)
SR 166/Mile Hill Drive/Bethel Avenue (WA04) -
North Leg
2012 Data 2003 Data
0
200
400
600
800
1,000
1,200
0 200 400 600 800 1,000 1,200 1,400 1,600
En
teri
ng
Flo
w
(pc/
h)
Circulating Flow (pc/h)
SR 9/US 5 (VT03) - West Leg - Right Lane
2012 Data 2003 Data
No apparent change in
capacity between
2003 and 2012
Summary of Findings
• Calibration to national follow-up time generally
produces plausible results with means for
calibration
• Adjustment made to 2x1 model for better fit
• Exponential form fits same or better than linear
form in all cases
• Separate investigation found that calibration to local
follow-up time produces best fit of all models to
date

5/1/2015
34
Recommended Candidate Models
• Single-lane model: ve = 1380 exp(-0.00102 vc)
• 2x2 right lane: ve = 1420 exp(-0.00085 vc)
• 2x2 left lane: ve = 1350 exp(-0.00092 vc)
• 2x1 both lanes: ve = 1420 exp(-0.00091 vc)
• 1x2: Use 2x2 right lane model
• Calibrate using local follow-up time where possible
• NOTE: Updated HCM chapters anticipated for adoption by the TRB Committee on Highway Capacity and Quality of Service in June 2015
Questions?
• Lee Rodegerdts, [email protected]
Ph
oto
: Le
e R
od
eg
erd
tsP
ho
to:
Lee
Ro
de
ge
rdts


![NCHRP Web Document 41 (Project SP20-24[11]): Contractor ...onlinepubs.trb.org/onlinepubs/nchrp/nchrp_w41_task1.pdfNCHRP Web Document 41 (Project SP20-24[11]): Contractor s Final Report](https://static.fdocument.pub/doc/165x107/61060d8e163862392c18f1e7/nchrp-web-document-41-project-sp20-2411-contractor-nchrp-web-document-41.jpg)