National Energy Policy - WTRG · Reliable, Affordable, and Environmentally Sound Energy for...
170
National Energy Policy May 2001 Report of the National Energy Policy Development Group
Transcript of National Energy Policy - WTRG · Reliable, Affordable, and Environmentally Sound Energy for...
NationalEnergyPolicy
May 2001
Report of the
National Energy Policy Development Group
Reliable, Affordable, andEnvironmentally SoundEnergy for America’s Future
Report of theNational Energy Policy Development Group
“America must have an energy policy that plans
for the future, but meets the needs of today.
I believe we can develop our natural resources
and protect our environment.”
— President George W. Bush

For Sale by the Superintendent of Documents, U.S Government Printing OfficeInternet: bookstore.gpo.gov Phone: (202) 512-1800 Fax: (202) 512-2250
Mail: Stop SSOP, Washington, DC 20402-0001ISBN 0-16-050814-2
Members of the
National Energy Policy Development Group
DICK CHENEY
The Vice President
COLIN L. POWELL
The Secretary of State
PAUL O’NEILL
The Secretary of the Treasury
GALE NORTON
The Secretary of the Interior
ANN M. VENEMAN
The Secretary of Agriculture
DONALD L. EVANS
The Secretary of Commerce
NORMAN Y. MINETA
The Secretary of Transportation
SPENCER ABRAHAM
The Secretary of Energy
JOE M. ALLBAUGH
The Director of the Federal Emergency Management Agency
CHRISTINE TODD WHITMAN
The Administrator of the Environmental Protection Agency
JOSHUA B. BOLTEN
The Assistant to the President and Deputy Chief of Staff for Policy
MITCHELL E. DANIELS
The Director of the Office of Management and Budget
LAWRENCE B. LINDSEY
The Assistant to the President for Economic Policy
RUBEN BARRALES
Deputy Assistant to the President and Director of Intergovernmental Affairs
Executive Director: Andrew D. Lundquist
ContentsTaking StockEnergy Challenges Facing the United States
Striking HomeThe Impacts of High Energy Prices on Families, Communities, and Businesses
Protecting America’s EnvironmentSustaining the Nation’s Health and Environment
Using Energy WiselyIncreasing Energy Conservation and Efficiency
Energy for a New CenturyIncreasing Domestic Energy Supplies
Nature’s PowerIncreasing America’s Use of Renewable and Alternative Energy
America’s Energy InfrastructureA Comprehensive Delivery System
Strengthening Global AlliancesEnhancing National Energy Security and International Relationships
Appendix OneSummary of Report Recommendations
Appendix TwoGlossary
12345678
NATIONAL ENERGY POLICYviii
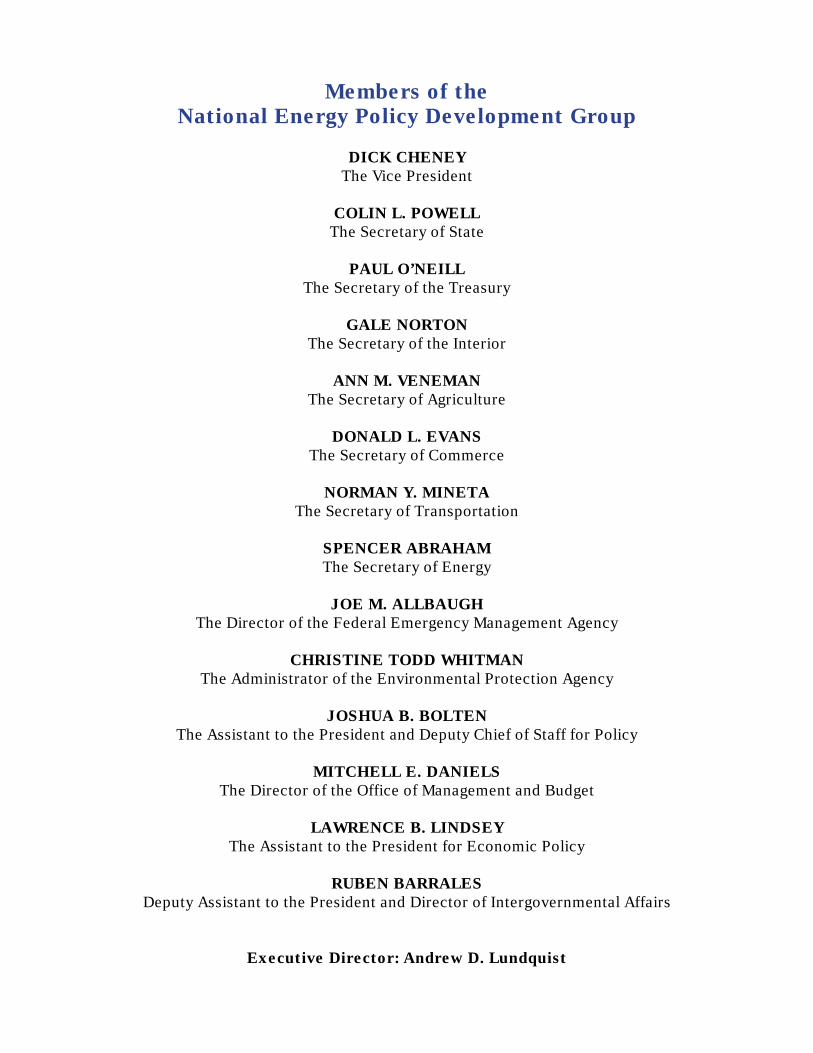
Over the next 20 years, growth in U.S. energy consumption will increasinglyoutpace U.S. energy production, if production only grows at the rate of the last10 years.________Sources: Sandia National Laboratories and U.S. Department of Energy, Energy InformationAdministration.
(Quadrillion Btus)
2000 2005 2010 2015 2020
Energy Production at 1990-2000 Growth Rates
140
120
100
80
60
40
20
0
OverviewReliable, Affordable, and Environmentally SoundEnergy for America’s Future
I n his second week in office, PresidentGeorge W. Bush established the Na-tional Energy Policy DevelopmentGroup, directing it to “develop anational energy policy designed to
help the private sector, and, as necessaryand appropriate, State and local govern-ments, promote dependable, affordable,and environmentally sound production anddistribution of energy for the future.” ThisOverview sets forth the National EnergyPolicy Development (NEPD) Group’s find-ings and key recommendations for a Na-tional Energy Policy.
America in the year 2001 faces themost serious energy shortage since the oilembargoes of the 1970s. The effects are al-ready being felt nationwide. Many familiesface energy bills two to three times higherthan they were a year ago. Millions ofAmericans find themselves dealing withrolling blackouts or brownouts; some em-ployers must lay off workers or curtail pro-duction to absorb the rising cost of energy.Drivers across America are paying higherand higher gasoline prices.
Californians have felt these problemsmost acutely. California actually began the1990s with a surplus of electricity generat-ing capacity. Yet despite an economicboom, a rapidly growing population, and acorresponding increase in energy needs,California did not add a single new majorelectric power plant during the 1990s. Theresult is a demand for electricity thatgreatly succeeds the amount available.
A fundamental imbalance betweensupply and demand defines our nation’s en-ergy crisis. As the chart illustrates, if energyproduction increases at the same rate asduring the last decade our projected energyneeds will far outstrip expected levels ofproduction.
This imbalance, if allowed to con-tinue, will inevitably undermine oureconomy, our standard of living, and ournational security. But it is not beyond ourpower to correct. America leads the worldin scientific achievement, technical skill,and entrepreneurial drive. Within our coun-try are abundant natural resources, unri-valed technology, and unlimited human cre-ativity. With forward-looking leadershipand sensible policies, we can meet our fu-
Energy Consumption
Projected Shortfall
Figure 1Growth in U.S. Energy ConsumptionIs Outpacing Production

Overview • Reliable, Affordable, and Environmentally Sound Energy for America’s Future ix
ture energy demands and promote energyconservation, and do so in environmentallyresponsible ways that set a standard for theworld.
The ChallengeAmerica’s energy challenge begins
with our expanding economy, growingpopulation, and rising standard of living.Our prosperity and way of life are sustainedby energy use. America has the technologi-cal know-how and environmentally sound21st century technologies needed to meetthe principal energy challenges we face:promoting energy conservation, repairingand modernizing our energy infrastructure,and increasing our energy supplies in waysthat protect and improve the environment.Meeting each of these challenges is criticalto expanding our economy, meeting theneeds of a growing population, and raisingthe American standard of living.
We are already working to meet thefirst challenge: using energy more wisely.Dramatic technological advances in energyefficiency have enabled us to make greatstrides in conservation, from the operationof farms and factories to the construction of
buildings and automobiles. New technologyallows us to go about our lives and workwith less cost, less effort, and less burden onthe natural environment. While such ad-vances cannot alone solve America’s energyproblems, they can and will continue to playan important role in our energy future.
The second challenge is to repair andexpand our energy infrastructure. Our cur-rent, outdated network of electric genera-tors, transmission lines, pipelines, and refin-eries that convert raw materials into usablefuel has been allowed to deteriorate. Oilpipelines and refining capacity are in needof repair and expansion. Not a single majoroil refinery has been built in the UnitedStates in nearly a generation, causing thekind of bottlenecks that lead to suddenspikes in the price of gasoline. Natural gasdistribution, likewise, is hindered by an ag-ing and inadequate network of pipelines. Tomatch supply and demand will require some38,000 miles of new gas pipelines, alongwith 255,000 miles of distribution lines.Similarly, an antiquated and inadequatetransmission grid prevents us from routingelectricity over long distances and therebyavoiding regional blackouts, such asCalifornia’s.
America’s expanding
economy, growing
population, and
rising standard of
living will be
sustained by our
unmatched techno-
logical know-how.
“America must
have an energy
policy that plans
for the future,
but meets the
needs of today.
I believe we
can develop
our natural
resources and
protect our
environment.”
— PresidentGeorge W. Bush
NATIONAL ENERGY POLICYx
Increasing energy supplies while pro-tecting the environment is the third chal-lenge. Even with successful conservationefforts, America will need more energy.
Renewable and alternative fuels offerhope for America’s energy future. But theysupply only a small fraction of present en-ergy needs. The day they fulfill the bulk ofour needs is still years away. Until that daycomes, we must continue meeting thenation’s energy requirements by the meansavailable to us.
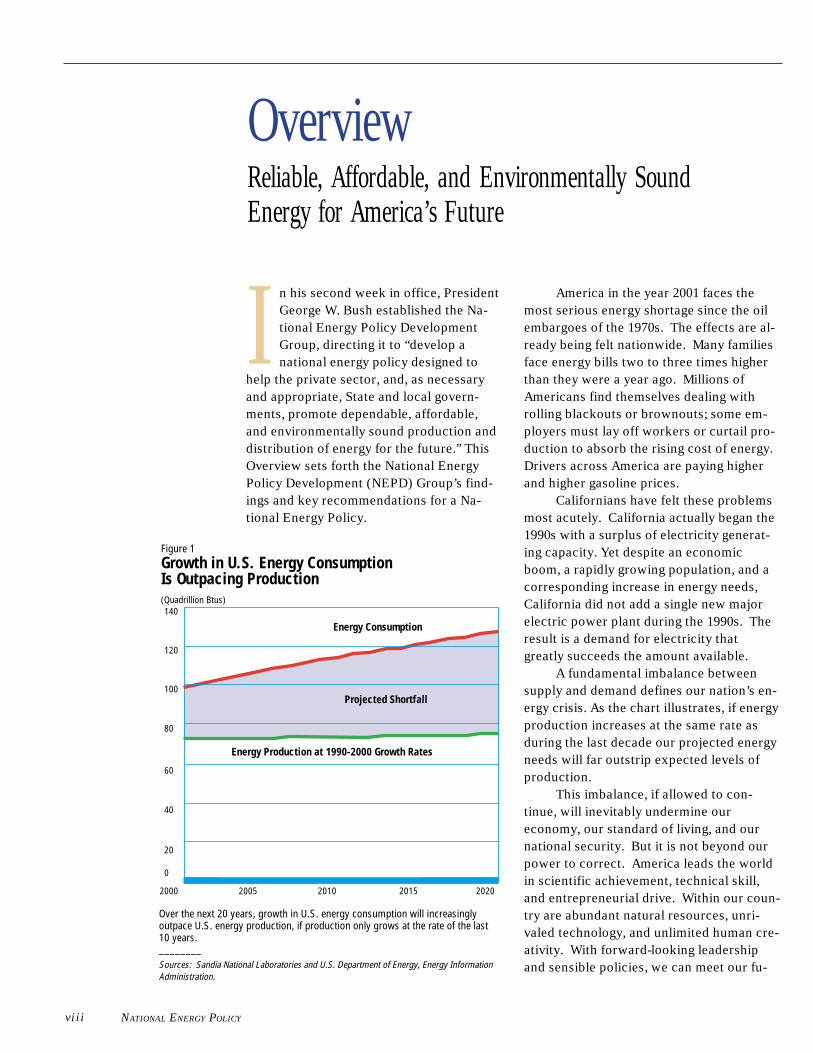
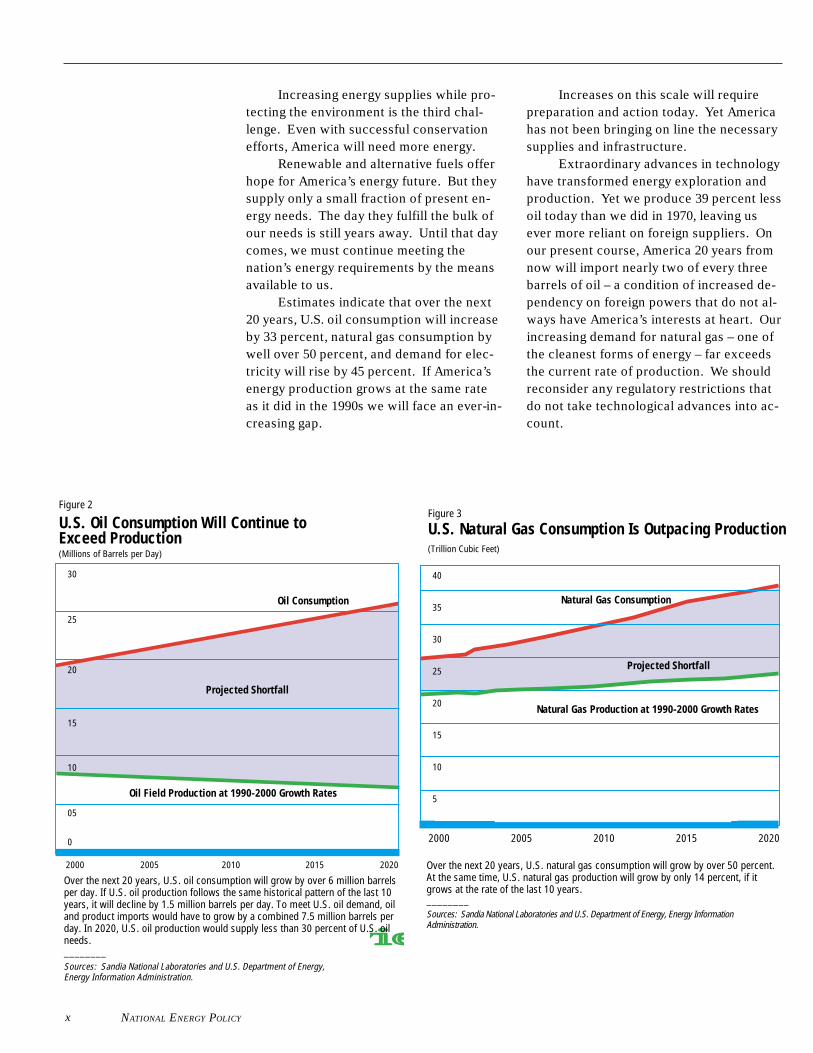
Estimates indicate that over the next20 years, U.S. oil consumption will increaseby 33 percent, natural gas consumption bywell over 50 percent, and demand for elec-tricity will rise by 45 percent. If America’senergy production grows at the same rateas it did in the 1990s we will face an ever-in-creasing gap.
Increases on this scale will requirepreparation and action today. Yet Americahas not been bringing on line the necessarysupplies and infrastructure.
Extraordinary advances in technologyhave transformed energy exploration andproduction. Yet we produce 39 percent lessoil today than we did in 1970, leaving usever more reliant on foreign suppliers. Onour present course, America 20 years fromnow will import nearly two of every threebarrels of oil – a condition of increased de-pendency on foreign powers that do not al-ways have America’s interests at heart. Ourincreasing demand for natural gas – one ofthe cleanest forms of energy – far exceedsthe current rate of production. We shouldreconsider any regulatory restrictions thatdo not take technological advances into ac-count.
chart 1 overview
Oil Consumption
(Millions of Barrels per Day)
Oil Field Production at 1990-2000 Growth Rates
2000 2005 2010 2015 2020
Figure 2
U.S. Oil Consumption Will Continue toExceed Production
Over the next 20 years, U.S. oil consumption will grow by over 6 million barrelsper day. If U.S. oil production follows the same historical pattern of the last 10years, it will decline by 1.5 million barrels per day. To meet U.S. oil demand, oiland product imports would have to grow by a combined 7.5 million barrels perday. In 2020, U.S. oil production would supply less than 30 percent of U.S. oilneeds.________Sources: Sandia National Laboratories and U.S. Department of Energy,Energy Information Administration.
30
25
20
15
10
05
0
Projected Shortfall
chart 1 overview
Figure 3
U.S. Natural Gas Consumption Is Outpacing Production(Trillion Cubic Feet)
Over the next 20 years, U.S. natural gas consumption will grow by over 50 percent.At the same time, U.S. natural gas production will grow by only 14 percent, if itgrows at the rate of the last 10 years.________Sources: Sandia National Laboratories and U.S. Department of Energy, Energy InformationAdministration.
2000 2005 2010 2015 2020
Natural Gas Production at 1990-2000 Growth Rates
Projected Shortfall
Natural Gas Consumption
40
35
30
25
20
15
10
5
Overview • Reliable, Affordable, and Environmentally Sound Energy for America’s Future xi
We have a similar opportunity to in-crease our supplies of electricity. To meetprojected demand over the next two de-cades, America must have in place be-tween 1,300 and 1,900 new electric plants.Much of this new generation will be fueledby natural gas. However, existing and newtechnologies offer us the opportunity to ex-pand nuclear generation as well. Nuclearpower today accounts for 20 percent of ourcountry’s electricity. This power source,which causes no greenhouse gas emis-sions, can play an expanding part in our en-ergy future.
The recommendations of this reportaddress the energy challenges facingAmerica. Taken together, they offer thethorough and responsible energy plan ournation has long needed.
Components of the NationalEnergy Policy
The National Energy Policy we pro-pose follows three basic principles:• The Policy is a long-term, compre-
hensive strategy. Our energy crisishas been years in the making, andwill take years to put fully behind us.
• The Policy will advance new, envi-ronmentally friendly technologiesto increase energy supplies and en-courage cleaner, more efficient en-ergy use.
• The Policy seeks to raise the livingstandards of the American people,recognizing that to do so our countrymust fully integrate its energy, envi-ronmental, and economic policies.
Applying these principles, we urge ac-tion to meet five specific national goals.America must modernize conservation,modernize our energy infrastructure, in-crease energy supplies, accelerate the pro-tection and improvement of the environ-ment, and increase our nation’s energy se-curity.
Modernize ConservationAmericans share the goal of energy
conservation. The best way of meeting thisgoal is to increase energy efficiency by ap-plying new technology – raising productiv-ity, reducing waste, and trimming costs. Inaddition, it holds out great hope for improv-ing the quality of the environment. Ameri-can families, communities, and businessesall depend upon reliable and affordable en-ergy services for their well being andsafety. From transportation to communica-tion, from air conditioning to lighting, en-ergy is critical to nearly everything we do inlife and work. Public policy can and shouldencourage energy conservation.
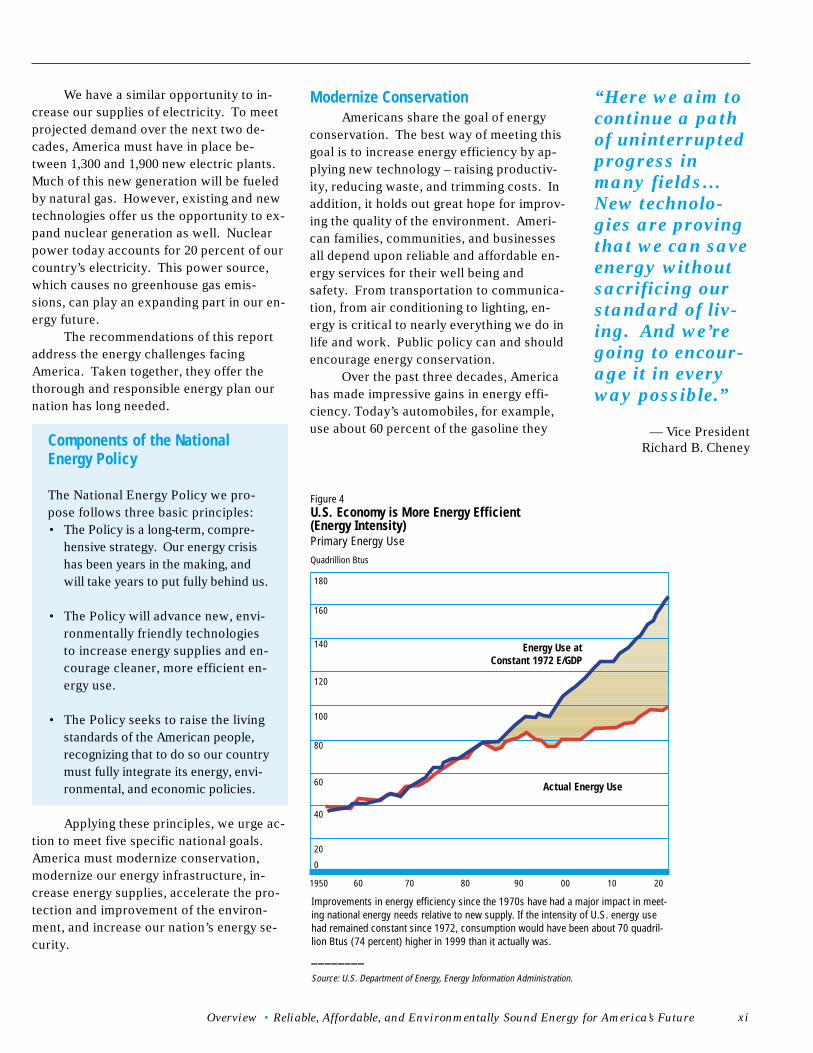
Over the past three decades, Americahas made impressive gains in energy effi-ciency. Today’s automobiles, for example,use about 60 percent of the gasoline they
Energy Use atConstant 1972 E/GDP
Improvements in energy efficiency since the 1970s have had a major impact in meet-ing national energy needs relative to new supply. If the intensity of U.S. energy usehad remained constant since 1972, consumption would have been about 70 quadril-lion Btus (74 percent) higher in 1999 than it actually was.
________Source: U.S. Department of Energy, Energy Information Administration.
Figure 4U.S. Economy is More Energy Efficient(Energy Intensity)Primary Energy UseQuadrillion Btus
Actual Energy Use
“Here we aim to
continue a path
of uninterrupted
progress in
many fields…
New technolo-
gies are proving
that we can save
energy without
sacrificing our
standard of liv-
ing. And we’re
going to encour-
age it in every
way possible.”
— Vice PresidentRichard B. Cheney
180
160
140
120
100
80
60
40
20
0
1950 60 70 80 90 00 10 20
NATIONAL ENERGY POLICYxii
did in 1972, while new refrigerators requirejust one-third the electricity they did 30years ago. As a result, since 1973, the U.S.economy has grown by 126 percent, whileenergy use has increased by only 30 per-cent. In the 1990s alone, manufacturingoutput expanded by 41 percent, while in-dustrial electricity consumption grew byonly 11 percent. We must build on thisprogress and strengthen America’s commit-ment to energy efficiency and conservation.
The National Energy Policy builds
on our nation’s successful track record
and will promote further improvements
in the productive and efficient use of
energy. This report includes recom-
mendations to:
• Direct federal agencies to take appro-priate actions to responsibly conserveenergy use at their facilities, espe-cially during periods of peak demandin regions where electricity shortagesare possible, and to report to thePresident on actions taken.
• Increase funding for renewable en-ergy and energy efficiency researchand development programs that areperformance-based and cost-shared.
• Create an income tax credit for thepurchase of hybrid and fuel cellvehicles to promote fuel-efficientvehicles.
• Extend the Department of Energy’s“Energy Star” efficiency program toinclude schools, retail buildings,health care facilities, and homes andextend the “Energy Star” labeling pro-gram to additional products and appli-ances.
• Fund the federal government’s Intelli-gent Transportation Systems program,the fuel cell powered transit bus pro-gram, and the Clean Buses program.
• Provide a tax incentive and streamlinepermitting to accelerate the develop-ment of clean Combined Heat andPower technology.
• Direct the Secretary of Transportationto review and provide recommenda-tions on establishing Corporate Aver-age Fuel Economy (CAFE) standards
with due consideration to the NationalAcademy of Sciences study of CAFEstandards to be released in July, 2001.
Modernize Our Energy InfrastructureThe energy we use passes through a
vast nationwide network of generating fa-cilities, transmission lines, pipelines, and re-fineries that converts raw resources into us-able fuel and power. That system is deterio-rating, and is now strained to capacity.
One reason for this is governmentregulation, often excessive and redundant.Regulation is needed in such a complexfield, but it has become overly burdensome.Regulatory hurdles, delays in issuing per-mits, and economic uncertainty are limitinginvestment in new facilities, making our en-ergy markets more vulnerable to transmis-sion bottlenecks, price spikes and supplydisruptions. America needs more environ-mentally-sound energy projects to connectsupply sources to growing markets and todeliver energy to homes and business.
To reduce the incidence of electricityblackouts, we must greatly enhance ourability to transmit electric power betweengeographic regions, that is, sending powerto where it is needed from where it is pro-duced. Most of America’s transmissionlines, substations, and transformers werebuilt when utilities were tightly regulatedand provided service only within their as-signed regions. The system is simply un-equipped for large-scale swapping of powerin the highly competitive market of the 21st
century.The National Energy Policy will
modernize and expand our energy infra-
structure in order to ensure that en-
ergy supplies can be safely, reliably,
and affordably transported to homes
and businesses. This report includes
recommendations to:
• Direct agencies to improve pipelinesafety and expedite pipeline permit-ting.
• Issue an Executive Order directingfederal agencies to expedite permitsand coordinate federal, state, and localactions necessary for energy-relatedproject approvals on a national basis
“For the electric-
ity we need, we
must be ambi-
tious. Transmis-
sion grids stand
in need of repair,
upgrading, and
expansion. . . . If
we put these con-
nections in place,
we’ll go a long
way toward
avoiding future
blackouts.”
— Vice PresidentRichard B. Cheney
Overview • Reliable, Affordable, and Environmentally Sound Energy for America’s Future xiii
in an environmentally sound manner,and establish an interagency taskforce chaired by the Council on Envi-ronmental Quality. The task forcewill ensure that federal agencies setup appropriate mechanisms to coordi-nate federal, state and local permit-ting activity in particular regionswhere increased activity is expected.
• Grant authority to obtain rights-of-way for electricity transmission lineswith the goal of creating a reliable na-tional transmission grid. Similar au-thority already exists for natural gaspipelines and highways.
• Enact comprehensive electricity legis-lation that promotes competition, en-courages new generation, protectsconsumers, enhances reliability, andpromotes renewable energy.
• Implement administrative and regula-tory changes to improve the reliabilityof the interstate transmission systemand enact legislation to provide forenforcement of electricity reliabilitystandards.
• Expand the Energy Department’s re-search and development on transmis-sion reliability and superconductivity.
Increase Energy SuppliesA primary goal of the National Energy
Policy is to add supply from diversesources. This means domestic oil, gas, andcoal. It also means hydropower andnuclear power. And it means makinggreater use of non-hydro renewable sourcesnow available.
One aspect of the present crisis is anincreased dependence, not only on foreignoil, but on a narrow range of energy op-tions. For example, about 90 percent of allnew electricity plants currently under con-struction will be fueled by natural gas.While natural gas has many advantages, anover-reliance on any one fuel source leavesconsumers vulnerable to price spikes andsupply disruptions. There are several otherfuel sources available that can help meetour needs.
Currently, the U.S. has enough coal tolast for another 250 years. Yet very few
coal-powered electric plants are now underconstruction. Research into clean coaltechnologies may increase the attractive-ness of coal as a source for new generationplants.
Nuclear power plants serve millions ofAmerican homes and businesses, have a de-pendable record for safety and efficiency,and discharge no greenhouse gases into theatmosphere. As noted earlier, these facili-ties currently generate 20 percent of allelectricity in America, and more than 40percent of electricity generated in 10 statesin the Northeast, South, and Midwest.Other nations, such as Japan and France,generate a much higher percentage of theirelectricity from nuclear power. Yet thenumber of nuclear plants in America is ac-tually projected to decline in coming years,as old plants close and none are built to re-place them.
Enormous advances in technologyhave made oil and natural gas explorationand production both more efficient andmore environmentally sound. Better tech-nology means fewer rigs, more accuratedrilling, greater resource recovery and envi-
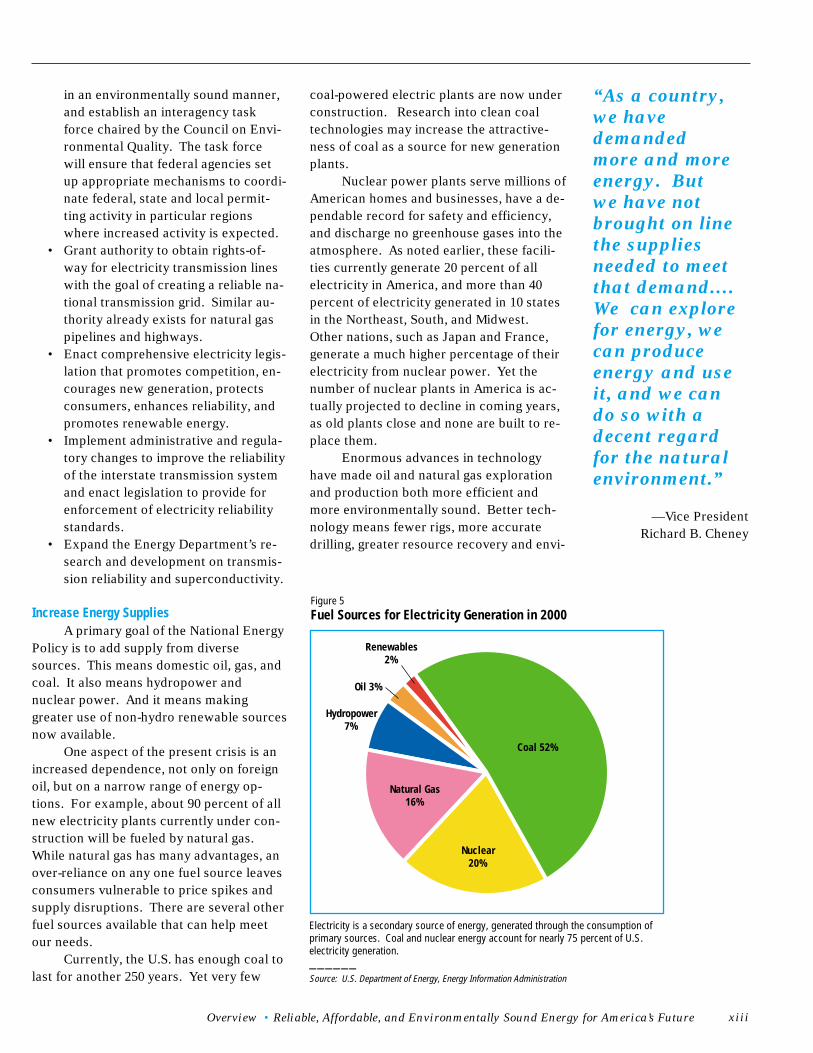
Electricity is a secondary source of energy, generated through the consumption ofprimary sources. Coal and nuclear energy account for nearly 75 percent of U.S.electricity generation.______Source: U.S. Department of Energy, Energy Information Administration
Hydropower7%
Renewables2%
Oil 3%
Figure 5Fuel Sources for Electricity Generation in 2000
Nuclear20%
Natural Gas16%
Coal 52%
“As a country,
we have
demanded
more and more
energy. But
we have not
brought on line
the supplies
needed to meet
that demand.…
We can explore
for energy, we
can produce
energy and use
it, and we can
do so with a
decent regard
for the natural
environment.”
—Vice PresidentRichard B. Cheney
NATIONAL ENERGY POLICYxiv
ronmentally friendly exploration. Drillingpads are 80 percent smaller than a generationago. High-tech drilling allows us to accesssupplies five to six miles away from a singlecompact drilling site, leaving sensitive wet-lands and wildlife habitats undisturbed. Yetthe current regulatory structure fails to takesufficient account of these extraordinary ad-vances, excessively restricting the environ-mentally safe production of energy frommany known sources.
Our policy will increase and diver-
sify our nation’s sources of traditional
and alternative fuels in order to furnish
families and businesses with reliable and
affordable energy, to enhance national
security, and to improve the environ-
ment. This report includes recommenda-
tions to:
• Issue an Executive Order directing allfederal agencies to include in any regula-tory action that could significantly andadversely affect energy supplies a de-tailed statement on the energy impactof the proposed action.
• Open a small fraction of the Arctic Na-tional Wildlife Refuge to environmentallyregulated exploration and production us-ing leading-edge technology. Examinethe potential for the regulated increasein oil and natural gas development onother federal lands.
• Earmark $1.2 billion of bid bonuses fromthe environmentally responsible leasingof ANWR to fund research into alterna-tive and renewable energy resources –including wind, solar, biomass, and geo-thermal.
• Enact legislation to expand existing al-ternative fuels tax incentives to includelandfills that capture methane gas emis-sions for electricity generation and toelectricity produced from wind and bio-mass. Extend the number of eligible bio-mass sources to include forest-relatedsources, agricultural sources, and cer-tain urban sources.
• Provide $2 billion over 10 years to fundclean coal technology research and anew credit for electricity produced frombiomass co-fired with coal.
• Direct federal agencies to streamline the
hydropower relicensing process withproper regard given to environmentalfactors.
• Provide for the safe expansion ofnuclear energy by establishing a nationalrepository for nuclear waste, and bystreamlining the licensing of nuclearpower plants.
Accelerate Protection and Improvement of theEnvironment
America’s commitment to environmen-tal protection runs deep. We are all aware ofpast excesses in our use of the natural worldand its resources. No one wishes to see themrepeated. In the 21st century, the ethic ofgood stewardship is well established inAmerican life and law.
We do not accept the false choice be-tween environmental protection and energyproduction. An integrated approach to policycan yield a cleaner environment, a strongereconomy, and a sufficient supply of energyfor our future. The primary reason for thathas been steady advances in the technologyof locating, producing, and using energy.Since 1970, emissions of key air emissionsare down 31 percent. Cars today emit 85 per-cent less carbon monoxide than 30 years ago.Lead emissions are down 90 percent. Leadlevels in ambient air today are 98 percentlower than they were in 1970. America is us-ing more, and polluting less.
One of the factors harming the environ-ment today is the very lack of a comprehen-sive, long-term national energy policy. Statesconfronting blackouts must take desperatemeasures, often at the expense of environ-mental standards, requesting waivers of envi-ronmental rules, and delaying the implemen-tation of anti-pollution efforts. Shortfalls inelectricity generating capacity and short-sighted policies have blocked construction ofnew, cleaner plants, leaving no choice but torely on older, inefficient plants to meet de-mand. The increased use of emergency powersources, such as diesel generators, results ingreater air pollution.
New anti-pollution technologies holdgreat promise for the environment. The samecan be said of 21st century power generatorsthat must soon replace older models; signifi-
“We will insist
on protecting
and enhancing
the environment,
showing consid-
eration for the
air and natural
lands and water-
sheds of our
country.”
— Vice PresidentRichard B. Cheney
Overview • Reliable, Affordable, and Environmentally Sound Energy for America’s Future xv
cant new resources for land conservation ef-forts; and continued research into renewableenergy sources. All have a place in the Na-tional Energy Policy.
The National Energy Policy will
build upon our nation’s successful track
record and will promote further improve-
ments in the productive and efficient use
of energy. This report includes recom-
mendations to:
• Enact “multi-pollutant” legislation to es-tablish a flexible, market-based programto significantly reduce and cap emis-sions of sulfur dioxide, nitrogen oxides,and mercury from electric power genera-tors.
• Increase exports of environmentallyfriendly, market-ready U.S. technologiesthat generate a clean environment andincrease energy efficiency.
• Establish a new “Royalties ConservationFund” and earmark royalties from new,clean oil and gas exploration in ANWRto fund land conservation efforts.
• Implement new guidelines to reducetruck idling emissions at truck stops.
Increase Energy Security.The National Energy Policy seeks to
lessen the impact on Americans of energyprice volatility and supply uncertainty. Suchuncertainty increases as we reduce America’sdependence on foreign sources of energy. Atthe same time, however, we recognize that asignificant percentage of our resources willcome from overseas. Energy security mustbe a priority of U.S. trade and foreign policy.
We must look beyond our borders andrestore America’s credibility with overseassuppliers. In addition, we must build strongrelationships with energy-producing nationsin our own hemisphere, improving the out-look for trade, investment, and reliable sup-plies.
Energy security also requires preparingour nation for supply emergencies, and assist-ing low-income Americans who are most vul-nerable in times of supply disruption, pricespikes, and extreme weather.
To ensure energy security for our
nation and its families, our report in-
cludes these recommendations:
• Dedicate new funds to the Low IncomeHome Energy Assistance Program byfunneling a portion of oil and gas royaltypayments to LIHEAP when oil and natu-ral gas prices exceed a certain amount.
• Double funding for the Department ofEnergy’s Weatherization Assistance Pro-gram, increasing funding by $1.4 billionover 10 years.
• Direct the Federal Emergency Manage-ment Administration to prepare for po-tential energy-related emergencies.
• Support a North American EnergyFramework to expand and acceleratecross-border energy investment, oil andgas pipelines, and electricity grid con-nections by streamlining and expeditingpermitting procedures with Mexico andCanada. Direct federal agencies to expe-dite necessary permits for a gas pipelineroute from Alaska to the lower 48 states.
Looking Toward the FutureThe President’s goal of reliable, afford-
able, and environmentally sound energy sup-plies will not be reached overnight. It willcall forth innovations in science, research,and engineering. It will require time and thebest efforts of leaders in both political par-ties. It will require also that we deal with thefacts as they are, meeting serious problems ina serious way. The complacency of the pastdecade must now give way to swift but well-considered action.
Present trends are not encouraging, butthey are not immutable. They are amongtoday’s most urgent challenges, and wellwithin our power to overcome. Our countryhas met many great tests. Some have imposedextreme hardship and sacrifice. Others havedemanded only resolve, ingenuity, and clar-ity of purpose. Such is the case with energytoday.
We submit these recommendationswith optimism. We believe that the tasksahead, while great, are achievable. The en-ergy crisis is a call to put to good use the re-sources around us, and the talents within us.It summons the best of America, and offersthe best of rewards – in new jobs, a healthierenvironment, a stronger economy, and abrighter future for our people.
“The goals of
this strategy are
clear: to ensure
a steady supply
of affordable
energy for
America’s homes
and businesses
and industries.”
— PresidentGeorge W. Bush
NATIONAL ENERGY POLICY
Taking Stock
America’s current energy challeng-es can be met with rapidly im-proving technology, dedicatedleadership, and a comprehensiveapproach to our energy needs.
Our challenge is clear—we must use tech-nology to reduce demand for energy, re-pair and maintain our energy infrastruc-ture, and increase energy supply. Today, theUnited States remains the world’s undisput-ed technological leader; but recent eventshave demonstrated that we have yet to inte-grate 21st-century technology into an ener-gy plan that is focused on wise energy use,production, efficiency, and conservation.
Prices today for gasoline, heating oil,and natural gas are dramatically higherthan they were only a year ago. In Califor-nia, homeowners, farmers, and businessesface soaring electricity prices, rollingblackouts, increasing financial turmoil,and an uncertain energy future. Our na-tion’s dependence on foreign sources of oilis at an all-time high and is expected togrow. Current high energy prices and sup-ply shortages are hurting U.S. consumersand businesses, as well as their prospectsfor continued economic growth.
Our national energy policy must becomprehensive in scope. It must protectour environment. It must also increase oursupply of domestic oil, natural gas, coal,nuclear, and renewable energy sources.Our failure over the past several years tomodernize our energy infrastructure—thenetwork of transmission lines, gas pipe-lines, and oil refineries that transports ourenergy to consumers and converts raw ma-terials into usable fuels—is a result of the
lack of careful planning and lack of a com-prehensive national energy plan. The UnitedStates faces serious energy challenges: elec-tricity shortages and disruptions in Califor-nia and elsewhere in the West, dramatic in-creases in gasoline prices due to record-lowinventories, a strained supply system, andcontinued dependence on foreign suppliers.These challenges have developed from yearsof neglect and can only be addressed withthe implementation of sound policy. Thereare no easy, short-term solutions.
Our increased dependence on foreignoil profoundly illustrates our nation’s fail-ure to establish an effective energy policy.Between 1991 and 2000, Americans used 17percent more energy than in the previousdecade, while during that same period, do-mestic energy production rose by only 2.3percent. While U.S. production of coal, nat-ural gas, nuclear energy, and renewable en-ergy has increased somewhat in recentyears, these increases have been largelyoffset by declines in domestic oil produc-tion. As a result, America has met almostall of its increased energy demand over thepast ten years with increased imports.
U.S. energy consumption is projectedto increase by about 32 percent by 2020.Unless a comprehensive national energypolicy is adopted, Americans will continueto feel the effects of an inadequate electri-cal transmission grid, a pipeline systemstretched to capacity, insufficient domesticenergy supply, and a regional imbalance insupply sources. It is important that wemeet these challenges with a comprehen-sive energy plan that takes a long-term ap-proach to meeting our energy needs.
Energy Challenges Facing the United States
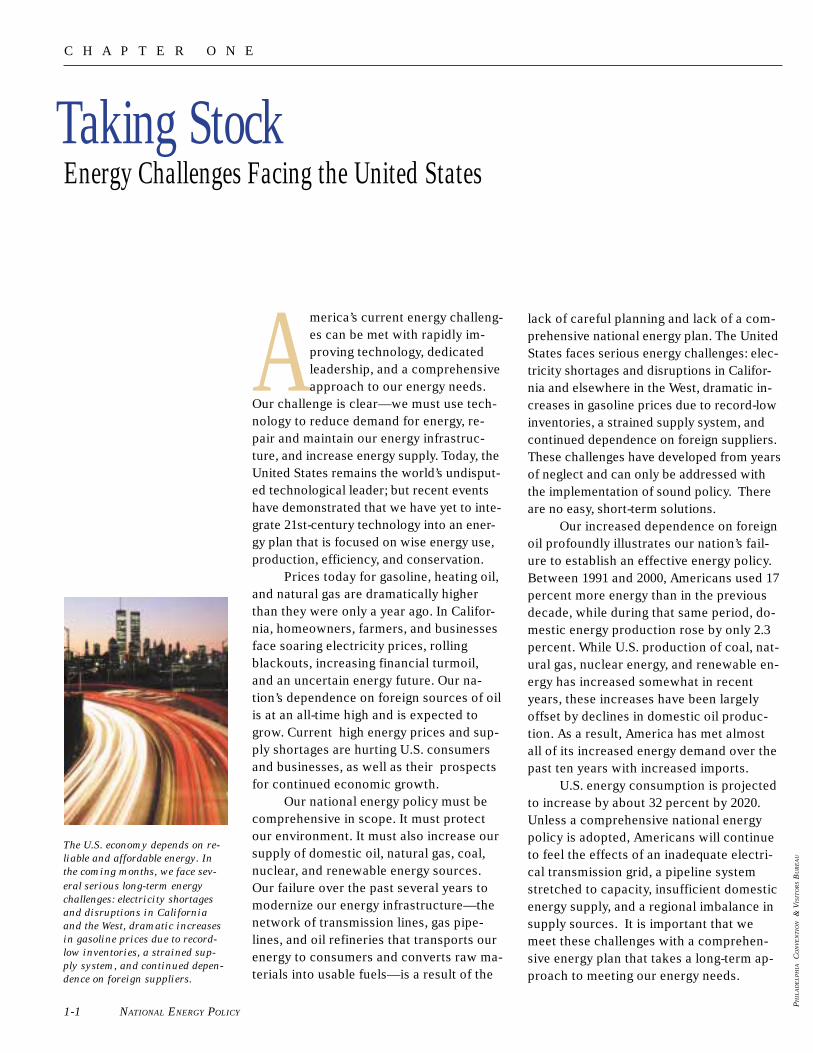
The U.S. economy depends on re-
liable and affordable energy. In
the coming months, we face sev-
eral serious long-term energy
challenges: electricity shortages
and disruptions in California
and the West, dramatic increases
in gasoline prices due to record-
low inventories, a strained sup-
ply system, and continued depen-
dence on foreign suppliers.
PH
ILA
DE
LP
HIA
C
ON
VE
NT
ION &
VIS
ITO
RS B
UR
EA
U
1-1
C H A P T E R O N E

Chapter 1 • Taking Stock: Energy Challenges Facing the United States
NATIONAL ENERGY POLICY
California’s Energy ChallengeRecent and looming electricity black-
outs in California demonstrate the problemof neglecting energy supply. They also fore-tell the consequences of failing to imple-ment a long-term energy plan for our nationas a whole. Though weather conditions anddesign flaws in California’s electricity re-structuring plan contributed, the Californiaelectricity crisis is at heart a supply crisis.
Since 1995, California’s peak summerdemand for electricity has risen by at least5,500 megawatts (MW), while in-state gen-eration has failed to keep pace. California’sgeneration shortfall did not stem from alack of interest in building capacity. Since1997, power producers filed applications tobuild an additional 14,000 MW of new ca-pacity in California.
In addition to a lack of new genera-tion, a crucial transmission bottleneck inthe middle of the state—called Path 15—prevents power in the south from beingshipped to the north during emergencies.
This year, reduced hydropower avail-ability due to low rainfall, higher than ex-pected unplanned plant outages, and the fi-nancial problems of California’s utilities ex-acerbated this growing supply–demand im-balance. As a result, California’s supplyproblem turned into a crisis, resulting insoaring electricity bills for homes and busi-nesses and rolling blackouts.
In part due to the interconnected na-ture of the western electricity grid, Califor-nia’s critical electricity shortages havehelped to drive up electricity costs in theWest.
Unfortunately, there are no short-termsolutions to long-term neglect. It can takenew power plants and transmission facili-ties years to site, permit, and construct. De-spite expedited federal permitting, Califor-nia’s emergency efforts to increase newgeneration by 5,000 MW by July appear tobe falling short. Less than 2,000 MW of newgeneration is expected to be in place bysummer. Even with aggressive conserva-tion measures, peak demand this summeris projected to outstrip supply by severalthousand megawatts. The California grid
1-3
operator expects more than 30 days ofblackouts.
California officials have warned thatthe crisis may last several years. ThoughCalifornia’s efforts to increase generationmay not suffice to prevent blackouts thissummer, if continued and strengthened,they promise to limit the duration of thecrisis.
Recommendations:
★ The National Energy Policy Devel-opment (NEPD) Group recommendsthat the President issue an ExecutiveOrder to direct all federal agencies toinclude in any regulatory action thatcould significantly and adversely af-fect energy supplies, distribution, oruse, a detailed statement on (1) theenergy impact of the proposed action,(2) any adverse energy effects thatcannot be avoided should the propos-al be implemented, and (3) alterna-tives to the proposed action. Theagencies would be directed to includethis statement in all submissions tothe Office of Management and Budgetof proposed regulations covered byExecutive Order 12866, as well as inall notices of proposed regulationspublished in the Federal Register.
★ The NEPD Group recommends thatthe President direct the executive agen-cies to work closely with Congress toimplement the legislative componentsof a national energy policy.
Conservation and Energy EfficiencyConservation and energy efficiency
are crucial components of a national ener-gy plan. Energy efficiency is the ability touse less energy to produce the sameamount of useful work or services. Conser-vation is closely related and is simply usingless energy. Improved energy efficiencyand conservation reduces energy consump-tion and energy costs, while maintainingequivalent service in our homes, offices,factories, and automobiles. Greater energy
Chapter 1 • Taking Stock: Energy Challenges Facing the United States 1-4
efficiency helps the United States reduceenergy imports, the likelihood of energyshortages, emissions, and the volatility ofenergy prices.
Over the last three decades, the Unit-ed States has significantly improved its en-ergy efficiency by developing and expand-ing the use of energy efficient technologies.Although our economy has grown by 126percent since 1973, our energy use has in-creased by only 30 percent. Had energy usekept pace with economic growth, the na-tion would have consumed 171 quadrillionBritish thermal units (Btus) last year in-stead of 99 quadrillion Btus.
About a third to a half of these savingsresulted from shifts in the economy, such asthe growth of the service sector. The otherhalf to two-thirds resulted from greater en-ergy efficiency. Technological improve-ments in energy efficiency allow consumersto enjoy more energy services without com-mensurate increases in energy demand. Therate at which these efficiency improve-ments are made varies over time, depend-ing on the extent to which factors—such asenergy policies, research and development,prices, and market regulations—encouragethe development of new, efficient productsand consumer investment in these prod-ucts. An increased rate of improvement inenergy efficiency can have a large impacton energy supply and infrastructure needs,reducing the need for new power plantsand other energy resources, along with re-duced stress on the energy supply infra-structure.
Load management is the ability to adjustenergy loads to reflect immediate supply condi-tions. In the very short term, direct appeals forconservation can ease strained energy supplymarkets for a time. Over the longer run, the abil-ity to adjust demand on an as-needed basis canbe an important source of energy reserves, re-sulting in lower energy bills for participatingcustomers.
The impact that improvements in energyefficiency can have on energy supply marketsgrows over time. Electricity demand is project-ed to rise by 1.8 percent a year over the next 20years, requiring the addition of some 393,000MW of generation capacity. At the same time,
energy efficiency is projected to continue to im-prove between 2000 and 2020. A decrease in de-mand from 1.8 percent to 1.5 percent would re-duce the need for new generating capacity nextyear by about 2,000 MW. Extending that reduc-tion over the next 20 years would reduce theneed for new generation by 60,000 to 66,000 MW.
While this projection shows that conser-vation can help ensure the United States has ad-equate energy supplies for the future, it alsoshows that conservation alone is not the an-swer. Even with more conservation, the U.S.will need more energy supplies. Today, newtechnologies offer new opportunities to en-hance our energy efficiency. As these technolo-gies gain market acceptance, they will help en-sure a reliable and affordable energy and elec-tric power supply for the nation.
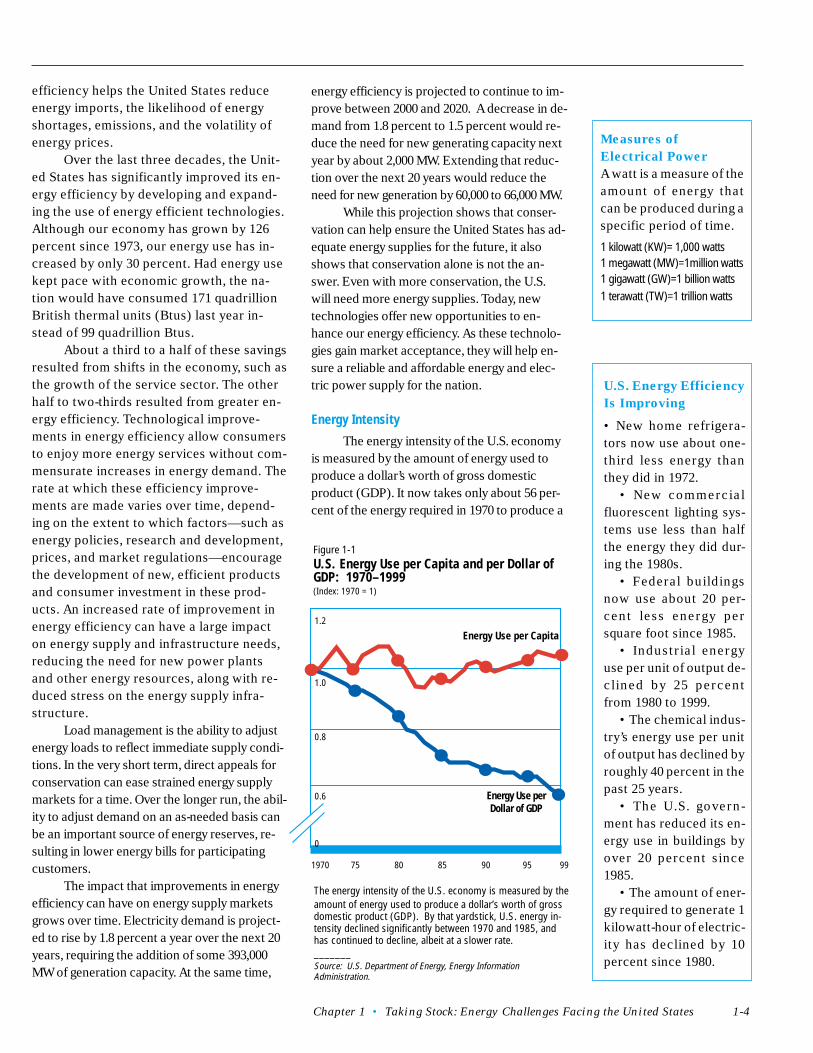
Energy Intensity
The energy intensity of the U.S. economyis measured by the amount of energy used toproduce a dollar’s worth of gross domesticproduct (GDP). It now takes only about 56 per-cent of the energy required in 1970 to produce a
Measures of
Electrical Power
A watt is a measure of theamount of energy thatcan be produced during aspecific period of time.
1 kilowatt (KW)= 1,000 watts1 megawatt (MW)=1million watts1 gigawatt (GW)=1 billion watts1 terawatt (TW)=1 trillion watts
U.S. Energy Efficiency
Is Improving
• New home refrigera-tors now use about one-third less energy thanthey did in 1972.
• New commercialfluorescent lighting sys-tems use less than halfthe energy they did dur-ing the 1980s.
• Federal buildingsnow use about 20 per-cent less energy persquare foot since 1985.
• Industrial energyuse per unit of output de-clined by 25 percentfrom 1980 to 1999.
• The chemical indus-try’s energy use per unitof output has declined byroughly 40 percent in thepast 25 years.
• The U.S. govern-ment has reduced its en-ergy use in buildings byover 20 percent since1985.
• The amount of ener-gy required to generate 1kilowatt-hour of electric-ity has declined by 10percent since 1980.
The energy intensity of the U.S. economy is measured by theamount of energy used to produce a dollar’s worth of grossdomestic product (GDP). By that yardstick, U.S. energy in-tensity declined significantly between 1970 and 1985, andhas continued to decline, albeit at a slower rate._______Source: U.S. Department of Energy, Energy InformationAdministration.
1.2
1.0
0.8
0.6
0
0
Figure 1-1U.S. Energy Use per Capita and per Dollar ofGDP: 1970–1999(Index: 1970 = 1)
Energy Use per Capita
1970 75 80 85 90 95 99
Energy Use perDollar of GDP
NATIONAL ENERGY POLICY
dollar of GDP today (Figure 1-1). This reduc-tion is attributable to improved energy efficien-cy, as well as to structural changes in the econ-omy, particularly the relative decline of energy-intensive industries.
The decline in the nation’s energy intensi-ty accelerated between 1999 and 2000, a periodwhen nonenergy-intensive industries experi-enced rapid growth. Energy intensity is project-ed to continue to decline through 2020 at an av-erage rate of 1.6 percent a year. This is a slowerrate of decline than experienced in the 1970sand early 1980s, which was characterized byhigh energy prices and a shift to less energy-intensive industries, but is a more rapid rate ofdecline than experienced on average duringthe latter part of the 1980s and the 1990s.
Challenges Confronting Electricity SupplyOur nation’s electricity supply has
failed to keep pace with growing demand.This imbalance is projected to persist intothe future. The adverse consequences havemanifested themselves most severely inthe West, where supply shortages have ledto high prices and even blackouts. In otherregions, inadequate supply threatens thereliability and affordability of electric pow-er.
Large amounts of new generating ca-pacity are slated for installation around thecountry from 2001 to 2004. However, thereis a geographic mismatch between wherewe will generate energy and where it isneeded. For example, little capacity is be-ing added where it is most needed, such asin California and eastern New York.
Electricity supply conditions in theSoutheast are expected to be tight in thesummer of 2001, much as they have been theprevious two years. The Northeast may alsoface supply shortages. If the temperatures ofthe summer of 2000 had been normal ratherthan unseasonably cool, New York and NewEngland would most likely have experiencedelectricity supply shortfalls and price spikes.Critical supply problems could arise if theweather in the summer of 2001 is unusuallywarm or if plant outages rise above averagelevels.
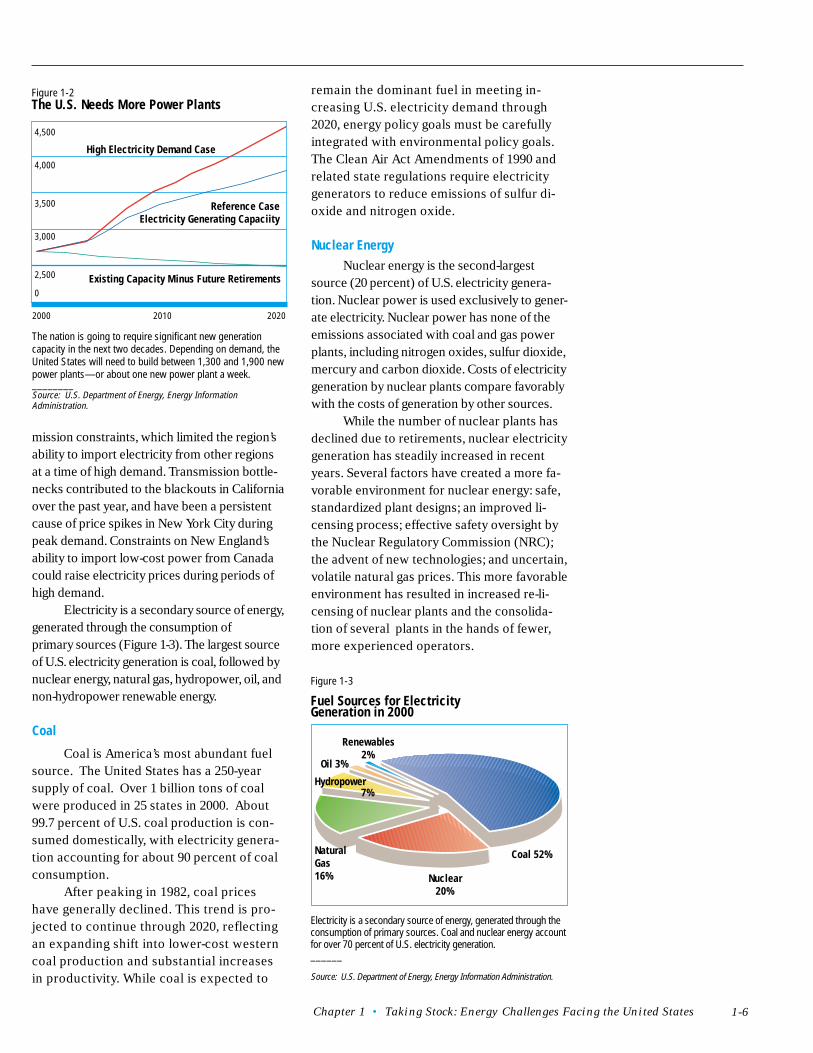
Our nation’s most pressing long-termelectricity challenge is to build enough newgeneration and transmission capacity tomeet projected growth in demand. Acrossthe country, we are seeing the same signsthat California faced in the mid-1990s: sig-nificant economic regulatory uncertainty,which can result in inadequate supply. Thislevel of uncertainty can vary across thecountry, depending on state and local regu-lations. Of the approximately 43,000 MW ofnew generating capacity that power compa-nies planned in 1994 for construction from1995 to 1999, only about 18,000 MW wereactually built. Although plans have been an-nounced to build more capacity than thecountry will need over the next five to sev-en years, this new construction assumesmarket and regulatory conditions that arenot yet assured. Over the next twenty years,the United States will need 1,300 to 1,900 newpower plants, which is the equivalent of 60 to90 new power plants a year (Figure 1-2).
But even with adequate generating ca-pacity, we do not have the infrastructure toensure reliable supply of electricity. Invest-ment in new transmission capacity hasfailed to keep pace with growth in demandand with changes in the industry’s struc-ture. Since 1989, electricity sales to con-sumers have increased by 2.1 percent annu-ally, yet transmission capacity has in-creased by only 0.8 percent annually. Aselectricity markets become more regional,transmission constraints are impeding themovement of electricity both within and be-tween regions.
The price spikes in the Midwest in thesummer of 1998 were in part caused by trans-
1-5
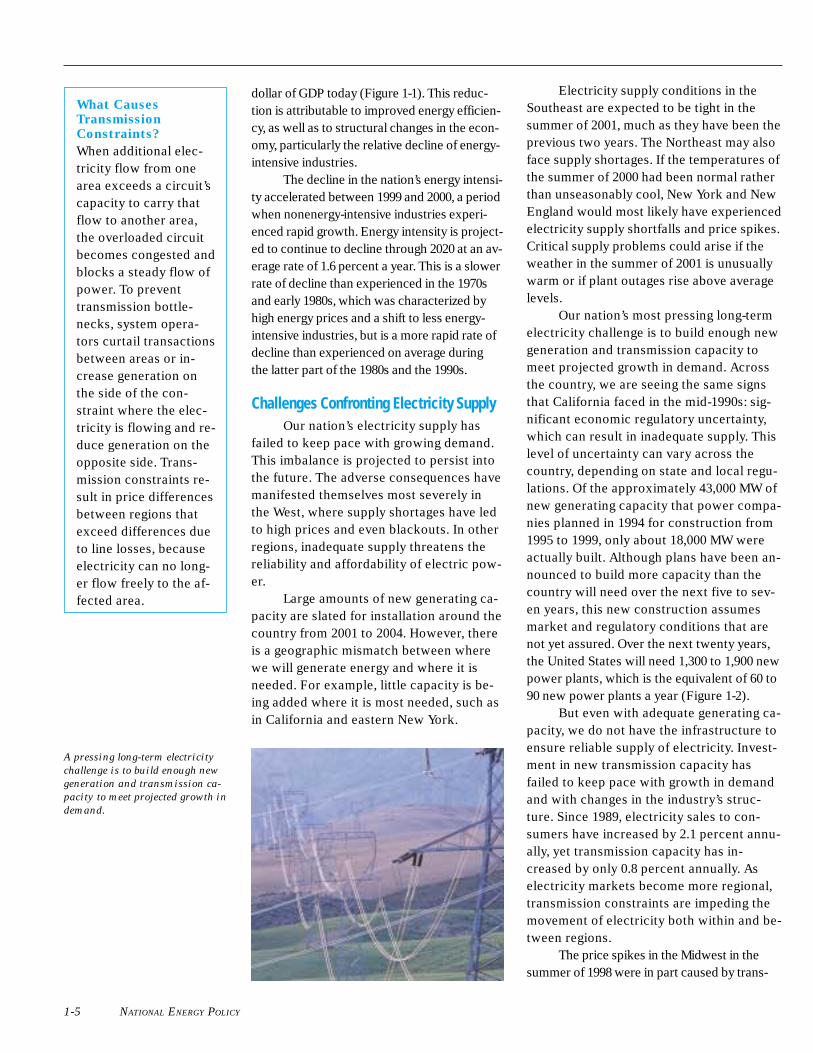
A pressing long-term electricity
challenge is to build enough new
generation and transmission ca-
pacity to meet projected growth in
demand.
What Causes
Transmission
Constraints?
When additional elec-tricity flow from onearea exceeds a circuit’scapacity to carry thatflow to another area,the overloaded circuitbecomes congested andblocks a steady flow ofpower. To preventtransmission bottle-necks, system opera-tors curtail transactionsbetween areas or in-crease generation onthe side of the con-straint where the elec-tricity is flowing and re-duce generation on theopposite side. Trans-mission constraints re-sult in price differencesbetween regions thatexceed differences dueto line losses, becauseelectricity can no long-er flow freely to the af-fected area.
Chapter 1 • Taking Stock: Energy Challenges Facing the United States
mission constraints, which limited the region’sability to import electricity from other regionsat a time of high demand. Transmission bottle-necks contributed to the blackouts in Californiaover the past year, and have been a persistentcause of price spikes in New York City duringpeak demand. Constraints on New England’sability to import low-cost power from Canadacould raise electricity prices during periods ofhigh demand.
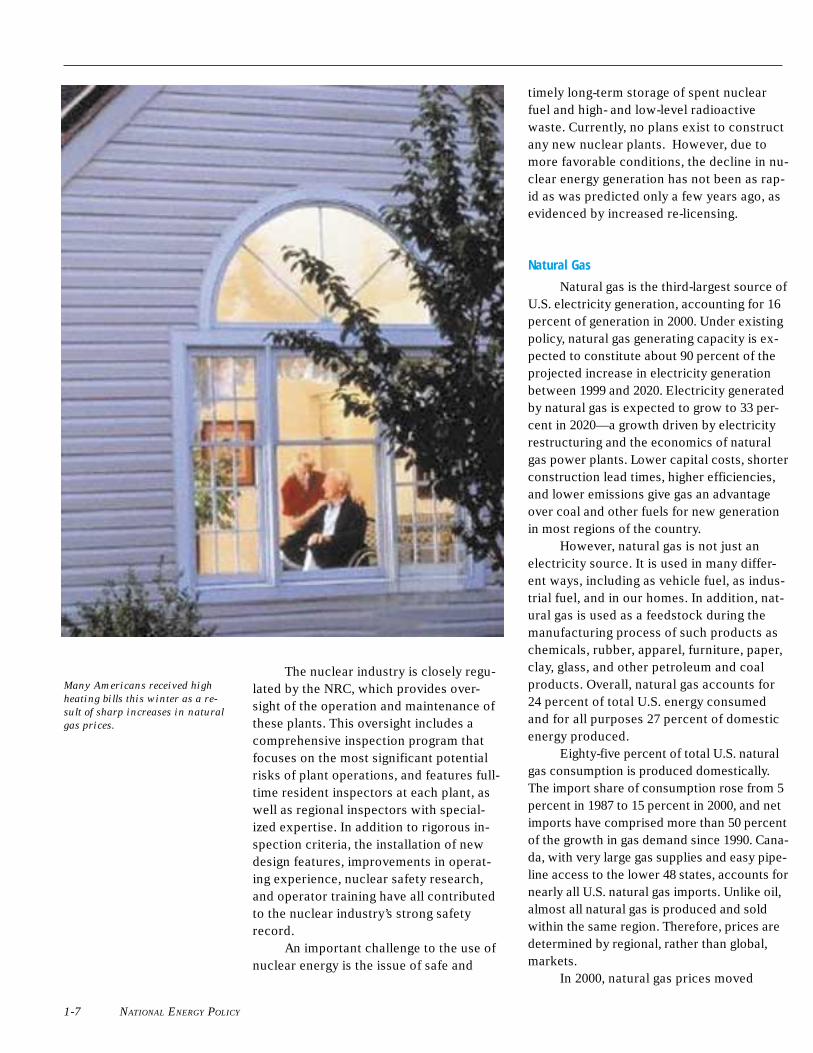
Electricity is a secondary source of energy,generated through the consumption ofprimary sources (Figure 1-3). The largest sourceof U.S. electricity generation is coal, followed bynuclear energy, natural gas, hydropower, oil, andnon-hydropower renewable energy.
Coal
Coal is America’s most abundant fuelsource. The United States has a 250-yearsupply of coal. Over 1 billion tons of coalwere produced in 25 states in 2000. About99.7 percent of U.S. coal production is con-sumed domestically, with electricity genera-tion accounting for about 90 percent of coalconsumption.
After peaking in 1982, coal priceshave generally declined. This trend is pro-jected to continue through 2020, reflectingan expanding shift into lower-cost westerncoal production and substantial increasesin productivity. While coal is expected to
Figure 1-3
Fuel Sources for ElectricityGeneration in 2000
Electricity is a secondary source of energy, generated through theconsumption of primary sources. Coal and nuclear energy accountfor over 70 percent of U.S. electricity generation.______
Source: U.S. Department of Energy, Energy Information Administration.
NaturalGas16%
Hydropower 7%
Nuclear20%
Renewables2%
Coal 52%
1-6
remain the dominant fuel in meeting in-creasing U.S. electricity demand through2020, energy policy goals must be carefullyintegrated with environmental policy goals.The Clean Air Act Amendments of 1990 andrelated state regulations require electricitygenerators to reduce emissions of sulfur di-oxide and nitrogen oxide.
Nuclear EnergyNuclear energy is the second-largest
source (20 percent) of U.S. electricity genera-tion. Nuclear power is used exclusively to gener-ate electricity. Nuclear power has none of theemissions associated with coal and gas powerplants, including nitrogen oxides, sulfur dioxide,mercury and carbon dioxide. Costs of electricitygeneration by nuclear plants compare favorablywith the costs of generation by other sources.
While the number of nuclear plants hasdeclined due to retirements, nuclear electricitygeneration has steadily increased in recentyears. Several factors have created a more fa-vorable environment for nuclear energy: safe,standardized plant designs; an improved li-censing process; effective safety oversight bythe Nuclear Regulatory Commission (NRC);the advent of new technologies; and uncertain,volatile natural gas prices. This more favorableenvironment has resulted in increased re-li-censing of nuclear plants and the consolida-tion of several plants in the hands of fewer,more experienced operators.
Oil 3%
Figure 1-2The U.S. Needs More Power Plants
The nation is going to require significant new generationcapacity in the next two decades. Depending on demand, theUnited States will need to build between 1,300 and 1,900 newpower plants—or about one new power plant a week.________Source: U.S. Department of Energy, Energy InformationAdministration.
2000 2010 2020
4,500
4,000
3,500
3,000
2,500
0
High Electricity Demand Case
Reference CaseElectricity Generating Capaciity
Existing Capacity Minus Future Retirements
NATIONAL ENERGY POLICY
The nuclear industry is closely regu-lated by the NRC, which provides over-sight of the operation and maintenance ofthese plants. This oversight includes acomprehensive inspection program thatfocuses on the most significant potentialrisks of plant operations, and features full-time resident inspectors at each plant, aswell as regional inspectors with special-ized expertise. In addition to rigorous in-spection criteria, the installation of newdesign features, improvements in operat-ing experience, nuclear safety research,and operator training have all contributedto the nuclear industry’s strong safetyrecord.
An important challenge to the use ofnuclear energy is the issue of safe and
timely long-term storage of spent nuclearfuel and high- and low-level radioactivewaste. Currently, no plans exist to constructany new nuclear plants. However, due tomore favorable conditions, the decline in nu-clear energy generation has not been as rap-id as was predicted only a few years ago, asevidenced by increased re-licensing.
Natural Gas
Natural gas is the third-largest source ofU.S. electricity generation, accounting for 16percent of generation in 2000. Under existingpolicy, natural gas generating capacity is ex-pected to constitute about 90 percent of theprojected increase in electricity generationbetween 1999 and 2020. Electricity generatedby natural gas is expected to grow to 33 per-cent in 2020—a growth driven by electricityrestructuring and the economics of naturalgas power plants. Lower capital costs, shorterconstruction lead times, higher efficiencies,and lower emissions give gas an advantageover coal and other fuels for new generationin most regions of the country.
However, natural gas is not just anelectricity source. It is used in many differ-ent ways, including as vehicle fuel, as indus-trial fuel, and in our homes. In addition, nat-ural gas is used as a feedstock during themanufacturing process of such products aschemicals, rubber, apparel, furniture, paper,clay, glass, and other petroleum and coalproducts. Overall, natural gas accounts for24 percent of total U.S. energy consumedand for all purposes 27 percent of domesticenergy produced.
Eighty-five percent of total U.S. naturalgas consumption is produced domestically.The import share of consumption rose from 5percent in 1987 to 15 percent in 2000, and netimports have comprised more than 50 percentof the growth in gas demand since 1990. Cana-da, with very large gas supplies and easy pipe-line access to the lower 48 states, accounts fornearly all U.S. natural gas imports. Unlike oil,almost all natural gas is produced and soldwithin the same region. Therefore, prices aredetermined by regional, rather than global,markets.
In 2000, natural gas prices moved
1-7
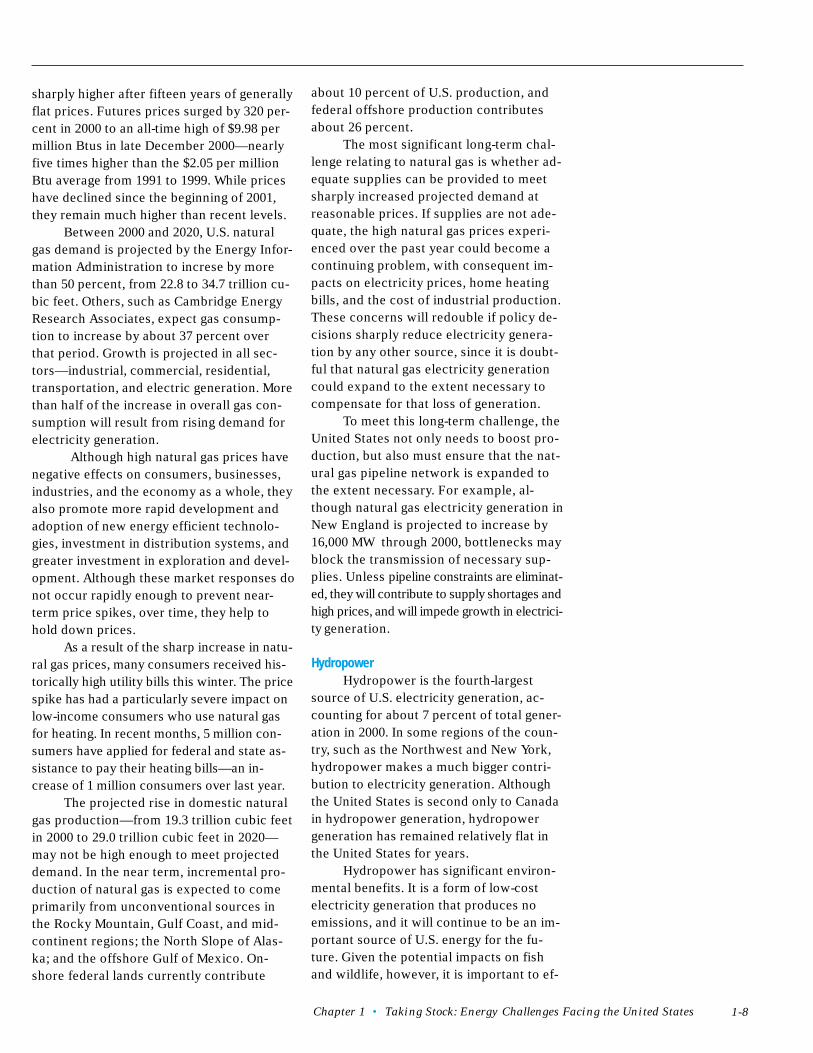
Many Americans received high
heating bills this winter as a re-
sult of sharp increases in natural
gas prices.
Chapter 1 • Taking Stock: Energy Challenges Facing the United States
sharply higher after fifteen years of generallyflat prices. Futures prices surged by 320 per-cent in 2000 to an all-time high of $9.98 permillion Btus in late December 2000—nearlyfive times higher than the $2.05 per millionBtu average from 1991 to 1999. While priceshave declined since the beginning of 2001,they remain much higher than recent levels.
Between 2000 and 2020, U.S. naturalgas demand is projected by the Energy Infor-mation Administration to increse by morethan 50 percent, from 22.8 to 34.7 trillion cu-bic feet. Others, such as Cambridge EnergyResearch Associates, expect gas consump-tion to increase by about 37 percent overthat period. Growth is projected in all sec-tors—industrial, commercial, residential,transportation, and electric generation. Morethan half of the increase in overall gas con-sumption will result from rising demand forelectricity generation.
Although high natural gas prices havenegative effects on consumers, businesses,industries, and the economy as a whole, theyalso promote more rapid development andadoption of new energy efficient technolo-gies, investment in distribution systems, andgreater investment in exploration and devel-opment. Although these market responses donot occur rapidly enough to prevent near-term price spikes, over time, they help tohold down prices.
As a result of the sharp increase in natu-ral gas prices, many consumers received his-torically high utility bills this winter. The pricespike has had a particularly severe impact onlow-income consumers who use natural gasfor heating. In recent months, 5 million con-sumers have applied for federal and state as-sistance to pay their heating bills—an in-crease of 1 million consumers over last year.
The projected rise in domestic naturalgas production—from 19.3 trillion cubic feetin 2000 to 29.0 trillion cubic feet in 2020—may not be high enough to meet projecteddemand. In the near term, incremental pro-duction of natural gas is expected to comeprimarily from unconventional sources inthe Rocky Mountain, Gulf Coast, and mid-continent regions; the North Slope of Alas-ka; and the offshore Gulf of Mexico. On-shore federal lands currently contribute
about 10 percent of U.S. production, andfederal offshore production contributesabout 26 percent.
The most significant long-term chal-lenge relating to natural gas is whether ad-equate supplies can be provided to meetsharply increased projected demand atreasonable prices. If supplies are not ade-quate, the high natural gas prices experi-enced over the past year could become acontinuing problem, with consequent im-pacts on electricity prices, home heatingbills, and the cost of industrial production.These concerns will redouble if policy de-cisions sharply reduce electricity genera-tion by any other source, since it is doubt-ful that natural gas electricity generationcould expand to the extent necessary tocompensate for that loss of generation.
To meet this long-term challenge, theUnited States not only needs to boost pro-duction, but also must ensure that the nat-ural gas pipeline network is expanded tothe extent necessary. For example, al-though natural gas electricity generation inNew England is projected to increase by16,000 MW through 2000, bottlenecks mayblock the transmission of necessary sup-plies. Unless pipeline constraints are eliminat-ed, they will contribute to supply shortages andhigh prices, and will impede growth in electrici-ty generation.
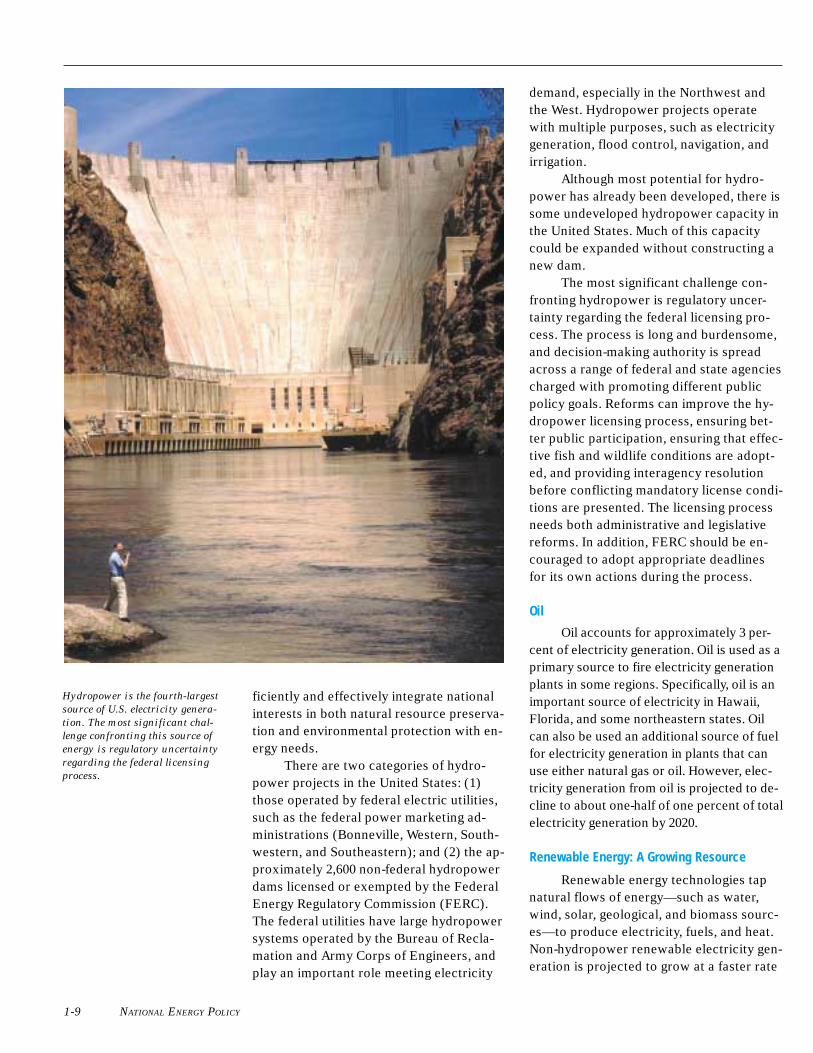
HydropowerHydropower is the fourth-largest
source of U.S. electricity generation, ac-counting for about 7 percent of total gener-ation in 2000. In some regions of the coun-try, such as the Northwest and New York,hydropower makes a much bigger contri-bution to electricity generation. Althoughthe United States is second only to Canadain hydropower generation, hydropowergeneration has remained relatively flat inthe United States for years.
Hydropower has significant environ-mental benefits. It is a form of low-costelectricity generation that produces noemissions, and it will continue to be an im-portant source of U.S. energy for the fu-ture. Given the potential impacts on fishand wildlife, however, it is important to ef-
1-8
NATIONAL ENERGY POLICY
ficiently and effectively integrate nationalinterests in both natural resource preserva-tion and environmental protection with en-ergy needs.
There are two categories of hydro-power projects in the United States: (1)those operated by federal electric utilities,such as the federal power marketing ad-ministrations (Bonneville, Western, South-western, and Southeastern); and (2) the ap-proximately 2,600 non-federal hydropowerdams licensed or exempted by the FederalEnergy Regulatory Commission (FERC).The federal utilities have large hydropowersystems operated by the Bureau of Recla-mation and Army Corps of Engineers, andplay an important role meeting electricity
demand, especially in the Northwest andthe West. Hydropower projects operatewith multiple purposes, such as electricitygeneration, flood control, navigation, andirrigation.
Although most potential for hydro-power has already been developed, there issome undeveloped hydropower capacity inthe United States. Much of this capacitycould be expanded without constructing anew dam.
The most significant challenge con-fronting hydropower is regulatory uncer-tainty regarding the federal licensing pro-cess. The process is long and burdensome,and decision-making authority is spreadacross a range of federal and state agenciescharged with promoting different publicpolicy goals. Reforms can improve the hy-dropower licensing process, ensuring bet-ter public participation, ensuring that effec-tive fish and wildlife conditions are adopt-ed, and providing interagency resolutionbefore conflicting mandatory license condi-tions are presented. The licensing processneeds both administrative and legislativereforms. In addition, FERC should be en-couraged to adopt appropriate deadlinesfor its own actions during the process.
Oil
Oil accounts for approximately 3 per-cent of electricity generation. Oil is used as aprimary source to fire electricity generationplants in some regions. Specifically, oil is animportant source of electricity in Hawaii,Florida, and some northeastern states. Oilcan also be used an additional source of fuelfor electricity generation in plants that canuse either natural gas or oil. However, elec-tricity generation from oil is projected to de-cline to about one-half of one percent of totalelectricity generation by 2020.
Renewable Energy: A Growing Resource
Renewable energy technologies tapnatural flows of energy—such as water,wind, solar, geological, and biomass sourc-es—to produce electricity, fuels, and heat.Non-hydropower renewable electricity gen-eration is projected to grow at a faster rate
1-9
Hydropower is the fourth-largest
source of U.S. electricity genera-
tion. The most significant chal-
lenge confronting this source of
energy is regulatory uncertainty
regarding the federal licensing
process.
Chapter 1 • Taking Stock: Energy Challenges Facing the United States 1-10
than all other generation sources, exceptnatural gas. These sources of energy arecontinuously renewable, can be very clean,are domestically produced, and can gener-ate income for farmers, landowners, andothers. Although its production costs gener-ally remain higher than other sources, re-newable energy has not experienced theprice volatility of other energy resources.
Non-hydropower renewable energysources currently account for only about 4percent of total energy consumption and 2percent of total electricity generation. Thesources of non-hydropower renewable elec-tricity generation are biomass (the directcombustion of plant matter and organic res-idues, such as municipal solid waste use);geothermal (use of naturally occurringsteam and hot water); wind; and solar. Bio-mass and geothermal account for most re-newable electricity generation.
The most important long-term chal-lenge facing renewable energy remains eco-nomic. Renewable energy costs are oftengreater than those of other energy sources.However, these costs have declined sharplyin recent years, due to improved technolo-gy. If this trend continues, renewable ener-gy growth will accelerate. By 2020, non-hydropower renewable energy is expectedto account for 2.8 percent of total electrici-ty generation.
Transportation Energy NeedsOil is the nation’s largest source of
primary energy, serving almost 40 percentof U.S. energy needs. In 2000, the UnitedStates consumed an average of 19.5 millionbarrels of oil every day. Transportation fu-els account for about two-thirds of our oilconsumption, and the industrial sector for25 percent. Residential and commercialuses, such as heating oil and propane—im-portant fuels in the Northeast and Mid-west—account for most of the rest.
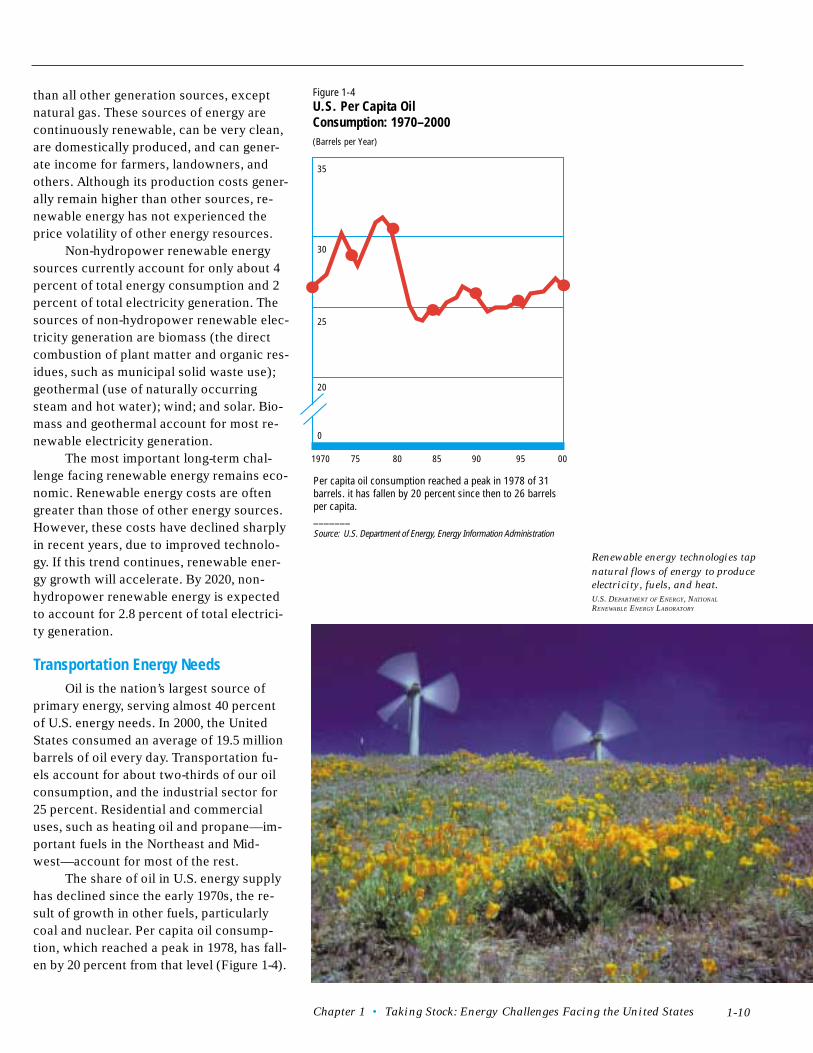
The share of oil in U.S. energy supplyhas declined since the early 1970s, the re-sult of growth in other fuels, particularlycoal and nuclear. Per capita oil consump-tion, which reached a peak in 1978, has fall-en by 20 percent from that level (Figure 1-4).
35
30
25
20
0
1970 75 80 85 90 95 00
Per capita oil consumption reached a peak in 1978 of 31barrels. it has fallen by 20 percent since then to 26 barrelsper capita._______Source: U.S. Department of Energy, Energy Information Administration
Figure 1-4U.S. Per Capita OilConsumption: 1970–2000(Barrels per Year)
Renewable energy technologies tap
natural flows of energy to produce
electricity, fuels, and heat.
U.S. DEPARTMENT OF ENERGY, NATIONAL
RENEWABLE ENERGY LABORATORY
NATIONAL ENERGY POLICY
In 2020, oil is projected to account forroughly the same share of U.S. energy con-sumption as it does today.
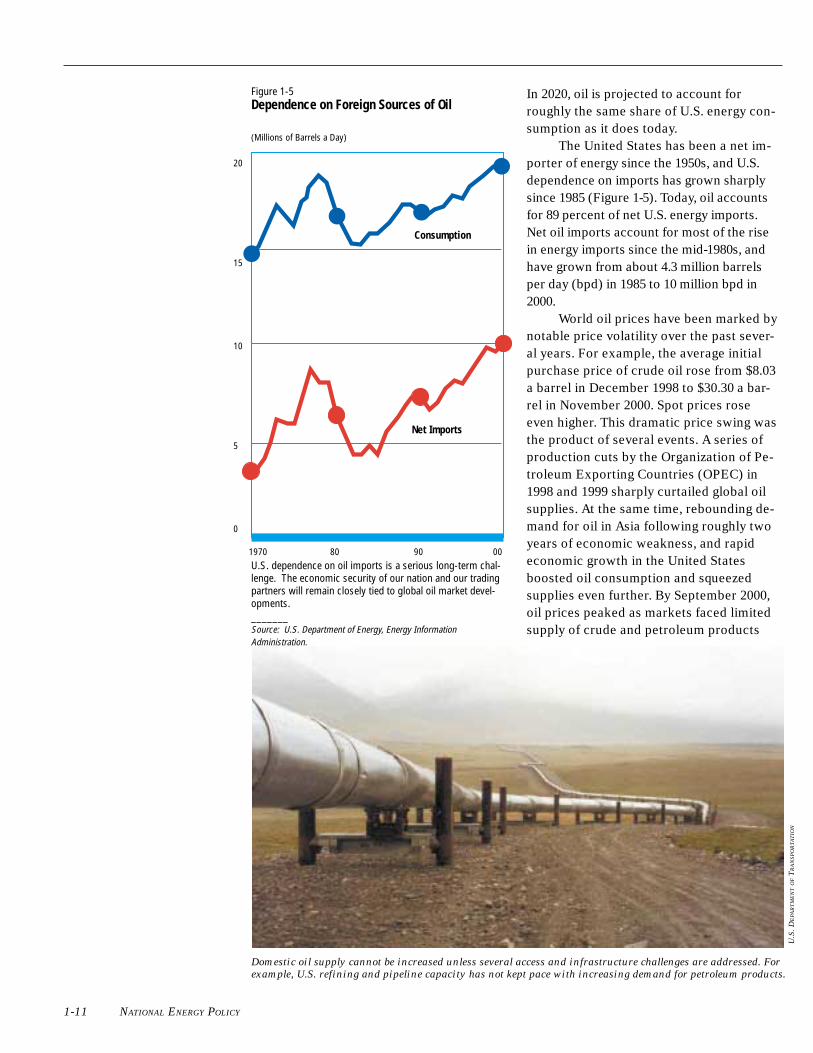
The United States has been a net im-porter of energy since the 1950s, and U.S.dependence on imports has grown sharplysince 1985 (Figure 1-5). Today, oil accountsfor 89 percent of net U.S. energy imports.Net oil imports account for most of the risein energy imports since the mid-1980s, andhave grown from about 4.3 million barrelsper day (bpd) in 1985 to 10 million bpd in2000.
World oil prices have been marked bynotable price volatility over the past sever-al years. For example, the average initialpurchase price of crude oil rose from $8.03a barrel in December 1998 to $30.30 a bar-rel in November 2000. Spot prices roseeven higher. This dramatic price swing wasthe product of several events. A series ofproduction cuts by the Organization of Pe-troleum Exporting Countries (OPEC) in1998 and 1999 sharply curtailed global oilsupplies. At the same time, rebounding de-mand for oil in Asia following roughly twoyears of economic weakness, and rapideconomic growth in the United Statesboosted oil consumption and squeezedsupplies even further. By September 2000,oil prices peaked as markets faced limitedsupply of crude and petroleum products
For Position Only
1-11
Domestic oil supply cannot be increased unless several access and infrastructure challenges are addressed. For
example, U.S. refining and pipeline capacity has not kept pace with increasing demand for petroleum products.
U.S
. D
EPA
RT
ME
NT O
F T
RA
NS
PO
RT
AT
ION
1970 80 90 00
Net Imports
Consumption
U.S. dependence on oil imports is a serious long-term chal-lenge. The economic security of our nation and our tradingpartners will remain closely tied to global oil market devel-opments._______Source: U.S. Department of Energy, Energy InformationAdministration.
Figure 1-5Dependence on Foreign Sources of Oil
(Millions of Barrels a Day)
20
15
10
5
0
Chapter 1 • Taking Stock: Energy Challenges Facing the United States
ahead of the winter season, when demandis typically higher. In December 2000, oilprices fell after the market absorbed the im-pact of a series of OPEC production in-creases.
This recent price volatility illustratesthe effect of intermittent market power ex-erted by cartel behavior in a global petro-leum market. Moreover, prices are set in amarket where supply is geographically con-centrated. Almost two-thirds of world prov-en reserves are in the Middle East. Else-where, Central and South America accountfor 9 percent; Africa, 7 percent; NorthAmerica, 5 percent; Eastern Europe and theformer Soviet Union, 5 percent; the rest ofAsia, 4 percent; and Western Europe, 2 per-cent. OPEC’s huge oil reserves and produc-tion capacity and its periodic efforts to in-fluence prices add to volatility in the mar-ket.
Oil prices are expected to remain highthrough 2002, affecting the cost of transpor-tation, heating, electricity generation, andindustrial production. High oil prices meanhigh prices for petroleum products, such asgasoline, diesel fuel, heating oil, propane,and jet fuel. The summer 2001 base case av-erage gasoline price from the Departmentof Energy Short-Term Energy Outlook is$1.49 per gallon. However, prices have risenmore rapidly than anticipated since the re-port’s release, and a much higher summeraverage in the range of $1.50 to $1.65 pergallon is likely. Some areas have already ex-perienced gasoline prices above $2.00 pergallon. Gasoline inventories going into thedriving season are projected to be lowerthan last year, which could set the stage forregional supply problems that once againcreate significant price volatility in gasolinemarkets.
Price Volatility in Gasoline Markets
During the early summer of 2000, lowinventories set the stage for a gasoline pricerun-up in the Midwest. Several pipeline andrefinery problems sent marketers scram-bling for limited supplies of both reformu-lated gasoline (RFG) and conventional gas-oline, driving prices up rapidly. In Chicago,the spot price for blend stock for RFG, ex-
cluding ethanol, doubled in about six weeks,from 83 cents per gallon on April 25 to $1.65on June 7. Spot prices then fell back overthe next five weeks to 84 cents on July 12 asextra supply began arriving. Retail regular-grade RFG prices in the Midwest rose from$1.47 on April 24 to just over $2.00 per gal-lon on June 19, before falling back to $1.43by July 24, showing the typical tendency of
1-12
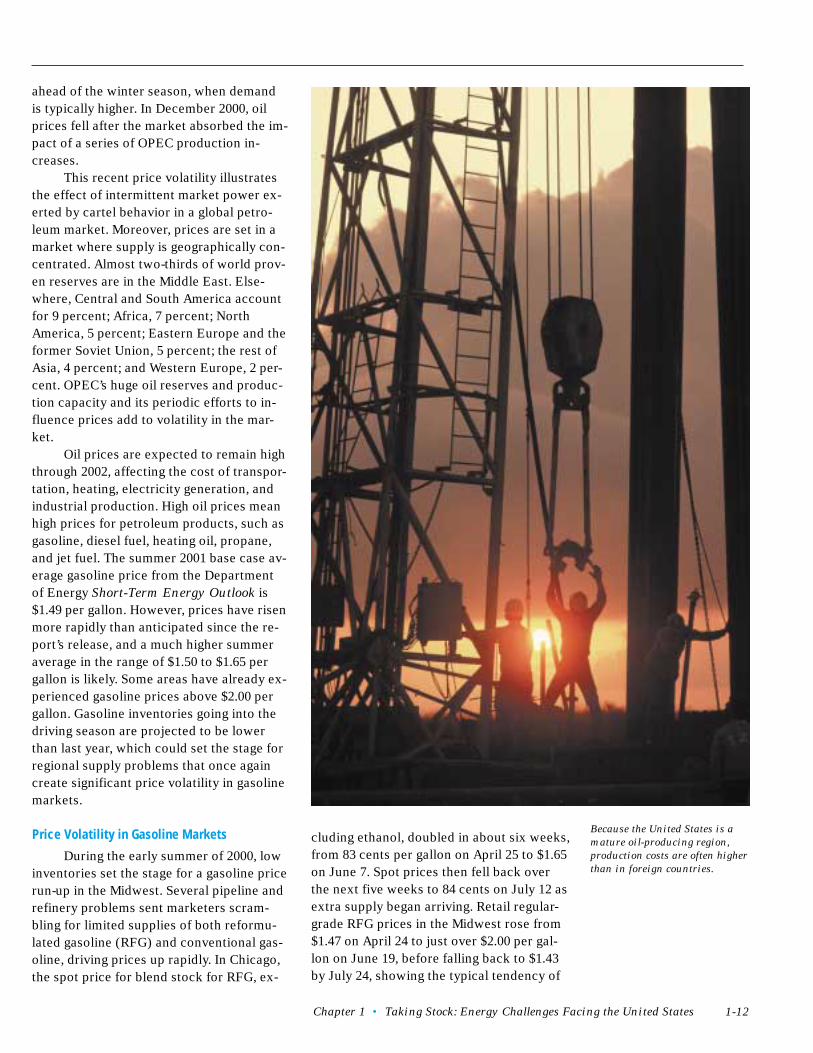
Because the United States is a
mature oil-producing region,
production costs are often higher
than in foreign countries.
NATIONAL ENERGY POLICY
retail prices to lag spot price changes.Refiners face additional challenges as
a result of various state and local clean fuelrequirements for distinct gasoline blends(“boutique fuels”). These different require-ments sometimes make it difficult, if notimpossible, to draw on gasoline suppliesfrom nearby areas or states to meet localneeds when the normal supply is disrupted.
In 2000, very low inventories of gaso-line and other refined products on the U.S.East and Gulf coasts increased the mar-ket’s susceptibility to external shocks, suchas operating problems in refineries or pipe-lines, or short-term surges in demand. Lastwinter, heating oil prices were at near-record levels. During 2000, the federal gov-ernment reduced the vulnerability of theNortheast to heating oil shortages, such asthose experienced in January 2000, by cre-ating a 2-million-barrel heating oil reservein New Jersey and Connecticut.
Because the United States is a matureoil-producing region, production costs areoften higher than in foreign countries, par-ticularly OPEC countries. In addition, ac-cess to promising domestic oil reserves islimited. U.S. oil production in the lower 48states reached its peak in 1970 at 9.4 mil-lion bpd. A surge in Alaskan North Slopeoil production beginning in the late 1970shelped postpone the decline in overall U.S.production, but Alaska’s productionpeaked in 1988 at 2 million bpd, and fell to1 million bpd by 2000. By then, U.S. totaloil output had fallen to 5.8 million bpd, 39percent below its peak.
By 2020, U.S. oil production is pro-jected to decline from 5.8 to 5.1 millionbpd under current policy. However, oil con-sumption is expected to rise to 25.8 millionbpd by 2020, primarily due to growth inconsumption of transportation fuels. Givenexisting law, production from offshoresources, particularly the Gulf of Mexico, ispredicted to play an increasingly importantrole in the future, accounting for a project-ed high of 40 percent of domestic oil pro-duction by 2010, up from 27 percent today.Technological advances can mitigate thedecline in U.S. oil production by enhancingrecovery from domestic oil reserves and
lowering production costs.Our projected growing dependence
on oil imports is a serious long-term chal-lenge. U.S. economic security and that ofour trading partners will remain closelytied to global oil market developments.Without a change in current policy, theshare of U.S. oil demand met by net im-ports is projected to increase from 52 per-cent in 2000 to 64 percent in 2020. By 2020,the oil for nearly two of every three gallonsof our gasoline and heating oil could comefrom foreign countries. The sources of thisimported oil have changed considerablyover the last thirty years, with more of ourimports coming from the Western Hemi-sphere. Despite progress in diversifyingour oil suppliers over the past two decades,the U.S. and global economies remain vul-nerable to a major disruption of oil sup-plies.
The Strategic Petroleum Reserve(SPR), the federal government’s major toolfor responding to oil supply disruptions,has not kept pace with the growth in im-ports. The number of days of net oil importprotection provided by the Reserve de-clined from 83 days of imports in 1992 to 54days of imports today. Net domestic oil im-ports have increased significantly since1992, while the SPR’s oil inventory actuallydecreased.
Domestic oil supply cannot be in-creased unless several access and infra-structure challenges are addressed. U.S. re-fining and pipeline capacity has not keptpace with increasing demand for petroleumproducts. Unless changes take place, thenet effect will likely be increased imports,regionally tight markets, and circumstancesin which prices for gasoline, heating oil,and other products rise independently ofoil prices.
Greater price volatility for gasoline,diesel fuel, heating oil, propane, and jet fuelis likely to become a larger problem overtime, unless additional refining capacityand expanded distribution infrastructurecan be developed at the same time cleanerproducts are required. Increasing domesticoil production and reducing demand, par-ticularly for transportation fuels, will re-
1-13
Chapter 1 • Taking Stock: Energy Challenges Facing the United States
tributionThe success of the federal alternative
fuels program has been limited, however.The program focuses on mandating that cer-tain fleet operators purchase alternative fu-eled vehicles. The hope was that this vehi-cle purchase mandate would lead to ex-panded use of alternative fuels. That expec-tation has not been realized, since mostfleet operators purchase dual-fueled vehi-cles that operate on petroleum motor fuels.Reforms to the federal alternative fuels pro-gram could promote alternative fuels use,such as expanding the development of analternative fuels infrastructure.
quire adoption of a comprehensive nationalenergy policy.
Alternative Transportation Fuels
Development of alternative fuels suchas ethanol and other biofuels (liquid fuelsderived from organic matter, such ascrops), natural gas, and electricity, can helpdiversify the transportation sector that is soreliant on oil.
Ethanol, a biofuel based on starchcrops such as corn, is already making a sig-nificant contribution to U.S. energy securi-ty, displacing more oil than any other alter-native fuel. Other biofuels, such as biodie-sel, which can be made from soybean,canola oils, animal fats, and vegetable oils,are making an increasingly important con-
Summary of Recommendations
Taking Stock: Energy Challenges Facing the United States
★ The NEPD Group recommends that the President issue an Executive Order to di-rect all federal agencies to include in any regulatory action that could significantly andadversely affect energy supplies, distribution, or use, a detailed statement on: (1) theenergy impact of the proposed action, (2) any adverse energy effects that cannot beavoided should the proposal be implemented, and (3) alternatives to the proposed ac-tion. The agencies would be directed to include this statement in all submissions to theOffice of Management and Budget of proposed regulations covered by Executive Or-der 12866, as well as in all notices of proposed regulations published in the FederalRegister.
★ The NEPD Group recommends that the President direct the executive agencies towork closely with Congress to implement the legislative components of a national en-ergy policy.
★ The NEPD Group recommends to the President that the NEPD Group continue towork and meet on the implementation of the National Energy Policy, and to exploreother ways to advance dependable, affordable, and environmentally responsible pro-duction and distribution of energy.
Note: All recommendations in this report are subject to execution in accordance with applica-
ble law. Legislation would be sought where needed. Also, any recommendations that involve
foreign countries would be executed in accordance with the customs of international
relations, including appropriate diplomatic consultation.
1-14
NATIONAL ENERGY POLICY
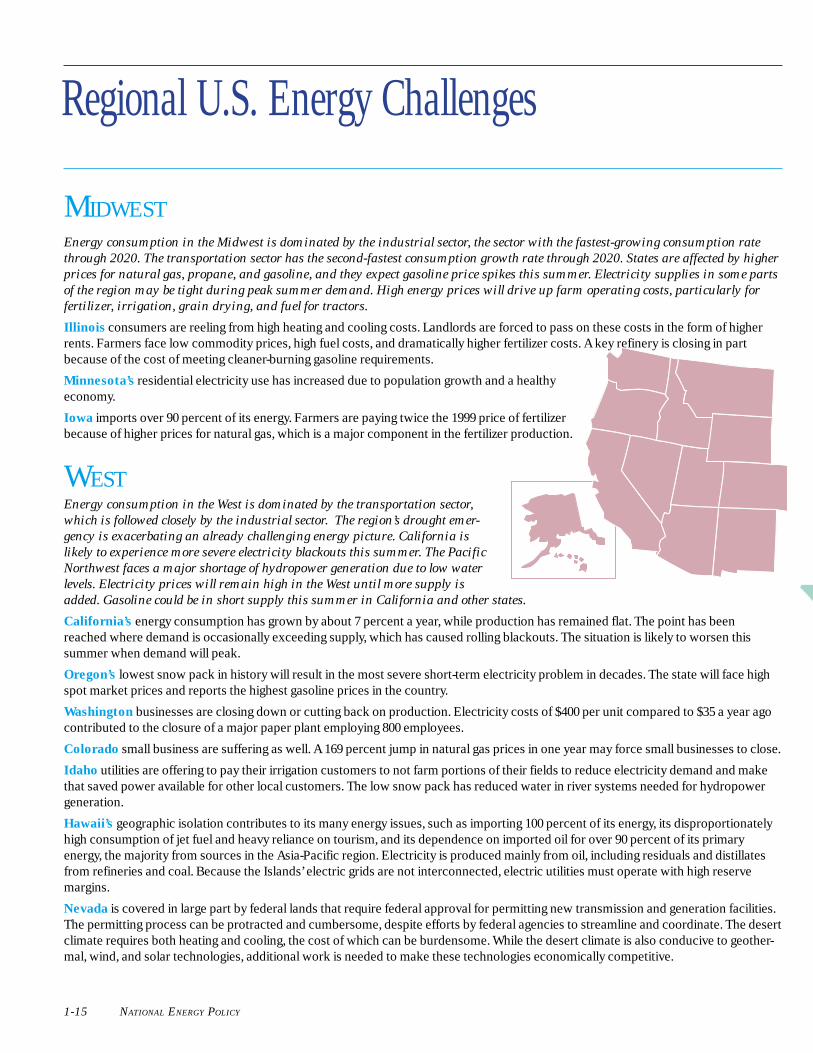
MIDWESTEnergy consumption in the Midwest is dominated by the industrial sector, the sector with the fastest-growing consumption rate
through 2020. The transportation sector has the second-fastest consumption growth rate through 2020. States are affected by higher
prices for natural gas, propane, and gasoline, and they expect gasoline price spikes this summer. Electricity supplies in some parts
of the region may be tight during peak summer demand. High energy prices will drive up farm operating costs, particularly for
fertilizer, irrigation, grain drying, and fuel for tractors.
Illinois consumers are reeling from high heating and cooling costs. Landlords are forced to pass on these costs in the form of higherrents. Farmers face low commodity prices, high fuel costs, and dramatically higher fertilizer costs. A key refinery is closing in partbecause of the cost of meeting cleaner-burning gasoline requirements.
Minnesota’s residential electricity use has increased due to population growth and a healthyeconomy.
Iowa imports over 90 percent of its energy. Farmers are paying twice the 1999 price of fertilizerbecause of higher prices for natural gas, which is a major component in the fertilizer production.
WESTEnergy consumption in the West is dominated by the transportation sector,
which is followed closely by the industrial sector. The region’s drought emer-
gency is exacerbating an already challenging energy picture. California is
likely to experience more severe electricity blackouts this summer. The Pacific
Northwest faces a major shortage of hydropower generation due to low water
levels. Electricity prices will remain high in the West until more supply is
added. Gasoline could be in short supply this summer in California and other states.
California’s energy consumption has grown by about 7 percent a year, while production has remained flat. The point has beenreached where demand is occasionally exceeding supply, which has caused rolling blackouts. The situation is likely to worsen thissummer when demand will peak.
Oregon’s lowest snow pack in history will result in the most severe short-term electricity problem in decades. The state will face highspot market prices and reports the highest gasoline prices in the country.
Washington businesses are closing down or cutting back on production. Electricity costs of $400 per unit compared to $35 a year agocontributed to the closure of a major paper plant employing 800 employees.
Colorado small business are suffering as well. A 169 percent jump in natural gas prices in one year may force small businesses to close.
Idaho utilities are offering to pay their irrigation customers to not farm portions of their fields to reduce electricity demand and makethat saved power available for other local customers. The low snow pack has reduced water in river systems needed for hydropowergeneration.
Hawaii’s geographic isolation contributes to its many energy issues, such as importing 100 percent of its energy, its disproportionatelyhigh consumption of jet fuel and heavy reliance on tourism, and its dependence on imported oil for over 90 percent of its primaryenergy, the majority from sources in the Asia-Pacific region. Electricity is produced mainly from oil, including residuals and distillatesfrom refineries and coal. Because the Islands’ electric grids are not interconnected, electric utilities must operate with high reservemargins.
Nevada is covered in large part by federal lands that require federal approval for permitting new transmission and generation facilities.The permitting process can be protracted and cumbersome, despite efforts by federal agencies to streamline and coordinate. The desertclimate requires both heating and cooling, the cost of which can be burdensome. While the desert climate is also conducive to geother-mal, wind, and solar technologies, additional work is needed to make these technologies economically competitive.
1-15
Regional U.S. Energy Challenges
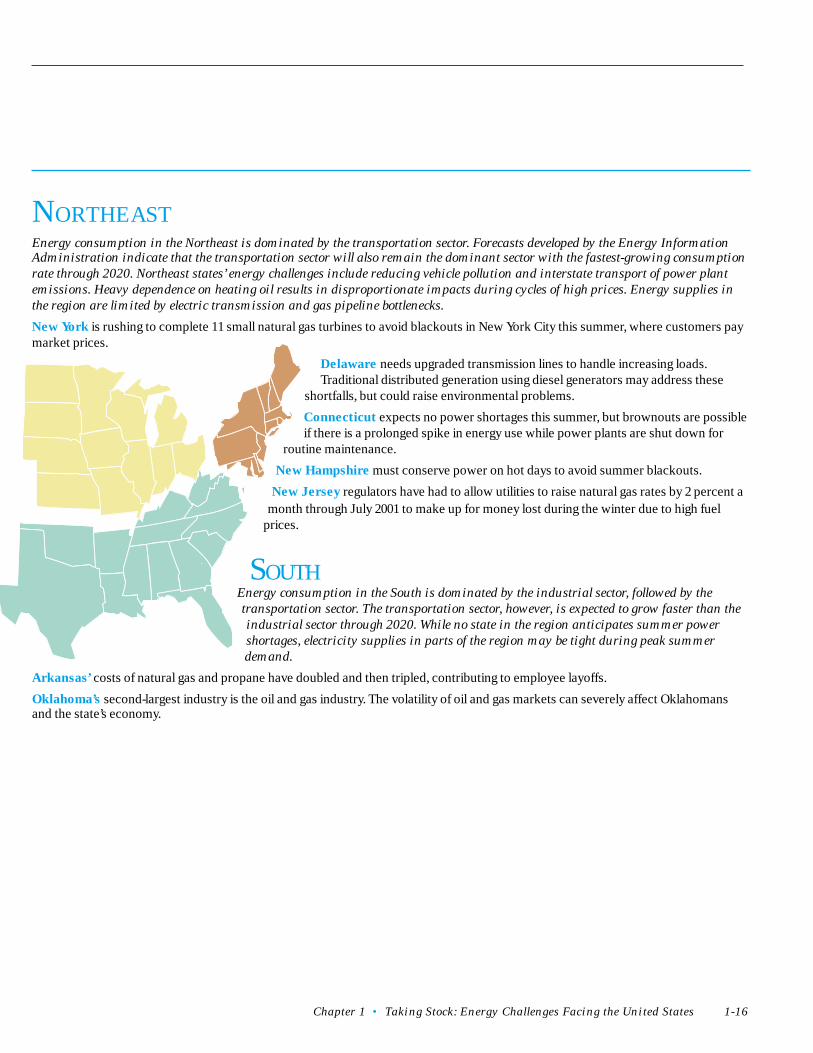
Chapter 1 • Taking Stock: Energy Challenges Facing the United States 1-16
NORTHEASTEnergy consumption in the Northeast is dominated by the transportation sector. Forecasts developed by the Energy Information
Administration indicate that the transportation sector will also remain the dominant sector with the fastest-growing consumption
rate through 2020. Northeast states’ energy challenges include reducing vehicle pollution and interstate transport of power plant
emissions. Heavy dependence on heating oil results in disproportionate impacts during cycles of high prices. Energy supplies in
the region are limited by electric transmission and gas pipeline bottlenecks.
New York is rushing to complete 11 small natural gas turbines to avoid blackouts in New York City this summer, where customers paymarket prices.
Delaware needs upgraded transmission lines to handle increasing loads.Traditional distributed generation using diesel generators may address these
shortfalls, but could raise environmental problems.
Connecticut expects no power shortages this summer, but brownouts are possibleif there is a prolonged spike in energy use while power plants are shut down for
routine maintenance.
New Hampshire must conserve power on hot days to avoid summer blackouts.
New Jersey regulators have had to allow utilities to raise natural gas rates by 2 percent amonth through July 2001 to make up for money lost during the winter due to high fuel
prices.
SOUTHEnergy consumption in the South is dominated by the industrial sector, followed by the
transportation sector. The transportation sector, however, is expected to grow faster than the
industrial sector through 2020. While no state in the region anticipates summer power
shortages, electricity supplies in parts of the region may be tight during peak summer
demand.
Arkansas’ costs of natural gas and propane have doubled and then tripled, contributing to employee layoffs.
Oklahoma’s second-largest industry is the oil and gas industry. The volatility of oil and gas markets can severely affect Oklahomansand the state’s economy.
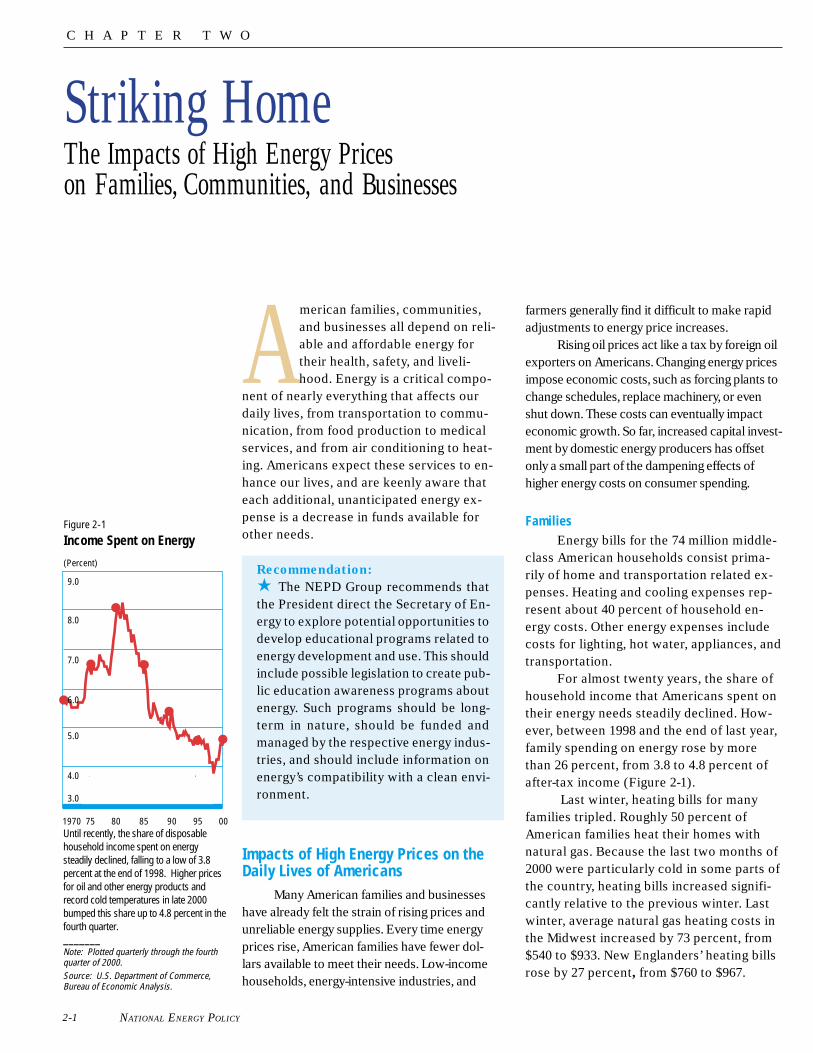
NATIONAL ENERGY POLICY
American families, communities,and businesses all depend on reli-able and affordable energy fortheir health, safety, and liveli-hood. Energy is a critical compo-
nent of nearly everything that affects ourdaily lives, from transportation to commu-nication, from food production to medicalservices, and from air conditioning to heat-ing. Americans expect these services to en-hance our lives, and are keenly aware thateach additional, unanticipated energy ex-pense is a decrease in funds available forother needs.
Impacts of High Energy Prices on theDaily Lives of Americans
Many American families and businesseshave already felt the strain of rising prices andunreliable energy supplies. Every time energyprices rise, American families have fewer dol-lars available to meet their needs. Low-incomehouseholds, energy-intensive industries, and
Striking HomeThe Impacts of High Energy Priceson Families, Communities, and Businesses
farmers generally find it difficult to make rapidadjustments to energy price increases.
Rising oil prices act like a tax by foreign oilexporters on Americans. Changing energy pricesimpose economic costs, such as forcing plants tochange schedules, replace machinery, or evenshut down. These costs can eventually impacteconomic growth. So far, increased capital invest-ment by domestic energy producers has offsetonly a small part of the dampening effects ofhigher energy costs on consumer spending.
FamiliesEnergy bills for the 74 million middle-
class American households consist prima-rily of home and transportation related ex-penses. Heating and cooling expenses rep-resent about 40 percent of household en-ergy costs. Other energy expenses includecosts for lighting, hot water, appliances, andtransportation.
For almost twenty years, the share ofhousehold income that Americans spent ontheir energy needs steadily declined. How-ever, between 1998 and the end of last year,family spending on energy rose by morethan 26 percent, from 3.8 to 4.8 percent ofafter-tax income (Figure 2-1).
Last winter, heating bills for manyfamilies tripled. Roughly 50 percent ofAmerican families heat their homes withnatural gas. Because the last two months of2000 were particularly cold in some parts ofthe country, heating bills increased signifi-cantly relative to the previous winter. Lastwinter, average natural gas heating costs inthe Midwest increased by 73 percent, from$540 to $933. New Englanders’ heating billsrose by 27 percent, from $760 to $967.
1970 75 80 85 90 95 00Until recently, the share of disposablehousehold income spent on energysteadily declined, falling to a low of 3.8percent at the end of 1998. Higher pricesfor oil and other energy products andrecord cold temperatures in late 2000bumped this share up to 4.8 percent in thefourth quarter._______Note: Plotted quarterly through the fourthquarter of 2000.Source: U.S. Department of Commerce,Bureau of Economic Analysis.
9.0
8.0
7.0
6.0
5.0
4.0
3.0
Figure 2-1
Income Spent on Energy
(Percent)Recommendation:
★ The NEPD Group recommends thatthe President direct the Secretary of En-ergy to explore potential opportunities todevelop educational programs related toenergy development and use. This shouldinclude possible legislation to create pub-lic education awareness programs aboutenergy. Such programs should be long-term in nature, should be funded andmanaged by the respective energy indus-tries, and should include information onenergy’s compatibility with a clean envi-ronment.
C H A P T E R T W O
2-1

Chapter 2 • Striking Home: The Impacts of High Energy Prices on Families, Communities, and BusinessesStriking Home: The Impacts of High Energy Pricess on Families, Commubnities, and Businesses 17
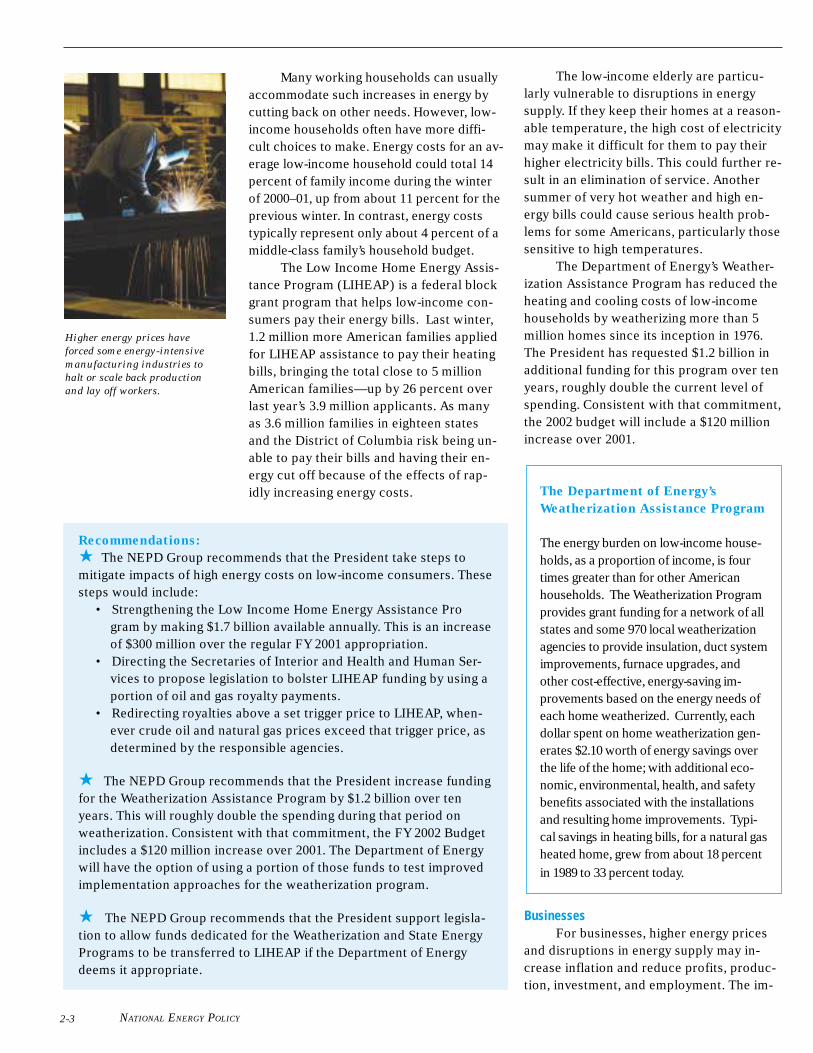
NATIONAL ENERGY POLICY
Many working households can usuallyaccommodate such increases in energy bycutting back on other needs. However, low-income households often have more diffi-cult choices to make. Energy costs for an av-erage low-income household could total 14percent of family income during the winterof 2000–01, up from about 11 percent for theprevious winter. In contrast, energy coststypically represent only about 4 percent of amiddle-class family’s household budget.
The Low Income Home Energy Assis-tance Program (LIHEAP) is a federal blockgrant program that helps low-income con-sumers pay their energy bills. Last winter,1.2 million more American families appliedfor LIHEAP assistance to pay their heatingbills, bringing the total close to 5 millionAmerican families—up by 26 percent overlast year’s 3.9 million applicants. As manyas 3.6 million families in eighteen statesand the District of Columbia risk being un-able to pay their bills and having their en-ergy cut off because of the effects of rap-idly increasing energy costs.
2-3
The low-income elderly are particu-larly vulnerable to disruptions in energysupply. If they keep their homes at a reason-able temperature, the high cost of electricitymay make it difficult for them to pay theirhigher electricity bills. This could further re-sult in an elimination of service. Anothersummer of very hot weather and high en-ergy bills could cause serious health prob-lems for some Americans, particularly thosesensitive to high temperatures.
The Department of Energy’s Weather-ization Assistance Program has reduced theheating and cooling costs of low-incomehouseholds by weatherizing more than 5million homes since its inception in 1976.The President has requested $1.2 billion inadditional funding for this program over tenyears, roughly double the current level ofspending. Consistent with that commitment,the 2002 budget will include a $120 millionincrease over 2001.
The Department of Energy’s
Weatherization Assistance Program:
The energy burden on low-income house-holds, as a proportion of income, is fourtimes greater than for other Americanhouseholds. The Weatherization Programprovides grant funding for a network of allstates and some 970 local weatherizationagencies to provide insulation, duct systemimprovements, furnace upgrades, andother cost-effective, energy-saving im-provements based on the energy needs ofeach home weatherized. Currently, eachdollar spent on home weatherization gen-erates $2.10 worth of energy savings overthe life of the home; with additional eco-nomic, environmental, health, and safetybenefits associated with the installationsand resulting home improvements. Typi-cal savings in heating bills, for a natural gasheated home, grew from about 18 percentin 1989 to 33 percent today.
BusinessesFor businesses, higher energy prices
and disruptions in energy supply may in-crease inflation and reduce profits, produc-tion, investment, and employment. The im-
Higher energy prices have
forced some energy-intensive
manufacturing industries to
halt or scale back production
and lay off workers.
Recommendations:
★ The NEPD Group recommends that the President take steps tomitigate impacts of high energy costs on low-income consumers. Thesesteps would include:
• Strengthening the Low Income Home Energy Assistance Program by making $1.7 billion available annually. This is an increaseof $300 million over the regular FY 2001 appropriation.
• Directing the Secretaries of Interior and Health and Human Ser-vices to propose legislation to bolster LIHEAP funding by using aportion of oil and gas royalty payments.
• Redirecting royalties above a set trigger price to LIHEAP, when-ever crude oil and natural gas prices exceed that trigger price, asdetermined by the responsible agencies.
★ The NEPD Group recommends that the President increase fundingfor the Weatherization Assistance Program by $1.2 billion over tenyears. This will roughly double the spending during that period onweatherization. Consistent with that commitment, the FY 2002 Budgetincludes a $120 million increase over 2001. The Department of Energywill have the option of using a portion of those funds to test improvedimplementation approaches for the weatherization program.
★ The NEPD Group recommends that the President support legisla-tion to allow funds dedicated for the Weatherization and State EnergyPrograms to be transferred to LIHEAP if the Department of Energydeems it appropriate.
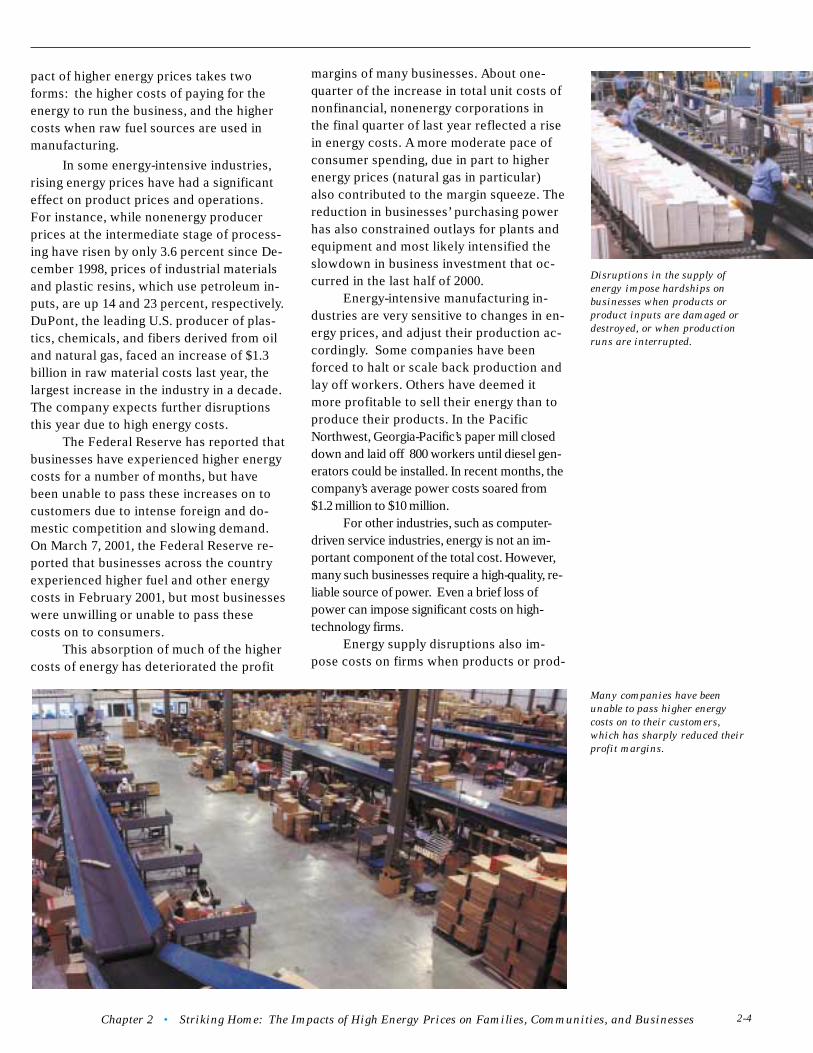
Chapter 2 • Striking Home: The Impacts of High Energy Prices on Families, Communities, and Businesses
pact of higher energy prices takes twoforms: the higher costs of paying for theenergy to run the business, and the highercosts when raw fuel sources are used inmanufacturing.
In some energy-intensive industries,rising energy prices have had a significanteffect on product prices and operations.For instance, while nonenergy producerprices at the intermediate stage of process-ing have risen by only 3.6 percent since De-cember 1998, prices of industrial materialsand plastic resins, which use petroleum in-puts, are up 14 and 23 percent, respectively.DuPont, the leading U.S. producer of plas-tics, chemicals, and fibers derived from oiland natural gas, faced an increase of $1.3billion in raw material costs last year, thelargest increase in the industry in a decade.The company expects further disruptionsthis year due to high energy costs.
The Federal Reserve has reported thatbusinesses have experienced higher energycosts for a number of months, but havebeen unable to pass these increases on tocustomers due to intense foreign and do-mestic competition and slowing demand.On March 7, 2001, the Federal Reserve re-ported that businesses across the countryexperienced higher fuel and other energycosts in February 2001, but most businesseswere unwilling or unable to pass thesecosts on to consumers.
This absorption of much of the highercosts of energy has deteriorated the profit
margins of many businesses. About one-quarter of the increase in total unit costs ofnonfinancial, nonenergy corporations inthe final quarter of last year reflected a risein energy costs. A more moderate pace ofconsumer spending, due in part to higherenergy prices (natural gas in particular)also contributed to the margin squeeze. Thereduction in businesses’ purchasing powerhas also constrained outlays for plants andequipment and most likely intensified theslowdown in business investment that oc-curred in the last half of 2000.
Energy-intensive manufacturing in-dustries are very sensitive to changes in en-ergy prices, and adjust their production ac-cordingly. Some companies have beenforced to halt or scale back production andlay off workers. Others have deemed itmore profitable to sell their energy than toproduce their products. In the PacificNorthwest, Georgia-Pacific’s paper mill closeddown and laid off 800 workers until diesel gen-erators could be installed. In recent months, thecompany’s average power costs soared from$1.2 million to $10 million.
For other industries, such as computer-driven service industries, energy is not an im-portant component of the total cost. However,many such businesses require a high-quality, re-liable source of power. Even a brief loss ofpower can impose significant costs on high-technology firms.
Energy supply disruptions also im-pose costs on firms when products or prod-
Disruptions in the supply of
energy impose hardships on
businesses when products or
product inputs are damaged or
destroyed, or when production
runs are interrupted.
Many companies have been
unable to pass higher energy
costs on to their customers,
which has sharply reduced their
profit margins.
2-4
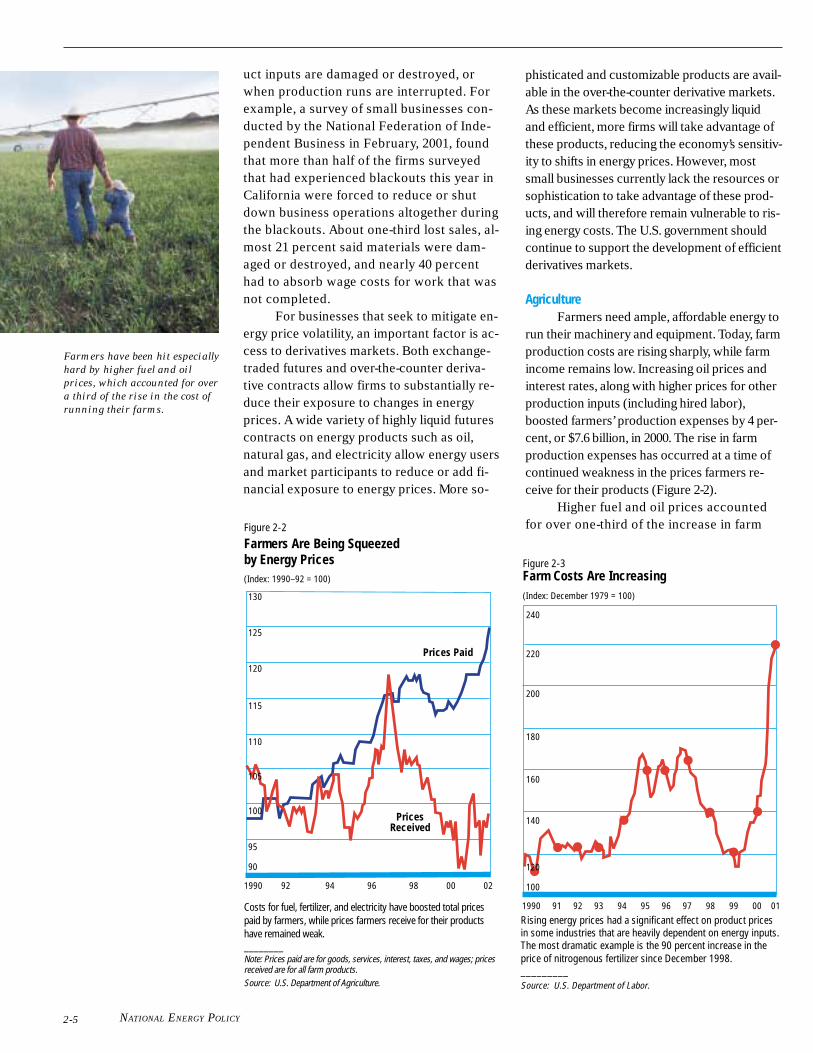
NATIONAL ENERGY POLICY
uct inputs are damaged or destroyed, orwhen production runs are interrupted. Forexample, a survey of small businesses con-ducted by the National Federation of Inde-pendent Business in February, 2001, foundthat more than half of the firms surveyedthat had experienced blackouts this year inCalifornia were forced to reduce or shutdown business operations altogether duringthe blackouts. About one-third lost sales, al-most 21 percent said materials were dam-aged or destroyed, and nearly 40 percenthad to absorb wage costs for work that wasnot completed.
For businesses that seek to mitigate en-ergy price volatility, an important factor is ac-cess to derivatives markets. Both exchange-traded futures and over-the-counter deriva-tive contracts allow firms to substantially re-duce their exposure to changes in energyprices. A wide variety of highly liquid futurescontracts on energy products such as oil,natural gas, and electricity allow energy usersand market participants to reduce or add fi-nancial exposure to energy prices. More so-
Farmers have been hit especially
hard by higher fuel and oil
prices, which accounted for over
a third of the rise in the cost of
running their farms.
2-5
phisticated and customizable products are avail-able in the over-the-counter derivative markets.As these markets become increasingly liquidand efficient, more firms will take advantage ofthese products, reducing the economy’s sensitiv-ity to shifts in energy prices. However, mostsmall businesses currently lack the resources orsophistication to take advantage of these prod-ucts, and will therefore remain vulnerable to ris-ing energy costs. The U.S. government shouldcontinue to support the development of efficientderivatives markets.
AgricultureFarmers need ample, affordable energy to
run their machinery and equipment. Today, farmproduction costs are rising sharply, while farmincome remains low. Increasing oil prices andinterest rates, along with higher prices for otherproduction inputs (including hired labor),boosted farmers’ production expenses by 4 per-cent, or $7.6 billion, in 2000. The rise in farmproduction expenses has occurred at a time ofcontinued weakness in the prices farmers re-ceive for their products (Figure 2-2).
Higher fuel and oil prices accountedfor over one-third of the increase in farmFigure 2-2
Farmers Are Being Squeezedby Energy Prices(Index: 1990–92 = 100)
Costs for fuel, fertilizer, and electricity have boosted total pricespaid by farmers, while prices farmers receive for their productshave remained weak.________Note: Prices paid are for goods, services, interest, taxes, and wages; pricesreceived are for all farm products.Source: U.S. Department of Agriculture.
130
125
120
115
110
105
100
95
90
PricesReceived
Prices Paid
1990 92 94 96 98 00 02
Figure 2-3Farm Costs Are Increasing(Index: December 1979 = 100)
1990 91 92 93 94 95 96 97 98 99 00 01
Rising energy prices had a significant effect on product pricesin some industries that are heavily dependent on energy inputs.The most dramatic example is the 90 percent increase in theprice of nitrogenous fertilizer since December 1998._________Source: U.S. Department of Labor.
240
220
200
180
160
140
120
100
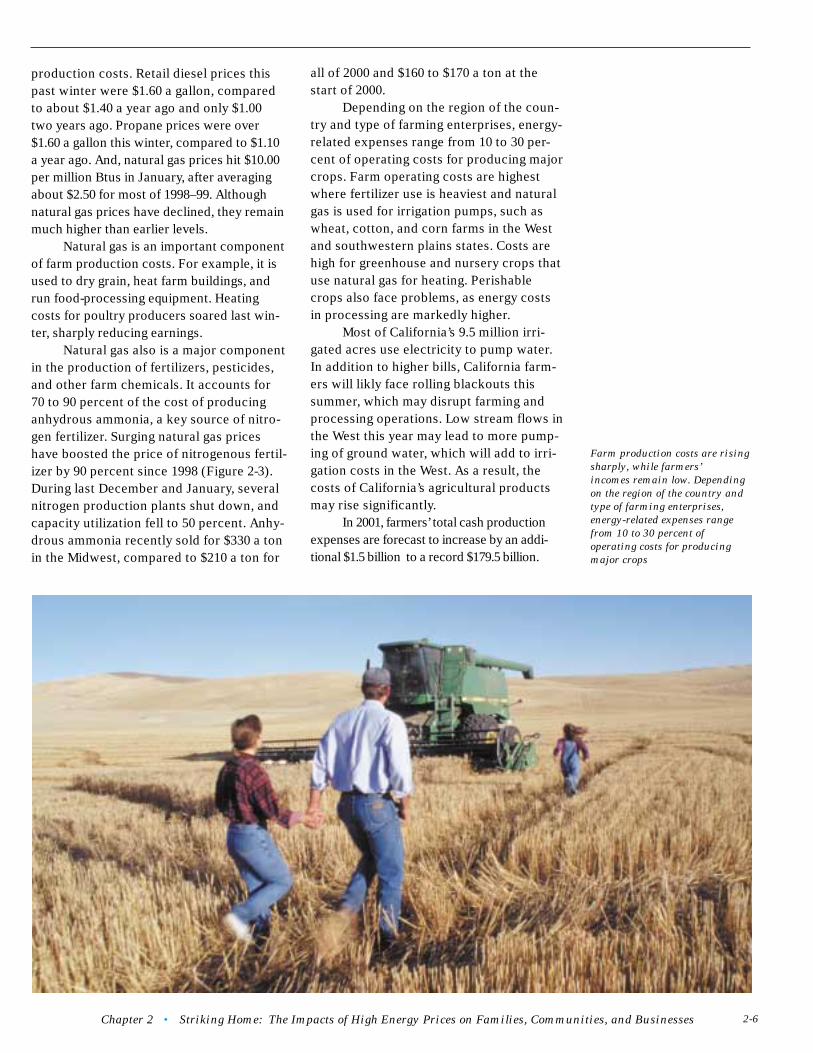
Chapter 2 • Striking Home: The Impacts of High Energy Prices on Families, Communities, and Businesses
production costs. Retail diesel prices thispast winter were $1.60 a gallon, comparedto about $1.40 a year ago and only $1.00two years ago. Propane prices were over$1.60 a gallon this winter, compared to $1.10a year ago. And, natural gas prices hit $10.00per million Btus in January, after averagingabout $2.50 for most of 1998–99. Althoughnatural gas prices have declined, they remainmuch higher than earlier levels.
Natural gas is an important componentof farm production costs. For example, it isused to dry grain, heat farm buildings, andrun food-processing equipment. Heatingcosts for poultry producers soared last win-ter, sharply reducing earnings.
Natural gas also is a major componentin the production of fertilizers, pesticides,and other farm chemicals. It accounts for70 to 90 percent of the cost of producinganhydrous ammonia, a key source of nitro-gen fertilizer. Surging natural gas priceshave boosted the price of nitrogenous fertil-izer by 90 percent since 1998 (Figure 2-3).During last December and January, severalnitrogen production plants shut down, andcapacity utilization fell to 50 percent. Anhy-drous ammonia recently sold for $330 a tonin the Midwest, compared to $210 a ton for
all of 2000 and $160 to $170 a ton at thestart of 2000.
Depending on the region of the coun-try and type of farming enterprises, energy-related expenses range from 10 to 30 per-cent of operating costs for producing majorcrops. Farm operating costs are highestwhere fertilizer use is heaviest and naturalgas is used for irrigation pumps, such aswheat, cotton, and corn farms in the Westand southwestern plains states. Costs arehigh for greenhouse and nursery crops thatuse natural gas for heating. Perishablecrops also face problems, as energy costsin processing are markedly higher.
Most of California’s 9.5 million irri-gated acres use electricity to pump water.In addition to higher bills, California farm-ers will likly face rolling blackouts thissummer, which may disrupt farming andprocessing operations. Low stream flows inthe West this year may lead to more pump-ing of ground water, which will add to irri-gation costs in the West. As a result, thecosts of California’s agricultural productsmay rise significantly.
In 2001, farmers’ total cash productionexpenses are forecast to increase by an addi-tional $1.5 billion to a record $179.5 billion.
2-6
Farm production costs are rising
sharply, while farmers’
incomes remain low. Depending
on the region of the country and
type of farming enterprises,
energy-related expenses range
from 10 to 30 percent of
operating costs for producing
major crops
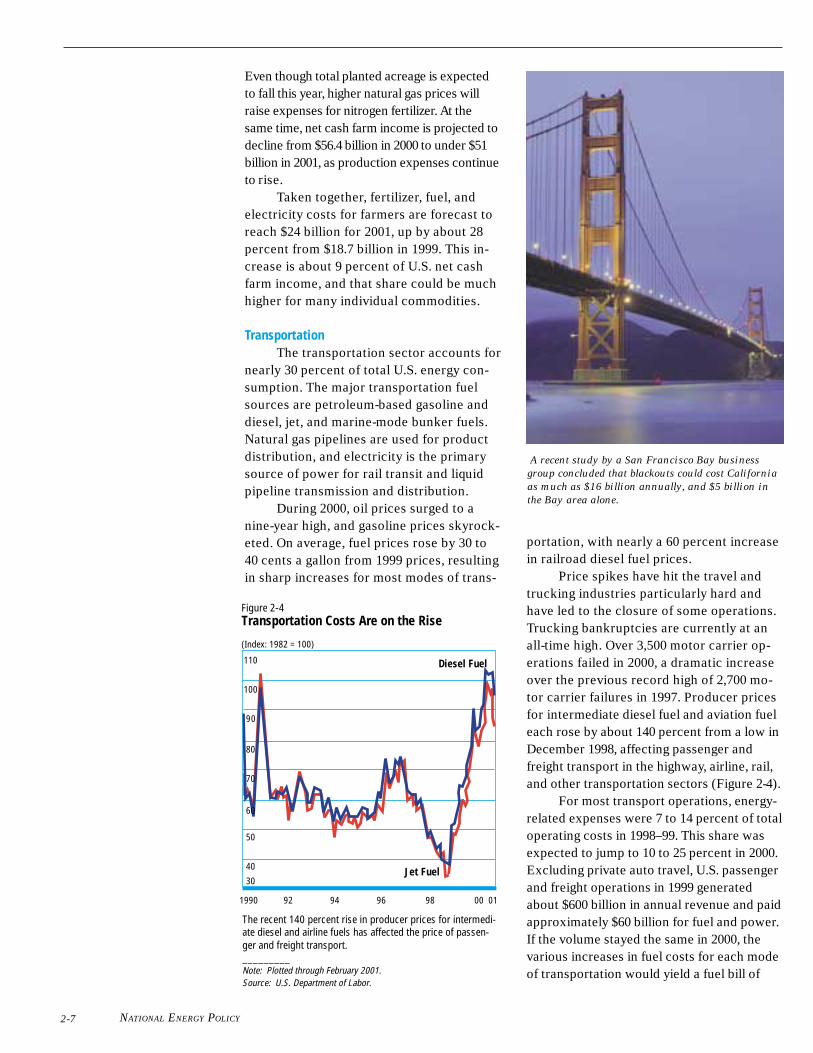
NATIONAL ENERGY POLICY
Even though total planted acreage is expectedto fall this year, higher natural gas prices willraise expenses for nitrogen fertilizer. At thesame time, net cash farm income is projected todecline from $56.4 billion in 2000 to under $51billion in 2001, as production expenses continueto rise.
Taken together, fertilizer, fuel, andelectricity costs for farmers are forecast toreach $24 billion for 2001, up by about 28percent from $18.7 billion in 1999. This in-crease is about 9 percent of U.S. net cashfarm income, and that share could be muchhigher for many individual commodities.
TransportationThe transportation sector accounts for
nearly 30 percent of total U.S. energy con-sumption. The major transportation fuelsources are petroleum-based gasoline anddiesel, jet, and marine-mode bunker fuels.Natural gas pipelines are used for productdistribution, and electricity is the primarysource of power for rail transit and liquidpipeline transmission and distribution.
During 2000, oil prices surged to anine-year high, and gasoline prices skyrock-eted. On average, fuel prices rose by 30 to40 cents a gallon from 1999 prices, resultingin sharp increases for most modes of trans-
portation, with nearly a 60 percent increasein railroad diesel fuel prices.
Price spikes have hit the travel andtrucking industries particularly hard andhave led to the closure of some operations.Trucking bankruptcies are currently at anall-time high. Over 3,500 motor carrier op-erations failed in 2000, a dramatic increaseover the previous record high of 2,700 mo-tor carrier failures in 1997. Producer pricesfor intermediate diesel fuel and aviation fueleach rose by about 140 percent from a low inDecember 1998, affecting passenger andfreight transport in the highway, airline, rail,and other transportation sectors (Figure 2-4).
For most transport operations, energy-related expenses were 7 to 14 percent of totaloperating costs in 1998–99. This share wasexpected to jump to 10 to 25 percent in 2000.Excluding private auto travel, U.S. passengerand freight operations in 1999 generatedabout $600 billion in annual revenue and paidapproximately $60 billion for fuel and power.If the volume stayed the same in 2000, thevarious increases in fuel costs for each modeof transportation would yield a fuel bill of
2-7
Figure 2-4Transportation Costs Are on the Rise
(Index: 1982 = 100)
Diesel Fuel110
100
90
80
70
60
50
40
30
The recent 140 percent rise in producer prices for intermedi-ate diesel and airline fuels has affected the price of passen-ger and freight transport._________Note: Plotted through February 2001.Source: U.S. Department of Labor.
1990 92 94 96 98 00 01
Jet Fuel
A recent study by a San Francisco Bay business
group concluded that blackouts could cost California
as much as $16 billion annually, and $5 billion in
the Bay area alone.
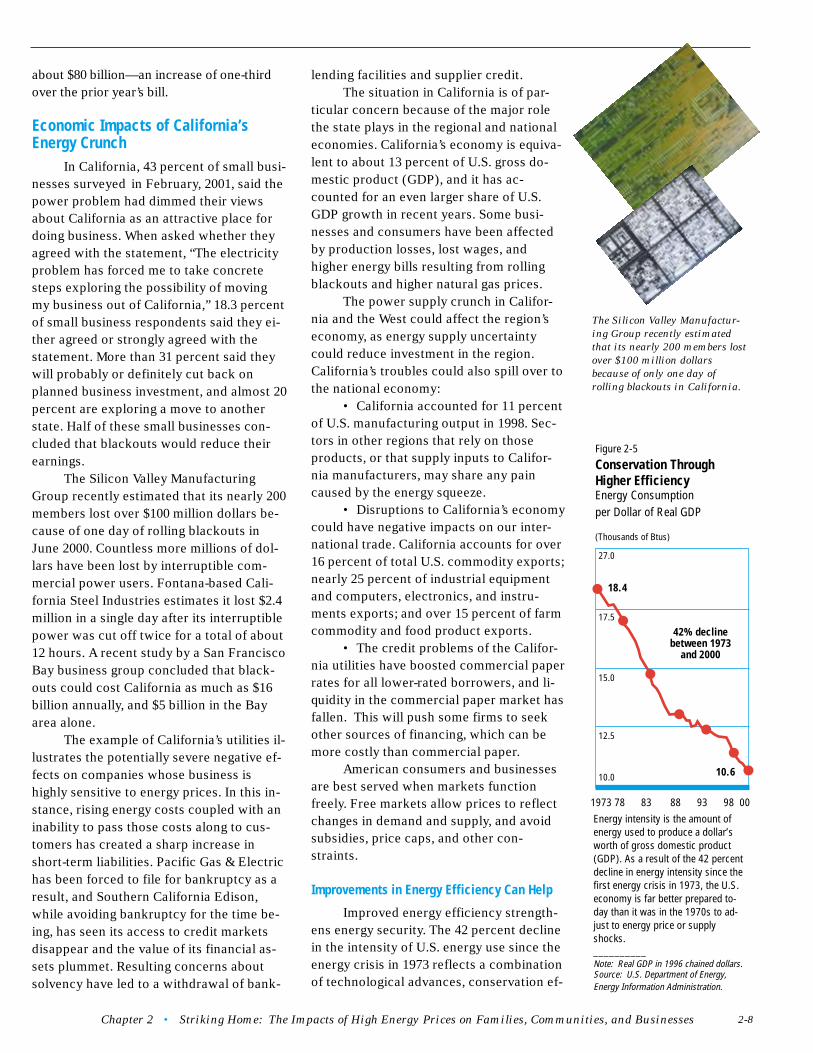
Chapter 2 • Striking Home: The Impacts of High Energy Prices on Families, Communities, and Businesses
about $80 billion—an increase of one-thirdover the prior year’s bill.
Economic Impacts of California’sEnergy Crunch
In California, 43 percent of small busi-nesses surveyed in February, 2001, said thepower problem had dimmed their viewsabout California as an attractive place fordoing business. When asked whether theyagreed with the statement, “The electricityproblem has forced me to take concretesteps exploring the possibility of movingmy business out of California,” 18.3 percentof small business respondents said they ei-ther agreed or strongly agreed with thestatement. More than 31 percent said theywill probably or definitely cut back onplanned business investment, and almost 20percent are exploring a move to anotherstate. Half of these small businesses con-cluded that blackouts would reduce theirearnings.
The Silicon Valley ManufacturingGroup recently estimated that its nearly 200members lost over $100 million dollars be-cause of one day of rolling blackouts inJune 2000. Countless more millions of dol-lars have been lost by interruptible com-mercial power users. Fontana-based Cali-fornia Steel Industries estimates it lost $2.4million in a single day after its interruptiblepower was cut off twice for a total of about12 hours. A recent study by a San FranciscoBay business group concluded that black-outs could cost California as much as $16billion annually, and $5 billion in the Bayarea alone.
The example of California’s utilities il-lustrates the potentially severe negative ef-fects on companies whose business ishighly sensitive to energy prices. In this in-stance, rising energy costs coupled with aninability to pass those costs along to cus-tomers has created a sharp increase inshort-term liabilities. Pacific Gas & Electrichas been forced to file for bankruptcy as aresult, and Southern California Edison,while avoiding bankruptcy for the time be-ing, has seen its access to credit marketsdisappear and the value of its financial as-sets plummet. Resulting concerns aboutsolvency have led to a withdrawal of bank-
lending facilities and supplier credit.The situation in California is of par-
ticular concern because of the major rolethe state plays in the regional and nationaleconomies. California’s economy is equiva-lent to about 13 percent of U.S. gross do-mestic product (GDP), and it has ac-counted for an even larger share of U.S.GDP growth in recent years. Some busi-nesses and consumers have been affectedby production losses, lost wages, andhigher energy bills resulting from rollingblackouts and higher natural gas prices.
The power supply crunch in Califor-nia and the West could affect the region’seconomy, as energy supply uncertaintycould reduce investment in the region.California’s troubles could also spill over tothe national economy:
• California accounted for 11 percentof U.S. manufacturing output in 1998. Sec-tors in other regions that rely on thoseproducts, or that supply inputs to Califor-nia manufacturers, may share any paincaused by the energy squeeze.
• Disruptions to California’s economycould have negative impacts on our inter-national trade. California accounts for over16 percent of total U.S. commodity exports;nearly 25 percent of industrial equipmentand computers, electronics, and instru-ments exports; and over 15 percent of farmcommodity and food product exports.
• The credit problems of the Califor-nia utilities have boosted commercial paperrates for all lower-rated borrowers, and li-quidity in the commercial paper market hasfallen. This will push some firms to seekother sources of financing, which can bemore costly than commercial paper.
American consumers and businessesare best served when markets functionfreely. Free markets allow prices to reflectchanges in demand and supply, and avoidsubsidies, price caps, and other con-straints.
Improvements in Energy Efficiency Can Help
Improved energy efficiency strength-ens energy security. The 42 percent declinein the intensity of U.S. energy use since theenergy crisis in 1973 reflects a combinationof technological advances, conservation ef-
2-8
1973 78 83 88 93 98 00
Figure 2-5
Conservation ThroughHigher EfficiencyEnergy Consumptionper Dollar of Real GDP
(Thousands of Btus)
Energy intensity is the amount ofenergy used to produce a dollar’sworth of gross domestic product(GDP). As a result of the 42 percentdecline in energy intensity since thefirst energy crisis in 1973, the U.S.economy is far better prepared to-day than it was in the 1970s to ad-just to energy price or supplyshocks.__________Note: Real GDP in 1996 chained dollars.Source: U.S. Department of Energy,Energy Information Administration.
27.0
17.5
15.0
12.5
10.0 10.6
18.4
42% declinebetween 1973
and 2000
The Silicon Valley Manufactur-
ing Group recently estimated
that its nearly 200 members lost
over $100 million dollars
because of only one day of
rolling blackouts in California.
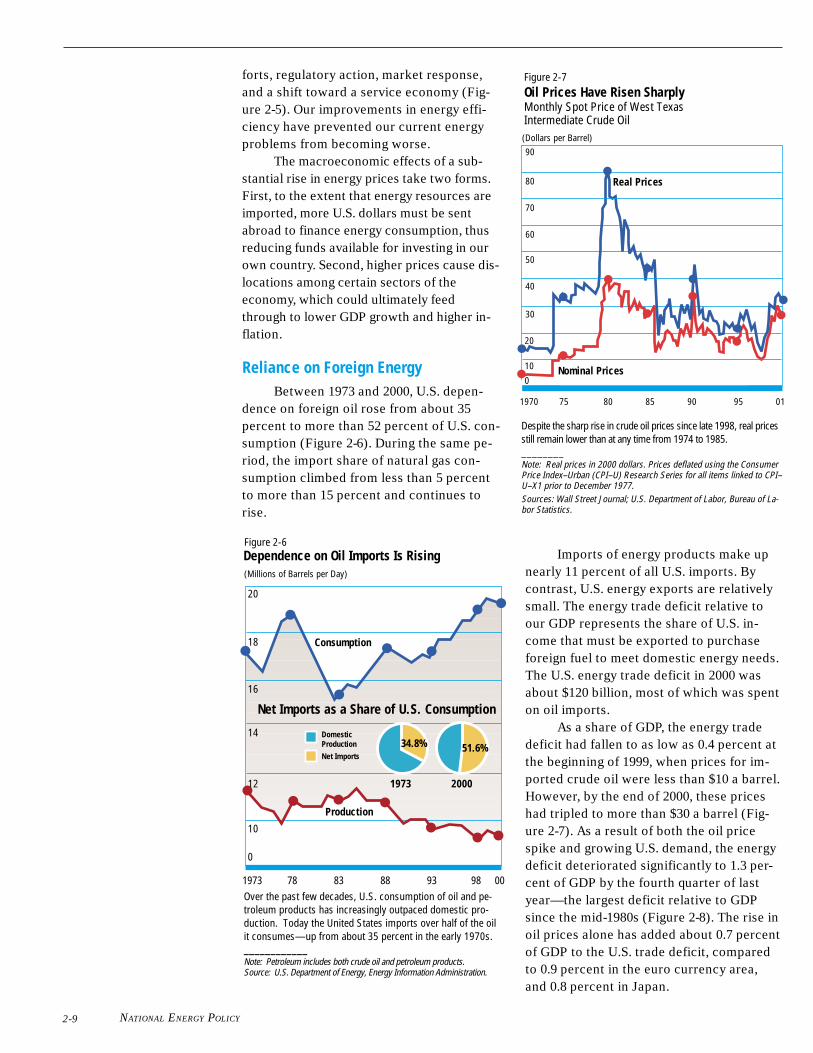
NATIONAL ENERGY POLICY
Imports of energy products make upnearly 11 percent of all U.S. imports. Bycontrast, U.S. energy exports are relativelysmall. The energy trade deficit relative toour GDP represents the share of U.S. in-come that must be exported to purchaseforeign fuel to meet domestic energy needs.The U.S. energy trade deficit in 2000 wasabout $120 billion, most of which was spenton oil imports.
As a share of GDP, the energy tradedeficit had fallen to as low as 0.4 percent atthe beginning of 1999, when prices for im-ported crude oil were less than $10 a barrel.However, by the end of 2000, these priceshad tripled to more than $30 a barrel (Fig-ure 2-7). As a result of both the oil pricespike and growing U.S. demand, the energydeficit deteriorated significantly to 1.3 per-cent of GDP by the fourth quarter of lastyear—the largest deficit relative to GDPsince the mid-1980s (Figure 2-8). The rise inoil prices alone has added about 0.7 percentof GDP to the U.S. trade deficit, comparedto 0.9 percent in the euro currency area,and 0.8 percent in Japan.
forts, regulatory action, market response,and a shift toward a service economy (Fig-ure 2-5). Our improvements in energy effi-ciency have prevented our current energyproblems from becoming worse.
The macroeconomic effects of a sub-stantial rise in energy prices take two forms.First, to the extent that energy resources areimported, more U.S. dollars must be sentabroad to finance energy consumption, thusreducing funds available for investing in ourown country. Second, higher prices cause dis-locations among certain sectors of theeconomy, which could ultimately feedthrough to lower GDP growth and higher in-flation.
Reliance on Foreign EnergyBetween 1973 and 2000, U.S. depen-
dence on foreign oil rose from about 35percent to more than 52 percent of U.S. con-sumption (Figure 2-6). During the same pe-riod, the import share of natural gas con-sumption climbed from less than 5 percentto more than 15 percent and continues torise.
2-9
1973 78 83 88 93 98 00
1973 2000
Net Imports as a Share of U.S. Consumption
34.8% 51.6%
20
18
16
14
12
10
0
8
DomesticProductionNet Imports
Consumption
Production
Figure 2-6
(Millions of Barrels per Day)
Dependence on Oil Imports Is Rising
Over the past few decades, U.S. consumption of oil and pe-troleum products has increasingly outpaced domestic pro-duction. Today the United States imports over half of the oilit consumes—up from about 35 percent in the early 1970s.____________Note: Petroleum includes both crude oil and petroleum products.Source: U.S. Department of Energy, Energy Information Administration.
Despite the sharp rise in crude oil prices since late 1998, real pricesstill remain lower than at any time from 1974 to 1985.________Note: Real prices in 2000 dollars. Prices deflated using the ConsumerPrice Index–Urban (CPI–U) Research Series for all items linked to CPI–U–X1 prior to December 1977.Sources: Wall Street Journal; U.S. Department of Labor, Bureau of La-bor Statistics.
90
80
70
60
50
40
30
Figure 2-7Oil Prices Have Risen SharplyMonthly Spot Price of West TexasIntermediate Crude Oil(Dollars per Barrel)
Nominal Prices
20
10
0
1970 75 80 85 90 95 01
Real Prices
Chapter 2 • Striking Home: The Impacts of High Energy Prices on Families, Communities, and Businesses
Financial markets react to
energy costs and the effect those
energy costs have on both
individual firms and sectors of
the market.
2-10
Net U.S. oil imports are 4 billion bar-rels a year, which means that each $1 in-crease in the price of imported crude oilboosts U.S. expenditures by about $4 bil-lion. Given these guidelines, the $20 perbarrel increase from early 1999 to late 2000translates into an export of roughly $80 bil-lion a year (0.9 percent of GDP) when mea-sured from the low price prevailing at theend of 1998.
Impacts of Energy Prices onFinancial Markets
An analysis of the financial impacts ofhigher energy prices can be divided into twoparts: the effects on individual firms whose se-curities comprise the financial markets, andthe macroeconomic impact on inflation and in-terest rates. Rising energy costs and greatervolatility in energy prices can have a negativeeffect on both individual firms and the broaderfinancial environment, generally producinglower asset prices and higher interest rates.The financial market impact to date of risingenergy prices has been limited to firms withhigh sensitivity to energy costs and to thosewith significant exposure to the California cri-sis. The second broad effect of rising energycosts is an increase both in measured inflation
1970 75 80 85 90 95 00
Figure 2-8
(Percent)
0.0
–0.5
–1.0
–1.5
–2.0
–2.5
–3.0
–3.5
The U.S.Energy Trade Deficit Has Worsened
The energy trade deficit relative to GDP represents theshare of domestic income that must be exported to sup-port domestic energy needs. For the past several years,the United States has been a net importer of energy prod-ucts. As a consequence, our energy trade balance hasbeen in deficit. By the fourth quarter of 2000, the energydeficit had deteriorated significantly to 1.3 percent ofGDP—the largest since the mid-1980s._____________Note: Plotted quarterly through the fourth quarter of 2000.Source: U.S. Department of Commerce, Bureau of Economic Analysis.
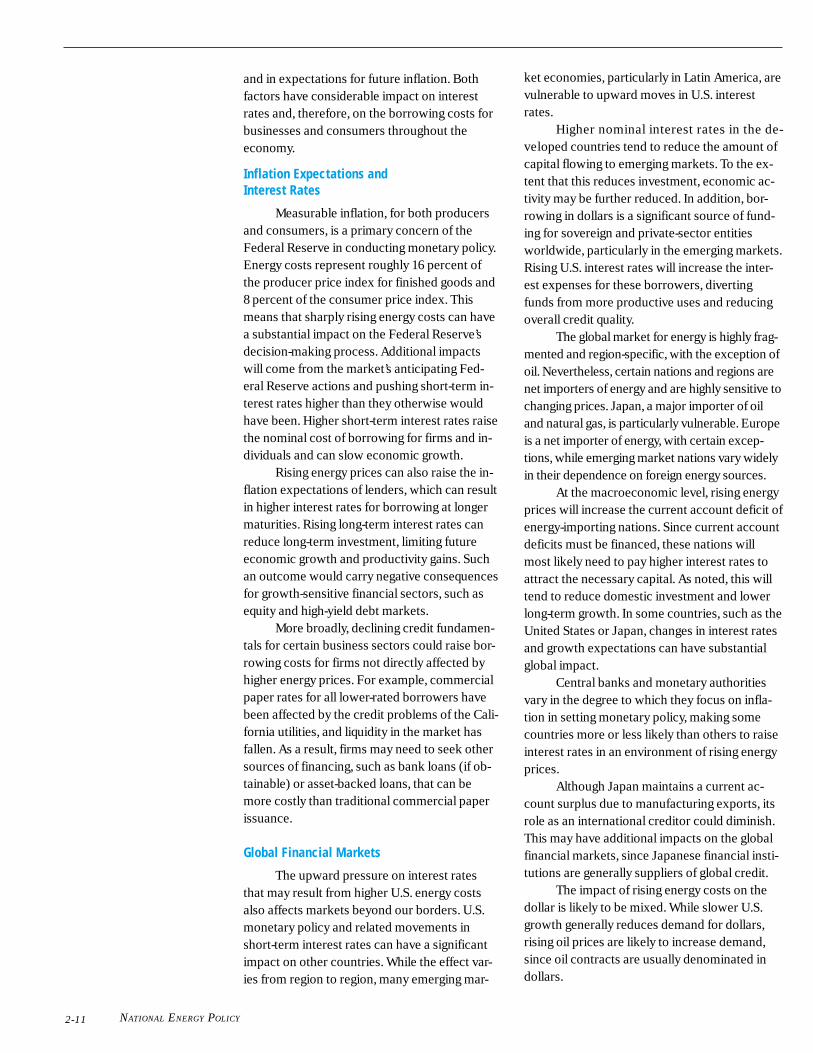
NATIONAL ENERGY POLICY2-11
and in expectations for future inflation. Bothfactors have considerable impact on interestrates and, therefore, on the borrowing costs forbusinesses and consumers throughout theeconomy.
Inflation Expectations andInterest Rates
Measurable inflation, for both producersand consumers, is a primary concern of theFederal Reserve in conducting monetary policy.Energy costs represent roughly 16 percent ofthe producer price index for finished goods and8 percent of the consumer price index. Thismeans that sharply rising energy costs can havea substantial impact on the Federal Reserve’sdecision-making process. Additional impactswill come from the market’s anticipating Fed-eral Reserve actions and pushing short-term in-terest rates higher than they otherwise wouldhave been. Higher short-term interest rates raisethe nominal cost of borrowing for firms and in-dividuals and can slow economic growth.
Rising energy prices can also raise the in-flation expectations of lenders, which can resultin higher interest rates for borrowing at longermaturities. Rising long-term interest rates canreduce long-term investment, limiting futureeconomic growth and productivity gains. Suchan outcome would carry negative consequencesfor growth-sensitive financial sectors, such asequity and high-yield debt markets.
More broadly, declining credit fundamen-tals for certain business sectors could raise bor-rowing costs for firms not directly affected byhigher energy prices. For example, commercialpaper rates for all lower-rated borrowers havebeen affected by the credit problems of the Cali-fornia utilities, and liquidity in the market hasfallen. As a result, firms may need to seek othersources of financing, such as bank loans (if ob-tainable) or asset-backed loans, that can bemore costly than traditional commercial paperissuance.
Global Financial Markets
The upward pressure on interest ratesthat may result from higher U.S. energy costsalso affects markets beyond our borders. U.S.monetary policy and related movements inshort-term interest rates can have a significantimpact on other countries. While the effect var-ies from region to region, many emerging mar-
ket economies, particularly in Latin America, arevulnerable to upward moves in U.S. interestrates.
Higher nominal interest rates in the de-veloped countries tend to reduce the amount ofcapital flowing to emerging markets. To the ex-tent that this reduces investment, economic ac-tivity may be further reduced. In addition, bor-rowing in dollars is a significant source of fund-ing for sovereign and private-sector entitiesworldwide, particularly in the emerging markets.Rising U.S. interest rates will increase the inter-est expenses for these borrowers, divertingfunds from more productive uses and reducingoverall credit quality.
The global market for energy is highly frag-mented and region-specific, with the exception ofoil. Nevertheless, certain nations and regions arenet importers of energy and are highly sensitive tochanging prices. Japan, a major importer of oiland natural gas, is particularly vulnerable. Europeis a net importer of energy, with certain excep-tions, while emerging market nations vary widelyin their dependence on foreign energy sources.
At the macroeconomic level, rising energyprices will increase the current account deficit ofenergy-importing nations. Since current accountdeficits must be financed, these nations willmost likely need to pay higher interest rates toattract the necessary capital. As noted, this willtend to reduce domestic investment and lowerlong-term growth. In some countries, such as theUnited States or Japan, changes in interest ratesand growth expectations can have substantialglobal impact.
Central banks and monetary authoritiesvary in the degree to which they focus on infla-tion in setting monetary policy, making somecountries more or less likely than others to raiseinterest rates in an environment of rising energyprices.
Although Japan maintains a current ac-count surplus due to manufacturing exports, itsrole as an international creditor could diminish.This may have additional impacts on the globalfinancial markets, since Japanese financial insti-tutions are generally suppliers of global credit.
The impact of rising energy costs on thedollar is likely to be mixed. While slower U.S.growth generally reduces demand for dollars,rising oil prices are likely to increase demand,since oil contracts are usually denominated indollars.
Chapter 2 • Striking Home: The Impacts of High Energy Prices on Families, Communities, and Businesses 2-12
Summary of Recommendations
★ The NEPD Group recommends that the President direct the Secretary of Energy to explorepotential opportunities to develop educational programs related to energy development anduse. This should include possible legislation to create public education awareness programsabout energy. Such programs should be long-term in nature, should be funded and managed bythe respective energy industries, and should include information on energy’s compatibility witha clean environment.
★ The NEPD Group recommends that the President take steps to mitigate impacts of highenergy costs on low-income consumers. These steps would include:
• Strengthening the Low Income Home Energy Assistance Program by making $1.7billion available annually. This is an increase of $300 million over the regular FY2001 appropriation.
• Directing the Secretaries of Interior and Health and Human Services to propose legisla-tion to bolster LIHEAP funding by using a portion of oil and gas royalty payments.
• Redirecting royalties above a set trigger price to LIHEAP, whenever crude oil and naturalgas prices exceed that trigger price, as determined by the responsible agencies.
★ The NEPD Group recommends that the President increase funding for theWeatherization Assistance Program by $1.2 billion over ten years. This will roughly double thespending during that period on weatherization. Consistent with that commitment, the FY 2002Budget includes a $120 million increase over 2001. The Department of Energy will have theoption of using a portion of those funds to test improved implementation approaches for theweatherization program.
★ The NEPD Group recommends that the President support legislation to allow fundsdedicated for the Weatherization and State Energy Programs to be transferred to LIHEAP if theDepartment of Energy deems it appropriate.
★ The NEPD Group recommends the President recognize unique regional energy concernsby working with the National Governors Association and regional governor associations todetermine how to better serve the needs of diverse areas of the country.
★ The NEPD Group recommends the President direct FEMA to prepare for potential energyemergencies.
• FEMA should work with states’ Offices of Emergency Management as they expandexisting emergency operations plans to identify potential problems and address conse-quences of the power shortages. FEMA should use its current Regional Incident Report-ing System to identify any situations that might demand immediate attention.
• Using the structure of the already existing Federal Response Plan, FEMA shouldconduct Regional Interagency Steering Committee (RISC) meetings for states affectedby the energy shortfalls. The RISC is a FEMA-led interagency committee comprised ofagencies and departments that support the Federal Response Plan. Either an upcoming,scheduled RISC meeting or a special-focus RISC meeting can be held to identify theshort-term energy outlook, as well as any expected consequences, in each of the statesduring the peak summer season.
NATIONAL ENERGY POLICY
Over the last three decades, Ameri-can ingenuity has led to a reductionin adverse environmental and pub-lic health impacts from energy
development and use. Americans demand areliable energy supply and a clean environ-ment, and we can achieve both. Spurred bystrong environmental concerns, competi-tive forces, and environmental regulations,businesses have developed innovative tech-nologies and pollution-prevention tech-niques to protect the environment. How-ever, more can be done.
As our energy needs continue to growand our production and distribution systemis strained to capacity, it is clear that thelack of a comprehensive energy policy hasenvironmental costs. For example, to pre-vent blackouts, California officials must tol-erate a large short-term increase in smog-forming nitrogen oxides emissions. In LosAngeles, older, dirtier power plants havehad to run longer than expected. Californiais also rushing to use mid-sized “peakerpower plants” and diesel-fired emergencybackup generators to keep the lights on.
The short-term cost in increased pol-lutant emissions of these emergency mea-sures has been stark. Preliminary figuresfrom California’s South Coast Air QualityManagement District indicate emissionshave doubled in the first three months ofthe year compared with last year. In addi-tion to nitrogen oxides emissions, diesel-fired backup generators also emit toxicsoot. But with many days of blackouts pre-dicted in California this summer, these gen-erators will most likely run for much longerthan expected, and could greatly increaseemissions.
Protecting America’s Environment
In the longer term, penalties and tech-nological improvements should offset theimpact of these increased emissions. How-ever, California’s experience demonstratesthe environmental costs of not building anadequate supply of clean energy.
Government’s RoleThe federal government has a unique
role in facilitating energy developmentwhile simultaneously protecting the envi-ronment and conserving our country’s natu-ral resource legacy. Energy development ini-tiatives will be successful only if they ad-equately address their impacts on naturalresource values.
Federal, state, tribal, and local govern-ments have the responsibility of protectingunique natural resources and environmentalvalues. In fact, some environmental protec-tions we enjoy today are often taken forgranted. For example, lead levels in ambientair today are 98 percent lower than theywere in 1970, largely because governmentregulations required that lead be removedfrom gasoline. The reduced number of chil-dren with IQs below 70 is attributed to re-ducing lead in our environment.
As U.S. energy needs grow, additionalinnovations will be necessary to continueimproving environmental conditions and tomeet new environmental challenges. As weimprove the energy production and distribu-tion system, all levels of government mustensure that regulatory systems protectingpublic health and the environment are rigor-ous and efficient, and encourage innovationand improvement.
Sustaining the Nation’s Health and Environment
3-1
C H A P T E R T H R E E

Chapter 3 • Protecting America’s Environment: Sustaining the Nation’s Health and Environment
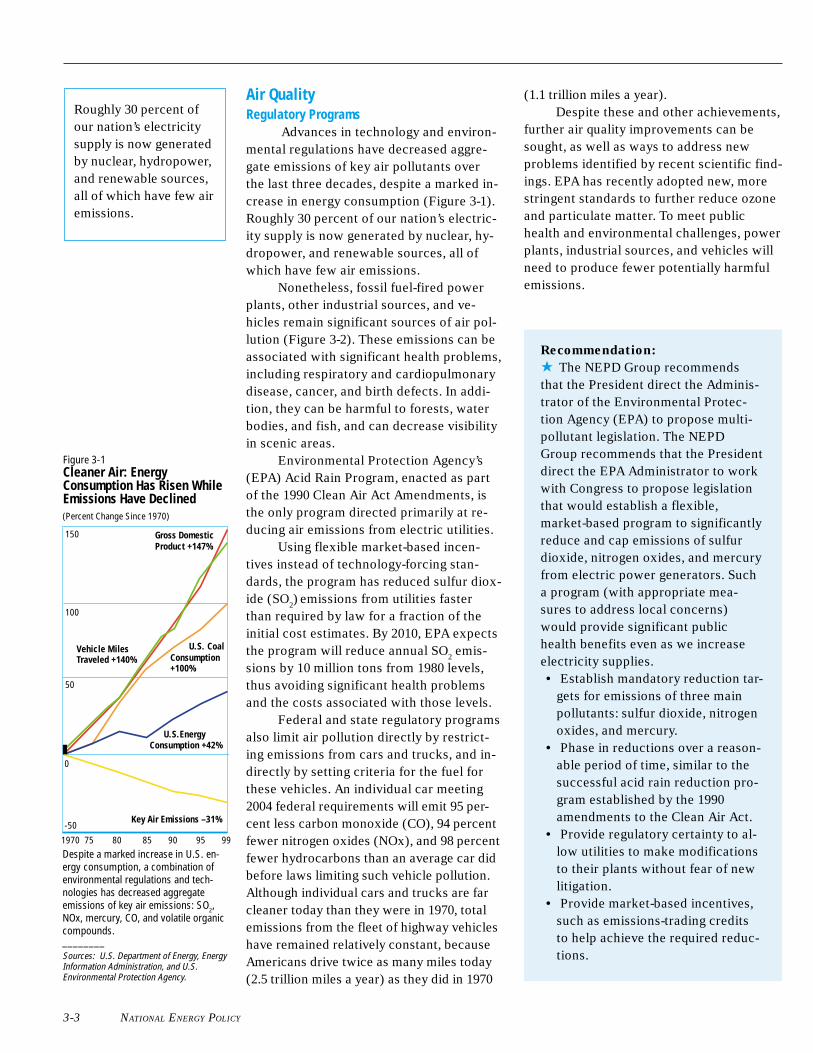
NATIONAL ENERGY POLICY 3-3
Recommendation:
★ The NEPD Group recommendsthat the President direct the Adminis-trator of the Environmental Protec-tion Agency (EPA) to propose multi-pollutant legislation. The NEPDGroup recommends that the Presidentdirect the EPA Administrator to workwith Congress to propose legislationthat would establish a flexible,market-based program to significantlyreduce and cap emissions of sulfurdioxide, nitrogen oxides, and mercuryfrom electric power generators. Sucha program (with appropriate mea-sures to address local concerns)would provide significant publichealth benefits even as we increaseelectricity supplies.• Establish mandatory reduction tar-
gets for emissions of three mainpollutants: sulfur dioxide, nitrogenoxides, and mercury.
• Phase in reductions over a reason-able period of time, similar to thesuccessful acid rain reduction pro-gram established by the 1990amendments to the Clean Air Act.
• Provide regulatory certainty to al-low utilities to make modificationsto their plants without fear of newlitigation.
• Provide market-based incentives,such as emissions-trading creditsto help achieve the required reduc-tions.
Roughly 30 percent ofour nation’s electricitysupply is now generatedby nuclear, hydropower,and renewable sources,all of which have few airemissions.
Air QualityRegulatory Programs
Advances in technology and environ-mental regulations have decreased aggre-gate emissions of key air pollutants overthe last three decades, despite a marked in-crease in energy consumption (Figure 3-1).Roughly 30 percent of our nation’s electric-ity supply is now generated by nuclear, hy-dropower, and renewable sources, all ofwhich have few air emissions.
Nonetheless, fossil fuel-fired powerplants, other industrial sources, and ve-hicles remain significant sources of air pol-lution (Figure 3-2). These emissions can beassociated with significant health problems,including respiratory and cardiopulmonarydisease, cancer, and birth defects. In addi-tion, they can be harmful to forests, waterbodies, and fish, and can decrease visibilityin scenic areas.
Environmental Protection Agency’s(EPA) Acid Rain Program, enacted as partof the 1990 Clean Air Act Amendments, isthe only program directed primarily at re-ducing air emissions from electric utilities.
Using flexible market-based incen-tives instead of technology-forcing stan-dards, the program has reduced sulfur diox-ide (SO
2)
emissions from utilities faster
than required by law for a fraction of theinitial cost estimates. By 2010, EPA expectsthe program will reduce annual SO
2 emis-
sions by 10 million tons from 1980 levels,thus avoiding significant health problemsand the costs associated with those levels.
Federal and state regulatory programsalso limit air pollution directly by restrict-ing emissions from cars and trucks, and in-directly by setting criteria for the fuel forthese vehicles. An individual car meeting2004 federal requirements will emit 95 per-cent less carbon monoxide (CO), 94 percentfewer nitrogen oxides (NOx), and 98 percentfewer hydrocarbons than an average car didbefore laws limiting such vehicle pollution.Although individual cars and trucks are farcleaner today than they were in 1970, totalemissions from the fleet of highway vehicleshave remained relatively constant, becauseAmericans drive twice as many miles today(2.5 trillion miles a year) as they did in 1970
(1.1 trillion miles a year).Despite these and other achievements,
further air quality improvements can besought, as well as ways to address newproblems identified by recent scientific find-ings. EPA has recently adopted new, morestringent standards to further reduce ozoneand particulate matter. To meet publichealth and environmental challenges, powerplants, industrial sources, and vehicles willneed to produce fewer potentially harmfulemissions.
U.S. CoalConsumption+100%
1970 75 80 85 90 95 99
Gross DomesticProduct +147%
U.S.EnergyConsumption +42%
(Percent Change Since 1970)
Despite a marked increase in U.S. en-ergy consumption, a combination ofenvironmental regulations and tech-nologies has decreased aggregateemissions of key air emissions: SO2,NOx, mercury, CO, and volatile organiccompounds.________Sources: U.S. Department of Energy, EnergyInformation Administration, and U.S.Environmental Protection Agency.
Vehicle MilesTraveled +140%
150
100
50
Figure 3-1Cleaner Air: EnergyConsumption Has Risen WhileEmissions Have Declined
0
-50Key Air Emissions –31%
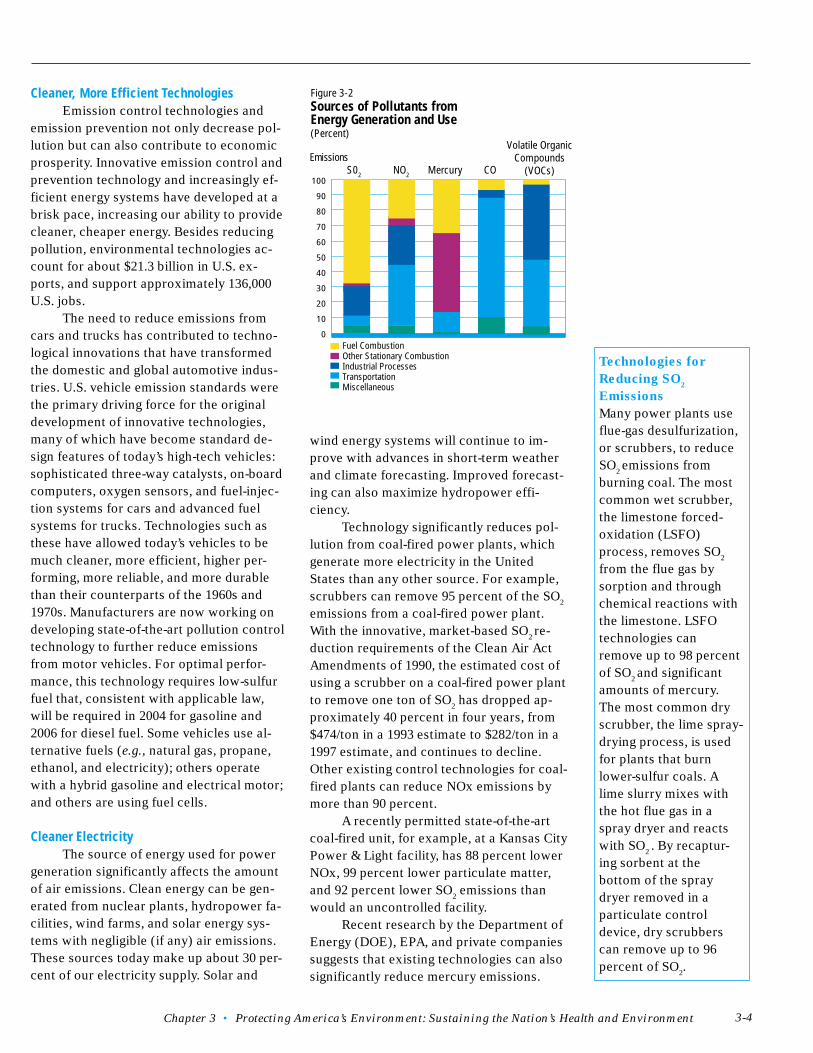
Chapter 3 • Protecting America’s Environment: Sustaining the Nation’s Health and Environment 3-4
Figure 3-2Sources of Pollutants fromEnergy Generation and Use(Percent)
Emissions S02 NO2 Mercury CO
Volatile OrganicCompounds
(VOCs)
Cleaner, More Efficient TechnologiesEmission control technologies and
emission prevention not only decrease pol-lution but can also contribute to economicprosperity. Innovative emission control andprevention technology and increasingly ef-ficient energy systems have developed at abrisk pace, increasing our ability to providecleaner, cheaper energy. Besides reducingpollution, environmental technologies ac-count for about $21.3 billion in U.S. ex-ports, and support approximately 136,000U.S. jobs.
The need to reduce emissions fromcars and trucks has contributed to techno-logical innovations that have transformedthe domestic and global automotive indus-tries. U.S. vehicle emission standards werethe primary driving force for the originaldevelopment of innovative technologies,many of which have become standard de-sign features of today’s high-tech vehicles:sophisticated three-way catalysts, on-boardcomputers, oxygen sensors, and fuel-injec-tion systems for cars and advanced fuelsystems for trucks. Technologies such asthese have allowed today’s vehicles to bemuch cleaner, more efficient, higher per-forming, more reliable, and more durablethan their counterparts of the 1960s and1970s. Manufacturers are now working ondeveloping state-of-the-art pollution controltechnology to further reduce emissionsfrom motor vehicles. For optimal perfor-mance, this technology requires low-sulfurfuel that, consistent with applicable law,will be required in 2004 for gasoline and2006 for diesel fuel. Some vehicles use al-ternative fuels (e.g., natural gas, propane,ethanol, and electricity); others operatewith a hybrid gasoline and electrical motor;and others are using fuel cells.
Cleaner ElectricityThe source of energy used for power
generation significantly affects the amountof air emissions. Clean energy can be gen-erated from nuclear plants, hydropower fa-cilities, wind farms, and solar energy sys-tems with negligible (if any) air emissions.These sources today make up about 30 per-cent of our electricity supply. Solar and
wind energy systems will continue to im-prove with advances in short-term weatherand climate forecasting. Improved forecast-ing can also maximize hydropower effi-ciency.
Technology significantly reduces pol-lution from coal-fired power plants, whichgenerate more electricity in the UnitedStates than any other source. For example,scrubbers can remove 95 percent of the SO
2
emissions from a coal-fired power plant.With the innovative, market-based SO
2 re-
duction requirements of the Clean Air ActAmendments of 1990, the estimated cost ofusing a scrubber on a coal-fired power plantto remove one ton of SO
2 has dropped ap-
proximately 40 percent in four years, from$474/ton in a 1993 estimate to $282/ton in a1997 estimate, and continues to decline.Other existing control technologies for coal-fired plants can reduce NOx emissions bymore than 90 percent.
A recently permitted state-of-the-artcoal-fired unit, for example, at a Kansas CityPower & Light facility, has 88 percent lowerNOx, 99 percent lower particulate matter,and 92 percent lower SO
2 emissions than
would an uncontrolled facility.Recent research by the Department of
Energy (DOE), EPA, and private companiessuggests that existing technologies can alsosignificantly reduce mercury emissions.
100
90
80
70
60
50
40
30
20
10
0
Technologies for
Reducing SO2
Emissions
Many power plants useflue-gas desulfurization,or scrubbers, to reduceSO
2 emissions from
burning coal. The mostcommon wet scrubber,the limestone forced-oxidation (LSFO)process, removes SO
2
from the flue gas bysorption and throughchemical reactions withthe limestone. LSFOtechnologies canremove up to 98 percentof SO
2 and significant
amounts of mercury.The most common dryscrubber, the lime spray-drying process, is usedfor plants that burnlower-sulfur coals. Alime slurry mixes withthe hot flue gas in aspray dryer and reactswith SO
2 . By recaptur-
ing sorbent at thebottom of the spraydryer removed in aparticulate controldevice, dry scrubberscan remove up to 96percent of SO
2.
Fuel CombustionOther Stationary CombustionIndustrial ProcessesTransportationMiscellaneous
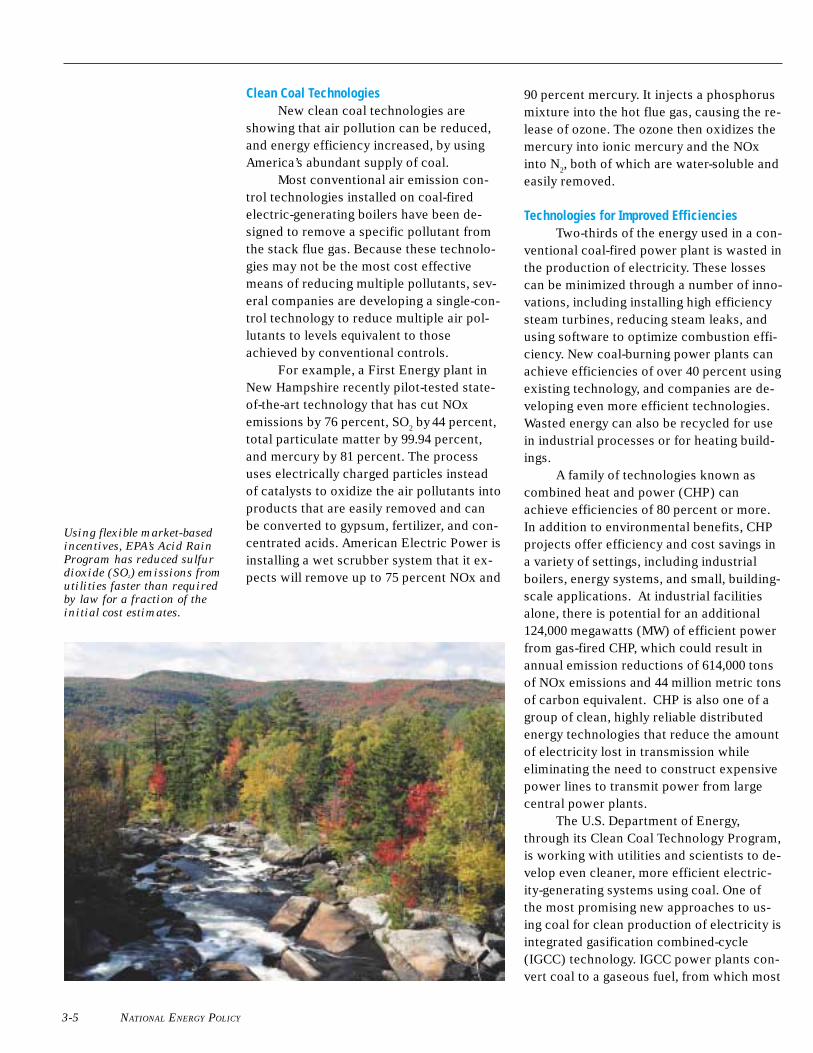
NATIONAL ENERGY POLICY3-5
Using flexible market-based
incentives, EPA’s Acid Rain
Program has reduced sulfur
dioxide (SO2)
emissions from
utilities faster than required
by law for a fraction of the
initial cost estimates.
Clean Coal TechnologiesNew clean coal technologies are
showing that air pollution can be reduced,and energy efficiency increased, by usingAmerica’s abundant supply of coal.
Most conventional air emission con-trol technologies installed on coal-firedelectric-generating boilers have been de-signed to remove a specific pollutant fromthe stack flue gas. Because these technolo-gies may not be the most cost effectivemeans of reducing multiple pollutants, sev-eral companies are developing a single-con-trol technology to reduce multiple air pol-lutants to levels equivalent to thoseachieved by conventional controls.
For example, a First Energy plant inNew Hampshire recently pilot-tested state-of-the-art technology that has cut NOxemissions by 76 percent, SO
2 by
44 percent,
total particulate matter by 99.94 percent,and mercury by 81 percent. The processuses electrically charged particles insteadof catalysts to oxidize the air pollutants intoproducts that are easily removed and canbe converted to gypsum, fertilizer, and con-centrated acids. American Electric Power isinstalling a wet scrubber system that it ex-pects will remove up to 75 percent NOx and
90 percent mercury. It injects a phosphorusmixture into the hot flue gas, causing the re-lease of ozone. The ozone then oxidizes themercury into ionic mercury and the NOxinto N
2, both of which are water-soluble and
easily removed.
Technologies for Improved EfficienciesTwo-thirds of the energy used in a con-
ventional coal-fired power plant is wasted inthe production of electricity. These lossescan be minimized through a number of inno-vations, including installing high efficiencysteam turbines, reducing steam leaks, andusing software to optimize combustion effi-ciency. New coal-burning power plants canachieve efficiencies of over 40 percent usingexisting technology, and companies are de-veloping even more efficient technologies.Wasted energy can also be recycled for usein industrial processes or for heating build-ings.
A family of technologies known ascombined heat and power (CHP) canachieve efficiencies of 80 percent or more.In addition to environmental benefits, CHPprojects offer efficiency and cost savings ina variety of settings, including industrialboilers, energy systems, and small, building-scale applications. At industrial facilitiesalone, there is potential for an additional124,000 megawatts (MW) of efficient powerfrom gas-fired CHP, which could result inannual emission reductions of 614,000 tonsof NOx emissions and 44 million metric tonsof carbon equivalent. CHP is also one of agroup of clean, highly reliable distributedenergy technologies that reduce the amountof electricity lost in transmission whileeliminating the need to construct expensivepower lines to transmit power from largecentral power plants.
The U.S. Department of Energy,through its Clean Coal Technology Program,is working with utilities and scientists to de-velop even cleaner, more efficient electric-ity-generating systems using coal. One ofthe most promising new approaches to us-ing coal for clean production of electricity isintegrated gasification combined-cycle(IGCC) technology. IGCC power plants con-vert coal to a gaseous fuel, from which most
Chapter 3 • Protecting America’s Environment: Sustaining the Nation’s Health and Environment 3-6
Clean Coal Technologies Up Close
The Wabash River Coal Gasification Project in Terre Haute, Indiana, is one of thecleanest, most efficient coal-burning facilities in the country. Partly funded by theDepartment of Energy (DOE) as part of its Clean Coal Technology Program, the 262-MW coal gasification facility is owned and operated by PSI Energy and Global Energy,Inc. Instead of being directly burned, the coal is gasified and then combusted in acombined-cycle gas turbine. This allows the coal to burn more efficiently—whichmeans it gets more energy than a traditional plant out of the same amount of coal. TheWabash River Facility is over 20 percent more efficient than a typical coal-fired powerplant.
The gasification process also allows many of the impurities in the coal to be removedbefore it is combusted to generate electricity. At the Wabash River project, over 99percent of the sulfur is removed from the coal and marketed to industrial users ofsulfur. Slag is also removed and is marketed to the construction industry. The plant’sdesign allows it to burn other fuels, such as petroleum coke.
DOE is currently working with Global Energy and other industry partners to see if theplant could also be used to co-produce chemical feedstocks and transportation fuels.Additionally, DOE and its partners are studying lessons learned from the project todesign a less expensive, more efficient coal gasification facility that would be ready forcommercial deployment by 2005.
of the impurities are removed prior to com-bustion, and then use the gaseous fuel in acombustion turbine to produce electricity.Waste heat from the turbine is used to gen-erate steam and drive a steam turbine, toproduce more electricity.
Coal gasification plants offer the flex-ibility to burn other fuels, such as petro-leum coke, and to make other products inaddition to electricity, such as chemicalfeedstocks and transportation fuels. Hydro-gen, which is produced directly in the coalgasifier, can be used in fuel cell-equippedvehicles. Methane, hydrogen, and othergasified coal products can be recombinedinto more traditional fuels, such as metha-nol, gasoline, or diesel fuel. Because thesefuels would contain essentially no sulfur,they would easily meet EPA’s sulfur stan-dards for transportation fuels, and theywould be usable in fuel cell-equipped ve-hicles designed for these fuels.
Two plants demonstrating coal gasifi-cation technology have already been builtin the United States and have achieved over98 percent SO
2 reduction, 90 percent NOx
reduction, particulate emissions below de-tectable levels, and approximately 38 per-cent efficiency. EPA believes that lessons
learned will enable the next plant of this de-sign to achieve 42 percent efficiency, andthe research goal is to achieve 60 percentefficiency for plants introduced after 2015.
A modern gas-fired power plant hasvirtually no SO
2 or mercury emissions and
emits 97 percent less NOx and 50 percentless carbon dioxide (CO
2) than a traditional
coal-fired plant. Natural gas as a source ofelectricity generation is on the rise, in partbecause it can help generators meet in-creasingly stringent clean air requirements.
Conservation and Environmental ProtectionConserving energy minimizes adverse
environmental effects. Government partner-ships with businesses and consumers areimproving the energy efficiency of homes,office buildings, transportation sources, andindustrial sites throughout the country.EPA’s voluntary conservation and energy ef-ficiency programs include Energy Starproducts labeling; Energy Star Residentialprograms for both new homes and homeimprovement; Energy Star Buildings, princi-pally for commercial buildings; and new En-ergy Star for Industry, which focuses onmanufacturers. In 2000, business participa-tion in EPA’s voluntary energy efficiency
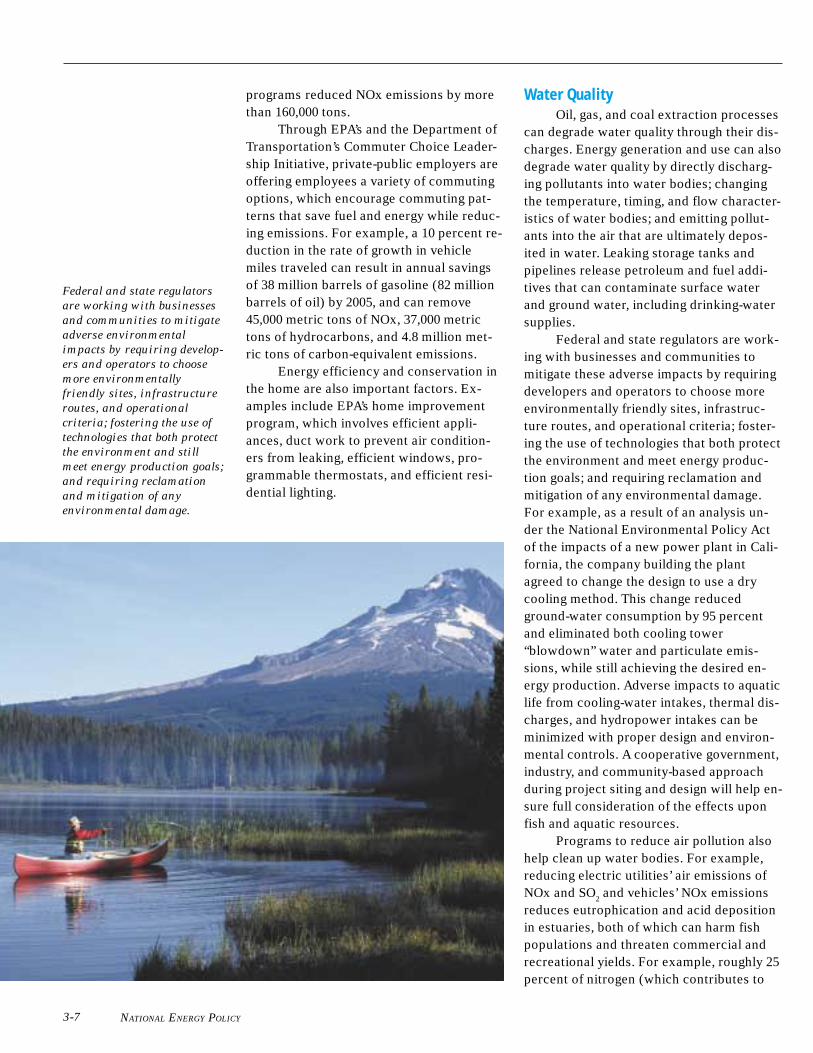
NATIONAL ENERGY POLICY
Federal and state regulators
are working with businesses
and communities to mitigate
adverse environmental
impacts by requiring develop-
ers and operators to choose
more environmentally
friendly sites, infrastructure
routes, and operational
criteria; fostering the use of
technologies that both protect
the environment and still
meet energy production goals;
and requiring reclamation
and mitigation of any
environmental damage.
3-7
programs reduced NOx emissions by morethan 160,000 tons.
Through EPA’s and the Department ofTransportation’s Commuter Choice Leader-ship Initiative, private-public employers areoffering employees a variety of commutingoptions, which encourage commuting pat-terns that save fuel and energy while reduc-ing emissions. For example, a 10 percent re-duction in the rate of growth in vehiclemiles traveled can result in annual savingsof 38 million barrels of gasoline (82 millionbarrels of oil) by 2005, and can remove45,000 metric tons of NOx, 37,000 metrictons of hydrocarbons, and 4.8 million met-ric tons of carbon-equivalent emissions.
Energy efficiency and conservation inthe home are also important factors. Ex-amples include EPA’s home improvementprogram, which involves efficient appli-ances, duct work to prevent air condition-ers from leaking, efficient windows, pro-grammable thermostats, and efficient resi-dential lighting.
Water QualityOil, gas, and coal extraction processes
can degrade water quality through their dis-charges. Energy generation and use can alsodegrade water quality by directly discharg-ing pollutants into water bodies; changingthe temperature, timing, and flow character-istics of water bodies; and emitting pollut-ants into the air that are ultimately depos-ited in water. Leaking storage tanks andpipelines release petroleum and fuel addi-tives that can contaminate surface waterand ground water, including drinking-watersupplies.
Federal and state regulators are work-ing with businesses and communities tomitigate these adverse impacts by requiringdevelopers and operators to choose moreenvironmentally friendly sites, infrastruc-ture routes, and operational criteria; foster-ing the use of technologies that both protectthe environment and meet energy produc-tion goals; and requiring reclamation andmitigation of any environmental damage.For example, as a result of an analysis un-der the National Environmental Policy Actof the impacts of a new power plant in Cali-fornia, the company building the plantagreed to change the design to use a drycooling method. This change reducedground-water consumption by 95 percentand eliminated both cooling tower“blowdown” water and particulate emis-sions, while still achieving the desired en-ergy production. Adverse impacts to aquaticlife from cooling-water intakes, thermal dis-charges, and hydropower intakes can beminimized with proper design and environ-mental controls. A cooperative government,industry, and community-based approachduring project siting and design will help en-sure full consideration of the effects uponfish and aquatic resources.
Programs to reduce air pollution alsohelp clean up water bodies. For example,reducing electric utilities’ air emissions ofNOx and SO
2 and vehicles’ NOx emissions
reduces eutrophication and acid depositionin estuaries, both of which can harm fishpopulations and threaten commercial andrecreational yields. For example, roughly 25percent of nitrogen (which contributes to
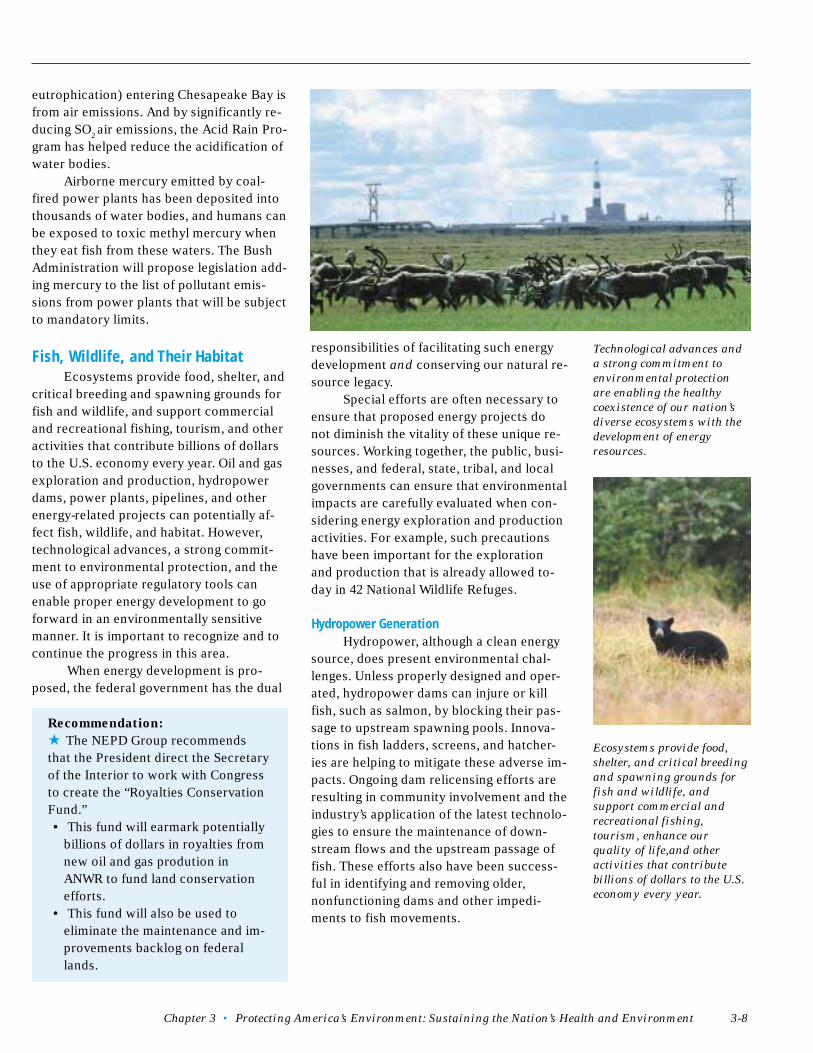
Chapter 3 • Protecting America’s Environment: Sustaining the Nation’s Health and Environment
Ecosystems provide food,
shelter, and critical breeding
and spawning grounds for
fish and wildlife, and
support commercial and
recreational fishing,
tourism, enhance our
quality of life,and other
activities that contribute
billions of dollars to the U.S.
economy every year.
Technological advances and
a strong commitment to
environmental protection
are enabling the healthy
coexistence of our nation’s
diverse ecosystems with the
development of energy
resources.
3-8
eutrophication) entering Chesapeake Bay isfrom air emissions. And by significantly re-ducing SO
2 air emissions, the Acid Rain Pro-
gram has helped reduce the acidification ofwater bodies.
Airborne mercury emitted by coal-fired power plants has been deposited intothousands of water bodies, and humans canbe exposed to toxic methyl mercury whenthey eat fish from these waters. The BushAdministration will propose legislation add-ing mercury to the list of pollutant emis-sions from power plants that will be subjectto mandatory limits.
Fish, Wildlife, and Their HabitatEcosystems provide food, shelter, and
critical breeding and spawning grounds forfish and wildlife, and support commercialand recreational fishing, tourism, and otheractivities that contribute billions of dollarsto the U.S. economy every year. Oil and gasexploration and production, hydropowerdams, power plants, pipelines, and otherenergy-related projects can potentially af-fect fish, wildlife, and habitat. However,technological advances, a strong commit-ment to environmental protection, and theuse of appropriate regulatory tools canenable proper energy development to goforward in an environmentally sensitivemanner. It is important to recognize and tocontinue the progress in this area.
When energy development is pro-posed, the federal government has the dual
responsibilities of facilitating such energydevelopment and conserving our natural re-source legacy.
Special efforts are often necessary toensure that proposed energy projects donot diminish the vitality of these unique re-sources. Working together, the public, busi-nesses, and federal, state, tribal, and localgovernments can ensure that environmentalimpacts are carefully evaluated when con-sidering energy exploration and productionactivities. For example, such precautionshave been important for the explorationand production that is already allowed to-day in 42 National Wildlife Refuges.
Hydropower GenerationHydropower, although a clean energy
source, does present environmental chal-lenges. Unless properly designed and oper-ated, hydropower dams can injure or killfish, such as salmon, by blocking their pas-sage to upstream spawning pools. Innova-tions in fish ladders, screens, and hatcher-ies are helping to mitigate these adverse im-pacts. Ongoing dam relicensing efforts areresulting in community involvement and theindustry’s application of the latest technolo-gies to ensure the maintenance of down-stream flows and the upstream passage offish. These efforts also have been success-ful in identifying and removing older,nonfunctioning dams and other impedi-ments to fish movements.
Recommendation:
★ The NEPD Group recommendsthat the President direct the Secretaryof the Interior to work with Congressto create the “Royalties ConservationFund.”• This fund will earmark potentially
billions of dollars in royalties fromnew oil and gas prodution inANWR to fund land conservationefforts.
• This fund will also be used toeliminate the maintenance and im-provements backlog on federallands.
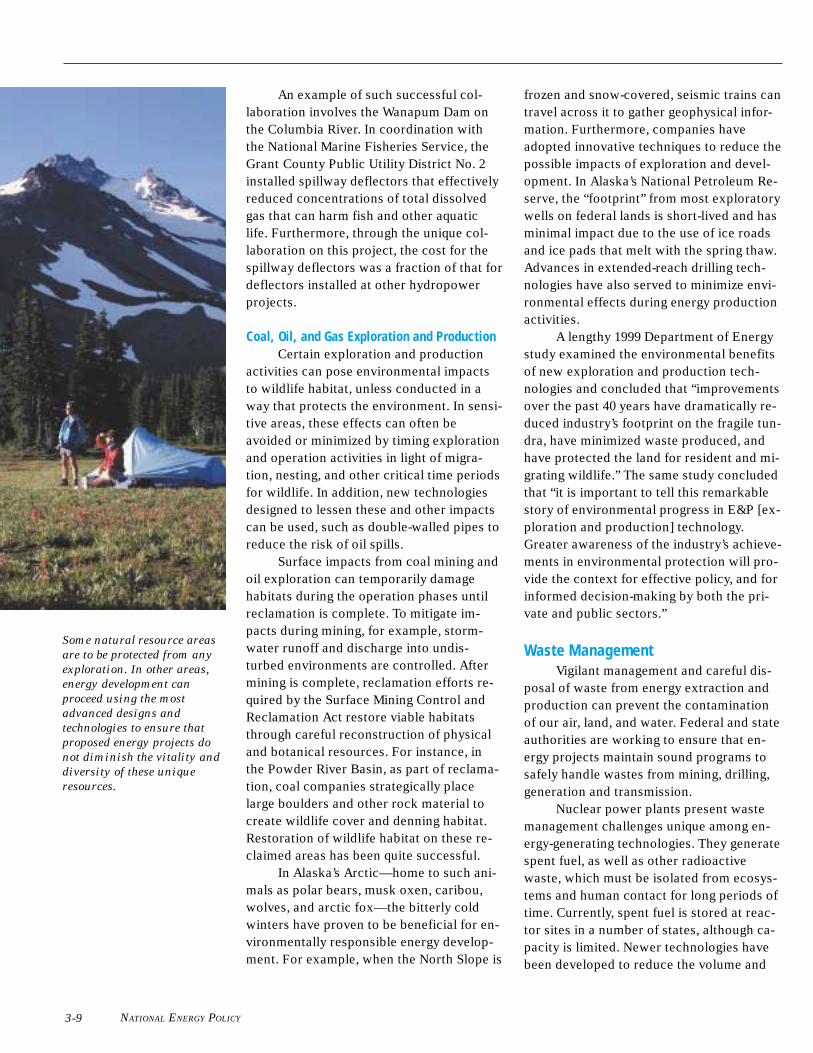
NATIONAL ENERGY POLICY
Some natural resource areas
are to be protected from any
exploration. In other areas,
energy development can
proceed using the most
advanced designs and
technologies to ensure that
proposed energy projects do
not diminish the vitality and
diversity of these unique
resources.
3-9
An example of such successful col-laboration involves the Wanapum Dam onthe Columbia River. In coordination withthe National Marine Fisheries Service, theGrant County Public Utility District No. 2installed spillway deflectors that effectivelyreduced concentrations of total dissolvedgas that can harm fish and other aquaticlife. Furthermore, through the unique col-laboration on this project, the cost for thespillway deflectors was a fraction of that fordeflectors installed at other hydropowerprojects.
Coal, Oil, and Gas Exploration and ProductionCertain exploration and production
activities can pose environmental impactsto wildlife habitat, unless conducted in away that protects the environment. In sensi-tive areas, these effects can often beavoided or minimized by timing explorationand operation activities in light of migra-tion, nesting, and other critical time periodsfor wildlife. In addition, new technologiesdesigned to lessen these and other impactscan be used, such as double-walled pipes toreduce the risk of oil spills.
Surface impacts from coal mining andoil exploration can temporarily damagehabitats during the operation phases untilreclamation is complete. To mitigate im-pacts during mining, for example, storm-water runoff and discharge into undis-turbed environments are controlled. Aftermining is complete, reclamation efforts re-quired by the Surface Mining Control andReclamation Act restore viable habitatsthrough careful reconstruction of physicaland botanical resources. For instance, inthe Powder River Basin, as part of reclama-tion, coal companies strategically placelarge boulders and other rock material tocreate wildlife cover and denning habitat.Restoration of wildlife habitat on these re-claimed areas has been quite successful.
In Alaska’s Arctic—home to such ani-mals as polar bears, musk oxen, caribou,wolves, and arctic fox—the bitterly coldwinters have proven to be beneficial for en-vironmentally responsible energy develop-ment. For example, when the North Slope is
frozen and snow-covered, seismic trains cantravel across it to gather geophysical infor-mation. Furthermore, companies haveadopted innovative techniques to reduce thepossible impacts of exploration and devel-opment. In Alaska’s National Petroleum Re-serve, the “footprint” from most exploratorywells on federal lands is short-lived and hasminimal impact due to the use of ice roadsand ice pads that melt with the spring thaw.Advances in extended-reach drilling tech-nologies have also served to minimize envi-ronmental effects during energy productionactivities.
A lengthy 1999 Department of Energystudy examined the environmental benefitsof new exploration and production tech-nologies and concluded that “improvementsover the past 40 years have dramatically re-duced industry’s footprint on the fragile tun-dra, have minimized waste produced, andhave protected the land for resident and mi-grating wildlife.” The same study concludedthat “it is important to tell this remarkablestory of environmental progress in E&P [ex-ploration and production] technology.Greater awareness of the industry’s achieve-ments in environmental protection will pro-vide the context for effective policy, and forinformed decision-making by both the pri-vate and public sectors.”
Waste ManagementVigilant management and careful dis-
posal of waste from energy extraction andproduction can prevent the contaminationof our air, land, and water. Federal and stateauthorities are working to ensure that en-ergy projects maintain sound programs tosafely handle wastes from mining, drilling,generation and transmission.
Nuclear power plants present wastemanagement challenges unique among en-ergy-generating technologies. They generatespent fuel, as well as other radioactivewaste, which must be isolated from ecosys-tems and human contact for long periods oftime. Currently, spent fuel is stored at reac-tor sites in a number of states, although ca-pacity is limited. Newer technologies havebeen developed to reduce the volume and
Chapter 3 • Protecting America’s Environment: Sustaining the Nation’s Health and Environment 3-10
increase the manageability of spent fuel,but such spent fuel will still require safehandling and long-term isolation.
While the federal government has theresponsibility to address such high-levelwastes, states have the responsibility to ad-dress low-level wastes from nuclear plants,such as clothing and equipment. Disposaloptions for this type of radioactive wasteare limited, because siting these facilitieshas been controversial. In fact, there areonly three disposal facilities active in theUnited States.
Accidental ReleasesSince the passage of the Oil Pollution
Act in 1990, which, among other things, re-quired double-hulled vessels and improvedindustry readiness, oil spilled in coastalzone waters has decreased from almost 8million gallons in 1990 to just over 1 milliongallons in 1999. Most energy production fa-cilities implement comprehensive risk-man-agement plans, which reduce the potentialfor accidents and help local officials pre-pare for accidents that may arise.
In contrast, inland oil spills do not ap-pear to be decreasing at the same rate ascoastal spills. The federal government re-ceives many more inland oil spill notifica-tions (9,000 notifications a year in the early1990s versus 10,000 to 12,000 a year in thelate 1990s), and many very large inland oilspills occur each year (over 100,000 gal-lons). The continued problem with inlandoil spills may be due to aging pipelines,storage tanks, and other infrastructurecomponents.
Since the advent of commercialnuclear power generation, there have beenno radiation-related injuries or deaths asso-ciated with the operation of a commercialnuclear power plant in the United States.The most significant incident from anuclear plant in the United States, at ThreeMile Island in 1979, prompted improvedsafety regulation of nuclear plants. Newnuclear reactor designs promise evenhigher safety levels than the reactors cur-rently operating in this country.
Radiation exposure from nuclear fa-cilities is extremely rare. In fact, roughly 82percent of human exposure to radiationcomes from natural sources: radon gas; thehuman body, which contains radioactive el-ements; outer space; and rocks and soil. Ra-don accounts for about 55 percent of ourexposure to natural sources of radiation; ra-dioactive elements in our own bodies ac-count for 11 percent; rocks and soil accountfor 11 percent; and outer space, includingthe sun, accounts for 8 percent. The remain-ing 18 percent of average human radiationexposure comes from man-made sources,primarily medical and dental X-rays andconsumer products.
The safety of U.S. nuclear energyplants has improved sharply in recent years.A safe nuclear energy plant is one that runswell, experiences few unplanned outages,and has a well-disciplined work force thatfollows procedures and avoids accidents.The safety of a U.S. nuclear energy plant istypically gauged by monitoring indicators ofits performance in these areas: unplannedautomatic reactor shutdowns, the annualpercentage of possible power generated,and the industrial safety accident rate forplant workers.
In 2000, for the fourth year in a row,the number of unscheduled reactor shut-downs was zero. The industry generated91.1 percent of its potential maximum out-put, breaking its 1999 record of 88.7 per-cent, far better than the typical 80 percentnumber of ten years ago.
Today, U.S. nuclear plants are more ef-ficient and safer than ever. In the increas-ingly deregulated marketplace, competitionhas forced improvements in plant opera-tions that have benefited safety perfor-mance as much as economic performance.
Climate ChangeEnergy-related activities are the pri-
mary sources of U.S. man-made greenhousegas emissions, representing about 85 per-cent of the U.S. man-made total carbon-equivalent emissions in 1998.
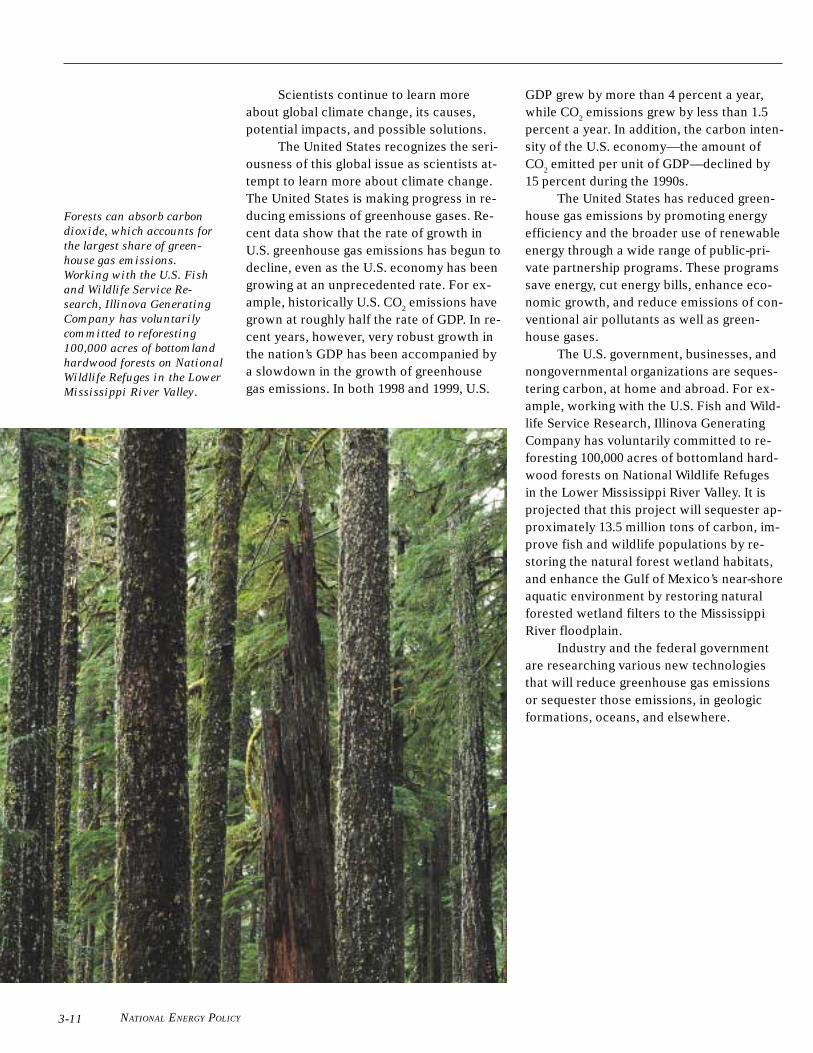
NATIONAL ENERGY POLICY
Forests can absorb carbon
dioxide, which accounts for
the largest share of green-
house gas emissions.
Working with the U.S. Fish
and Wildlife Service Re-
search, Illinova Generating
Company has voluntarily
committed to reforesting
100,000 acres of bottomland
hardwood forests on National
Wildlife Refuges in the Lower
Mississippi River Valley.
3-11
Scientists continue to learn moreabout global climate change, its causes,potential impacts, and possible solutions.
The United States recognizes the seri-ousness of this global issue as scientists at-tempt to learn more about climate change.The United States is making progress in re-ducing emissions of greenhouse gases. Re-cent data show that the rate of growth inU.S. greenhouse gas emissions has begun todecline, even as the U.S. economy has beengrowing at an unprecedented rate. For ex-ample, historically U.S. CO
2 emissions have
grown at roughly half the rate of GDP. In re-cent years, however, very robust growth inthe nation’s GDP has been accompanied bya slowdown in the growth of greenhousegas emissions. In both 1998 and 1999, U.S.
GDP grew by more than 4 percent a year,while CO
2 emissions grew by less than 1.5
percent a year. In addition, the carbon inten-sity of the U.S. economy—the amount ofCO
2 emitted per unit of GDP—declined by
15 percent during the 1990s.The United States has reduced green-
house gas emissions by promoting energyefficiency and the broader use of renewableenergy through a wide range of public-pri-vate partnership programs. These programssave energy, cut energy bills, enhance eco-nomic growth, and reduce emissions of con-ventional air pollutants as well as green-house gases.
The U.S. government, businesses, andnongovernmental organizations are seques-tering carbon, at home and abroad. For ex-ample, working with the U.S. Fish and Wild-life Service Research, Illinova GeneratingCompany has voluntarily committed to re-foresting 100,000 acres of bottomland hard-wood forests on National Wildlife Refugesin the Lower Mississippi River Valley. It isprojected that this project will sequester ap-proximately 13.5 million tons of carbon, im-prove fish and wildlife populations by re-storing the natural forest wetland habitats,and enhance the Gulf of Mexico’s near-shoreaquatic environment by restoring naturalforested wetland filters to the MississippiRiver floodplain.
Industry and the federal governmentare researching various new technologiesthat will reduce greenhouse gas emissionsor sequester those emissions, in geologicformations, oceans, and elsewhere.
Chapter 3 • Protecting America’s Environment: Sustaining the Nation’s Health and Environment 3-12
Regulatory StructureThe United States has adopted many
regulatory protections to limit the environ-mental damage and public health conse-quences of the exploration, extraction, pro-duction, and use of energy. Most environ-mental controls are implemented throughstate or federal permitting or review sys-tems, which often require time for agencyreview and public participation. Facilitiesmay need several different permits or re-views from different agencies, and theymay also need to meet local licensing orzoning laws. Businesses have an interest inmoving expeditiously to respond to con-sumers’ needs. The public also has an inter-est in participating in the system to ensurethat appropriate health and environmentalprecautions will be taken.
Regulatory requirements are notstatic. New scientific information and newcontrol technologies result in new regula-tions and modifications to existing regula-tions over time. However, some level ofcertainty in the regulatory environment isimportant for all parties. Businesses canplan more effectively in such an environ-ment, and regulators can focus on ensuringthat the desired outcomes are in factachieved consistently. For example, studieshave shown that if electricity generatorsknew today what their emission require-ments for several emissions would be for adefined time period, they would most likelycontrol emissions more cost effectively andsooner than if their emission requirementswere decided upon one gas at a time.
Traditional permit and regulatory pro-grams may not always be the most effectiveand efficient way to protect the environ-ment. Increasingly, regulatory programs areconsidering approaches that include mar-ket-based incentives. These types of incen-tives offer advantages over traditionalforms of regulation because they set highperformance standards and then allow mar-ket forces to determine the most effectiveway to meet them. While not appropriatefor every situation, market-based incentivescan control pollution at a lower cost to so-ciety than traditional regulation, stimulate
technological improvements, and be struc-tured to achieve larger reductions in pollu-tion than would result from traditional regu-lations.
A good example of a U.S. market-based program is the Acid Rain Program,which has reduced SO
2 air emissions from
utilities at a fraction of the initial cost esti-mates. Other emerging market-based envi-ronmental protection mechanisms includeeffluent trading, wetland mitigation banks,tradable development rights, easement pur-chases, off-site mitigation, and leasing orpurchasing of water rights. These programscan reduce mitigation or pollution controlcosts, increase business flexibility, and pro-vide transparency and environmental pro-tection for the public.
NATIONAL ENERGY POLICY3-13
Recommendation:
★ The NEPD Group recommends that the President issue anExecutive Order to rationalize permitting for energy productionin an environmentally sound manner by directing federalagencies to expedite permits and other federal actions necessaryfor energy-related project approvals on a national basis. Thisorder would establish an interagency task force chaired by theCouncil on Environmental Quality to ensure that federal agen-cies responsible for permitting energy-related facilities arecoordinating their efforts. The task force will ensure that federalagencies set up appropriate mechanisms to coordinate federal,state, tribal, and local permitting activity in particular regionswhere increased activity is expected.
The environmental review process canalso be made more open, understandable,predictable, and coordinated among federalagencies and with state and local agencies.It can be improved by providing greater in-formation to clarify expectations for energydevelopers, facilitating concurrent reviewsby federal agencies by standardizing certaininformation needs, sharing information re-ceived by project applicants, and seekingopportunities to integrate required environ-mental processes and reviews.
Chapter 3 • Protecting America’s Environment: Sustaining the Nation’s Health and Environment
Summary of Recommendations
Protecting America’s Environment: Sustaining the
Nation’s Health and Environment
★ The NEPD Group recommends that the President direct the Administratorof the Environmental Protection Agency (EPA) to propose multi-pollutantlegislation. The NEPD Group recommends that the President direct the EPAAdministrator to work with Congress to propose legislation that wouldestablish a flexible, market-based program to significantly reduce and capemissions of sulfur dioxide, nitrogen oxides, and mercury from electric powergenerators. Such a program (with appropriate measures to address localconcerns) would provide significant public health benefits even as we in-crease electricity supplies.• Establish mandatory reduction targets for emissions of three main pollut-
ants: sulfur dioxide, nitrogen oxides, and mercury.• Phase in reductions over a reasonable period of time, similar to the suc-
cessful acid rain reduction program established by the 1990 amendments tothe Clean Air Act.
• Provide regulatory certainty to allow utilities to make modifications totheir plants without fear of new litigation.
• Provide market-based incentives, such as emissions trading credits to helpachieve the required reductions.
★ The NEPD Group recommends the President direct the Secretary of theInterior to work with Congress to create the “Royalties Conservation Fund.”• This fund will earmark potentially billions of dollars in royalties from new
oil and gas production in ANWR to fund land conservation efforts.• This fund will also be used to eliminate the maintenance and improvements
backlog on federal lands.
★ The NEPD Group recommends the President issue an Executive Order torationalize permitting for energy production in an environmentally soundmanner by directing federal agencies to expedite permits and other federalactions necessary for energy-related project approvals on a national basis.This order would establish an interagency task force chaired by the Councilon Environmental Quality to ensure that federal agencies responsible forpermitting energy-related facilities are coordinating their efforts. The taskforce will ensure that federal agencies set up appropriate mechanisms tocoordinate federal, state, tribal, and local permitting activity in particularregions where increased activity is expected.
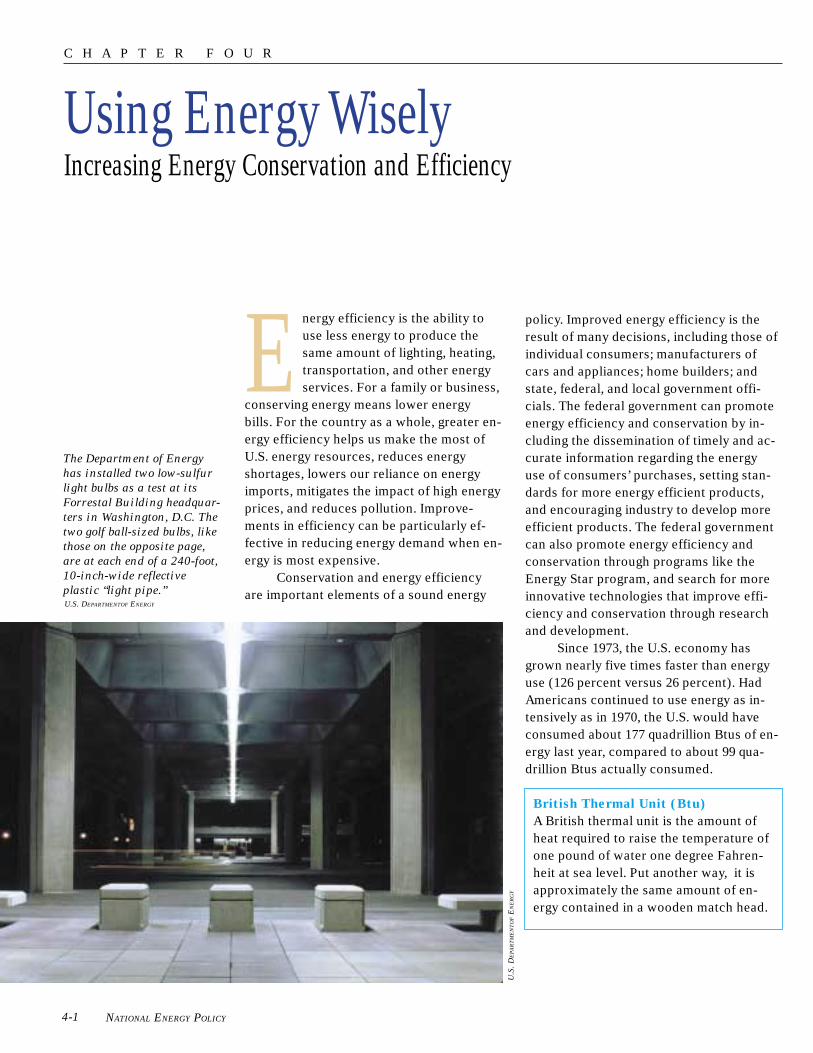
NATIONAL ENERGY POLICY
Using Energy WiselyIncreasing Energy Conservation and Efficiency
The Department of Energy
has installed two low-sulfur
light bulbs as a test at its
Forrestal Building headquar-
ters in Washington, D.C. The
two golf ball-sized bulbs, like
those on the opposite page,
are at each end of a 240-foot,
10-inch-wide reflective
plastic “light pipe.”
U.S
. D
EP
AR
TM
EN
TO
F E
NE
RG
Y
U.S. DEPARTMENTOF ENERGY
E nergy efficiency is the ability touse less energy to produce thesame amount of lighting, heating,transportation, and other energyservices. For a family or business,
conserving energy means lower energybills. For the country as a whole, greater en-ergy efficiency helps us make the most ofU.S. energy resources, reduces energyshortages, lowers our reliance on energyimports, mitigates the impact of high energyprices, and reduces pollution. Improve-ments in efficiency can be particularly ef-fective in reducing energy demand when en-ergy is most expensive.
Conservation and energy efficiencyare important elements of a sound energy
policy. Improved energy efficiency is theresult of many decisions, including those ofindividual consumers; manufacturers ofcars and appliances; home builders; andstate, federal, and local government offi-cials. The federal government can promoteenergy efficiency and conservation by in-cluding the dissemination of timely and ac-curate information regarding the energyuse of consumers’ purchases, setting stan-dards for more energy efficient products,and encouraging industry to develop moreefficient products. The federal governmentcan also promote energy efficiency andconservation through programs like theEnergy Star program, and search for moreinnovative technologies that improve effi-ciency and conservation through researchand development.
Since 1973, the U.S. economy hasgrown nearly five times faster than energyuse (126 percent versus 26 percent). HadAmericans continued to use energy as in-tensively as in 1970, the U.S. would haveconsumed about 177 quadrillion Btus of en-ergy last year, compared to about 99 qua-drillion Btus actually consumed.
British Thermal Unit (Btu)
A British thermal unit is the amount ofheat required to raise the temperature ofone pound of water one degree Fahren-heit at sea level. Put another way, it isapproximately the same amount of en-ergy contained in a wooden match head.
C H A P T E R F O U R
4-1

Chapter 4 • Using Energy Wisely: Increasing Energy Conservation and Efficiency
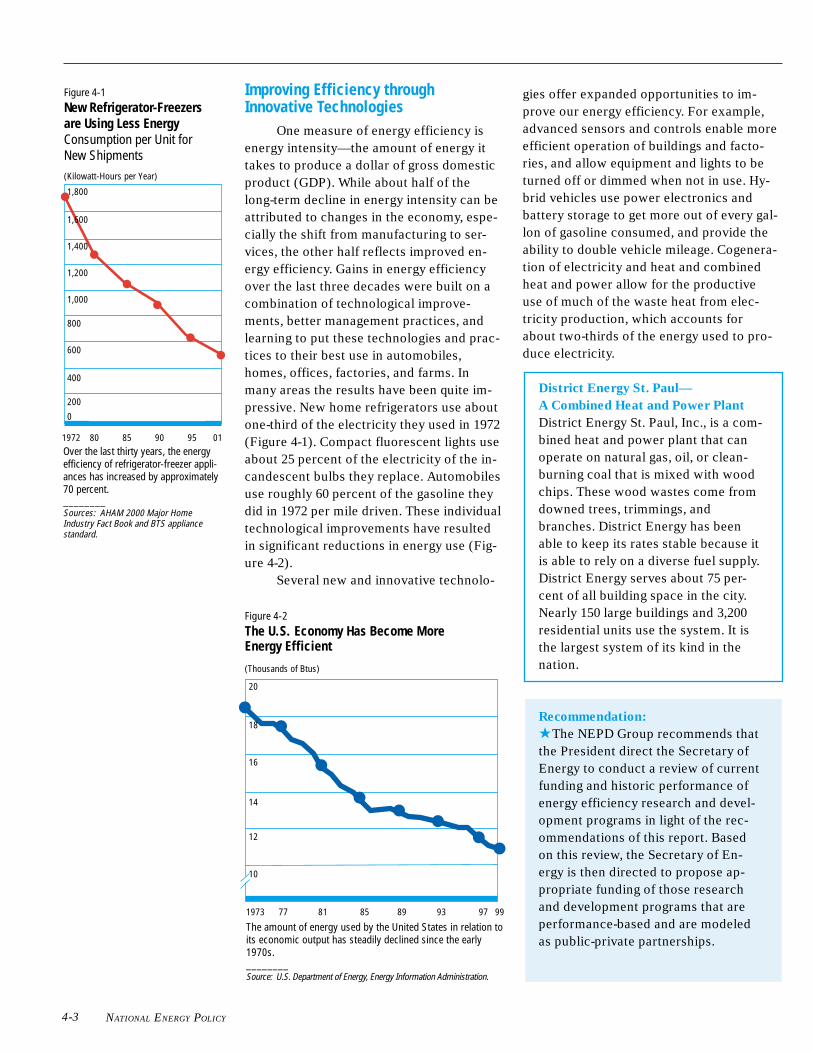
NATIONAL ENERGY POLICY
Over the last thirty years, the energyefficiency of refrigerator-freezer appli-ances has increased by approximately70 percent.________Sources: AHAM 2000 Major HomeIndustry Fact Book and BTS appliancestandard.
Figure 4-1New Refrigerator-Freezersare Using Less EnergyConsumption per Unit forNew Shipments(Kilowatt-Hours per Year)
1972 80 85 90 95 01
1,800
1,600
1,400
1,200
1,000
800
600
400
200
0
1973 77 81 85 89 93 97 99
Figure 4-2The U.S. Economy Has Become MoreEnergy Efficient
(Thousands of Btus)
The amount of energy used by the United States in relation toits economic output has steadily declined since the early1970s.________Source: U.S. Department of Energy, Energy Information Administration.
20
18
16
14
12
10
Improving Efficiency throughInnovative Technologies
One measure of energy efficiency isenergy intensity—the amount of energy ittakes to produce a dollar of gross domesticproduct (GDP). While about half of thelong-term decline in energy intensity can beattributed to changes in the economy, espe-cially the shift from manufacturing to ser-vices, the other half reflects improved en-ergy efficiency. Gains in energy efficiencyover the last three decades were built on acombination of technological improve-ments, better management practices, andlearning to put these technologies and prac-tices to their best use in automobiles,homes, offices, factories, and farms. Inmany areas the results have been quite im-pressive. New home refrigerators use aboutone-third of the electricity they used in 1972(Figure 4-1). Compact fluorescent lights useabout 25 percent of the electricity of the in-candescent bulbs they replace. Automobilesuse roughly 60 percent of the gasoline theydid in 1972 per mile driven. These individualtechnological improvements have resultedin significant reductions in energy use (Fig-ure 4-2).
Several new and innovative technolo-
gies offer expanded opportunities to im-prove our energy efficiency. For example,advanced sensors and controls enable moreefficient operation of buildings and facto-ries, and allow equipment and lights to beturned off or dimmed when not in use. Hy-brid vehicles use power electronics andbattery storage to get more out of every gal-lon of gasoline consumed, and provide theability to double vehicle mileage. Cogenera-tion of electricity and heat and combinedheat and power allow for the productiveuse of much of the waste heat from elec-tricity production, which accounts forabout two-thirds of the energy used to pro-duce electricity.
District Energy St. Paul—
A Combined Heat and Power Plant
District Energy St. Paul, Inc., is a com-bined heat and power plant that canoperate on natural gas, oil, or clean-burning coal that is mixed with woodchips. These wood wastes come fromdowned trees, trimmings, andbranches. District Energy has beenable to keep its rates stable because itis able to rely on a diverse fuel supply.District Energy serves about 75 per-cent of all building space in the city.Nearly 150 large buildings and 3,200residential units use the system. It isthe largest system of its kind in thenation.
Recommendation:
★ The NEPD Group recommends thatthe President direct the Secretary ofEnergy to conduct a review of currentfunding and historic performance ofenergy efficiency research and devel-opment programs in light of the rec-ommendations of this report. Basedon this review, the Secretary of En-ergy is then directed to propose ap-propriate funding of those researchand development programs that areperformance-based and are modeledas public-private partnerships.
4-3
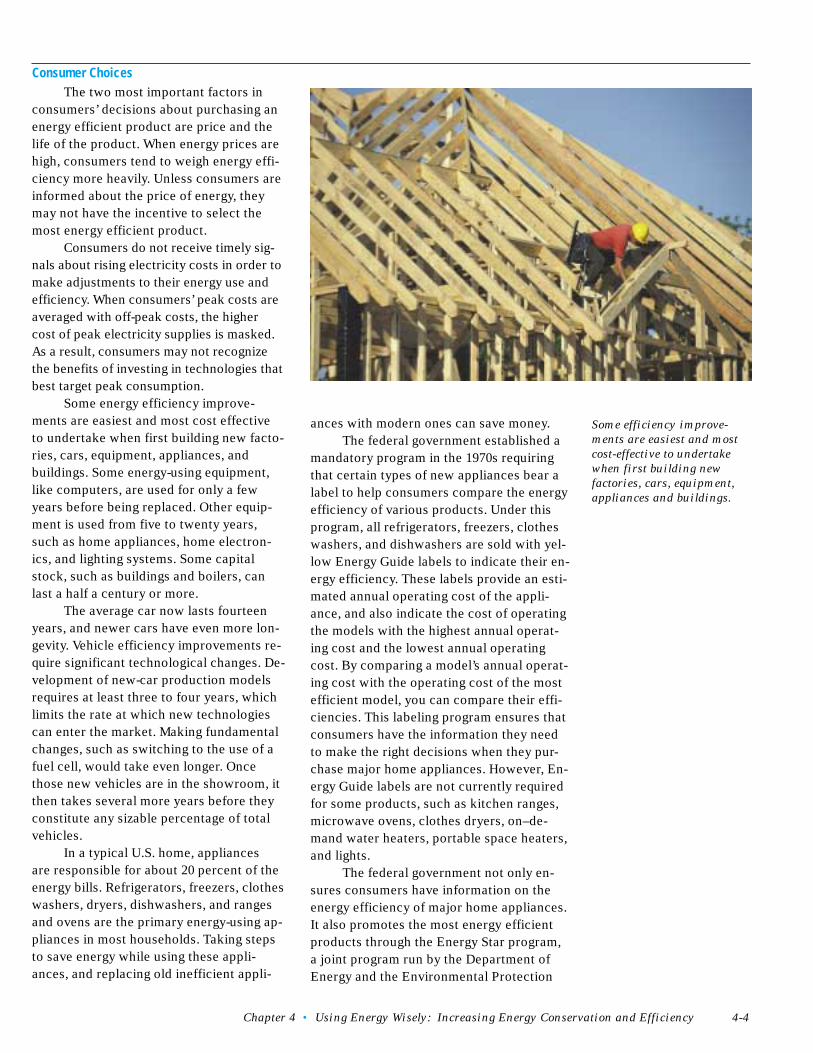
Chapter 4 • Using Energy Wisely: Increasing Energy Conservation and Efficiency
Some efficiency improve-
ments are easiest and most
cost-effective to undertake
when first building new
factories, cars, equipment,
appliances and buildings.
Consumer ChoicesThe two most important factors in
consumers’ decisions about purchasing anenergy efficient product are price and thelife of the product. When energy prices arehigh, consumers tend to weigh energy effi-ciency more heavily. Unless consumers areinformed about the price of energy, theymay not have the incentive to select themost energy efficient product.
Consumers do not receive timely sig-nals about rising electricity costs in order tomake adjustments to their energy use andefficiency. When consumers’ peak costs areaveraged with off-peak costs, the highercost of peak electricity supplies is masked.As a result, consumers may not recognizethe benefits of investing in technologies thatbest target peak consumption.
Some energy efficiency improve-ments are easiest and most cost effectiveto undertake when first building new facto-ries, cars, equipment, appliances, andbuildings. Some energy-using equipment,like computers, are used for only a fewyears before being replaced. Other equip-ment is used from five to twenty years,such as home appliances, home electron-ics, and lighting systems. Some capitalstock, such as buildings and boilers, canlast a half a century or more.
The average car now lasts fourteenyears, and newer cars have even more lon-gevity. Vehicle efficiency improvements re-quire significant technological changes. De-velopment of new-car production modelsrequires at least three to four years, whichlimits the rate at which new technologiescan enter the market. Making fundamentalchanges, such as switching to the use of afuel cell, would take even longer. Oncethose new vehicles are in the showroom, itthen takes several more years before theyconstitute any sizable percentage of totalvehicles.
In a typical U.S. home, appliancesare responsible for about 20 percent of theenergy bills. Refrigerators, freezers, clotheswashers, dryers, dishwashers, and rangesand ovens are the primary energy-using ap-pliances in most households. Taking stepsto save energy while using these appli-ances, and replacing old inefficient appli-
ances with modern ones can save money.The federal government established a
mandatory program in the 1970s requiringthat certain types of new appliances bear alabel to help consumers compare the energyefficiency of various products. Under thisprogram, all refrigerators, freezers, clotheswashers, and dishwashers are sold with yel-low Energy Guide labels to indicate their en-ergy efficiency. These labels provide an esti-mated annual operating cost of the appli-ance, and also indicate the cost of operatingthe models with the highest annual operat-ing cost and the lowest annual operatingcost. By comparing a model’s annual operat-ing cost with the operating cost of the mostefficient model, you can compare their effi-ciencies. This labeling program ensures thatconsumers have the information they needto make the right decisions when they pur-chase major home appliances. However, En-ergy Guide labels are not currently requiredfor some products, such as kitchen ranges,microwave ovens, clothes dryers, on–de-mand water heaters, portable space heaters,and lights.
The federal government not only en-sures consumers have information on theenergy efficiency of major home appliances.It also promotes the most energy efficientproducts through the Energy Star program,a joint program run by the Department ofEnergy and the Environmental Protection
4-4
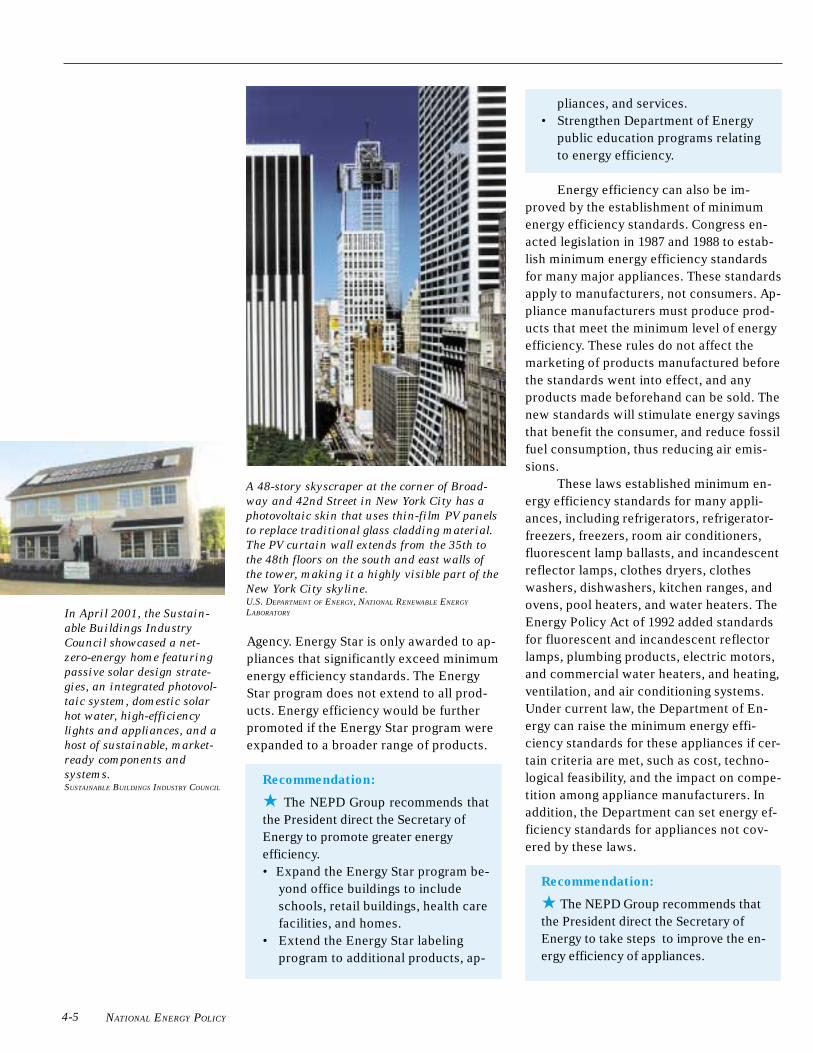
NATIONAL ENERGY POLICY
pliances, and services.• Strengthen Department of Energy
public education programs relatingto energy efficiency.
Energy efficiency can also be im-proved by the establishment of minimumenergy efficiency standards. Congress en-acted legislation in 1987 and 1988 to estab-lish minimum energy efficiency standardsfor many major appliances. These standardsapply to manufacturers, not consumers. Ap-pliance manufacturers must produce prod-ucts that meet the minimum level of energyefficiency. These rules do not affect themarketing of products manufactured beforethe standards went into effect, and anyproducts made beforehand can be sold. Thenew standards will stimulate energy savingsthat benefit the consumer, and reduce fossilfuel consumption, thus reducing air emis-sions.
These laws established minimum en-ergy efficiency standards for many appli-ances, including refrigerators, refrigerator-freezers, freezers, room air conditioners,fluorescent lamp ballasts, and incandescentreflector lamps, clothes dryers, clotheswashers, dishwashers, kitchen ranges, andovens, pool heaters, and water heaters. TheEnergy Policy Act of 1992 added standardsfor fluorescent and incandescent reflectorlamps, plumbing products, electric motors,and commercial water heaters, and heating,ventilation, and air conditioning systems.Under current law, the Department of En-ergy can raise the minimum energy effi-ciency standards for these appliances if cer-tain criteria are met, such as cost, techno-logical feasibility, and the impact on compe-tition among appliance manufacturers. Inaddition, the Department can set energy ef-ficiency standards for appliances not cov-ered by these laws.
Recommendation:
★ The NEPD Group recommends thatthe President direct the Secretary ofEnergy to take steps to improve the en-ergy efficiency of appliances.
In April 2001, the Sustain-
able Buildings Industry
Council showcased a net-
zero-energy home featuring
passive solar design strate-
gies, an integrated photovol-
taic system, domestic solar
hot water, high-efficiency
lights and appliances, and a
host of sustainable, market-
ready components and
systems.SUSTAINABLE BUILDINGS INDUSTRY COUNCIL
A 48-story skyscraper at the corner of Broad-
way and 42nd Street in New York City has a
photovoltaic skin that uses thin-film PV panels
to replace traditional glass cladding material.
The PV curtain wall extends from the 35th to
the 48th floors on the south and east walls of
the tower, making it a highly visible part of the
New York City skyline.U.S. DEPARTMENT OF ENERGY, NATIONAL RENEWABLE ENERGY
LABORATORY
Agency. Energy Star is only awarded to ap-pliances that significantly exceed minimumenergy efficiency standards. The EnergyStar program does not extend to all prod-ucts. Energy efficiency would be furtherpromoted if the Energy Star program wereexpanded to a broader range of products.
Recommendation:
★ The NEPD Group recommends thatthe President direct the Secretary ofEnergy to promote greater energyefficiency.• Expand the Energy Star program be-
yond office buildings to includeschools, retail buildings, health carefacilities, and homes.
• Extend the Energy Star labelingprogram to additional products, ap-
4-5
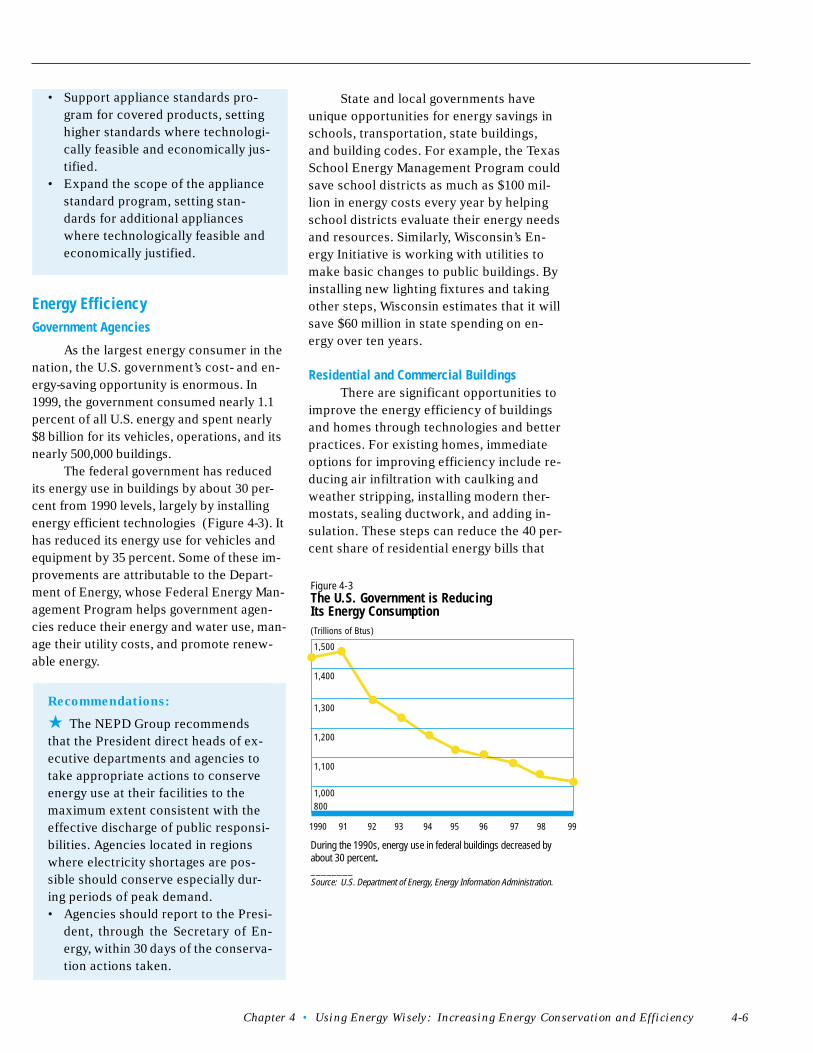
Chapter 4 • Using Energy Wisely: Increasing Energy Conservation and Efficiency
State and local governments haveunique opportunities for energy savings inschools, transportation, state buildings,and building codes. For example, the TexasSchool Energy Management Program couldsave school districts as much as $100 mil-lion in energy costs every year by helpingschool districts evaluate their energy needsand resources. Similarly, Wisconsin’s En-ergy Initiative is working with utilities tomake basic changes to public buildings. Byinstalling new lighting fixtures and takingother steps, Wisconsin estimates that it willsave $60 million in state spending on en-ergy over ten years.
Residential and Commercial BuildingsThere are significant opportunities to
improve the energy efficiency of buildingsand homes through technologies and betterpractices. For existing homes, immediateoptions for improving efficiency include re-ducing air infiltration with caulking andweather stripping, installing modern ther-mostats, sealing ductwork, and adding in-sulation. These steps can reduce the 40 per-cent share of residential energy bills that
• Support appliance standards pro-gram for covered products, settinghigher standards where technologi-cally feasible and economically jus-tified.
• Expand the scope of the appliancestandard program, setting stan-dards for additional applianceswhere technologically feasible andeconomically justified.
Energy EfficiencyGovernment Agencies
As the largest energy consumer in thenation, the U.S. government’s cost- and en-ergy-saving opportunity is enormous. In1999, the government consumed nearly 1.1percent of all U.S. energy and spent nearly$8 billion for its vehicles, operations, and itsnearly 500,000 buildings.
The federal government has reducedits energy use in buildings by about 30 per-cent from 1990 levels, largely by installingenergy efficient technologies (Figure 4-3). Ithas reduced its energy use for vehicles andequipment by 35 percent. Some of these im-provements are attributable to the Depart-ment of Energy, whose Federal Energy Man-agement Program helps government agen-cies reduce their energy and water use, man-age their utility costs, and promote renew-able energy.
Recommendations:
★ The NEPD Group recommendsthat the President direct heads of ex-ecutive departments and agencies totake appropriate actions to conserveenergy use at their facilities to themaximum extent consistent with theeffective discharge of public responsi-bilities. Agencies located in regionswhere electricity shortages are pos-sible should conserve especially dur-ing periods of peak demand.• Agencies should report to the Presi-
dent, through the Secretary of En-ergy, within 30 days of the conserva-tion actions taken.
Figure 4-3The U.S. Government is ReducingIts Energy Consumption(Trillions of Btus)
During the 1990s, energy use in federal buildings decreased byabout 30 percent.________Source: U.S. Department of Energy, Energy Information Administration.
1,500
1,400
1,300
1,200
1,100
1,000800
1990 91 92 93 94 95 96 97 98 99
4-6
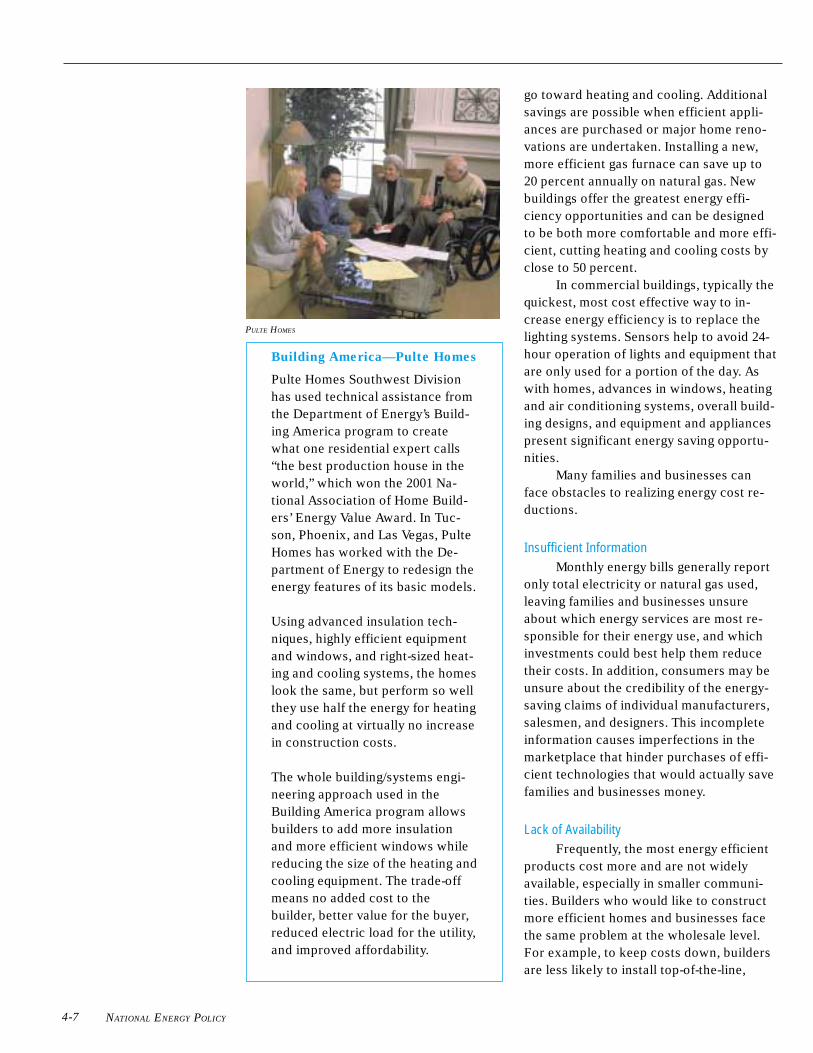
NATIONAL ENERGY POLICY
go toward heating and cooling. Additionalsavings are possible when efficient appli-ances are purchased or major home reno-vations are undertaken. Installing a new,more efficient gas furnace can save up to20 percent annually on natural gas. Newbuildings offer the greatest energy effi-ciency opportunities and can be designedto be both more comfortable and more effi-cient, cutting heating and cooling costs byclose to 50 percent.
In commercial buildings, typically thequickest, most cost effective way to in-crease energy efficiency is to replace thelighting systems. Sensors help to avoid 24-hour operation of lights and equipment thatare only used for a portion of the day. Aswith homes, advances in windows, heatingand air conditioning systems, overall build-ing designs, and equipment and appliancespresent significant energy saving opportu-nities.
Many families and businesses canface obstacles to realizing energy cost re-ductions.
Insufficient InformationMonthly energy bills generally report
only total electricity or natural gas used,leaving families and businesses unsureabout which energy services are most re-sponsible for their energy use, and whichinvestments could best help them reducetheir costs. In addition, consumers may beunsure about the credibility of the energy-saving claims of individual manufacturers,salesmen, and designers. This incompleteinformation causes imperfections in themarketplace that hinder purchases of effi-cient technologies that would actually savefamilies and businesses money.
Lack of AvailabilityFrequently, the most energy efficient
products cost more and are not widelyavailable, especially in smaller communi-ties. Builders who would like to constructmore efficient homes and businesses facethe same problem at the wholesale level.For example, to keep costs down, buildersare less likely to install top-of-the-line,
PULTE HOMES
Building America—Pulte Homes
Pulte Homes Southwest Divisionhas used technical assistance fromthe Department of Energy’s Build-ing America program to createwhat one residential expert calls“the best production house in theworld,” which won the 2001 Na-tional Association of Home Build-ers’ Energy Value Award. In Tuc-son, Phoenix, and Las Vegas, PulteHomes has worked with the De-partment of Energy to redesign theenergy features of its basic models.
Using advanced insulation tech-niques, highly efficient equipmentand windows, and right-sized heat-ing and cooling systems, the homeslook the same, but perform so wellthey use half the energy for heatingand cooling at virtually no increasein construction costs.
The whole building/systems engi-neering approach used in theBuilding America program allowsbuilders to add more insulationand more efficient windows whilereducing the size of the heating andcooling equipment. The trade-offmeans no added cost to thebuilder, better value for the buyer,reduced electric load for the utility,and improved affordability.
4-7
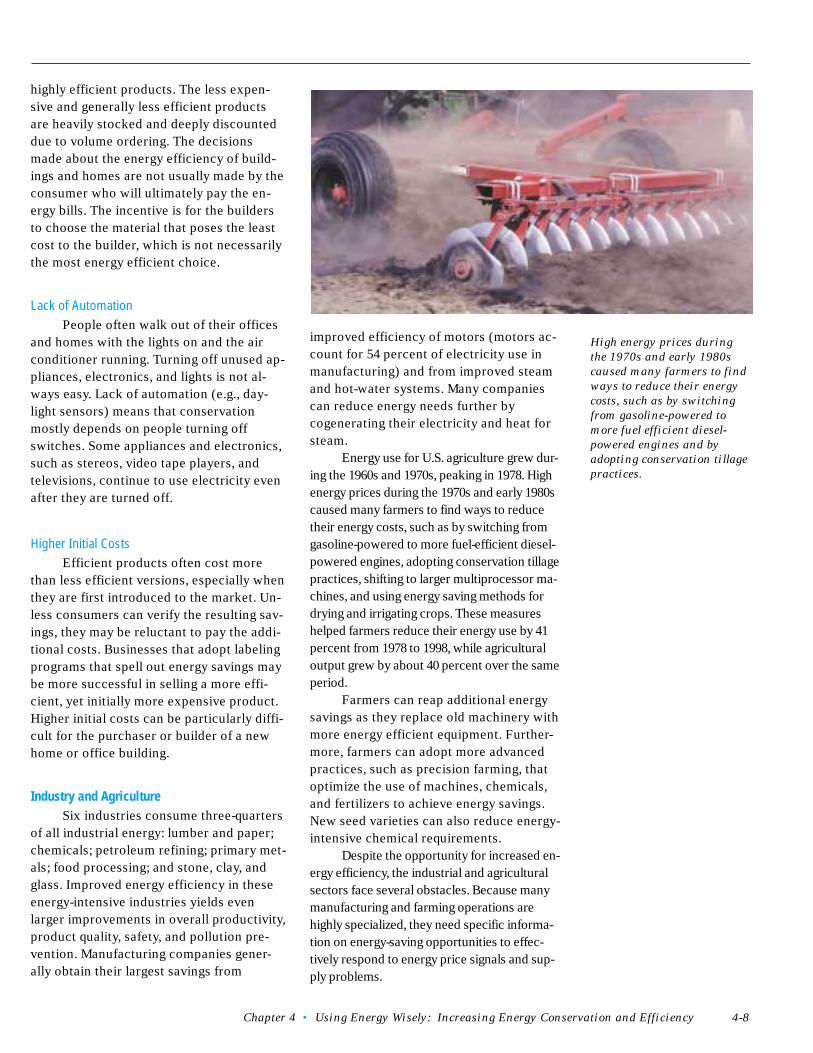
Chapter 4 • Using Energy Wisely: Increasing Energy Conservation and Efficiency
highly efficient products. The less expen-sive and generally less efficient productsare heavily stocked and deeply discounteddue to volume ordering. The decisionsmade about the energy efficiency of build-ings and homes are not usually made by theconsumer who will ultimately pay the en-ergy bills. The incentive is for the buildersto choose the material that poses the leastcost to the builder, which is not necessarilythe most energy efficient choice.
Lack of AutomationPeople often walk out of their offices
and homes with the lights on and the airconditioner running. Turning off unused ap-pliances, electronics, and lights is not al-ways easy. Lack of automation (e.g., day-light sensors) means that conservationmostly depends on people turning offswitches. Some appliances and electronics,such as stereos, video tape players, andtelevisions, continue to use electricity evenafter they are turned off.
Higher Initial CostsEfficient products often cost more
than less efficient versions, especially whenthey are first introduced to the market. Un-less consumers can verify the resulting sav-ings, they may be reluctant to pay the addi-tional costs. Businesses that adopt labelingprograms that spell out energy savings maybe more successful in selling a more effi-cient, yet initially more expensive product.Higher initial costs can be particularly diffi-cult for the purchaser or builder of a newhome or office building.
Industry and AgricultureSix industries consume three-quarters
of all industrial energy: lumber and paper;chemicals; petroleum refining; primary met-als; food processing; and stone, clay, andglass. Improved energy efficiency in theseenergy-intensive industries yields evenlarger improvements in overall productivity,product quality, safety, and pollution pre-vention. Manufacturing companies gener-ally obtain their largest savings from
improved efficiency of motors (motors ac-count for 54 percent of electricity use inmanufacturing) and from improved steamand hot-water systems. Many companiescan reduce energy needs further bycogenerating their electricity and heat forsteam.
Energy use for U.S. agriculture grew dur-ing the 1960s and 1970s, peaking in 1978. Highenergy prices during the 1970s and early 1980scaused many farmers to find ways to reducetheir energy costs, such as by switching fromgasoline-powered to more fuel-efficient diesel-powered engines, adopting conservation tillagepractices, shifting to larger multiprocessor ma-chines, and using energy saving methods fordrying and irrigating crops. These measureshelped farmers reduce their energy use by 41percent from 1978 to 1998, while agriculturaloutput grew by about 40 percent over the sameperiod.
Farmers can reap additional energysavings as they replace old machinery withmore energy efficient equipment. Further-more, farmers can adopt more advancedpractices, such as precision farming, thatoptimize the use of machines, chemicals,and fertilizers to achieve energy savings.New seed varieties can also reduce energy-intensive chemical requirements.
Despite the opportunity for increased en-ergy efficiency, the industrial and agriculturalsectors face several obstacles. Because manymanufacturing and farming operations arehighly specialized, they need specific informa-tion on energy-saving opportunities to effec-tively respond to energy price signals and sup-ply problems.
High energy prices during
the 1970s and early 1980s
caused many farmers to find
ways to reduce their energy
costs, such as by switching
from gasoline-powered to
more fuel efficient diesel-
powered engines and by
adopting conservation tillage
practices.
4-8
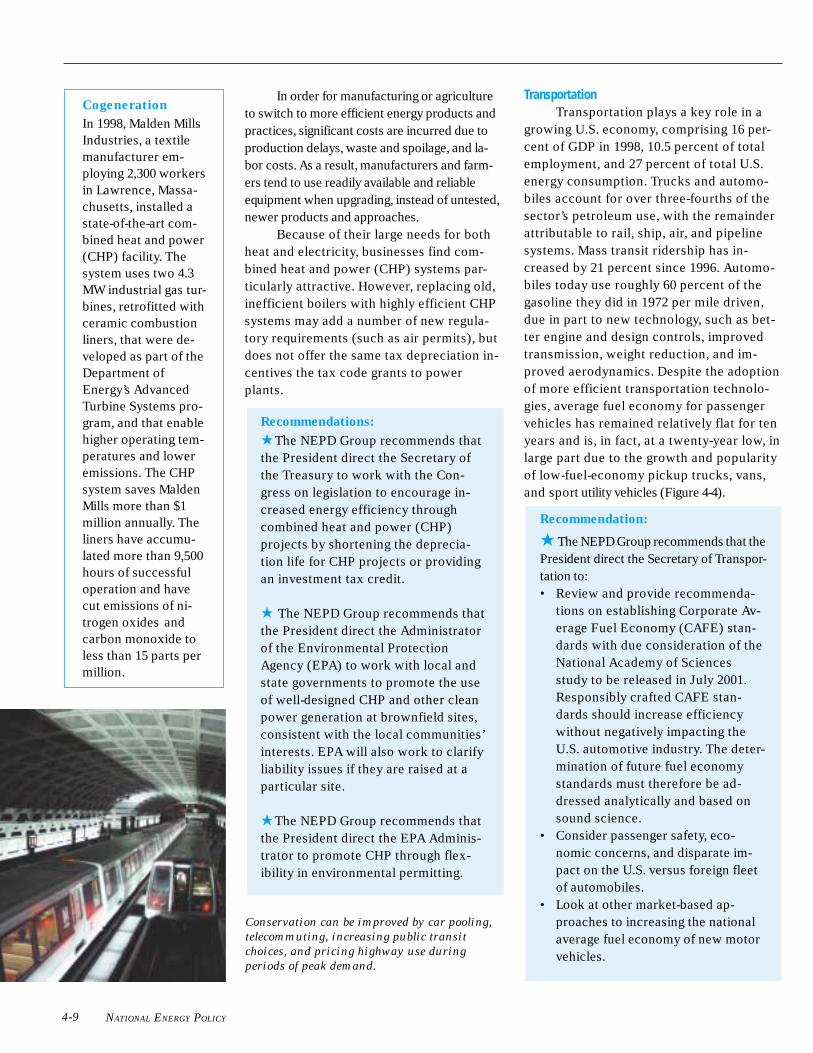
NATIONAL ENERGY POLICY
In order for manufacturing or agricultureto switch to more efficient energy products andpractices, significant costs are incurred due toproduction delays, waste and spoilage, and la-bor costs. As a result, manufacturers and farm-ers tend to use readily available and reliableequipment when upgrading, instead of untested,newer products and approaches.
Because of their large needs for bothheat and electricity, businesses find com-bined heat and power (CHP) systems par-ticularly attractive. However, replacing old,inefficient boilers with highly efficient CHPsystems may add a number of new regula-tory requirements (such as air permits), butdoes not offer the same tax depreciation in-centives the tax code grants to powerplants.
Recommendations:
★ The NEPD Group recommends thatthe President direct the Secretary ofthe Treasury to work with the Con-gress on legislation to encourage in-creased energy efficiency throughcombined heat and power (CHP)projects by shortening the deprecia-tion life for CHP projects or providingan investment tax credit.
★ The NEPD Group recommends thatthe President direct the Administratorof the Environmental ProtectionAgency (EPA) to work with local andstate governments to promote the useof well-designed CHP and other cleanpower generation at brownfield sites,consistent with the local communities’interests. EPA will also work to clarifyliability issues if they are raised at aparticular site.
★ The NEPD Group recommends thatthe President direct the EPA Adminis-trator to promote CHP through flex-ibility in environmental permitting.
TransportationTransportation plays a key role in a
growing U.S. economy, comprising 16 per-cent of GDP in 1998, 10.5 percent of totalemployment, and 27 percent of total U.S.energy consumption. Trucks and automo-biles account for over three-fourths of thesector’s petroleum use, with the remainderattributable to rail, ship, air, and pipelinesystems. Mass transit ridership has in-creased by 21 percent since 1996. Automo-biles today use roughly 60 percent of thegasoline they did in 1972 per mile driven,due in part to new technology, such as bet-ter engine and design controls, improvedtransmission, weight reduction, and im-proved aerodynamics. Despite the adoptionof more efficient transportation technolo-gies, average fuel economy for passengervehicles has remained relatively flat for tenyears and is, in fact, at a twenty-year low, inlarge part due to the growth and popularityof low-fuel-economy pickup trucks, vans,and sport utility vehicles (Figure 4-4).
Recommendation:
★ The NEPD Group recommends that thePresident direct the Secretary of Transpor-tation to:• Review and provide recommenda-
tions on establishing Corporate Av-erage Fuel Economy (CAFE) stan-dards with due consideration of theNational Academy of Sciencesstudy to be released in July 2001.Responsibly crafted CAFE stan-dards should increase efficiencywithout negatively impacting theU.S. automotive industry. The deter-mination of future fuel economystandards must therefore be ad-dressed analytically and based onsound science.
• Consider passenger safety, eco-nomic concerns, and disparate im-pact on the U.S. versus foreign fleetof automobiles.
• Look at other market-based ap-proaches to increasing the nationalaverage fuel economy of new motorvehicles.
Cogeneration
In 1998, Malden MillsIndustries, a textilemanufacturer em-ploying 2,300 workersin Lawrence, Massa-chusetts, installed astate-of-the-art com-bined heat and power(CHP) facility. Thesystem uses two 4.3MW industrial gas tur-bines, retrofitted withceramic combustionliners, that were de-veloped as part of theDepartment ofEnergy’s AdvancedTurbine Systems pro-gram, and that enablehigher operating tem-peratures and loweremissions. The CHPsystem saves MaldenMills more than $1million annually. Theliners have accumu-lated more than 9,500hours of successfuloperation and havecut emissions of ni-trogen oxides
and
carbon monoxide toless than 15 parts permillion.
Conservation can be improved by car pooling,
telecommuting, increasing public transit
choices, and pricing highway use during
periods of peak demand.
4-9
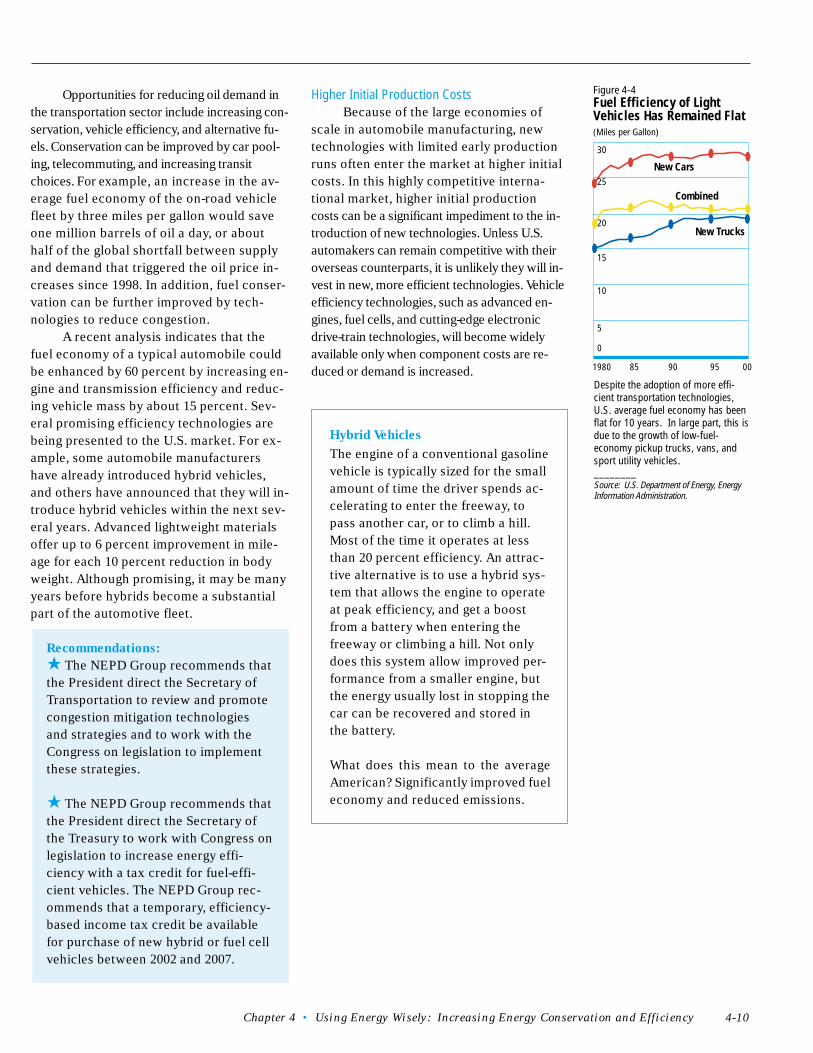
Chapter 4 • Using Energy Wisely: Increasing Energy Conservation and Efficiency
Higher Initial Production CostsBecause of the large economies of
scale in automobile manufacturing, newtechnologies with limited early productionruns often enter the market at higher initialcosts. In this highly competitive interna-tional market, higher initial productioncosts can be a significant impediment to the in-troduction of new technologies. Unless U.S.automakers can remain competitive with theiroverseas counterparts, it is unlikely they will in-vest in new, more efficient technologies. Vehicleefficiency technologies, such as advanced en-gines, fuel cells, and cutting-edge electronicdrive-train technologies, will become widelyavailable only when component costs are re-duced or demand is increased.
Opportunities for reducing oil demand inthe transportation sector include increasing con-servation, vehicle efficiency, and alternative fu-els. Conservation can be improved by car pool-ing, telecommuting, and increasing transitchoices. For example, an increase in the av-erage fuel economy of the on-road vehiclefleet by three miles per gallon would saveone million barrels of oil a day, or abouthalf of the global shortfall between supplyand demand that triggered the oil price in-creases since 1998. In addition, fuel conser-vation can be further improved by tech-nologies to reduce congestion.
A recent analysis indicates that thefuel economy of a typical automobile couldbe enhanced by 60 percent by increasing en-gine and transmission efficiency and reduc-ing vehicle mass by about 15 percent. Sev-eral promising efficiency technologies arebeing presented to the U.S. market. For ex-ample, some automobile manufacturershave already introduced hybrid vehicles,and others have announced that they will in-troduce hybrid vehicles within the next sev-eral years. Advanced lightweight materialsoffer up to 6 percent improvement in mile-age for each 10 percent reduction in bodyweight. Although promising, it may be manyyears before hybrids become a substantialpart of the automotive fleet.
Recommendations:
★ The NEPD Group recommends thatthe President direct the Secretary ofTransportation to review and promotecongestion mitigation technologiesand strategies and to work with theCongress on legislation to implementthese strategies.
★ The NEPD Group recommends thatthe President direct the Secretary ofthe Treasury to work with Congress onlegislation to increase energy effi-ciency with a tax credit for fuel-effi-cient vehicles. The NEPD Group rec-ommends that a temporary, efficiency-based income tax credit be availablefor purchase of new hybrid or fuel cellvehicles between 2002 and 2007.
Hybrid Vehicles
The engine of a conventional gasolinevehicle is typically sized for the smallamount of time the driver spends ac-celerating to enter the freeway, topass another car, or to climb a hill.Most of the time it operates at lessthan 20 percent efficiency. An attrac-tive alternative is to use a hybrid sys-tem that allows the engine to operateat peak efficiency, and get a boostfrom a battery when entering thefreeway or climbing a hill. Not onlydoes this system allow improved per-formance from a smaller engine, butthe energy usually lost in stopping thecar can be recovered and stored inthe battery.
What does this mean to the averageAmerican? Significantly improved fueleconomy and reduced emissions.
Figure 4-4Fuel Efficiency of LightVehicles Has Remained Flat(Miles per Gallon)
Despite the adoption of more effi-cient transportation technologies,U.S. average fuel economy has beenflat for 10 years. In large part, this isdue to the growth of low-fuel-economy pickup trucks, vans, andsport utility vehicles.________Source: U.S. Department of Energy, EnergyInformation Administration.
1980 85 90 95 00
New Trucks
30
25
20
15
10
5
0
4-10
New Cars
Combined
NATIONAL ENERGY POLICY
Summary of Recommendations
Using Energy Wisely: Increasing Energy Conservation and Efficiency
★ The NEPD Group recommends that the President direct the Office of Science and Technology Policy and thePresident’s Council of Advisors on Science and Technology to review and make recommendations on using thenation’s energy resources more efficiently.
★ The NEPD Group recommends that the President direct the Secretary of Energy to conduct a review of current fund-ing and historic performance of energy efficiency research and development programs in light of the recommendationsof this report. Based on this review, the Secretary of Energy is then directed to propose appropriate funding of those re-search and development programs that are performance-based and are modeled as public-private partnerships.
★ The NEPD Group recommends that the President direct the Secretary of Energy to promote greater energy effi-ciency.
• Expand the Energy Star program beyond office buildings to include schools, retail buildings, health care facili-ties, and homes.
• Extend the Energy Star labeling program to additional products, appliances, and services.
• Strengthen Department of Energy public education programs relating to energy efficiency.
★ The NEPD Group recommends that the President direct the Secretary of Energy to improve the energy efficiencyof appliances.
• Support the appliance standards program for covered products, setting higher standards where technologicallyfeasible and economically justified.
• Expand the scope of the appliance standards program, setting standards for additional appliances where tech-nologically feasible and economically justified.
★ The NEPD Group recommends that the President direct heads of executive departments and agencies to take ap-propriate actions to conserve energy use at their facilities to the maximum extent consistent with the effective dis-charge of public responsibilities. Agencies located in regions where electricity shortages are possible should conserveespecially during periods of peak demand. Agencies should report to the President, through the Secretary of Energy,within 30 days on the conservation actions taken.
★ The NEPD Group recommends that the President direct the Secretary of the Treasury to work with Congress to en-courage increased energy efficiency through combined heat and power (CHP) projects by shortening the depreciationlife for CHP projects or providing an investment tax credit.
★ The NEPD Group recommends that the President direct the Administrator of the Environmental Protection Agency(EPA) to work with local and state governments to promote the use of well-designed CHP and other clean power gen-eration at brownfields sites, consistent with the local communities’ interests. EPA will also work to clarify liability is-sues if they are raised at a particular site.
★ The NEPD Group recommends that the President direct the EPA Administrator to promote CHP through flexibilityin environmental permitting.
★ The NEPD Group recommends that the President direct the Secretary of Transportation to:• Review and provide recommendations on establishing Corporate Average Fuel Economy (CAFE) standards
with due consideration of the National Academy of Sciences study to be released in July 2001. Responsibly
4-11
Chapter 4 • Using Energy Wisely: Increasing Energy Conservation and Efficiency
crafted CAFE standards should increase efficiency without negatively impacting the U.S. automotive industry.The determination of future fuel economy standards must therefore be addressed analytically and based onsound science.
• Consider passenger safety, economic concerns, and disparate impact on the U.S. versus foreign fleet of automo-biles.
• Look at other market-based approaches to increasing the national average fuel economy of new motor vehicles.
★ The new NEPD Group recommends that the President direct the Secretary of Transportation to review and pro-mote congestion mitigation technologies and strategies and work with Congress on legislation to implement thesestrategies.
★ The NEPD Group recommends that the President direct the Secretary of the Treasury to work with Congress onlegislation to increase energy efficiency with a tax credit for fuel-efficient vehicles. The NEPD Group recommendsthat a temporary, efficiency-based income tax credit be available for purchase of new hybrid fuel cell vehicles be-tween 2002 and 2007.
★ The NEPD Group recommends that the President direct all agencies to use technological advances to better pro-tect our environment.
• The Administration remains committed to investing in Intelligent Transportation Systems (ITS) and encour-ages the private sector to invest in ITS applications. This Department of Transportation (DOT) program fundsthe development of improved transportation infrastructure that will reduce congestion, such as traveler infor-mation/navigation systems, freeway management, and electronic toll collection. ITS applications reduce fuelassociated with travel.
• The Administration remains committed to the DOT’s fuel-cell-powered transit bus program, authored by theTransportation Equity Act for the 21st Century (TEA-21). This program demonstrates the viability of fuel-cellpower plants for transit bus applications.
• The Administration remains committed to the Clean Buses program. TEA-21 establishes a new clean fuel for-mula grant program, which provides an opportunity to accelerate the introduction of advanced bus propulsiontechnologies into the mainstream of the nation’s transit fleet.
★ The NEPD Group recommends that the President direct the EPA and DOT to develop ways to reduce demand forpetroleum transportation fuels by working with the trucking industry to establish a program to reduce emissions andfuel consumption from long-haul trucks at truck stops by implementing alternatives to idling, such as electrificationand auxiliary power units at truck stops along interstate highways. EPA and DOT will develop partnership agree-ments with trucking fleets, truck stops, and manufacturers of idle-reducing technologies (e.g., portable auxiliarypacks, electrification) to install and use low-emission-idling technologies.
★ The NEPD Group recommends that the President direct the Secretary of Energy to establish a national priorityfor improving energy efficiency. The priority would be to improve the energy intensity of the U.S. economy as mea-sured by the amount of energy required for each dollar of economic productivity. This increased efficiency should bepursued through the combined efforts of industry, consumers, and federal, state, and local governments.
★ The NEPD Group recommends that the President direct the EPA Administrator to develop and implement a strat-egy to increase public awareness of the sizable savings that energy efficiency offers to homeowners across the coun-try. Typical homeowners can save about 30 percent (about $400) a year on their home energy bill by using EnergyStar-labeled products.
4-12
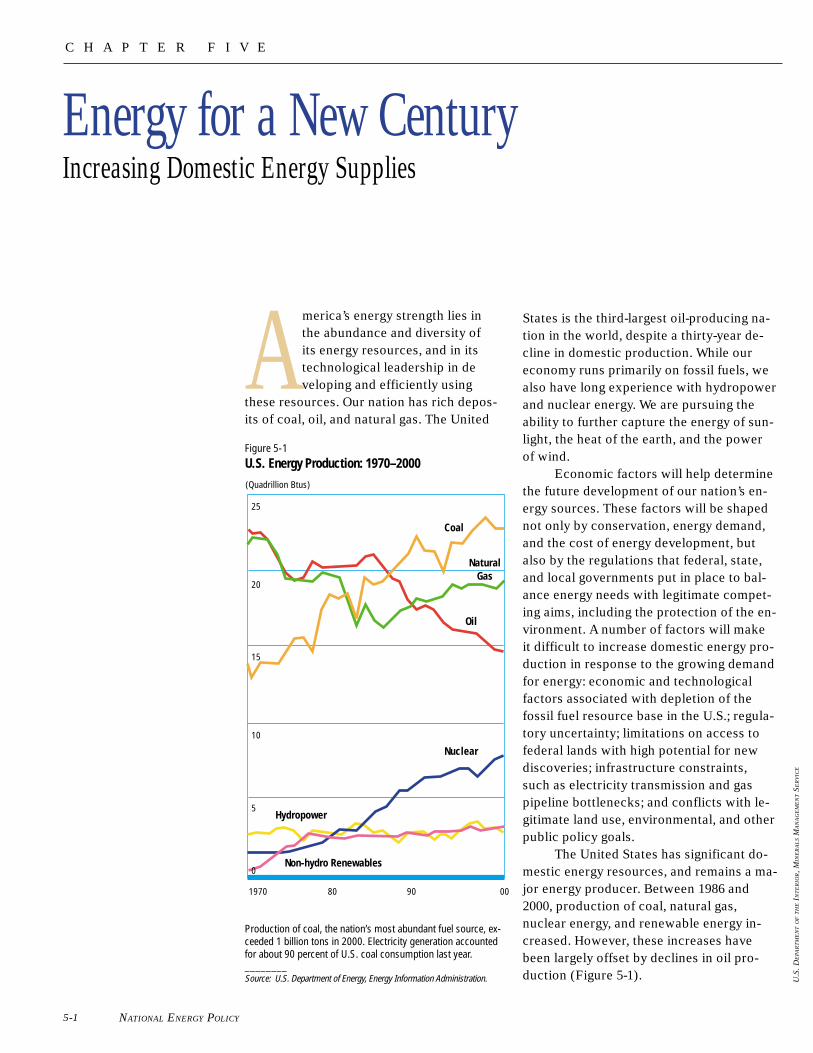
NATIONAL ENERGY POLICY
America’s energy strength lies inthe abundance and diversity ofits energy resources, and in itstechnological leadership in developing and efficiently using
these resources. Our nation has rich depos-its of coal, oil, and natural gas. The United
Energy for a New CenturyIncreasing Domestic Energy Supplies
Figure 5-1U.S. Energy Production: 1970–2000
Production of coal, the nation’s most abundant fuel source, ex-ceeded 1 billion tons in 2000. Electricity generation accountedfor about 90 percent of U.S. coal consumption last year.________Source: U.S. Department of Energy, Energy Information Administration.
Coal
Oil
Nuclear
25
20
15
10
5
0Non-hydro Renewables
Hydropower
1970 80 90 00
(Quadrillion Btus)
States is the third-largest oil-producing na-tion in the world, despite a thirty-year de-cline in domestic production. While oureconomy runs primarily on fossil fuels, wealso have long experience with hydropowerand nuclear energy. We are pursuing theability to further capture the energy of sun-light, the heat of the earth, and the powerof wind.
Economic factors will help determinethe future development of our nation’s en-ergy sources. These factors will be shapednot only by conservation, energy demand,and the cost of energy development, butalso by the regulations that federal, state,and local governments put in place to bal-ance energy needs with legitimate compet-ing aims, including the protection of the en-vironment. A number of factors will makeit difficult to increase domestic energy pro-duction in response to the growing demandfor energy: economic and technologicalfactors associated with depletion of thefossil fuel resource base in the U.S.; regula-tory uncertainty; limitations on access tofederal lands with high potential for newdiscoveries; infrastructure constraints,such as electricity transmission and gaspipeline bottlenecks; and conflicts with le-gitimate land use, environmental, and otherpublic policy goals.
The United States has significant do-mestic energy resources, and remains a ma-jor energy producer. Between 1986 and2000, production of coal, natural gas,nuclear energy, and renewable energy in-creased. However, these increases havebeen largely offset by declines in oil pro-duction (Figure 5-1). U
.S. D
EPA
RT
ME
NT O
F T
HE I
NT
ER
IOR, M
INE
RA
LS M
AN
AG
EM
EN
T S
ER
VIC
E
5-1
C H A P T E R F I V E
NaturalGas

Chapter 5 • Energy for A New Century: Increasing Domestic Energy Supplies
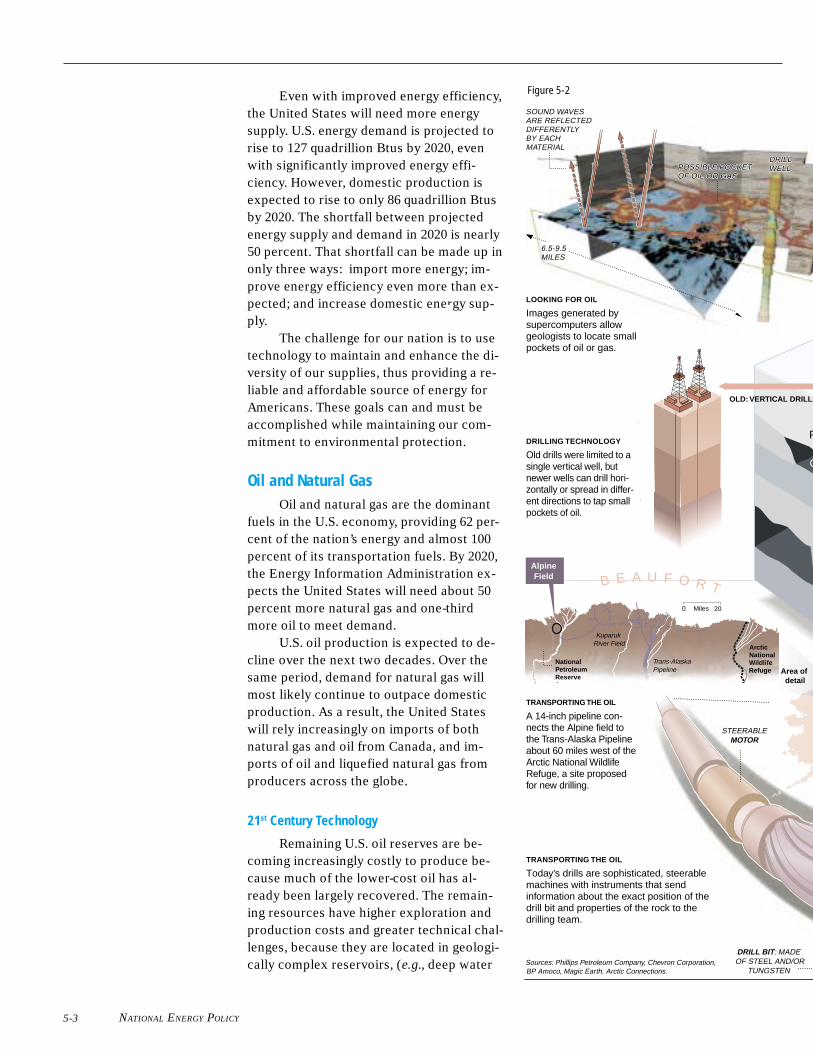
NATIONAL ENERGY POLICY
Even with improved energy efficiency,the United States will need more energysupply. U.S. energy demand is projected torise to 127 quadrillion Btus by 2020, evenwith significantly improved energy effi-ciency. However, domestic production isexpected to rise to only 86 quadrillion Btusby 2020. The shortfall between projectedenergy supply and demand in 2020 is nearly50 percent. That shortfall can be made up inonly three ways: import more energy; im-prove energy efficiency even more than ex-pected; and increase domestic energy sup-ply.
The challenge for our nation is to usetechnology to maintain and enhance the di-versity of our supplies, thus providing a re-liable and affordable source of energy forAmericans. These goals can and must beaccomplished while maintaining our com-mitment to environmental protection.
Oil and Natural GasOil and natural gas are the dominant
fuels in the U.S. economy, providing 62 per-cent of the nation’s energy and almost 100percent of its transportation fuels. By 2020,the Energy Information Administration ex-pects the United States will need about 50percent more natural gas and one-thirdmore oil to meet demand.
U.S. oil production is expected to de-cline over the next two decades. Over thesame period, demand for natural gas willmost likely continue to outpace domesticproduction. As a result, the United Stateswill rely increasingly on imports of bothnatural gas and oil from Canada, and im-ports of oil and liquefied natural gas fromproducers across the globe.
21st Century Technology
Remaining U.S. oil reserves are be-coming increasingly costly to produce be-cause much of the lower-cost oil has al-ready been largely recovered. The remain-ing resources have higher exploration andproduction costs and greater technical chal-lenges, because they are located in geologi-cally complex reservoirs, (e.g., deep water
Area of detail
Arctic National Wildlife Refuge
Trans-Alaska Pipeline
0 20Miles
National Petroleum Reserve
AlpineField B E A U F O R T
Kuparuk River Field
DRILL DRILL WELLWELLPOSSIBLE POCKET POSSIBLE POCKET
OF OIL OR GASOF OIL OR GAS
DRILL WELLPOSSIBLE POCKET
OF OIL OR GAS
SOUND WAVES ARE REFLECTED DIFFERENTLYBY EACH MATERIAL
OLD: VERTICAL DRILLI
O
P
LOOKING FOR OIL
Images generated by supercomputers allow geologists to locate small pockets of oil or gas.
DRILLING TECHNOLOGY
Old drills were limited to a single vertical well, but newer wells can drill hori-zontally or spread in differ-ent directions to tap small pockets of oil.
TRANSPORTING THE OIL
A 14-inch pipeline con-nects the Alpine field to the Trans-Alaska Pipeline about 60 miles west of the Arctic National Wildlife Refuge, a site proposed for new drilling.
TRANSPORTING THE OIL
Today’s drills are sophisticated, steerable machines with instruments that send information about the exact position of the drill bit and properties of the rock to the drilling team.
Sources: Phillips Petroleum Company, Chevron Corporation, BP Amoco, Magic Earth, Arctic Connections.
6.5-9.5 MILES
DRILL BIT: MADE OF STEEL AND/OR
TUNGSTEN
STEERABLE MOTOR
5-3
Figure 5-2
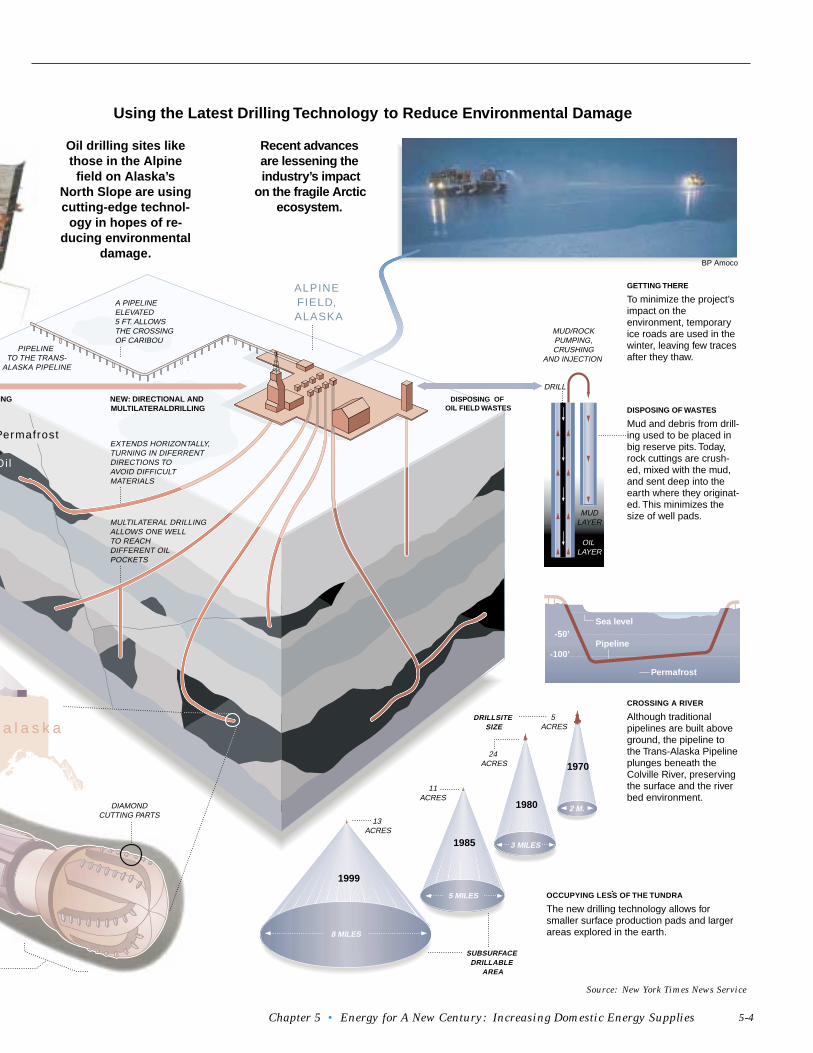
Chapter 5 • Energy for A New Century: Increasing Domestic Energy Supplies
-50’Sea level
-100’
W E
a l a s k a
DRILL
MUDLAYER
OIL LAYER
MUD/ROCKPUMPING,CRUSHING
AND INJECTION
Pipeline
Permafrost
DRILL WELLPOSSIBLE POCKET
OF OIL OR GAS
ING NEW: DIRECTIONAL AND MULTILATERALDRILLING
A PIPELINE ELEVATED5 FT. ALLOWS THE CROSSING OF CARIBOU
DISPOSING OF OIL FIELD WASTES
Oil
Permafrost
Oil drilling sites like those in the Alpine
field on Alaska’s North Slope are using cutting-edge technol-
ogy in hopes of re-ducing environmental
damage.
Recent advances are lessening the industry’s impact
on the fragile Arctic ecosystem.
GETTING THERE
To minimize the project’s impact on the environment, temporary ice roads are used in the winter, leaving few traces after they thaw.
DISPOSING OF WASTES
Mud and debris from drill-ing used to be placed in big reserve pits. Today, rock cuttings are crush-ed, mixed with the mud, and sent deep into the earth where they originat-ed. This minimizes the size of well pads.
CROSSING A RIVER
Although traditional pipelines are built above ground, the pipeline to the Trans-Alaska Pipeline plunges beneath the Colville River, preserving the surface and the river bed environment.
OCCUPYING LESS OF THE TUNDRA
The new drilling technology allows for smaller surface production pads and larger areas explored in the earth.
to Reduce Environmental DamageUsing the Latest Drilling Technology
8 MILES
5 MILES
3 MILES
2 M.
1970
1980
1985
1999
SUBSURFACE DRILLABLE
AREA
DRILLSITE SIZE
5 ACRES
24 ACRES
11ACRES
13 ACRES
PIPELINE TO THE TRANS-
ALASKA PIPELINE
EXTENDS HORIZONTALLY,TURNING IN DIFERRENT DIRECTIONS TO AVOID DIFFICULT MATERIALS
MULTILATERAL DRILLING ALLOWS ONE WELL TO REACH DIFFERENT OIL POCKETS
ALPINE FIELD, ALASKA
BP Amoco
DIAMOND CUTTING PARTS
5-4
Source: New York Times News Service
NATIONAL ENERGY POLICY5-5
21st Century Technology:
The Key to Environmental Protection and New Energy Production
Producing oil and gas from geologically challenging areas while protecting theenvironment is important to Americans and to the future of our nation’s energysecurity. New technology and management techniques allow for sophisticatedenergy production as well as enhanced environmental protection. A technol-ogy evolution has occurred in the way oil and natural gas are found. The com-puter, three dimensional seismic technology, and other technologies have trans-formed the process from one based on “feel,” to one highly dependent on themost advanced and sophisticated technology available. These technologiesreduce cost and protect the environment.
Today’s oil and gas exploration technology, for example, is boosting the suc-cess rate of pinpointing new resources. The results: fewer dry holes, reducedwaste volumes, and a cleaner environment. Smaller, lighter drilling rigs coupledwith advances in directional and extended-reach drilling significantly increaseprotection of the environment.
• Advanced, more energy efficient drilling and production methods:— reduce emissions;— practically eliminate spills from offshore platforms; and
— enhance worker safety, lower risk of blowouts, and provide bet- ter protection of groundwater resources.
• With each improvement in operational performance and efficiency, more oil and gas resources can be recovered with fewer wells drilled, resulting in smaller volumes of:
— cuttings;— drilling muds and fluids; and— produced waters.
• Modular drilling rigs, “slimhole” drilling, directional drilling, and other advances enable:
— production of oil and gas with increased protection to wetlands and other sensitive environments;
— reduced greenhouse gas emissions; and worker safety through the use of innovative best manage-
ment practices.
Other examples of advanced technology include:
• 3-D seismic technology that enables geologists to use computers to determine the location of oil and gas before drilling begins, dramati cally improving the exploration success rate;
• deep-water drilling technology that enables exploration and produc tion of oil and gas at depths over two miles beneath the ocean’s sur face;
• high-powered lasers that may one day be used for drilling for oil and gas; and
• highly sophisticated directional drilling that enables wells to be drilled long horizontal distances from the drilling site.
:
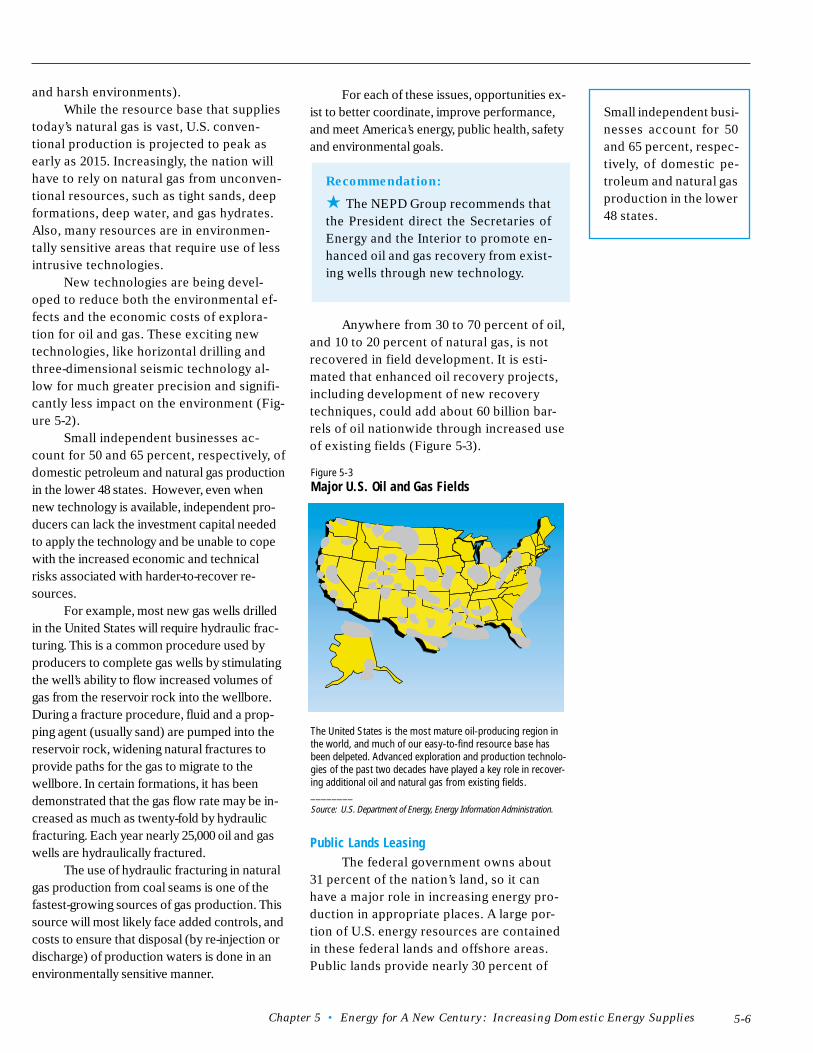
Chapter 5 • Energy for A New Century: Increasing Domestic Energy Supplies
For each of these issues, opportunities ex-ist to better coordinate, improve performance,and meet America’s energy, public health, safetyand environmental goals.
Recommendation:
★ The NEPD Group recommends thatthe President direct the Secretaries ofEnergy and the Interior to promote en-hanced oil and gas recovery from exist-ing wells through new technology.
Anywhere from 30 to 70 percent of oil,and 10 to 20 percent of natural gas, is notrecovered in field development. It is esti-mated that enhanced oil recovery projects,including development of new recoverytechniques, could add about 60 billion bar-rels of oil nationwide through increased useof existing fields (Figure 5-3).
Public Lands LeasingThe federal government owns about
31 percent of the nation’s land, so it canhave a major role in increasing energy pro-duction in appropriate places. A large por-tion of U.S. energy resources are containedin these federal lands and offshore areas.Public lands provide nearly 30 percent of
and harsh environments).While the resource base that supplies
today’s natural gas is vast, U.S. conven-tional production is projected to peak asearly as 2015. Increasingly, the nation willhave to rely on natural gas from unconven-tional resources, such as tight sands, deepformations, deep water, and gas hydrates.Also, many resources are in environmen-tally sensitive areas that require use of lessintrusive technologies.
New technologies are being devel-oped to reduce both the environmental ef-fects and the economic costs of explora-tion for oil and gas. These exciting newtechnologies, like horizontal drilling andthree-dimensional seismic technology al-low for much greater precision and signifi-cantly less impact on the environment (Fig-ure 5-2).
Small independent businesses ac-count for 50 and 65 percent, respectively, ofdomestic petroleum and natural gas productionin the lower 48 states. However, even whennew technology is available, independent pro-ducers can lack the investment capital neededto apply the technology and be unable to copewith the increased economic and technicalrisks associated with harder-to-recover re-sources.
For example, most new gas wells drilledin the United States will require hydraulic frac-turing. This is a common procedure used byproducers to complete gas wells by stimulatingthe well’s ability to flow increased volumes ofgas from the reservoir rock into the wellbore.During a fracture procedure, fluid and a prop-ping agent (usually sand) are pumped into thereservoir rock, widening natural fractures toprovide paths for the gas to migrate to thewellbore. In certain formations, it has beendemonstrated that the gas flow rate may be in-creased as much as twenty-fold by hydraulicfracturing. Each year nearly 25,000 oil and gaswells are hydraulically fractured.
The use of hydraulic fracturing in naturalgas production from coal seams is one of thefastest-growing sources of gas production. Thissource will most likely face added controls, andcosts to ensure that disposal (by re-injection ordischarge) of production waters is done in anenvironmentally sensitive manner.
5-6
Figure 5-3Major U.S. Oil and Gas Fields
The United States is the most mature oil-producing region inthe world, and much of our easy-to-find resource base hasbeen delpeted. Advanced exploration and production technolo-gies of the past two decades have played a key role in recover-ing additional oil and natural gas from existing fields.________Source: U.S. Department of Energy, Energy Information Administration.
Small independent busi-nesses account for 50and 65 percent, respec-tively, of domestic pe-troleum and natural gasproduction in the lower48 states.
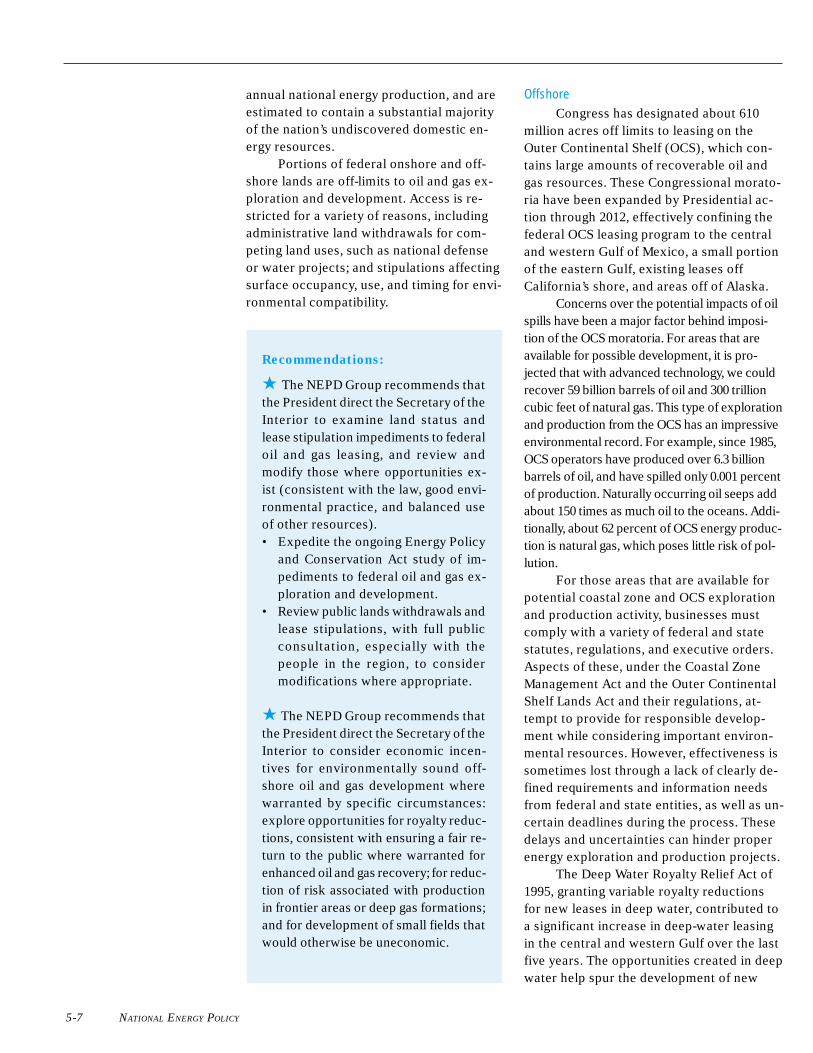
NATIONAL ENERGY POLICY
annual national energy production, and areestimated to contain a substantial majorityof the nation’s undiscovered domestic en-ergy resources.
Portions of federal onshore and off-shore lands are off-limits to oil and gas ex-ploration and development. Access is re-stricted for a variety of reasons, includingadministrative land withdrawals for com-peting land uses, such as national defenseor water projects; and stipulations affectingsurface occupancy, use, and timing for envi-ronmental compatibility.
Recommendations:
★ The NEPD Group recommends thatthe President direct the Secretary of theInterior to examine land status andlease stipulation impediments to federaloil and gas leasing, and review andmodify those where opportunities ex-ist (consistent with the law, good envi-ronmental practice, and balanced useof other resources).• Expedite the ongoing Energy Policy
and Conservation Act study of im-pediments to federal oil and gas ex-ploration and development.
• Review public lands withdrawals andlease stipulations, with full publicconsultation, especially with thepeople in the region, to considermodifications where appropriate.
★ The NEPD Group recommends thatthe President direct the Secretary of theInterior to consider economic incen-tives for environmentally sound off-shore oil and gas development wherewarranted by specific circumstances:explore opportunities for royalty reduc-tions, consistent with ensuring a fair re-turn to the public where warranted forenhanced oil and gas recovery; for reduc-tion of risk associated with productionin frontier areas or deep gas formations;and for development of small fields thatwould otherwise be uneconomic.
OffshoreCongress has designated about 610
million acres off limits to leasing on theOuter Continental Shelf (OCS), which con-tains large amounts of recoverable oil andgas resources. These Congressional morato-ria have been expanded by Presidential ac-tion through 2012, effectively confining thefederal OCS leasing program to the centraland western Gulf of Mexico, a small portionof the eastern Gulf, existing leases offCalifornia’s shore, and areas off of Alaska.
Concerns over the potential impacts of oilspills have been a major factor behind imposi-tion of the OCS moratoria. For areas that areavailable for possible development, it is pro-jected that with advanced technology, we couldrecover 59 billion barrels of oil and 300 trillioncubic feet of natural gas. This type of explorationand production from the OCS has an impressiveenvironmental record. For example, since 1985,OCS operators have produced over 6.3 billionbarrels of oil, and have spilled only 0.001 percentof production. Naturally occurring oil seeps addabout 150 times as much oil to the oceans. Addi-tionally, about 62 percent of OCS energy produc-tion is natural gas, which poses little risk of pol-lution.
For those areas that are available forpotential coastal zone and OCS explorationand production activity, businesses mustcomply with a variety of federal and statestatutes, regulations, and executive orders.Aspects of these, under the Coastal ZoneManagement Act and the Outer ContinentalShelf Lands Act and their regulations, at-tempt to provide for responsible develop-ment while considering important environ-mental resources. However, effectiveness issometimes lost through a lack of clearly de-fined requirements and information needsfrom federal and state entities, as well as un-certain deadlines during the process. Thesedelays and uncertainties can hinder properenergy exploration and production projects.
The Deep Water Royalty Relief Act of1995, granting variable royalty reductionsfor new leases in deep water, contributed toa significant increase in deep-water leasingin the central and western Gulf over the lastfive years. The opportunities created in deepwater help spur the development of new
5-7
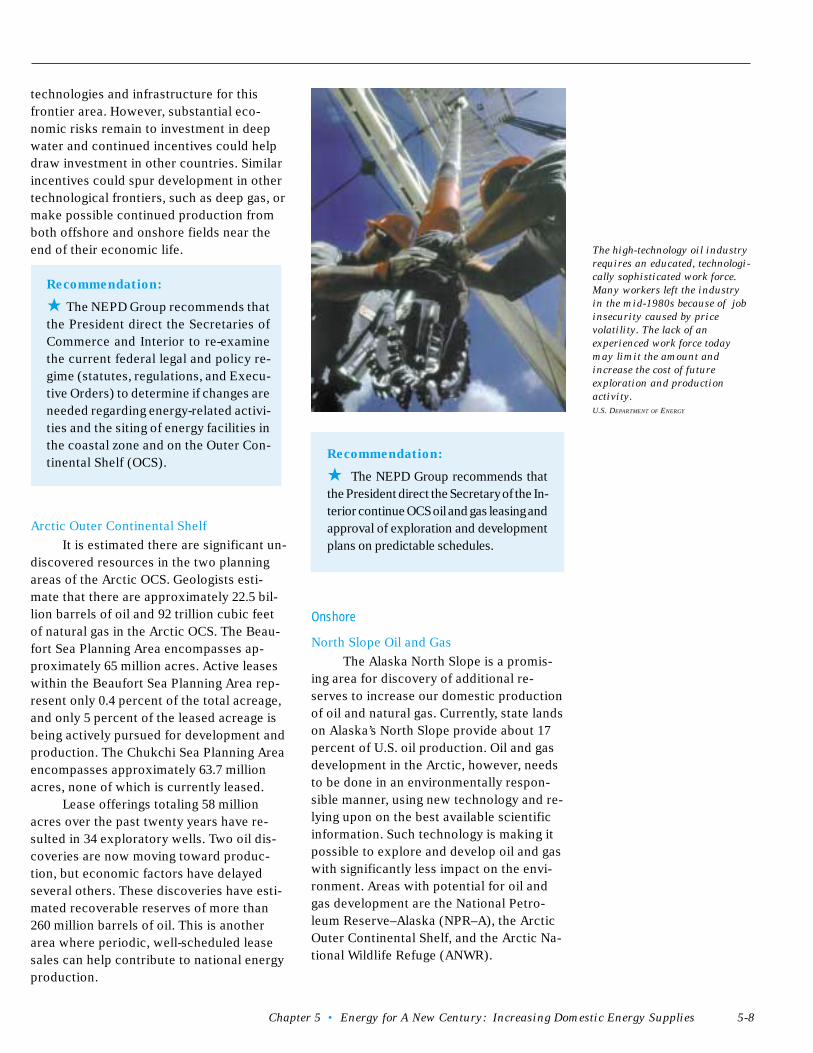
Chapter 5 • Energy for A New Century: Increasing Domestic Energy Supplies
Recommendation:
★ The NEPD Group recommends thatthe President direct the Secretary of the In-terior continue OCS oil and gas leasing andapproval of exploration and developmentplans on predictable schedules.
Onshore
North Slope Oil and Gas
The Alaska North Slope is a promis-ing area for discovery of additional re-serves to increase our domestic productionof oil and natural gas. Currently, state landson Alaska’s North Slope provide about 17percent of U.S. oil production. Oil and gasdevelopment in the Arctic, however, needsto be done in an environmentally respon-sible manner, using new technology and re-lying upon on the best available scientificinformation. Such technology is making itpossible to explore and develop oil and gaswith significantly less impact on the envi-ronment. Areas with potential for oil andgas development are the National Petro-leum Reserve–Alaska (NPR–A), the ArcticOuter Continental Shelf, and the Arctic Na-tional Wildlife Refuge (ANWR).
technologies and infrastructure for thisfrontier area. However, substantial eco-nomic risks remain to investment in deepwater and continued incentives could helpdraw investment in other countries. Similarincentives could spur development in othertechnological frontiers, such as deep gas, ormake possible continued production fromboth offshore and onshore fields near theend of their economic life.
Recommendation:
★ The NEPD Group recommends thatthe President direct the Secretaries ofCommerce and Interior to re-examinethe current federal legal and policy re-gime (statutes, regulations, and Execu-tive Orders) to determine if changes areneeded regarding energy-related activi-ties and the siting of energy facilities inthe coastal zone and on the Outer Con-tinental Shelf (OCS).
Arctic Outer Continental Shelf
It is estimated there are significant un-discovered resources in the two planningareas of the Arctic OCS. Geologists esti-mate that there are approximately 22.5 bil-lion barrels of oil and 92 trillion cubic feetof natural gas in the Arctic OCS. The Beau-fort Sea Planning Area encompasses ap-proximately 65 million acres. Active leaseswithin the Beaufort Sea Planning Area rep-resent only 0.4 percent of the total acreage,and only 5 percent of the leased acreage isbeing actively pursued for development andproduction. The Chukchi Sea Planning Areaencompasses approximately 63.7 millionacres, none of which is currently leased.
Lease offerings totaling 58 millionacres over the past twenty years have re-sulted in 34 exploratory wells. Two oil dis-coveries are now moving toward produc-tion, but economic factors have delayedseveral others. These discoveries have esti-mated recoverable reserves of more than260 million barrels of oil. This is anotherarea where periodic, well-scheduled leasesales can help contribute to national energyproduction.
The high-technology oil industry
requires an educated, technologi-
cally sophisticated work force.
Many workers left the industry
in the mid-1980s because of job
insecurity caused by price
volatility. The lack of an
experienced work force today
may limit the amount and
increase the cost of future
exploration and production
activity.
U.S. DEPARTMENT OF ENERGY
5-8
NATIONAL ENERGY POLICY
National Petroleum Reserve–Alaska
The National Petroleum Reserve–Alaska lies between the Brooks Range andthe Arctic Ocean. The U.S. Geological Sur-vey (USGS) estimates a high potential foroil and gas resources in the NPR–A, with amean estimate of 2.1 billion barrels of oiland 8.5 trillion cubic feet of gas. A leasingprogram was designed and initiated in 1999for the northeast sector of NPR–A, resultingin the award of 133 leases covering 900,000acres. Eight exploratory wells have beencompleted in the past two years, and addi-tional exploratory wells are expected thiscoming winter.
Recommendation:
★ The NEPD Group recommends thatthe President direct the Secretary of theInterior to consider additional environ-mentally responsible oil and gas devel-opment, based on sound science and thebest available technology, through fur-ther lease sales in the National Petro-leum Reserve-Alaska. Such consider-ation should include areas not currentlyleased within the Northeast corner ofthe Reserve.
Arctic National Wildlife Refuge
The Alaska National Interest LandsConservation Act expanded ANWR from 9million acres to 19 million acres, and desig-nated 8 million acres as wilderness. Con-gress specifically left open the question ofmanagement of a 1.5-million-acre ArcticCoastal Plain area of ANWR because of thelikelihood that it contains significant oil andgas resources. Section 1002 of the Act di-rected the Department of the Interior toconduct geological and biological studies ofthe Arctic Coastal Plain, “the 1002 Area,”and to provide to Congress the results ofthose studies with recommendations on fu-ture management of the area. Section 1003of the Act prohibits leasing of the 1002 Areauntil authorized by an act of Congress.
In 1987, after more than five years ofbiological baseline studies, surface geologi-cal studies, and two seasons of seismic ex-
ploration surveys, the Department of the In-terior recommended to Congress that the1002 Area be leased for oil and gas explora-tion and production in an environmentallysensitive manner. In 1995, both the Senateand the House passed legislation containinga provision to authorize leasing in the 1002Area, but the legislation was vetoed.
In May 1998, the USGS issued revisedestimates of oil and gas resources in the1002 Area. The 1998 USGS assessmentshows an overall increase in estimated oilresources when compared to all previousgovernment estimates. The estimate reaf-firms the 1002 Area’s potential as the singlemost promising prospect in the UnitedStates. The total quantity of recoverable oilwithin the entire assessment area is esti-mated to be between 5.7 and 16 billion bar-rels (95 percent and 5 percent probabilityrange) with a mean value of 10.4 billion bar-rels. The mean estimate of 10.4 billion bar-rels is just below the amount produced todate from North America’s largest field,Prudhoe Bay, since production began 23years ago. Peak production from ANWRcould to be between 1 and 1.3 million bar-rels a day and account for more than 20 per-cent of all U.S. oil production. ANWR pro-duction could equal 46 years of current oilimports from Iraq.
Technological improvements over thepast 40 years have dramatically reducedindustry’s footprint on the tundra, mini-mized waste produced, and protected theland for resident and migratory wildlife.These advances include the use of ice roadsand drilling pads, low-impact explorationapproaches such as winter-only explorationactivities, and extended reach and through-tubing rotary drilling. These technologieshave significantly reduced the size of pro-duction-related facilities on the NorthSlope. Estimates indicate that no more than2,000 acres will be disturbed if the 1002Area of ANWR is developed. For purposesof comparison, ANWR is about the size ofthe state of South Carolina, whereas the de-veloped area is estimated to be less thanone-fifth the size of Washington D.C.’sDulles International Airport.
5-9
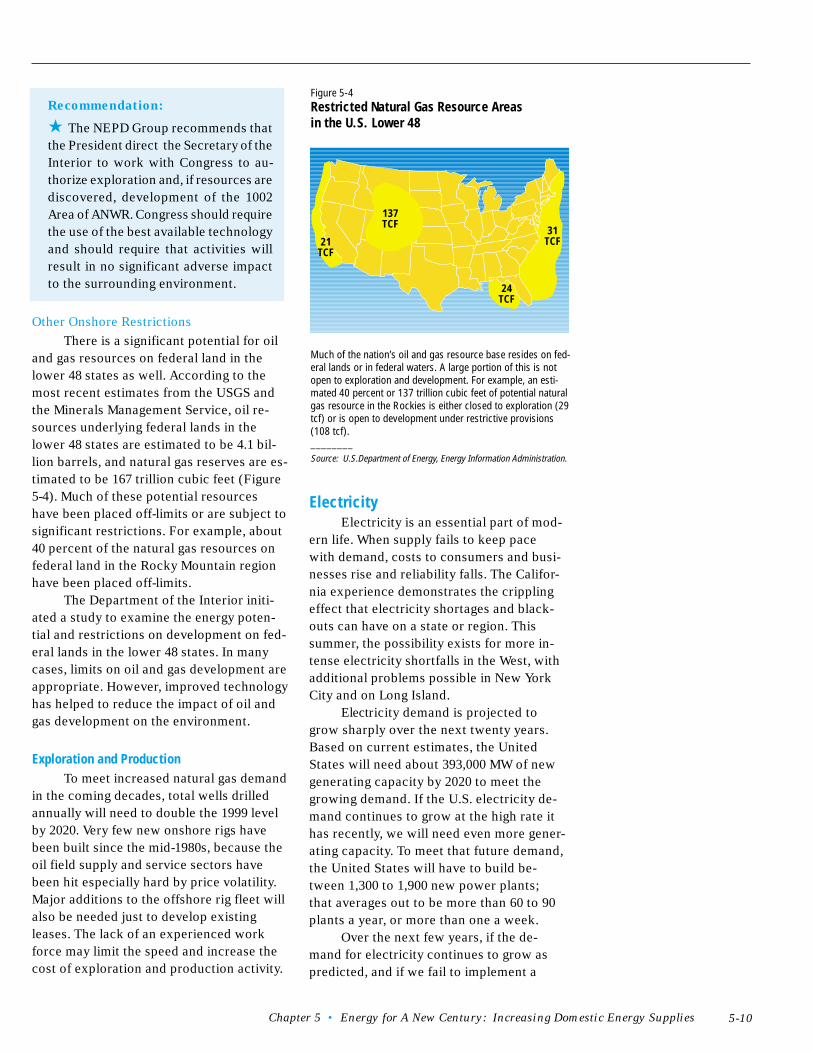
Chapter 5 • Energy for A New Century: Increasing Domestic Energy Supplies
Recommendation:
★ The NEPD Group recommends thatthe President direct the Secretary of theInterior to work with Congress to au-thorize exploration and, if resources arediscovered, development of the 1002Area of ANWR. Congress should requirethe use of the best available technologyand should require that activities willresult in no significant adverse impactto the surrounding environment.
Other Onshore Restrictions
There is a significant potential for oiland gas resources on federal land in thelower 48 states as well. According to themost recent estimates from the USGS andthe Minerals Management Service, oil re-sources underlying federal lands in thelower 48 states are estimated to be 4.1 bil-lion barrels, and natural gas reserves are es-timated to be 167 trillion cubic feet (Figure5-4). Much of these potential resourceshave been placed off-limits or are subject tosignificant restrictions. For example, about40 percent of the natural gas resources onfederal land in the Rocky Mountain regionhave been placed off-limits.
The Department of the Interior initi-ated a study to examine the energy poten-tial and restrictions on development on fed-eral lands in the lower 48 states. In manycases, limits on oil and gas development areappropriate. However, improved technologyhas helped to reduce the impact of oil andgas development on the environment.
Exploration and ProductionTo meet increased natural gas demand
in the coming decades, total wells drilledannually will need to double the 1999 levelby 2020. Very few new onshore rigs havebeen built since the mid-1980s, because theoil field supply and service sectors havebeen hit especially hard by price volatility.Major additions to the offshore rig fleet willalso be needed just to develop existingleases. The lack of an experienced workforce may limit the speed and increase thecost of exploration and production activity.
ElectricityElectricity is an essential part of mod-
ern life. When supply fails to keep pacewith demand, costs to consumers and busi-nesses rise and reliability falls. The Califor-nia experience demonstrates the cripplingeffect that electricity shortages and black-outs can have on a state or region. Thissummer, the possibility exists for more in-tense electricity shortfalls in the West, withadditional problems possible in New YorkCity and on Long Island.
Electricity demand is projected togrow sharply over the next twenty years.Based on current estimates, the UnitedStates will need about 393,000 MW of newgenerating capacity by 2020 to meet thegrowing demand. If the U.S. electricity de-mand continues to grow at the high rate ithas recently, we will need even more gener-ating capacity. To meet that future demand,the United States will have to build be-tween 1,300 to 1,900 new power plants;that averages out to be more than 60 to 90plants a year, or more than one a week.
Over the next few years, if the de-mand for electricity continues to grow aspredicted, and if we fail to implement a
Figure 5-4Restricted Natural Gas Resource Areasin the U.S. Lower 48
Much of the nation’s oil and gas resource base resides on fed-eral lands or in federal waters. A large portion of this is notopen to exploration and development. For example, an esti-mated 40 percent or 137 trillion cubic feet of potential naturalgas resource in the Rockies is either closed to exploration (29tcf) or is open to development under restrictive provisions(108 tcf).________Source: U.S.Department of Energy, Energy Information Administration.
21TCF
31TCF
24TCF
137TCF
5-10

NATIONAL ENERGY POLICY
comprehensive energy plan that recognizesthe need to increase capacity, we can ex-pect our electricity shortage problems togrow. The result will be higher costs andlower reliability.
Electricity Restructuring
One of the most important energy is-sues facing the Administration and Con-gress is electricity restructuring. The elec-tricity industry is going through a period ofdramatic change. To provide ample electric-ity supplies at reasonable prices, states areopening their retail markets to competition.This is the most recent step in a long transi-tion from reliance on regulation to relianceon competitive forces.
Changes in Wholesale Electricity MarketThis transition from regulation to
competition began in 1978 with enactmentof the Public Utility Regulatory PoliciesAct, which promoted independent electric-ity generation. Open-access transmissionpolicies adopted by the Federal EnergyRegulatory Commission (FERC) in the late1980s further promoted competition inwholesale power markets. Congress largelyratified these policies with enactment of
Electricity demand is projected
to rise sharply over the next
twenty years. If we fail to build
the 1,300–1,900 new power
plants needed to increase
generation and transmission
capacity, current electricity
shortages will become more
frequent and more widespread.
U.S. DEPARTMENT OF ENERGY
the Energy Policy Act of 1992, which furtherpromoted non-utility generation. FERC tookanother large step to promote competition withits open-access rule in 1996, which providedgreater access to the transmission grid, the high-way for interstate commerce in electricity.
Changes in the Retail Electricity MarketIncreased competition in wholesale
power markets encourages states to openretail electricity markets. Under current law,FERC has jurisdiction over the wholesalepower market, while states have jurisdictionover retail markets. Beginning in 1996,states began opening their retail markets tocompetition in order to lower electricityprices. Twenty-five states have opted toopen their retail electricity markets to com-petition.
Most new electricity generation is be-ing built not by regulated utilities, but by in-dependent power producers. These compa-nies assume the financial risk of investmentin new generation, and their success rideson their ability to generate electricity at alow cost.
These dramatic changes affecting theindustry led to important structuralchanges. Independent power producers,which were once infant industries, nowdwarf many utilities. Utility mergers, whichwere once rare, are now commonplace. U.S.utilities have been purchased by foreigncompanies, and U.S. utilities have in turnpurchased utilities abroad. While utilitieshad service areas that were limited to asingle state or region, independent powerproducers are international companies thatcan build power plants across the globe.Many utilities that were once vertically inte-grated divested themselves of generation,either voluntarily or because of state law.
Pending Congressional ActionSince 1995, Congress has been grap-
pling with electricity competition legislation.Initial efforts sought to require states to opentheir retail markets by a date certain. Subse-quent efforts focused on promoting competi-tion in electricity markets and complement-ing state retail competition plans. Under this
5-11
Chapter 5 • Energy for A New Century: Increasing Domestic Energy Supplies
approach, federal legislation focused on corefederal issues, including:• regulation of interstate commerce;• assuring open access to the interstate andinternational transmission system;• enhancing reliability of the grid;• lowering barriers to entry;• reforming outdated federal electricitylaws, such as the Public Utility HoldingCompany Act and Public Utility RegulatoryPolicies Act of 1978;• reforming the role of federal electric utili-ties in competitive markets;• protecting consumers; and• clarifying federal and state regulatory ju-risdictions.
Recommendations:
★ The NEPD Group recommends thatthe President direct the Secretary ofEnergy to propose comprehensive elec-tricity legislation that promotes compe-tition, protects consumers, enhancesreliability, improves efficiency, pro-motes renewable energy, repeals thePublic Utility Holding Company Act,and reforms the Public Utility Regula-tory Policies Act.
★ The NEPD Group recommends thePresident encourage FERC to use its ex-isting statutory authority to promotecompetition and encourage investmentin transmission facilities.
California Electricity Crisis
The California electricity crisis is not atest of the merits of competition in electric-ity markets. Instead, it demonstrates that apoorly designed state retail competitionplan can have disastrous results if electric-ity supply does not keep pace with in-creased demand. At heart, the Californiaelectricity crisis is a supply crisis. Californiaallowed demand to outstrip supply, and didlittle to lower barriers to entry through re-form of an inflexible siting process. The riskthat the California experience will repeat it-self is low, since other states have not mod-eled their retail competition plans onCalifornia’s plan.
The California crisis also shows thatstate electricity markets do not stay neatlyconfined within legal and jurisdictionalbounds. Due to regional interconnection,disastrous mistakes made by the State ofCalifornia have dire effects on the entireWest. California’s failure to reform flawedregulatory rules affecting the market droveup wholesale prices. Actions such as forc-ing utilities to purchase all their powerthrough volatile spot markets, imposing asingle-price auction system, and barring bi-lateral contracts all contributed to theproblems that California now faces.
Lessons Learned from Successful Deregulation
As stated previously, 25 states havedecided to open their retail electricity mar-kets. A comparison of the different ap-proaches taken by California and otherstates demonstrates that competition willbenefit consumers if implemented effec-tively. A better gauge of the potential forretail competition to lower prices can befound in Pennsylvania, where electricityprices have fallen significantly as a resultof competition. There is also reason to be-lieve that the plan in Texas will have simi-lar success.
A major difference between the Cali-fornia experience and the approachestaken by Pennsylvania and Texas is thatthe latter states ensured they had adequateelectricity supplies. Pennsylvania andTexas took steps to ensure that proceduresfor adding new power plants were effi-cient. Unlike California, which imports 25percent of its electricity, Pennsylvania is anet exporter of power, and Texas importsalmost no power from other states. Forthese reasons, Pennsylvania and Texashave ample electricity supply to meet de-mand, while California is confronting a se-rious supply shortage.
In addition, California required itsutilities to divest themselves of much oftheir generation, unlike Pennsylvania andTexas. This action forced California utili-ties to rely much more heavily on buyingpower, at ever-increasing prices, instead ofgenerating power themselves.
5-12
NATIONAL ENERGY POLICY
Another major difference is that Penn-sylvania and Texas did not require theirutilities to purchase electricity throughvolatile spot markets. This requirement,combined with frozen retail rates imposedby the State, forced California utilities topurchase power at much higher costs thancould be passed along to the consumer. Asa result, the California regulatory plan re-sulted in unreliable service, destroyed thefinancial health of the State’s utilities, anddrove one utility into bankruptcy.
The federal government does not sitepower plants; that is a responsibility of thestates. For that reason, delays relating tothe construction of new power plants areusually the result of state action. A numberof federal agencies, such as the Environ-mental Protection Agency, the Departmentof Commerce, and the Department of theInterior, do issue air and other permits forgeneration facilities. Some of the concernsabout permitting or review delays in otherstates can be similarly addressed by expe-diting processes. These agencies, pursuantto President Bush’s Executive Order, haveexpedited permit-processing applicationsfor energy production in California.
Some of the concerns about permit-ting or review delays in other states can besimilarly addressed by expeditingprocesses.For example, in 1999–2000, thetime for issuing air permits (including thetime for public participation) for turbineswas reduced to three to four months (com-pared to the twelve months allowed by theregulations) for the majority of permit ap-plications.
Fuels for Electricity GenerationElectricity is not a primary source of
energy. It is generated by the use of primaryenergy sources (Figure 5-5). Coal, nuclearenergy, natural gas and hydropower accountfor about 95 percent of total electricity gen-eration, with oil and renewable energy con-tributing the remainder. Despite this healthydiversity of energy sources, each type ofelectricity resource is faced with constraintsto maintaining or expanding its contributionto electricity production.
CoalCoal is used almost exclusively to gen-
erate electricity. Coal power plants accountfor over 50 percent of all U.S. electricity gen-eration, and over 80 percent of generation intwelve states in the Midwest, Southeast, andWest. Coal electricity generation costs arelow, and coal prices have proved remark-ably stable. In 1999, the United States pro-duced 1.1 billion tons of coal. Production ofcoal from federal and tribal lands, which hasincreased substantially in the past decade,accounted for 38 percent of this total.
Although coal is the nation’s mostabundant fossil energy source, productionand market issues can affect the adequacyof supply. Production issues include the pro-tection of public health, safety, property, andthe environment, and the effectiveness offederal and state agencies implementingvarious laws governing coal mining. Theseissues have resulted in some coal resourcesbecoming uneconomical to produce. Statu-tory, regulatory, and administrative difficul-ties also may limit or prevent the productionof some coal resources. However, techno-logical advances in cleaner coal technologyhave allowed for significant progress towardreducing these barriers. There are also op-portunities to protect the environment whilelowering costs through further improve-ments in technology.
Over the past decade, greater efficien-cies, lower capital costs, fewer emissionsand quicker start-up times have made powerplants fueled by natural gas a more attrac-tive choice for new coal generation. Re-cently, however, rising natural gas priceshave renewed interest in building coalpower plants.
Uncertainty about future environmen-tal controls is of particular concern for com-panies that operate existing coal powerplants. Regulations under development in-clude a variety of measures requiring reduc-tions in emissions of nitrogen oxide, sulfurdioxide, and mercury. In addition, rules re-lated to discharges to streams and cooling-water intake structures, possible regulationof large-volume wastes as hazardous wastes,
5-13
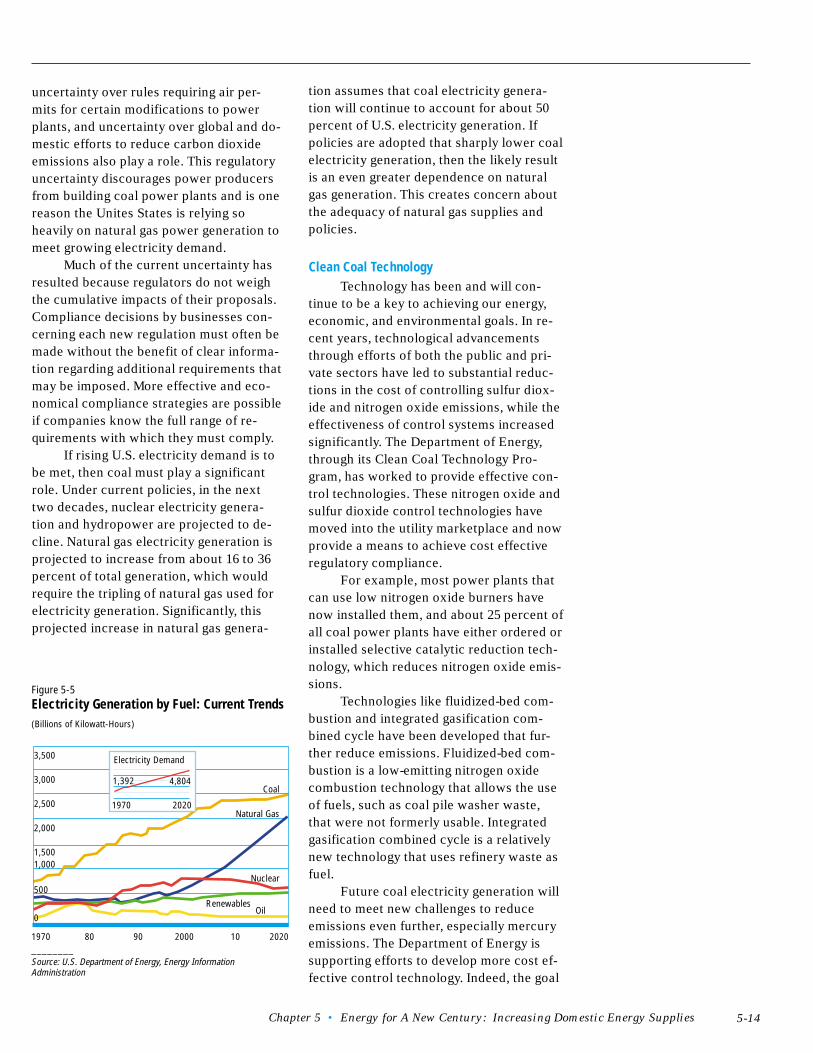
Chapter 5 • Energy for A New Century: Increasing Domestic Energy Supplies
uncertainty over rules requiring air per-mits for certain modifications to powerplants, and uncertainty over global and do-mestic efforts to reduce carbon dioxideemissions also play a role. This regulatoryuncertainty discourages power producersfrom building coal power plants and is onereason the Unites States is relying soheavily on natural gas power generation tomeet growing electricity demand.
Much of the current uncertainty hasresulted because regulators do not weighthe cumulative impacts of their proposals.Compliance decisions by businesses con-cerning each new regulation must often bemade without the benefit of clear informa-tion regarding additional requirements thatmay be imposed. More effective and eco-nomical compliance strategies are possibleif companies know the full range of re-quirements with which they must comply.
If rising U.S. electricity demand is tobe met, then coal must play a significantrole. Under current policies, in the nexttwo decades, nuclear electricity genera-tion and hydropower are projected to de-cline. Natural gas electricity generation isprojected to increase from about 16 to 36percent of total generation, which wouldrequire the tripling of natural gas used forelectricity generation. Significantly, thisprojected increase in natural gas genera-
Figure 5-5Electricity Generation by Fuel: Current Trends(Billions of Kilowatt-Hours)
3,500
3,000
2,500
2,000
1,5001,000
500
0
1970 80 90 2000 10 2020
Oil
Coal
Natural Gas
Nuclear
Renewables
Electricity Demand
1970 2020
1,392 4,804
tion assumes that coal electricity genera-tion will continue to account for about 50percent of U.S. electricity generation. Ifpolicies are adopted that sharply lower coalelectricity generation, then the likely resultis an even greater dependence on naturalgas generation. This creates concern aboutthe adequacy of natural gas supplies andpolicies.
Clean Coal TechnologyTechnology has been and will con-
tinue to be a key to achieving our energy,economic, and environmental goals. In re-cent years, technological advancementsthrough efforts of both the public and pri-vate sectors have led to substantial reduc-tions in the cost of controlling sulfur diox-ide and nitrogen oxide emissions, while theeffectiveness of control systems increasedsignificantly. The Department of Energy,through its Clean Coal Technology Pro-gram, has worked to provide effective con-trol technologies. These nitrogen oxide andsulfur dioxide control technologies havemoved into the utility marketplace and nowprovide a means to achieve cost effectiveregulatory compliance.
For example, most power plants thatcan use low nitrogen oxide burners havenow installed them, and about 25 percent ofall coal power plants have either ordered orinstalled selective catalytic reduction tech-nology, which reduces nitrogen oxide emis-sions.
Technologies like fluidized-bed com-bustion and integrated gasification com-bined cycle have been developed that fur-ther reduce emissions. Fluidized-bed com-bustion is a low-emitting nitrogen oxidecombustion technology that allows the useof fuels, such as coal pile washer waste,that were not formerly usable. Integratedgasification combined cycle is a relativelynew technology that uses refinery waste asfuel.
Future coal electricity generation willneed to meet new challenges to reduceemissions even further, especially mercuryemissions. The Department of Energy issupporting efforts to develop more cost ef-fective control technology. Indeed, the goal
5-14
________Source: U.S. Department of Energy, Energy InformationAdministration
NATIONAL ENERGY POLICY
about the safety of nuclear energy after theaccident often resulted in active oppositionto proposed plants. As a result, the lastcompleted nuclear energy plant in theUnited States was ordered in 1973.
Since the 1980s, the performance ofnuclear energy plant operations has sub-stantially improved. While U.S. nuclear en-ergy plants once generated electricity onlyaround 70 percent of the time, the averageplant today is generating electricity close to90 percent. This improved performance haslowered the cost of nuclear generation,which is now competitive with othersources of electricity (Figure 5-6).
There is potential for even greatergeneration from existing nuclear energyplants. Experts estimate that 2,000 MWcould be added from existing nuclear powerplants by increasing operating performanceto 92 percent. In addition, about 12,000 MWof additional nuclear electricity generationcould be derived from uprating U.S. nuclearpower plants, a process that uses new tech-nologies and methods to increase ratedpower levels without decreasing safety.However, modifications to uprate plantscan be expensive and require extensive li-censing review and approval by the NuclearRegulatory Commission (NRC). Anotherway to increase nuclear generation from ex-isting plants is through license renewal.Many nuclear utilities are planning to ex-tend the operating license of existingnuclear plants by twenty years, and the li-censes of as many as 90 percent of the cur-rently operating nuclear plants may be re-newed.
The nuclear energy industry is closelyregulated by the NRC, which provides rigor-ous oversight of the operation and mainte-nance of these plants. This oversight in-cludes a comprehensive inspection programthat focuses on the most significant poten-tial risks of plant operations and featuresfull-time resident inspectors at each plant,as well as regional inspectors with special-ized expertise. The NRC has made greatstrides to provide greater regulatory cer-tainty while maintaining high safety stan-dards.
of these research, development, and dem-onstration programs is to develop and dem-onstrate coal power systems with near zeroenvironmental emissions, while maintain-ing low production costs.
Recommendations:
★ The NEPD Group recognizes theimportance of looking to technology tohelp us meet the goals of increasingelectricity generation while protectingour environment. To that end, theNEPD Group recommends that thePresident direct the Department of En-ergy to continue to develop advancedclean coal technology by:• Investing $2 billion over 10 years to
fund research in clean coal technolo-gies.
• Supporting a permanent extensionof the existing R&D tax credit.
• Directing agencies to explore regu-latory approaches that will encour-age advancements in environmentaltechnology.
★ The NEPD Group recommends thatthe President direct federal agencies toprovide greater regulatory certainty re-lating to coal electricity generationthrough clear policies that are easilyapplied to business decisions.
Nuclear Energy
Nuclear energy accounts for 20 per-cent of all U.S. electricity generation, andmore than 40 percent of the electricity gen-eration in ten states in the Northeast, theSouth, and the Midwest. Despite the clo-sure of several less efficient plants duringthe 1990s, the 103 U.S. nuclear energyplants currently operating produce moreelectricity today than at any time in history.
There are a number of reasons whynuclear energy expansion halted in the1980s. Regulatory changes implemented af-ter the Three Mile Island incident in 1979lengthened the licensing period to an aver-age of fourteen years, resulting in largecost overruns. Increased public concern
Clean Coal Technology
Clean Coal Technologydescribes a category oftechnologies that allowfor the use of coal to gen-erate electricity whilemeeting environmentalregulations at low cost.
• In the short term,the goal of the programis to meet existing andemerging environmentalregulations, which willdramatically reduce com-pliance costs for con-trolled mercury, NOx,SO2, and fine particulateat new and existing coalpower plants.
• In the mid-term, thegoal of the program is todevelop low-cost, super-clean coal power plants,with efficiencies 50 per-cent higher than today’saverage. The higher effi-ciencies will reduceemissions at minimalcosts.
• In the long term, thegoal of the program is todevelop low-cost, zero-emission power plantswith efficiencies close todouble that of today’sfleet.
5-15
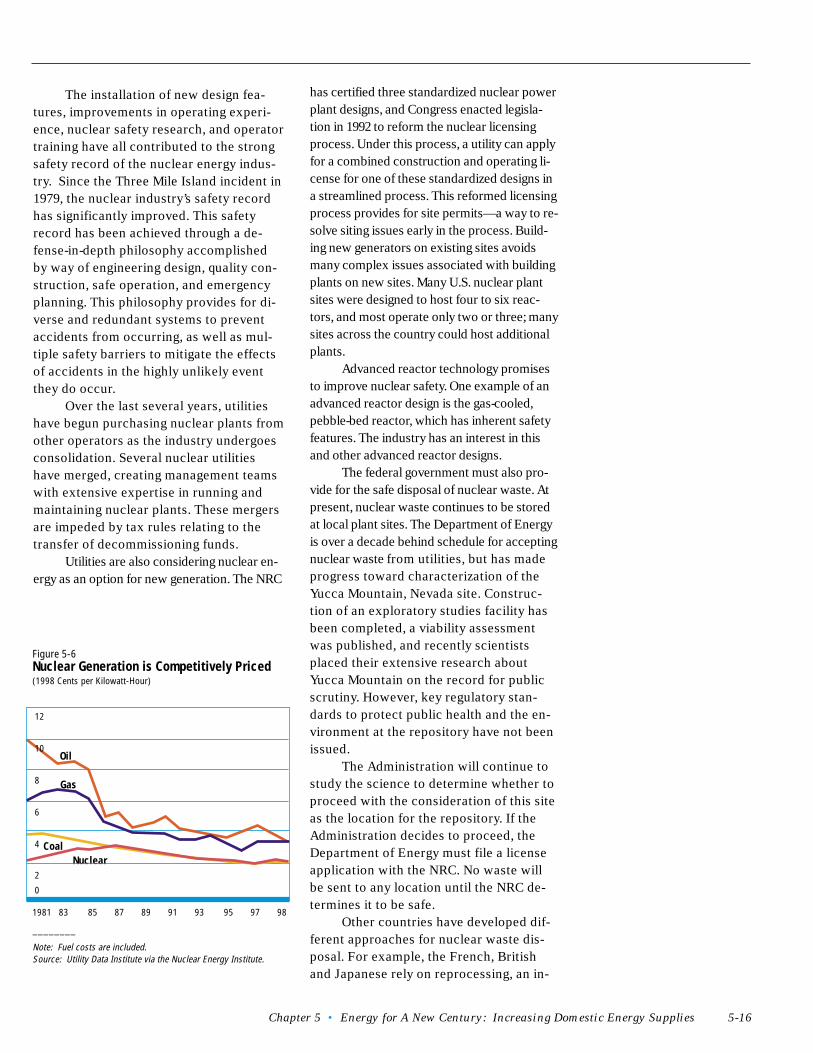
Chapter 5 • Energy for A New Century: Increasing Domestic Energy Supplies
________
Note: Fuel costs are included.Source: Utility Data Institute via the Nuclear Energy Institute.
Figure 5-6Nuclear Generation is Competitively Priced(1998 Cents per Kilowatt-Hour)
1981 83 85 87 89 91 93 95 97 98
Oil
Coal
Gas
Nuclear
The installation of new design fea-tures, improvements in operating experi-ence, nuclear safety research, and operatortraining have all contributed to the strongsafety record of the nuclear energy indus-try. Since the Three Mile Island incident in1979, the nuclear industry’s safety recordhas significantly improved. This safetyrecord has been achieved through a de-fense-in-depth philosophy accomplishedby way of engineering design, quality con-struction, safe operation, and emergencyplanning. This philosophy provides for di-verse and redundant systems to preventaccidents from occurring, as well as mul-tiple safety barriers to mitigate the effectsof accidents in the highly unlikely eventthey do occur.
Over the last several years, utilitieshave begun purchasing nuclear plants fromother operators as the industry undergoesconsolidation. Several nuclear utilitieshave merged, creating management teamswith extensive expertise in running andmaintaining nuclear plants. These mergersare impeded by tax rules relating to thetransfer of decommissioning funds.
Utilities are also considering nuclear en-ergy as an option for new generation. The NRC
has certified three standardized nuclear powerplant designs, and Congress enacted legisla-tion in 1992 to reform the nuclear licensingprocess. Under this process, a utility can applyfor a combined construction and operating li-cense for one of these standardized designs ina streamlined process. This reformed licensingprocess provides for site permits—a way to re-solve siting issues early in the process. Build-ing new generators on existing sites avoidsmany complex issues associated with buildingplants on new sites. Many U.S. nuclear plantsites were designed to host four to six reac-tors, and most operate only two or three; manysites across the country could host additionalplants.
Advanced reactor technology promisesto improve nuclear safety. One example of anadvanced reactor design is the gas-cooled,pebble-bed reactor, which has inherent safetyfeatures. The industry has an interest in thisand other advanced reactor designs.
The federal government must also pro-vide for the safe disposal of nuclear waste. Atpresent, nuclear waste continues to be storedat local plant sites. The Department of Energyis over a decade behind schedule for acceptingnuclear waste from utilities, but has madeprogress toward characterization of theYucca Mountain, Nevada site. Construc-tion of an exploratory studies facility hasbeen completed, a viability assessmentwas published, and recently scientistsplaced their extensive research aboutYucca Mountain on the record for publicscrutiny. However, key regulatory stan-dards to protect public health and the en-vironment at the repository have not beenissued.
The Administration will continue tostudy the science to determine whether toproceed with the consideration of this siteas the location for the repository. If theAdministration decides to proceed, theDepartment of Energy must file a licenseapplication with the NRC. No waste willbe sent to any location until the NRC de-termines it to be safe.
Other countries have developed dif-ferent approaches for nuclear waste dis-posal. For example, the French, Britishand Japanese rely on reprocessing, an in-
5-16
12
10
8
6
4
2
0
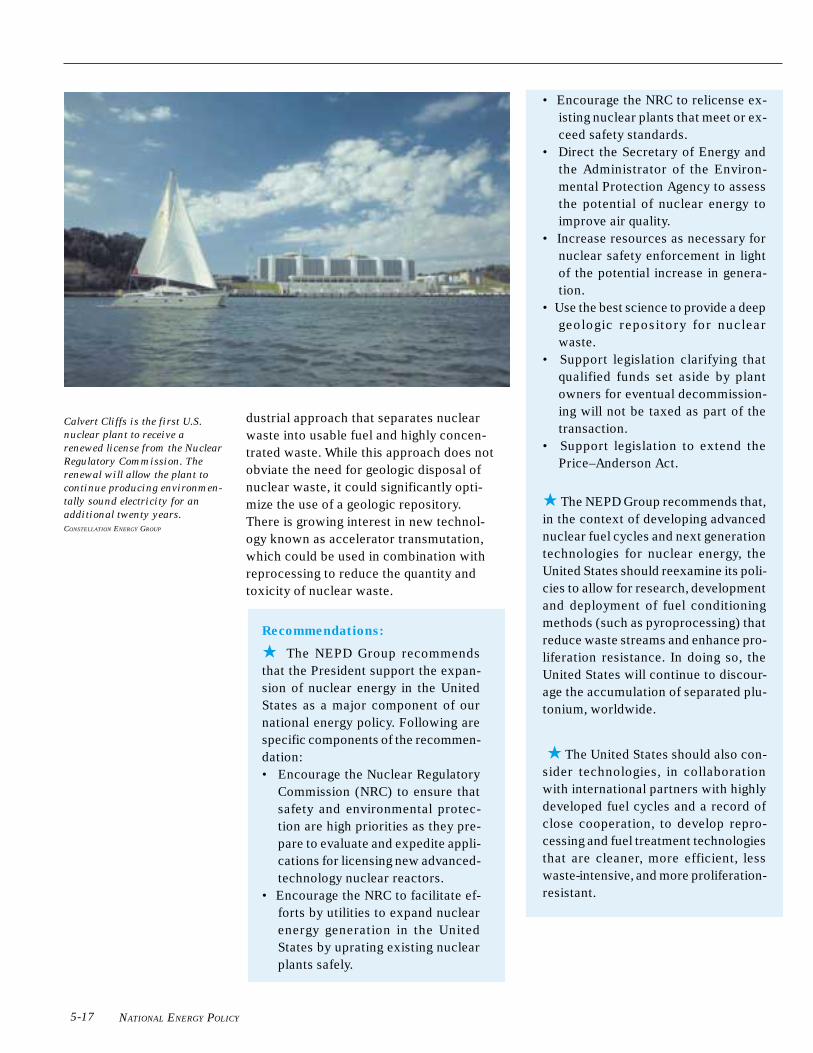
NATIONAL ENERGY POLICY
• Encourage the NRC to relicense ex-isting nuclear plants that meet or ex-ceed safety standards.
• Direct the Secretary of Energy andthe Administrator of the Environ-mental Protection Agency to assessthe potential of nuclear energy toimprove air quality.
• Increase resources as necessary fornuclear safety enforcement in lightof the potential increase in genera-tion.
• Use the best science to provide a deepgeologic repository for nuclearwaste.
• Support legislation clarifying thatqualified funds set aside by plantowners for eventual decommission-ing will not be taxed as part of thetransaction.
• Support legislation to extend thePrice–Anderson Act.
★ The NEPD Group recommends that,in the context of developing advancednuclear fuel cycles and next generationtechnologies for nuclear energy, theUnited States should reexamine its poli-cies to allow for research, developmentand deployment of fuel conditioningmethods (such as pyroprocessing) thatreduce waste streams and enhance pro-liferation resistance. In doing so, theUnited States will continue to discour-age the accumulation of separated plu-tonium, worldwide.
★ The United States should also con-sider technologies, in collaborationwith international partners with highlydeveloped fuel cycles and a record ofclose cooperation, to develop repro-cessing and fuel treatment technologiesthat are cleaner, more efficient, lesswaste-intensive, and more proliferation-resistant.
dustrial approach that separates nuclearwaste into usable fuel and highly concen-trated waste. While this approach does notobviate the need for geologic disposal ofnuclear waste, it could significantly opti-mize the use of a geologic repository.There is growing interest in new technol-ogy known as accelerator transmutation,which could be used in combination withreprocessing to reduce the quantity andtoxicity of nuclear waste.
Recommendations:
★ The NEPD Group recommendsthat the President support the expan-sion of nuclear energy in the UnitedStates as a major component of ournational energy policy. Following arespecific components of the recommen-dation:• Encourage the Nuclear Regulatory
Commission (NRC) to ensure thatsafety and environmental protec-tion are high priorities as they pre-pare to evaluate and expedite appli-cations for licensing new advanced-technology nuclear reactors.
• Encourage the NRC to facilitate ef-forts by utilities to expand nuclearenergy generation in the UnitedStates by uprating existing nuclearplants safely.
Calvert Cliffs is the first U.S.
nuclear plant to receive a
renewed license from the Nuclear
Regulatory Commission. The
renewal will allow the plant to
continue producing environmen-
tally sound electricity for an
additional twenty years.
CONSTELLATION ENERGY GROUP
5-17
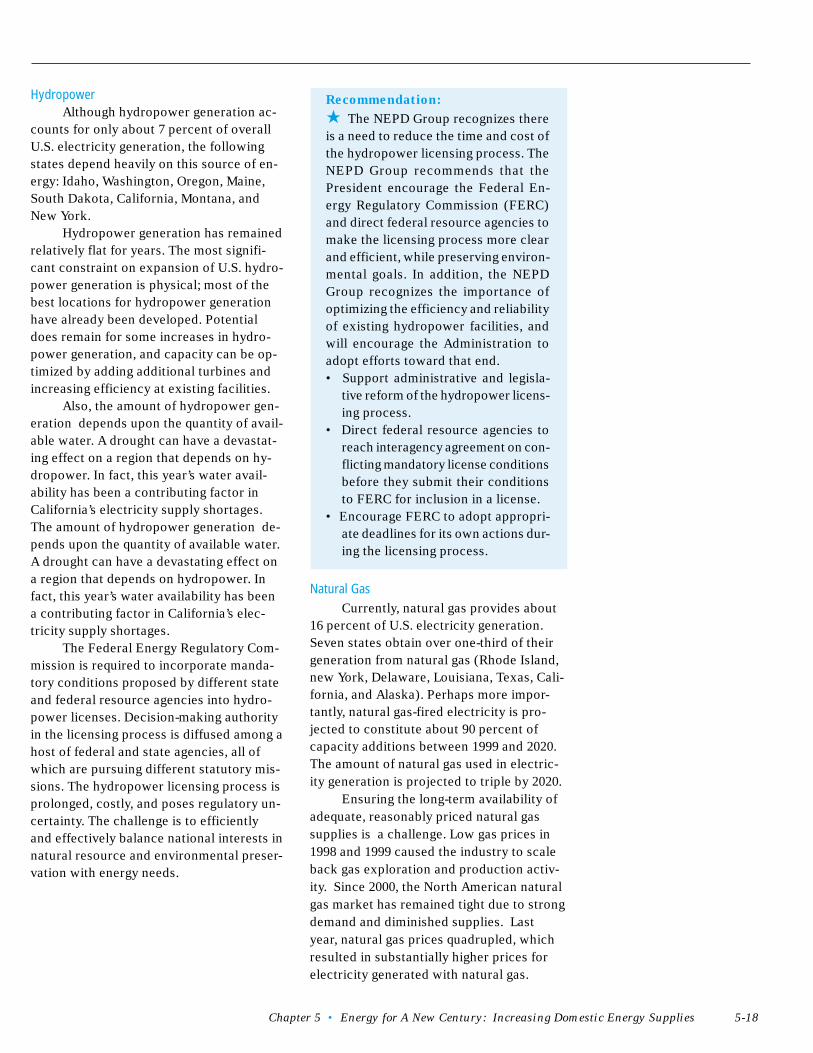
Chapter 5 • Energy for A New Century: Increasing Domestic Energy Supplies
Recommendation:
★ The NEPD Group recognizes thereis a need to reduce the time and cost ofthe hydropower licensing process. TheNEPD Group recommends that thePresident encourage the Federal En-ergy Regulatory Commission (FERC)and direct federal resource agencies tomake the licensing process more clearand efficient, while preserving environ-mental goals. In addition, the NEPDGroup recognizes the importance ofoptimizing the efficiency and reliabilityof existing hydropower facilities, andwill encourage the Administration toadopt efforts toward that end.• Support administrative and legisla-
tive reform of the hydropower licens-ing process.
• Direct federal resource agencies toreach interagency agreement on con-flicting mandatory license conditionsbefore they submit their conditionsto FERC for inclusion in a license.
• Encourage FERC to adopt appropri-ate deadlines for its own actions dur-ing the licensing process.
Natural GasCurrently, natural gas provides about
16 percent of U.S. electricity generation.Seven states obtain over one-third of theirgeneration from natural gas (Rhode Island,new York, Delaware, Louisiana, Texas, Cali-fornia, and Alaska). Perhaps more impor-tantly, natural gas-fired electricity is pro-jected to constitute about 90 percent ofcapacity additions between 1999 and 2020.The amount of natural gas used in electric-ity generation is projected to triple by 2020.
Ensuring the long-term availability ofadequate, reasonably priced natural gassupplies is a challenge. Low gas prices in1998 and 1999 caused the industry to scaleback gas exploration and production activ-ity. Since 2000, the North American naturalgas market has remained tight due to strongdemand and diminished supplies. Lastyear, natural gas prices quadrupled, whichresulted in substantially higher prices forelectricity generated with natural gas.
HydropowerAlthough hydropower generation ac-
counts for only about 7 percent of overallU.S. electricity generation, the followingstates depend heavily on this source of en-ergy: Idaho, Washington, Oregon, Maine,South Dakota, California, Montana, andNew York.
Hydropower generation has remainedrelatively flat for years. The most signifi-cant constraint on expansion of U.S. hydro-power generation is physical; most of thebest locations for hydropower generationhave already been developed. Potentialdoes remain for some increases in hydro-power generation, and capacity can be op-timized by adding additional turbines andincreasing efficiency at existing facilities.
Also, the amount of hydropower gen-eration depends upon the quantity of avail-able water. A drought can have a devastat-ing effect on a region that depends on hy-dropower. In fact, this year’s water avail-ability has been a contributing factor inCalifornia’s electricity supply shortages.The amount of hydropower generation de-pends upon the quantity of available water.A drought can have a devastating effect ona region that depends on hydropower. Infact, this year’s water availability has beena contributing factor in California’s elec-tricity supply shortages.
The Federal Energy Regulatory Com-mission is required to incorporate manda-tory conditions proposed by different stateand federal resource agencies into hydro-power licenses. Decision-making authorityin the licensing process is diffused among ahost of federal and state agencies, all ofwhich are pursuing different statutory mis-sions. The hydropower licensing process isprolonged, costly, and poses regulatory un-certainty. The challenge is to efficientlyand effectively balance national interests innatural resource and environmental preser-vation with energy needs.
5-18
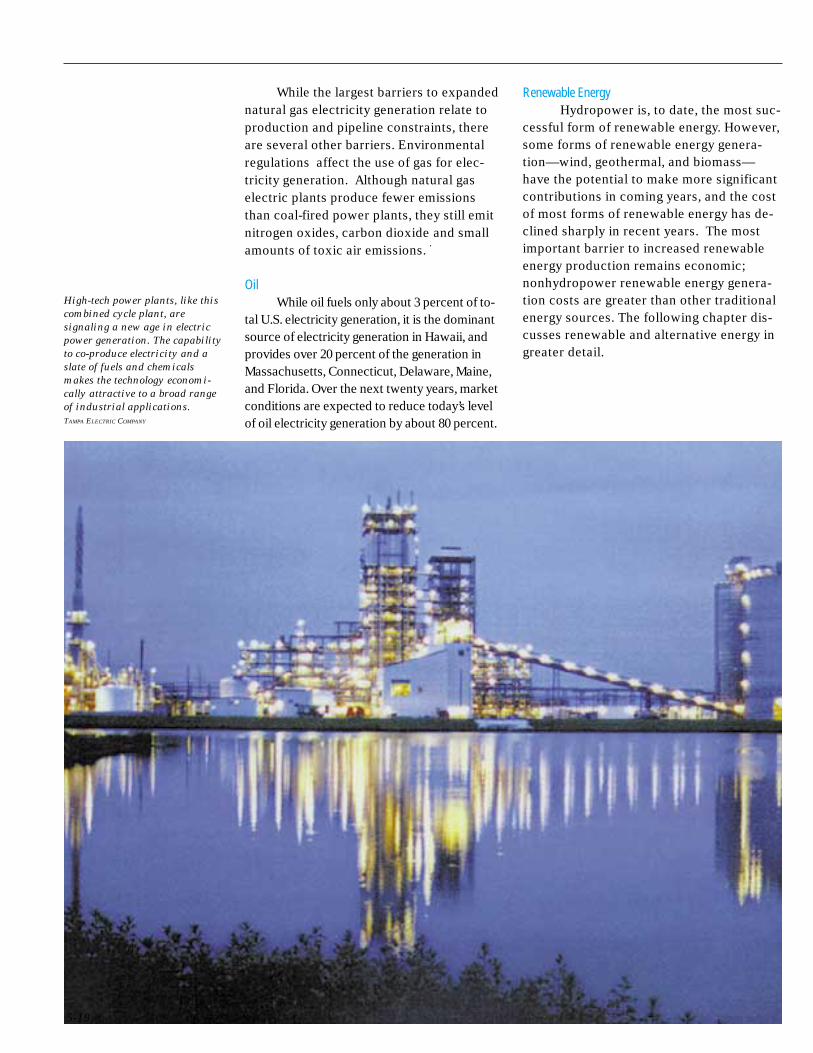
NATIONAL ENERGY POLICY
While the largest barriers to expandednatural gas electricity generation relate toproduction and pipeline constraints, thereare several other barriers. Environmentalregulations affect the use of gas for elec-tricity generation. Although natural gaselectric plants produce fewer emissionsthan coal-fired power plants, they still emitnitrogen oxides, carbon dioxide
, and small
amounts of toxic air emissions.
OilWhile oil fuels only about 3 percent of to-
tal U.S. electricity generation, it is the dominantsource of electricity generation in Hawaii, andprovides over 20 percent of the generation inMassachusetts, Connecticut, Delaware, Maine,and Florida. Over the next twenty years, marketconditions are expected to reduce today’s levelof oil electricity generation by about 80 percent.
Renewable Energy Hydropower is, to date, the most suc-
cessful form of renewable energy. However,some forms of renewable energy genera-tion—wind, geothermal, and biomass—have the potential to make more significantcontributions in coming years, and the costof most forms of renewable energy has de-clined sharply in recent years. The mostimportant barrier to increased renewableenergy production remains economic;nonhydropower renewable energy genera-tion costs are greater than other traditionalenergy sources. The following chapter dis-cusses renewable and alternative energy ingreater detail.
High-tech power plants, like this
combined cycle plant, are
signaling a new age in electric
power generation. The capability
to co-produce electricity and a
slate of fuels and chemicals
makes the technology economi-
cally attractive to a broad range
of industrial applications.
TAMPA ELECTRIC COMPANY
5-19
Chapter 5 • Energy for A New Century: Increasing Domestic Energy Supplies
Summary of RecommendationsEnergy for a New Century: Increasing Domestic Energy Supplies
★ The NEPD Group recommends that the President direct the Secretaries of Energyand the Interior to promote enhanced oil and gas recovery from existing wells throughnew technology.
★ The NEPD Group recommends that the President direct the Secretary of Energyto improve oil and gas exploration technology through continued partnership withpublic and private entities.
★ The NEPD Group recommends that the President direct the Secretary of the Inte-rior to examine land status and lease stipulation impediments to federal oil and gasleasing, and review and modify those where opportunities exist (consistent with thelaw, good environmental practice, and balanced use of other resources).
• Expedite the ongoing Energy Policy and Conservation Act study of impedi-ments to federal oil and gas exploration and development.
• Review public lands withdrawals and lease stipulations, with full public consul-tation, especially with the people in the region, to consider modifications whereappropriate.
★ The NEPD Group recommends that the President direct the Secretary of the Inte-rior to consider economic incentives for environmentally sound offshore oil and gasdevelopment where warranted by specific circumstances: explore opportunities forroyalty reductions, consistent with ensuring a fair return to the public where warrantedfor enhanced oil and gas recovery; for reduction of risk associated with production infrontier areas or deep gas formations; and for development of small fields that wouldotherwise be uneconomic.
★ The NEPD Group recommends that the President direct the Secretaries of Com-merce and Interior to re-examine the current federal legal and policy regime (statutes,regulations, and Executive Orders) to determine if changes are needed regarding en-ergy-related activities and the siting of energy facilities in the coastal zone and on theOuter Continental Shelf (OCS).
★ The NEPD Group recommends that the President direct the Secretary of the Inte-rior continue OCS oil and gas leasing and approval of exploration and developmentplans on predictable schedules.
★ The NEPD Group recommends that the President direct the Secretary of the Inte-rior to consider additional environmentally responsible oil and gas development, basedon sound science and the best available technology, through further lease sales in theNational Petroleum Reserve-Alaska. Such consideration should include areas not cur-rently leased within the Northeast corner of the Reserve.
★ The NEPD Group recommends that the President direct the Secretary of the Inte-rior work with Congress to authorize exploration and, if resources are discovered,development of the 1002 Area of ANWR. Congress should require the use of the bestavailable technology and should require that activities will result in no significant ad-verse impact to the surrounding environment.
5-20
NATIONAL ENERGY POLICY
★ The NEPD Group recommends that the President direct the Secretary of the Inte-rior to work with Congress and the State of Alaska to put in place the most expedi-tious process for renewal of the Trans-Alaska Pipeline System rights-of-way to en-sure that Alaskan oil continues to flow uninterrupted to the West Coast of the UnitedStates.
★ The NEPD Group recommends that the President direct the Secretary of Energyto propose comprehensive electricity legislation that promotes competition, protectsconsumers, enhances reliability, promotes renewable energy, improves efficiency re-peals the Public Utility Holding Company Act, and reforms the Public Utility Regula-tory Policies Act.
★ The NEPD Group recommends that the President encourage FERC to use its ex-isting statutory authority to promote competition and encourage investment in trans-mission facilities.
★ The NEPD Group recognizes the importance of looking to technology to help usmeet the goals of increasing electricity generation while protecting our environment.To that end, the NEPD Group recommends that the President direct the Departmentof Energy to continue to develop advanced clean coal technology by:
• Investing $2 billion over 10 years to fund research in clean coal technologies.• Supporting a permanent extension of the existing research and development
tax credit.• Directing federal agencies to explore regulatory approaches that will encour-
age advancements in environmental technology.
★ The NEPD Group recommends that the President direct federal agencies to pro-vide greater regulatory certainty relating to coal electricity generation through clearpolicies that are easily applied to business decisions.
★ The NEPD Group recommends that the President support the expansion of nuclearenergy in the United States as a major component of our national energy policy. Fol-lowing are specific components of the recommendation:
• Encourage the Nuclear Regulatory Commission (NRC) to ensure that safety andenvironmental protection are high priorities as they prepare to evaluate andexpedite applications for licensing new advanced-technology nuclear reactors.
• Encourage the NRC to facilitate efforts by utilities to expand nuclear energygeneration in the United States by uprating existing nuclear plants safely.
• Encourage the NRC to relicense existing nuclear plants that meet or exceedsafety standards.
• Direct the Secretary of Energy and the Administrator of the Environmental ProtectionAgency to assess the potential of nuclear energy to improve air quality.
• Increase resources as necessary for nuclear safety enforcement in light of thepotential increase in generation.
• Use the best science to provide a deep geologic repository for nuclear waste.• Support legislation clarifying that qualified funds set aside by plant owners for
eventual decommissioning will not be taxed as part of the transaction.• Support legislation to extend the Price–Anderson Act.
5-21
Chapter 5 • Energy for A New Century: Increasing Domestic Energy Supplies
★ The NEPD Group recommends that, in the context of developing advanced nuclearfuel cycles and next generation technologies for nuclear energy, the United States shouldreexamine its policies to allow for research, development and deployment of fuel con-ditioning methods (such as pyroprocessing) that reduce waste streams and enhanceproliferation resistance. In doing so, the United States will continue to discourage theaccumulation of separated plutonium, worldwide.
★ The United States should also consider technologies (in collaboration with interna-tional partners with highly developed fuel cycles and a record of close cooperation) todevelop reprocessing and fuel treatment technologies that are cleaner, more efficient,less waste-intensive, and more proliferation-resistant.
★ The NEPD Group recognizes there is a need to reduce the time and cost of thehydropower licensing process. The NEPD Group recommends that the President en-courage the Federal Energy Regulatory Commission (FERC) and direct federal resourceagencies to make the licensing process more clear and efficient, while preserving envi-ronmental goals. In addition, the NEPD Group recognizes the importance of optimizingthe efficiency and reliability of existing hydropower facilities and will encourage theAdministration to adopt efforts toward that end.
• Support administrative and legislative reform of the hydropower licensing pro-cess.
• Direct federal resource agencies to reach interagency agreement on conflictingmandatory license conditions before they submit their conditions to FERC forinclusion in a license.
• Encourage FERC to adopt appropriate deadlines for its own actions during thelicensing process.
5-22
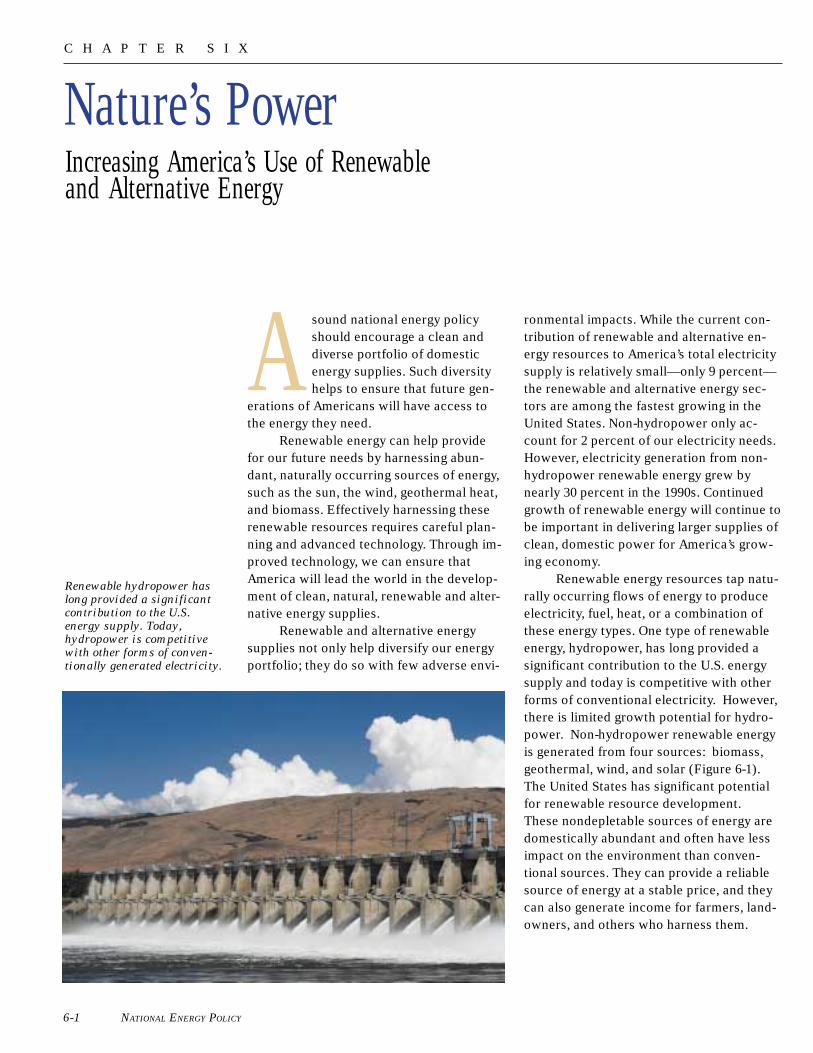
NATIONAL ENERGY POLICY6-1
A sound national energy policyshould encourage a clean anddiverse portfolio of domesticenergy supplies. Such diversityhelps to ensure that future gen-
erations of Americans will have access tothe energy they need.
Renewable energy can help providefor our future needs by harnessing abun-dant, naturally occurring sources of energy,such as the sun, the wind, geothermal heat,and biomass. Effectively harnessing theserenewable resources requires careful plan-ning and advanced technology. Through im-proved technology, we can ensure thatAmerica will lead the world in the develop-ment of clean, natural, renewable and alter-native energy supplies.
Renewable and alternative energysupplies not only help diversify our energyportfolio; they do so with few adverse envi-
Nature’s Power
ronmental impacts. While the current con-tribution of renewable and alternative en-ergy resources to America’s total electricitysupply is relatively small—only 9 percent—the renewable and alternative energy sec-tors are among the fastest growing in theUnited States. Non-hydropower only ac-count for 2 percent of our electricity needs.However, electricity generation from non-hydropower renewable energy grew bynearly 30 percent in the 1990s. Continuedgrowth of renewable energy will continue tobe important in delivering larger supplies ofclean, domestic power for America’s grow-ing economy.
Renewable energy resources tap natu-rally occurring flows of energy to produceelectricity, fuel, heat, or a combination ofthese energy types. One type of renewableenergy, hydropower, has long provided asignificant contribution to the U.S. energysupply and today is competitive with otherforms of conventional electricity. However,there is limited growth potential for hydro-power. Non-hydropower renewable energyis generated from four sources: biomass,geothermal, wind, and solar (Figure 6-1).The United States has significant potentialfor renewable resource development.These nondepletable sources of energy aredomestically abundant and often have lessimpact on the environment than conven-tional sources. They can provide a reliablesource of energy at a stable price, and theycan also generate income for farmers, land-owners, and others who harness them.
Increasing America’s Use of Renewableand Alternative Energy
Renewable hydropower has
long provided a significant
contribution to the U.S.
energy supply. Today,
hydropower is competitive
with other forms of conven-
tionally generated electricity.
C H A P T E R S I X
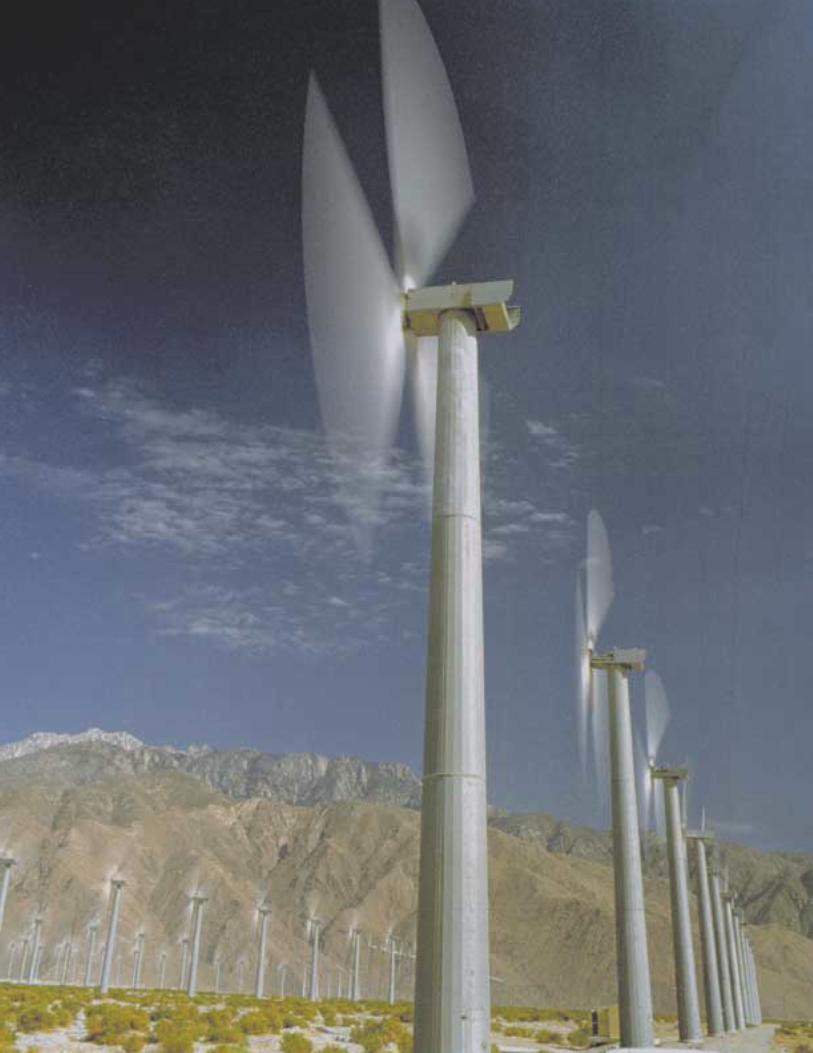
Chapter 6 • Nature’s Power: Increasing America’s Use of Renewable and Alternative Energy
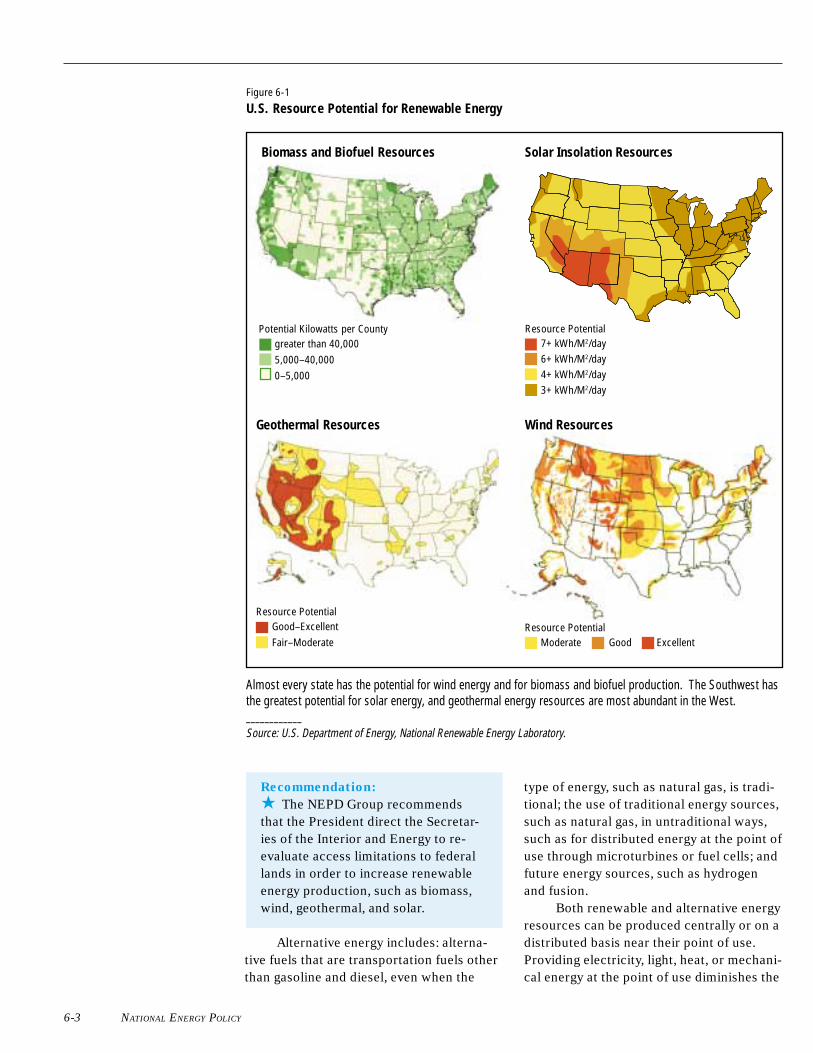
NATIONAL ENERGY POLICY 6-3
Recommendation:
★ The NEPD Group recommendsthat the President direct the Secretar-ies of the Interior and Energy to re-evaluate access limitations to federallands in order to increase renewableenergy production, such as biomass,wind, geothermal, and solar.
Alternative energy includes: alterna-tive fuels that are transportation fuels otherthan gasoline and diesel, even when the
type of energy, such as natural gas, is tradi-tional; the use of traditional energy sources,such as natural gas, in untraditional ways,such as for distributed energy at the point ofuse through microturbines or fuel cells; andfuture energy sources, such as hydrogenand fusion.
Both renewable and alternative energyresources can be produced centrally or on adistributed basis near their point of use.Providing electricity, light, heat, or mechani-cal energy at the point of use diminishes the
Potential Kilowatts per Countygreater than 40,0005,000–40,0000–5,000
Geothermal Resources
Resource PotentialGood–ExcellentFair–Moderate
Figure 6-1
U.S. Resource Potential for Renewable Energy
Wind Resources
Resource PotentialModerate Good Excellent
Solar Insolation Resources
Resource Potential7+ kWh/M2/day6+ kWh/M2/day4+ kWh/M2/day3+ kWh/M2/day
Biomass and Biofuel Resources
Almost every state has the potential for wind energy and for biomass and biofuel production. The Southwest hasthe greatest potential for solar energy, and geothermal energy resources are most abundant in the West.____________Source: U.S. Department of Energy, National Renewable Energy Laboratory.
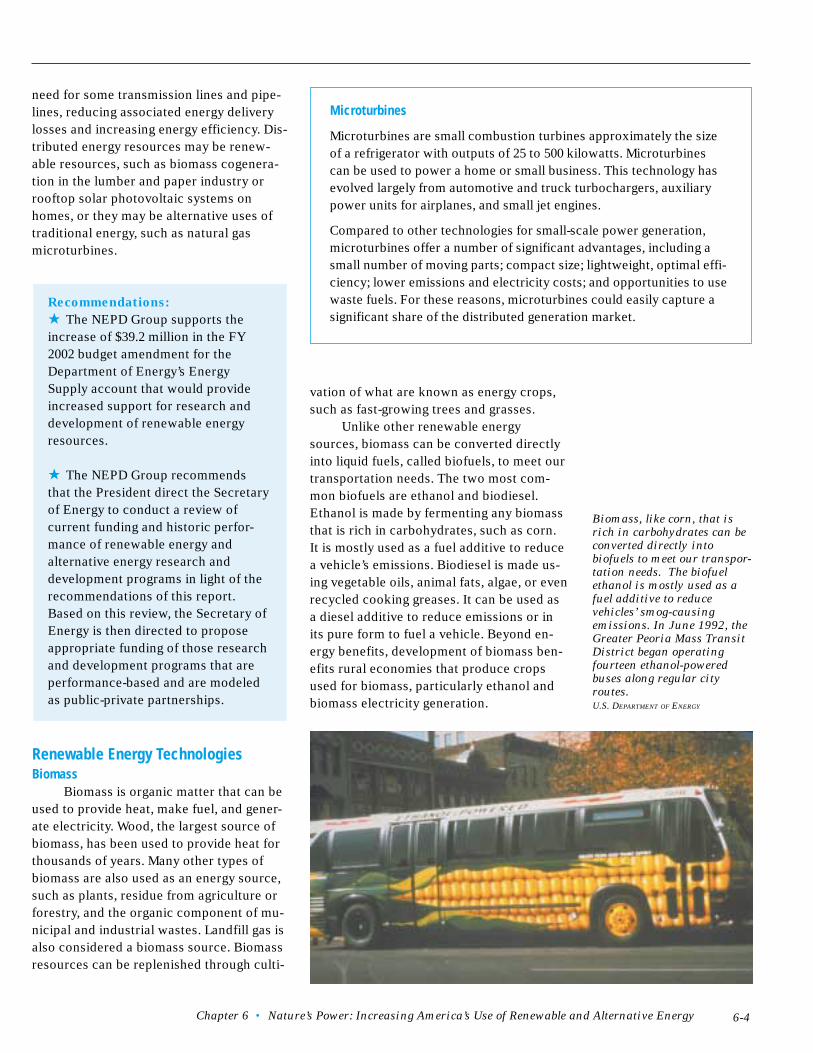
Chapter 6 • Nature’s Power: Increasing America’s Use of Renewable and Alternative Energy 6-4
need for some transmission lines and pipe-lines, reducing associated energy deliverylosses and increasing energy efficiency. Dis-tributed energy resources may be renew-able resources, such as biomass cogenera-tion in the lumber and paper industry orrooftop solar photovoltaic systems onhomes, or they may be alternative uses oftraditional energy, such as natural gasmicroturbines.
Recommendations:
★ The NEPD Group supports theincrease of $39.2 million in the FY2002 budget amendment for theDepartment of Energy’s EnergySupply account that would provideincreased support for research anddevelopment of renewable energyresources.
★ The NEPD Group recommendsthat the President direct the Secretaryof Energy to conduct a review ofcurrent funding and historic perfor-mance of renewable energy andalternative energy research anddevelopment programs in light of therecommendations of this report.Based on this review, the Secretary ofEnergy is then directed to proposeappropriate funding of those researchand development programs that areperformance-based and are modeledas public-private partnerships.
Renewable Energy TechnologiesBiomass
Biomass is organic matter that can beused to provide heat, make fuel, and gener-ate electricity. Wood, the largest source ofbiomass, has been used to provide heat forthousands of years. Many other types ofbiomass are also used as an energy source,such as plants, residue from agriculture orforestry, and the organic component of mu-nicipal and industrial wastes. Landfill gas isalso considered a biomass source. Biomassresources can be replenished through culti-
vation of what are known as energy crops,such as fast-growing trees and grasses.
Unlike other renewable energysources, biomass can be converted directlyinto liquid fuels, called biofuels, to meet ourtransportation needs. The two most com-mon biofuels are ethanol and biodiesel.Ethanol is made by fermenting any biomassthat is rich in carbohydrates, such as corn.It is mostly used as a fuel additive to reducea vehicle’s emissions. Biodiesel is made us-ing vegetable oils, animal fats, algae, or evenrecycled cooking greases. It can be used asa diesel additive to reduce emissions or inits pure form to fuel a vehicle. Beyond en-ergy benefits, development of biomass ben-efits rural economies that produce cropsused for biomass, particularly ethanol andbiomass electricity generation.
Microturbines
Microturbines are small combustion turbines approximately the sizeof a refrigerator with outputs of 25 to 500 kilowatts. Microturbinescan be used to power a home or small business. This technology hasevolved largely from automotive and truck turbochargers, auxiliarypower units for airplanes, and small jet engines.
Compared to other technologies for small-scale power generation,microturbines offer a number of significant advantages, including asmall number of moving parts; compact size; lightweight, optimal effi-ciency; lower emissions and electricity costs; and opportunities to usewaste fuels. For these reasons, microturbines could easily capture asignificant share of the distributed generation market.
Biomass, like corn, that is
rich in carbohydrates can be
converted directly into
biofuels to meet our transpor-
tation needs. The biofuel
ethanol is mostly used as a
fuel additive to reduce
vehicles’ smog-causing
emissions. In June 1992, the
Greater Peoria Mass Transit
District began operating
fourteen ethanol-powered
buses along regular city
routes.
U.S. DEPARTMENT OF ENERGY
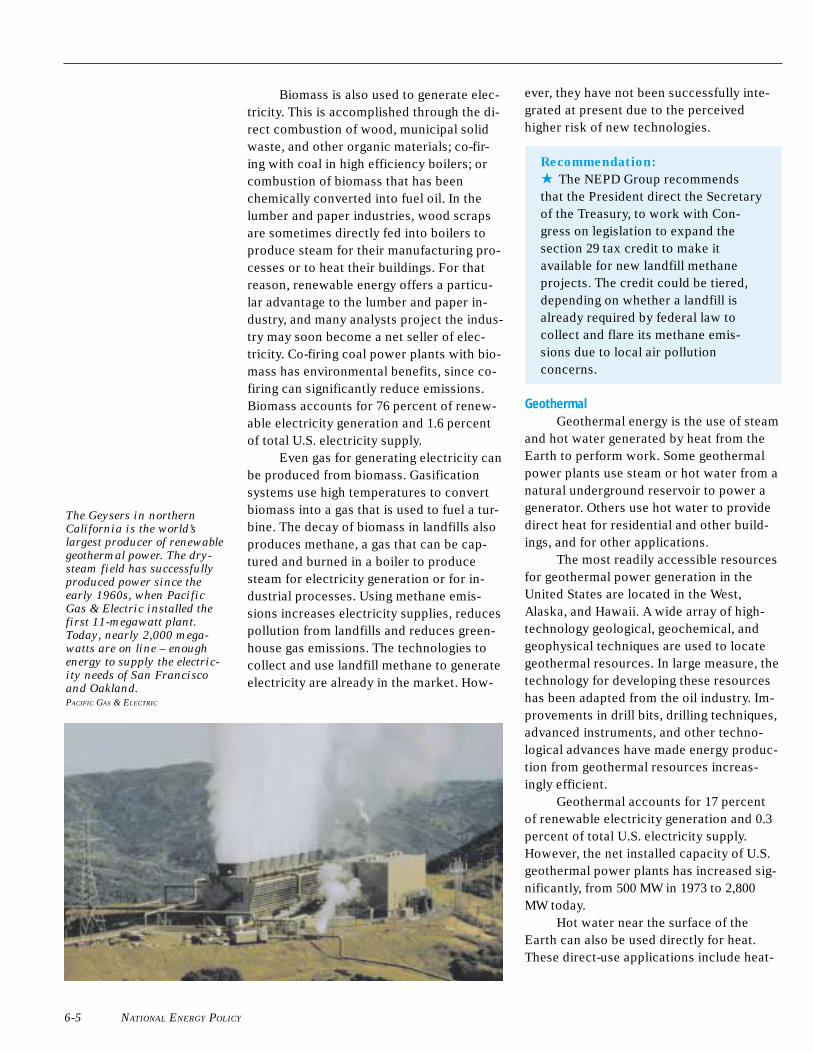
NATIONAL ENERGY POLICY
The Geysers in northern
California is the world’s
largest producer of renewable
geothermal power. The dry-
steam field has successfully
produced power since the
early 1960s, when Pacific
Gas & Electric installed the
first 11-megawatt plant.
Today, nearly 2,000 mega-
watts are on line – enough
energy to supply the electric-
ity needs of San Francisco
and Oakland.
PACIFIC GAS & ELECTRIC
Biomass is also used to generate elec-tricity. This is accomplished through the di-rect combustion of wood, municipal solidwaste, and other organic materials; co-fir-ing with coal in high efficiency boilers; orcombustion of biomass that has beenchemically converted into fuel oil. In thelumber and paper industries, wood scrapsare sometimes directly fed into boilers toproduce steam for their manufacturing pro-cesses or to heat their buildings. For thatreason, renewable energy offers a particu-lar advantage to the lumber and paper in-dustry, and many analysts project the indus-try may soon become a net seller of elec-tricity. Co-firing coal power plants with bio-mass has environmental benefits, since co-firing can significantly reduce emissions.Biomass accounts for 76 percent of renew-able electricity generation and 1.6 percentof total U.S. electricity supply.
Even gas for generating electricity canbe produced from biomass. Gasificationsystems use high temperatures to convertbiomass into a gas that is used to fuel a tur-bine. The decay of biomass in landfills alsoproduces methane, a gas that can be cap-tured and burned in a boiler to producesteam for electricity generation or for in-dustrial processes. Using methane emis-sions increases electricity supplies, reducespollution from landfills and reduces green-house gas emissions. The technologies tocollect and use landfill methane to generateelectricity are already in the market. How-
ever, they have not been successfully inte-grated at present due to the perceivedhigher risk of new technologies.
Recommendation:
★ The NEPD Group recommendsthat the President direct the Secretaryof the Treasury, to work with Con-gress on legislation to expand thesection 29 tax credit to make itavailable for new landfill methaneprojects. The credit could be tiered,depending on whether a landfill isalready required by federal law tocollect and flare its methane emis-sions due to local air pollutionconcerns.
GeothermalGeothermal energy is the use of steam
and hot water generated by heat from theEarth to perform work. Some geothermalpower plants use steam or hot water from anatural underground reservoir to power agenerator. Others use hot water to providedirect heat for residential and other build-ings, and for other applications.
The most readily accessible resourcesfor geothermal power generation in theUnited States are located in the West,Alaska, and Hawaii. A wide array of high-technology geological, geochemical, andgeophysical techniques are used to locategeothermal resources. In large measure, thetechnology for developing these resourceshas been adapted from the oil industry. Im-provements in drill bits, drilling techniques,advanced instruments, and other techno-logical advances have made energy produc-tion from geothermal resources increas-ingly efficient.
Geothermal accounts for 17 percentof renewable electricity generation and 0.3percent of total U.S. electricity supply.However, the net installed capacity of U.S.geothermal power plants has increased sig-nificantly, from 500 MW in 1973 to 2,800MW today.
Hot water near the surface of theEarth can also be used directly for heat.These direct-use applications include heat-
6-5
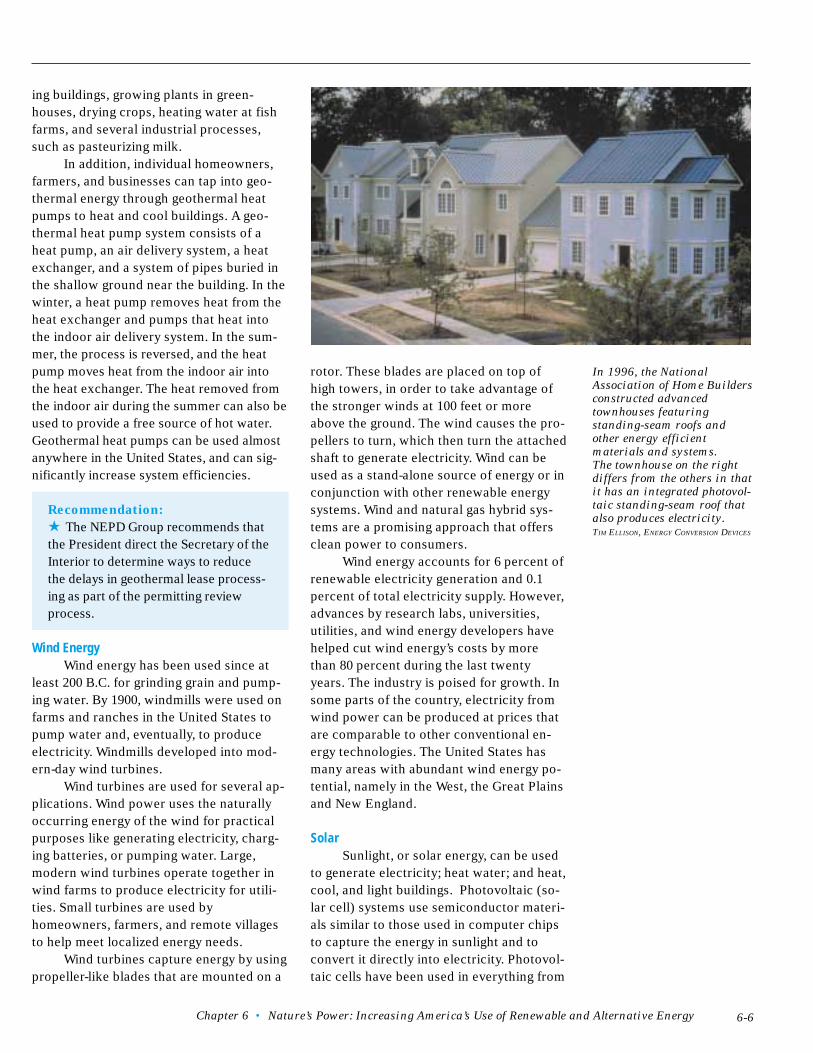
Chapter 6 • Nature’s Power: Increasing America’s Use of Renewable and Alternative Energy
ing buildings, growing plants in green-houses, drying crops, heating water at fishfarms, and several industrial processes,such as pasteurizing milk.
In addition, individual homeowners,farmers, and businesses can tap into geo-thermal energy through geothermal heatpumps to heat and cool buildings. A geo-thermal heat pump system consists of aheat pump, an air delivery system, a heatexchanger, and a system of pipes buried inthe shallow ground near the building. In thewinter, a heat pump removes heat from theheat exchanger and pumps that heat intothe indoor air delivery system. In the sum-mer, the process is reversed, and the heatpump moves heat from the indoor air intothe heat exchanger. The heat removed fromthe indoor air during the summer can also beused to provide a free source of hot water.Geothermal heat pumps can be used almostanywhere in the United States, and can sig-nificantly increase system efficiencies.
Recommendation:
★ The NEPD Group recommends thatthe President direct the Secretary of theInterior to determine ways to reducethe delays in geothermal lease process-ing as part of the permitting reviewprocess.
Wind EnergyWind energy has been used since at
least 200 B.C. for grinding grain and pump-ing water. By 1900, windmills were used onfarms and ranches in the United States topump water and, eventually, to produceelectricity. Windmills developed into mod-ern-day wind turbines.
Wind turbines are used for several ap-plications. Wind power uses the naturallyoccurring energy of the wind for practicalpurposes like generating electricity, charg-ing batteries, or pumping water. Large,modern wind turbines operate together inwind farms to produce electricity for utili-ties. Small turbines are used byhomeowners, farmers, and remote villagesto help meet localized energy needs.
Wind turbines capture energy by usingpropeller-like blades that are mounted on a
rotor. These blades are placed on top ofhigh towers, in order to take advantage ofthe stronger winds at 100 feet or moreabove the ground. The wind causes the pro-pellers to turn, which then turn the attachedshaft to generate electricity. Wind can beused as a stand-alone source of energy or inconjunction with other renewable energysystems. Wind and natural gas hybrid sys-tems are a promising approach that offersclean power to consumers.
Wind energy accounts for 6 percent ofrenewable electricity generation and 0.1percent of total electricity supply. However,advances by research labs, universities,utilities, and wind energy developers havehelped cut wind energy’s costs by morethan 80 percent during the last twentyyears. The industry is poised for growth. Insome parts of the country, electricity fromwind power can be produced at prices thatare comparable to other conventional en-ergy technologies. The United States hasmany areas with abundant wind energy po-tential, namely in the West, the Great Plainsand New England.
SolarSunlight, or solar energy, can be used
to generate electricity; heat water; and heat,cool, and light buildings. Photovoltaic (so-lar cell) systems use semiconductor materi-als similar to those used in computer chipsto capture the energy in sunlight and toconvert it directly into electricity. Photovol-taic cells have been used in everything from
In 1996, the National
Association of Home Builders
constructed advanced
townhouses featuring
standing-seam roofs and
other energy efficient
materials and systems.
The townhouse on the right
differs from the others in that
it has an integrated photovol-
taic standing-seam roof that
also produces electricity.
TIM ELLISON, ENERGY CONVERSION DEVICES
6-6
NATIONAL ENERGY POLICY
the solar cells in calculators to the spacestation Freedom.
Another technology for harnessing thesun’s energy is a concentrating solar powersystem, which uses the sun’s heat to gener-ate electricity. The sunlight is collected andfocused with mirrors to create a high inten-sity heat source that in turn can be used togenerate electricity through a steam turbineor a heat engine.
Solar hot water systems use the sun toheat water for domestic or industrial use.Many large commercial buildings also usesolar collectors for heat. A solar ventilationsystem can be used in cold climates to pre-heat air as it enters a building. The heatfrom a solar collector can even be used toprovide energy for cooling a building.
Some architects are using careful de-sign and new optical materials to use sun-light to reduce the need for traditional light-ing and to cut down on heating and coolingcosts. For example, materials that absorband store the sun’s heat can be built into thesunlit floors and walls. The floors and walls
will store heat during the day and slowly re-lease heat at night.
While solar energy technologies haveundergone technological and cost improve-ments and are well established in high-value markets like remote power, satellites,communications, and navigational aids,continued research is needed to reducecosts and improve performance. Solar en-ergy accounts for 1 percent of renewableelectricity generation and 0.02 percent oftotal U.S. electricity supply.
Alternative EnergyAlternative Transportation Fuels
Alternative fuels are any transporta-tion fuels made from a nontraditionalsource, including ethanol, biodiesel, andother biofuels. These can be made frombiomass resources, including liquid fuels(e.g., ethanol, methanol, biodiesel) and gas-eous fuels (e.g., hydrogen and methane).Biofuels are primarily used to fuel vehicles,but can also fuel engines or fuel cells forelectricity generation. Alternative fuels also
Recommendations:
★ The NEPD Group recommends that the President direct the Administrator of theEnvironmental Protection Agency to develop a new renewable energy partnershipprogram to help companies more easily buy renewable energy, as well as receiverecognition for the environmental benefits of their purchase, and help consumers bypromoting consumer choice programs that increase their knowledge about theenvironmental benefits of purchasing renewable energy.
★ The NEPD Group recommends that the President direct the Secretary of theTreasury to work with Congress on legislation to extend and expand tax credits forelectricity produced using renewable technology, such as wind and biomass. ThePresident’s budget request extends the present 1.7 cents per kilowatt hour tax creditfor electricity produced from wind and biomass; expands eligible biomass sources toinclude forest-related sources, agricultural sources, and certain urban sources; andallows a credit for electricity produced from biomass co-fired with coal.
★ The NEPD Group recommends that the President direct the Secretary of theTreasury to work with Congress on legislation to provide a new 15 percent tax creditfor residential solar energy property, up to a maximum credit of $2,000.
★ The NEPD Group recommends that the President direct the Secretaries of theInterior and Energy to work with Congress on legislation to use an estimated $1.2billion of bid bonuses from the environmentally responsible leasing of ANWR forfunding research into alternative and renewable energy resources, including wind,solar, geothermal, and biomass.
6-7
Chapter 6 • Nature’s Power: Increasing America’s Use of Renewable and Alternative Energy
include traditional energy sources, such asnatural gas and liquid propane that are tra-ditionally not used as a transportation fuel.
Currently, there are approximately450,000 alternative fuel vehicles in theUnited States, and more than 1.5 millionflexible-fuel vehicles that can use gasolineor a mixture of ethanol and gasoline. Etha-nol is made by converting the carbohydrateportion of biomass into sugar, which is thenconverted into ethanol through a fermenta-tion process. Ethanol is the most widelyused biofuel, and its production has in-creased sharply since 1980, rising from 200million gallons a year to 1.9 billion gallons.Today, many states are considering phasingout the use of MTBE (methyl tertiary butylether), an oxygenate additive for gasoline.If they do so, that will likely spur greater re-liance on ethanol.
Each year, approximately 65 percentof the oil consumed in the United States isused for transportation. As a result, vehicleemissions have become the leading sourceof U.S. air pollution. However, recent ad-vances in fuels and vehicle design are help-ing increase fuel efficiency and reducetoxic substances discharged into the air.
Changes in the composition of trans-
portation fuels, such as gasoline and dieselfuels, are one way to improve vehicle per-formance while reducing emissions andlowering oil consumption. Reformulatedgasoline contains fuel additives such asethanol to increase oxygen content, whichreduces harmful emissions such as carbonmonoxide. Low-sulfur gasoline reduces sul-fur oxide emissions. New diesel fuels, someof which have lower sulfur contents or areproduced from clean-burning natural gas,can help vehicles with diesel enginesachieve lower emissions.
In addition to advanced transportationfuels, alternative fuels are being developed,such as biodiesel, electricity, ethanol, hydro-gen, methanol, natural gas, and propane.These alternative fuels not only reduce de-pendence on petroleum transportation fu-els. They reduce or entirely eliminate harm-ful emissions as well. With the exception ofnatural gas and propane, these fuels alsohave the potential of being generated fromrenewable resources, such as ethanol fromcorn. The federal government has promoteddevelopment of alternative fuels for manyyears and this program has helped to reduceU.S. reliance on oil-based fuels.
The evolution toward more efficient,
Alternative Fuel VehiclesAlternative fuel vehicles (AFVs) can run on methanol, ethanol, compressed naturalgas, liquefied natural gas, propane, hydrogen, electricity, biodiesel, and natural gas.Today, more than 450,000 alternative vehicles are operating in the United States. Someof the barriers to using AFVs include:
Cost—For example, a Ford Crown Victoria that runs on compressed natural gascosts about $4,000 more than its gasoline counterpart.
Refueling Infrastructure—Refueling infrastructure is limited, which can makerefueling inconvenient and travel options difficult.
Travel Distance—Ability to travel a long distance on a single volume of fuel. Alternative fuels have an energy content lower than that of gasoline, whichmeans that AFVs cannot travel as far as traditional vehicles on a single tankof fuel.
In the short term, natural gas and propane offer the greatest potential for marketgrowth, especially in niche markets where lower fuel costs make them attractive,such as transit buses, school buses, shuttles, and other heavy-duty vehicles. Ethanolvehicles offer tremendous potential if ethanol production can be expanded. Electricvehicles could reach large numbers in the future if technology breakthroughs helpbring costs down and increase driving distance. Fuel cell vehicles operating on com-pressed hydrogen offer long-term potential. Compressed natural gas offers a distribu-tion stepping-stone to a hydrogen-refueling infrastructure.
6-8
NATIONAL ENERGY POLICY6-9
environmentally friendly transportation fu-els has been mirrored by improvements invehicle design, components, and materials.Alternative fuel vehicles, which can eitherswitch between two fuels or run on a mix-ture of two fuels such as gasoline and etha-nol, are now available. Recent developmentsin both alternative fuel vehicles and petro-leum-based vehicles, such as advances inengines, drive trains, and emission-controltechnologies, may double or triple the effi-ciency of current vehicles. Some of thesenew technologies include hybrid electric ve-hicles, which combine an engine with anelectric motor, and fuel cells, which produceelectricity by converting a fuel, generally hy-drogen and oxygen, into water.
A number of issues drive the researchand marketability of advanced alternativefuel vehicles and petroleum-based vehiclesin the United States. The goal of reducingU.S. dependence on imported oil, combinedwith the link between vehicle emissions andair pollution, have prompted the develop-ment of emissions and fuel economy stan-dards for car manufacturers. In addition,federal, state, and local governments haveenacted regulations, laws, and incentives de-signed to reduce the number of vehiclemiles traveled and to encourage businessesand individuals to purchase alternative fuelvehicles.
The success of the federal alternativefuels program has been limited, however.The current program focuses on mandatingcertain fleet operators to purchase alterna-tive fueled vehicles. The hope was that thisvehicle purchase mandate would lead to ex-panded use of alternative fuels. That expec-tation has not been realized, since most fleetoperators purchase dual-fueled vehicles thatoperate on petroleum motor fuels. TheClean Air Act required the use of oxygen-ates, such as MTBE (methyl tertiary butylether) and ethanol in fuel. These oxygenatesaccount for 92 percent of alternative fueluse. Reforms to the federal alternative fuelsprogram could promote alternative fuels useinstead of mandating purchase of vehiclesthat ultimately run on petroleum fuels.
Recommendation:
★ The NEPD Group recommends thatthe President direct the Secretary ofTreasury to work with Congress tocontinue the ethanol excise taxexemption.
Distributed EnergyUntapped opportunities for reducing
energy demand loads could be realized bybetter integrating electricity supply systemsand customers. Improved integration canproduce a variety of benefits for tight en-ergy markets, including reducing peak de-mand loads, bypassing congested areas oftransmission by placing new generating ca-pacity closer to the consumer, and thusachieving greater overall system efficien-cies.
Current electricity load managementefforts are typically limited to cutting off in-terruptible or nonfirm customers, appealsto the public to conserve, and brownouts.Some utilities are incorporating current-generation metering, sensor, and controltechnologies to take the next step: selectivereduction of individual energy-using appli-ances. In some areas, residents can reducetheir monthly bills by allowing the utility toelectronically turn off selected appliances,such as water heaters, on a rotating basis. Ifthis option is well managed, consumers areunaware of the temporary loss service, andcritical systems continue to run unimpeded.Advanced integrated supply-and-demandload management controls also allow forwidespread “demand auctions,” in whichconsumers can decide which energy ser-vices to forego on which days.
Distributed energy resources describea variety of smaller electricity-generatingoptions well suited for placement in homes,offices, and factories, or near these facili-ties. Distributed energy systems have thedistinct advantage of being brought on linefaster than new central power plants. Whilenatural gas microturbines and solar roofpanels are the most familiar types of distrib-uted energy, other distributed energy re-sources include: combined heat and power,stationary fuel cells, generation of
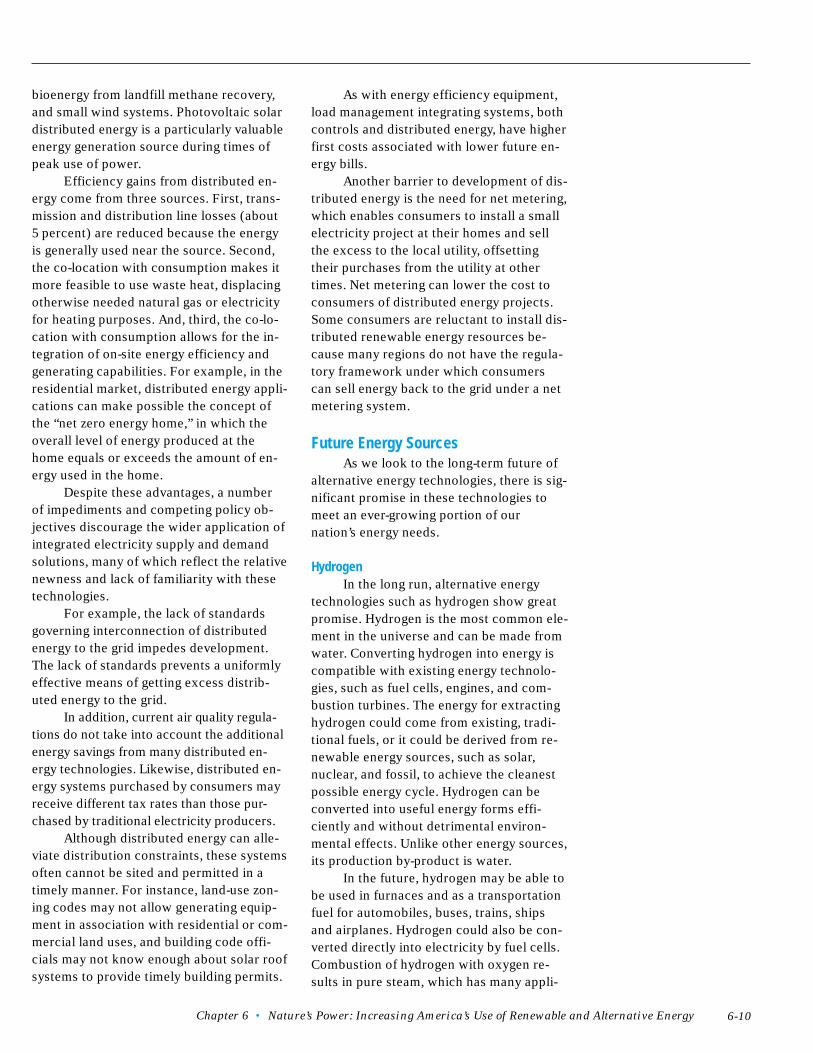
Chapter 6 • Nature’s Power: Increasing America’s Use of Renewable and Alternative Energy 6-10
bioenergy from landfill methane recovery,and small wind systems. Photovoltaic solardistributed energy is a particularly valuableenergy generation source during times ofpeak use of power.
Efficiency gains from distributed en-ergy come from three sources. First, trans-mission and distribution line losses (about5 percent) are reduced because the energyis generally used near the source. Second,the co-location with consumption makes itmore feasible to use waste heat, displacingotherwise needed natural gas or electricityfor heating purposes. And, third, the co-lo-cation with consumption allows for the in-tegration of on-site energy efficiency andgenerating capabilities. For example, in theresidential market, distributed energy appli-cations can make possible the concept ofthe “net zero energy home,” in which theoverall level of energy produced at thehome equals or exceeds the amount of en-ergy used in the home.
Despite these advantages, a numberof impediments and competing policy ob-jectives discourage the wider application ofintegrated electricity supply and demandsolutions, many of which reflect the relativenewness and lack of familiarity with thesetechnologies.
For example, the lack of standardsgoverning interconnection of distributedenergy to the grid impedes development.The lack of standards prevents a uniformlyeffective means of getting excess distrib-uted energy to the grid.
In addition, current air quality regula-tions do not take into account the additionalenergy savings from many distributed en-ergy technologies. Likewise, distributed en-ergy systems purchased by consumers mayreceive different tax rates than those pur-chased by traditional electricity producers.
Although distributed energy can alle-viate distribution constraints, these systemsoften cannot be sited and permitted in atimely manner. For instance, land-use zon-ing codes may not allow generating equip-ment in association with residential or com-mercial land uses, and building code offi-cials may not know enough about solar roofsystems to provide timely building permits.
As with energy efficiency equipment,load management integrating systems, bothcontrols and distributed energy, have higherfirst costs associated with lower future en-ergy bills.
Another barrier to development of dis-tributed energy is the need for net metering,which enables consumers to install a smallelectricity project at their homes and sellthe excess to the local utility, offsettingtheir purchases from the utility at othertimes. Net metering can lower the cost toconsumers of distributed energy projects.Some consumers are reluctant to install dis-tributed renewable energy resources be-cause many regions do not have the regula-tory framework under which consumerscan sell energy back to the grid under a netmetering system.
Future Energy SourcesAs we look to the long-term future of
alternative energy technologies, there is sig-nificant promise in these technologies tomeet an ever-growing portion of ournation’s energy needs.
HydrogenIn the long run, alternative energy
technologies such as hydrogen show greatpromise. Hydrogen is the most common ele-ment in the universe and can be made fromwater. Converting hydrogen into energy iscompatible with existing energy technolo-gies, such as fuel cells, engines, and com-bustion turbines. The energy for extractinghydrogen could come from existing, tradi-tional fuels, or it could be derived from re-newable energy sources, such as solar,nuclear, and fossil, to achieve the cleanestpossible energy cycle. Hydrogen can beconverted into useful energy forms effi-ciently and without detrimental environ-mental effects. Unlike other energy sources,its production by-product is water.
In the future, hydrogen may be able tobe used in furnaces and as a transportationfuel for automobiles, buses, trains, shipsand airplanes. Hydrogen could also be con-verted directly into electricity by fuel cells.Combustion of hydrogen with oxygen re-sults in pure steam, which has many appli-
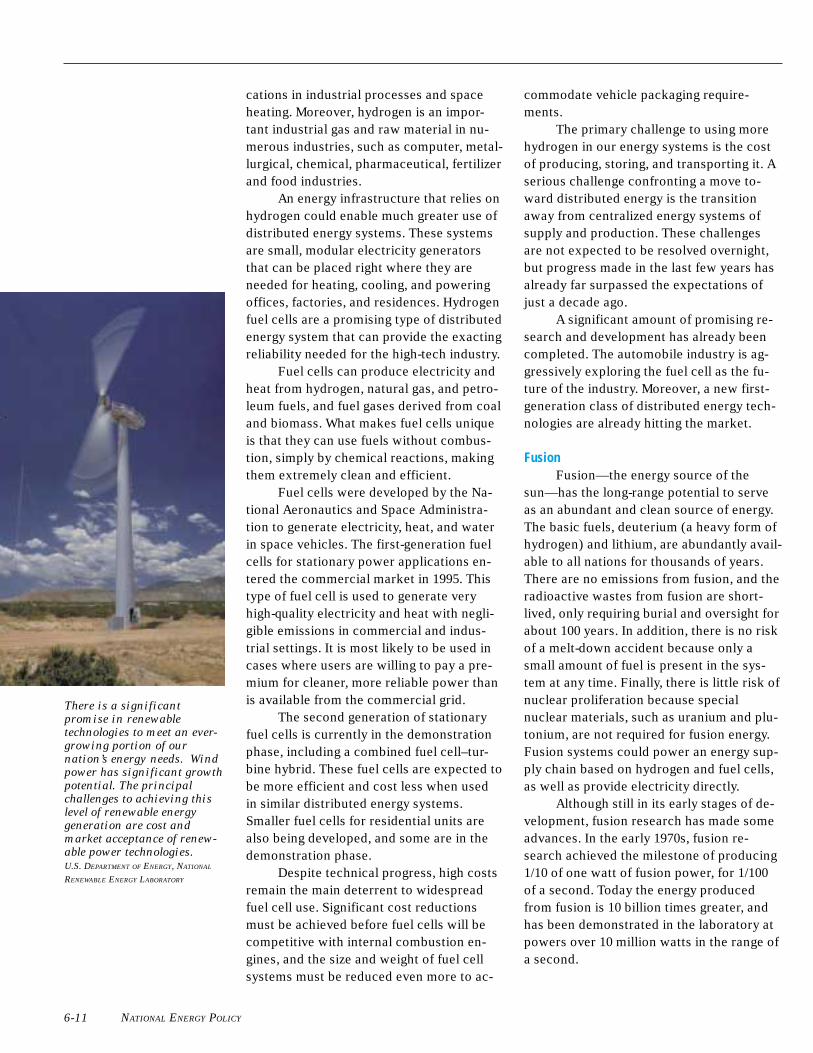
NATIONAL ENERGY POLICY6-11
cations in industrial processes and spaceheating. Moreover, hydrogen is an impor-tant industrial gas and raw material in nu-merous industries, such as computer, metal-lurgical, chemical, pharmaceutical, fertilizerand food industries.
An energy infrastructure that relies onhydrogen could enable much greater use ofdistributed energy systems. These systemsare small, modular electricity generatorsthat can be placed right where they areneeded for heating, cooling, and poweringoffices, factories, and residences. Hydrogenfuel cells are a promising type of distributedenergy system that can provide the exactingreliability needed for the high-tech industry.
Fuel cells can produce electricity andheat from hydrogen, natural gas, and petro-leum fuels, and fuel gases derived from coaland biomass. What makes fuel cells uniqueis that they can use fuels without combus-tion, simply by chemical reactions, makingthem extremely clean and efficient.
Fuel cells were developed by the Na-tional Aeronautics and Space Administra-tion to generate electricity, heat, and waterin space vehicles. The first-generation fuelcells for stationary power applications en-tered the commercial market in 1995. Thistype of fuel cell is used to generate veryhigh-quality electricity and heat with negli-gible emissions in commercial and indus-trial settings. It is most likely to be used incases where users are willing to pay a pre-mium for cleaner, more reliable power thanis available from the commercial grid.
The second generation of stationaryfuel cells is currently in the demonstrationphase, including a combined fuel cell–tur-bine hybrid. These fuel cells are expected tobe more efficient and cost less when usedin similar distributed energy systems.Smaller fuel cells for residential units arealso being developed, and some are in thedemonstration phase.
Despite technical progress, high costsremain the main deterrent to widespreadfuel cell use. Significant cost reductionsmust be achieved before fuel cells will becompetitive with internal combustion en-gines, and the size and weight of fuel cellsystems must be reduced even more to ac-
commodate vehicle packaging require-ments.
The primary challenge to using morehydrogen in our energy systems is the costof producing, storing, and transporting it. Aserious challenge confronting a move to-ward distributed energy is the transitionaway from centralized energy systems ofsupply and production. These challengesare not expected to be resolved overnight,but progress made in the last few years hasalready far surpassed the expectations ofjust a decade ago.
A significant amount of promising re-search and development has already beencompleted. The automobile industry is ag-gressively exploring the fuel cell as the fu-ture of the industry. Moreover, a new first-generation class of distributed energy tech-nologies are already hitting the market.
FusionFusion—the energy source of the
sun—has the long-range potential to serveas an abundant and clean source of energy.The basic fuels, deuterium (a heavy form ofhydrogen) and lithium, are abundantly avail-able to all nations for thousands of years.There are no emissions from fusion, and theradioactive wastes from fusion are short-lived, only requiring burial and oversight forabout 100 years. In addition, there is no riskof a melt-down accident because only asmall amount of fuel is present in the sys-tem at any time. Finally, there is little risk ofnuclear proliferation because specialnuclear materials, such as uranium and plu-tonium, are not required for fusion energy.Fusion systems could power an energy sup-ply chain based on hydrogen and fuel cells,as well as provide electricity directly.
Although still in its early stages of de-velopment, fusion research has made someadvances. In the early 1970s, fusion re-search achieved the milestone of producing1/10 of one watt of fusion power, for 1/100of a second. Today the energy producedfrom fusion is 10 billion times greater, andhas been demonstrated in the laboratory atpowers over 10 million watts in the range ofa second.
There is a significant
promise in renewable
technologies to meet an ever-
growing portion of our
nation’s energy needs. Wind
power has significant growth
potential. The principal
challenges to achieving this
level of renewable energy
generation are cost and
market acceptance of renew-
able power technologies.
U.S. DEPARTMENT OF ENERGY, NATIONAL
RENEWABLE ENERGY LABORATORY
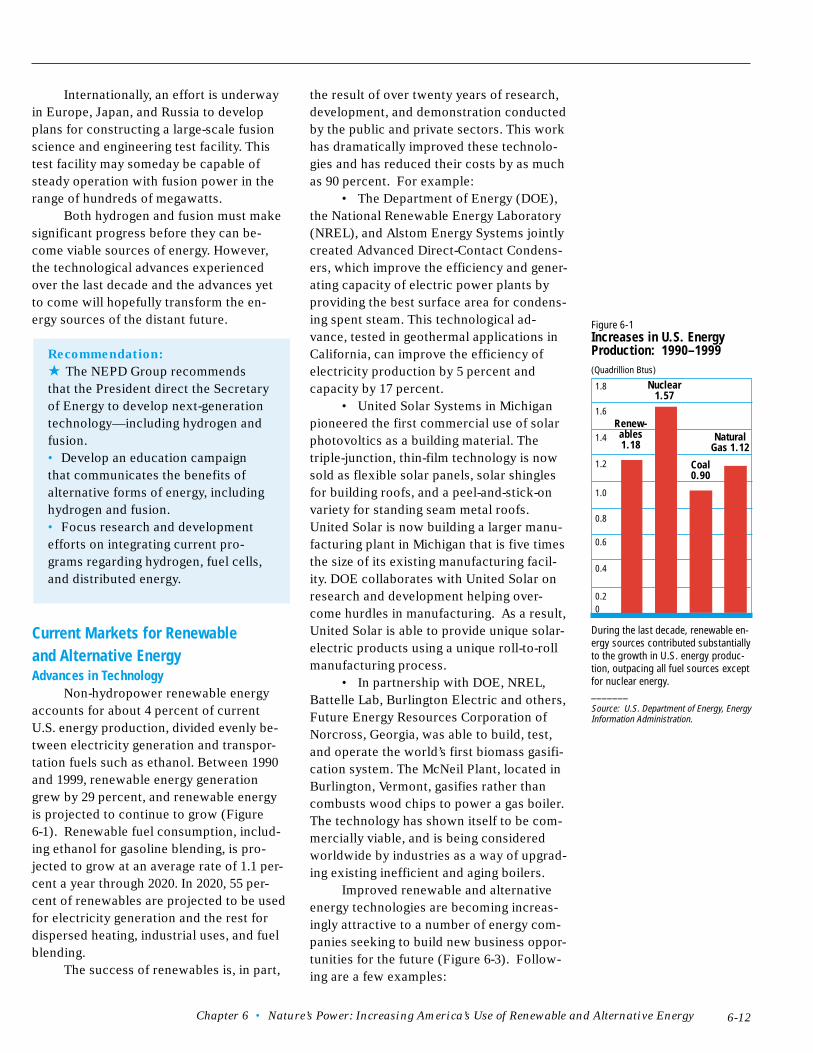
Chapter 6 • Nature’s Power: Increasing America’s Use of Renewable and Alternative Energy 6-12
Internationally, an effort is underwayin Europe, Japan, and Russia to developplans for constructing a large-scale fusionscience and engineering test facility. Thistest facility may someday be capable ofsteady operation with fusion power in therange of hundreds of megawatts.
Both hydrogen and fusion must makesignificant progress before they can be-come viable sources of energy. However,the technological advances experiencedover the last decade and the advances yetto come will hopefully transform the en-ergy sources of the distant future.
Recommendation:
★ The NEPD Group recommendsthat the President direct the Secretaryof Energy to develop next-generationtechnology—including hydrogen andfusion.• Develop an education campaignthat communicates the benefits ofalternative forms of energy, includinghydrogen and fusion.• Focus research and developmentefforts on integrating current pro-grams regarding hydrogen, fuel cells,and distributed energy.
Current Markets for Renewableand Alternative EnergyAdvances in Technology
Non-hydropower renewable energyaccounts for about 4 percent of currentU.S. energy production, divided evenly be-tween electricity generation and transpor-tation fuels such as ethanol. Between 1990and 1999, renewable energy generationgrew by 29 percent, and renewable energyis projected to continue to grow (Figure6-1). Renewable fuel consumption, includ-ing ethanol for gasoline blending, is pro-jected to grow at an average rate of 1.1 per-cent a year through 2020. In 2020, 55 per-cent of renewables are projected to be usedfor electricity generation and the rest fordispersed heating, industrial uses, and fuelblending.
The success of renewables is, in part,
the result of over twenty years of research,development, and demonstration conductedby the public and private sectors. This workhas dramatically improved these technolo-gies and has reduced their costs by as muchas 90 percent. For example:
• The Department of Energy (DOE),the National Renewable Energy Laboratory(NREL), and Alstom Energy Systems jointlycreated Advanced Direct-Contact Condens-ers, which improve the efficiency and gener-ating capacity of electric power plants byproviding the best surface area for condens-ing spent steam. This technological ad-vance, tested in geothermal applications inCalifornia, can improve the efficiency ofelectricity production by 5 percent andcapacity by 17 percent.
• United Solar Systems in Michiganpioneered the first commercial use of solarphotovoltics as a building material. Thetriple-junction, thin-film technology is nowsold as flexible solar panels, solar shinglesfor building roofs, and a peel-and-stick-onvariety for standing seam metal roofs.United Solar is now building a larger manu-facturing plant in Michigan that is five timesthe size of its existing manufacturing facil-ity. DOE collaborates with United Solar onresearch and development helping over-come hurdles in manufacturing. As a result,United Solar is able to provide unique solar-electric products using a unique roll-to-rollmanufacturing process.
• In partnership with DOE, NREL,Battelle Lab, Burlington Electric and others,Future Energy Resources Corporation ofNorcross, Georgia, was able to build, test,and operate the world’s first biomass gasifi-cation system. The McNeil Plant, located inBurlington, Vermont, gasifies rather thancombusts wood chips to power a gas boiler.The technology has shown itself to be com-mercially viable, and is being consideredworldwide by industries as a way of upgrad-ing existing inefficient and aging boilers.
Improved renewable and alternativeenergy technologies are becoming increas-ingly attractive to a number of energy com-panies seeking to build new business oppor-tunities for the future (Figure 6-3). Follow-ing are a few examples:
NaturalGas 1.12
Figure 6-1Increases in U.S. EnergyProduction: 1990–1999(Quadrillion Btus)
During the last decade, renewable en-ergy sources contributed substantiallyto the growth in U.S. energy produc-tion, outpacing all fuel sources exceptfor nuclear energy._______Source: U.S. Department of Energy, EnergyInformation Administration.
Renew-ables1.18
Nuclear1.57
Coal0.90
1.8
1.6
1.4
1.2
1.0
0.8
0.6
0.4
0.20
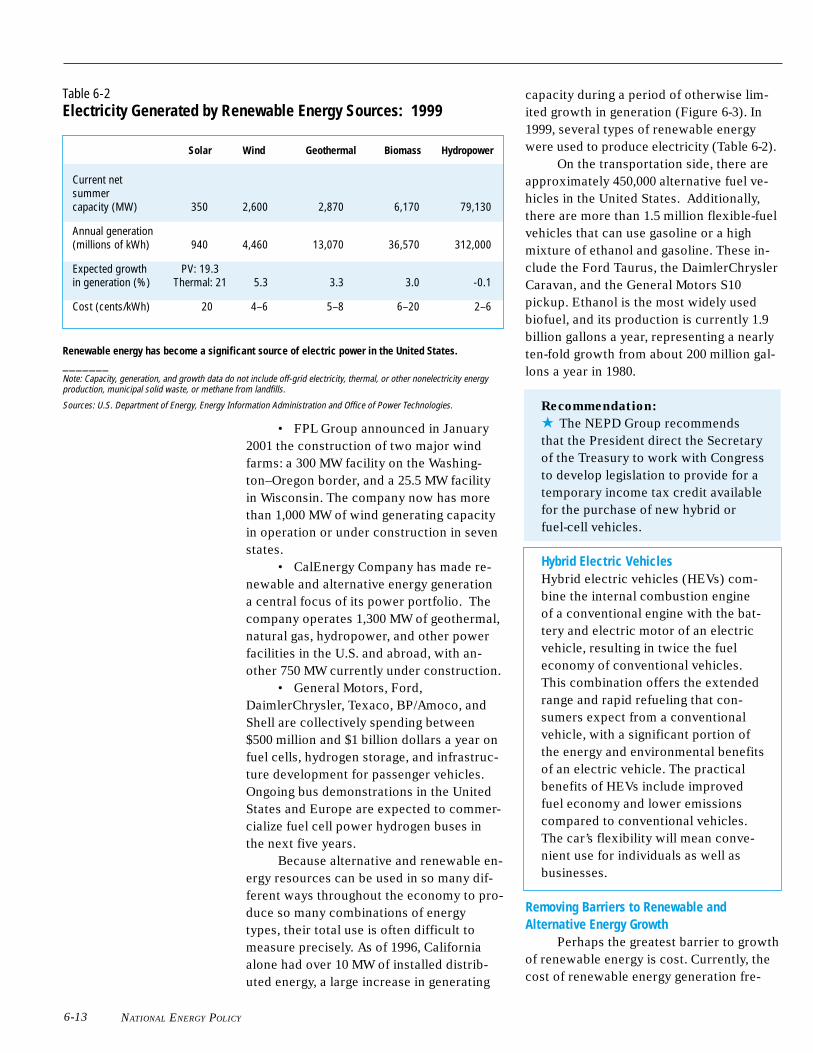
NATIONAL ENERGY POLICY6-13
• FPL Group announced in January2001 the construction of two major windfarms: a 300 MW facility on the Washing-ton–Oregon border, and a 25.5 MW facilityin Wisconsin. The company now has morethan 1,000 MW of wind generating capacityin operation or under construction in sevenstates.
• CalEnergy Company has made re-newable and alternative energy generationa central focus of its power portfolio. Thecompany operates 1,300 MW of geothermal,natural gas, hydropower, and other powerfacilities in the U.S. and abroad, with an-other 750 MW currently under construction.
• General Motors, Ford,DaimlerChrysler, Texaco, BP/Amoco, andShell are collectively spending between$500 million and $1 billion dollars a year onfuel cells, hydrogen storage, and infrastruc-ture development for passenger vehicles.Ongoing bus demonstrations in the UnitedStates and Europe are expected to commer-cialize fuel cell power hydrogen buses inthe next five years.
Because alternative and renewable en-ergy resources can be used in so many dif-ferent ways throughout the economy to pro-duce so many combinations of energytypes, their total use is often difficult tomeasure precisely. As of 1996, Californiaalone had over 10 MW of installed distrib-uted energy, a large increase in generating
capacity during a period of otherwise lim-ited growth in generation (Figure 6-3). In1999, several types of renewable energywere used to produce electricity (Table 6-2).
On the transportation side, there areapproximately 450,000 alternative fuel ve-hicles in the United States. Additionally,there are more than 1.5 million flexible-fuelvehicles that can use gasoline or a highmixture of ethanol and gasoline. These in-clude the Ford Taurus, the DaimlerChryslerCaravan, and the General Motors S10pickup. Ethanol is the most widely usedbiofuel, and its production is currently 1.9billion gallons a year, representing a nearlyten-fold growth from about 200 million gal-lons a year in 1980.
Recommendation:
★ The NEPD Group recommendsthat the President direct the Secretaryof the Treasury to work with Congressto develop legislation to provide for atemporary income tax credit availablefor the purchase of new hybrid orfuel-cell vehicles.
Hybrid Electric VehiclesHybrid electric vehicles (HEVs) com-bine the internal combustion engineof a conventional engine with the bat-tery and electric motor of an electricvehicle, resulting in twice the fueleconomy of conventional vehicles.This combination offers the extendedrange and rapid refueling that con-sumers expect from a conventionalvehicle, with a significant portion ofthe energy and environmental benefitsof an electric vehicle. The practicalbenefits of HEVs include improvedfuel economy and lower emissionscompared to conventional vehicles.The car’s flexibility will mean conve-nient use for individuals as well asbusinesses.
Removing Barriers to Renewable andAlternative Energy Growth
Perhaps the greatest barrier to growthof renewable energy is cost. Currently, thecost of renewable energy generation fre-
Table 6-2Electricity Generated by Renewable Energy Sources: 1999
Renewable energy has become a significant source of electric power in the United States._______Note: Capacity, generation, and growth data do not include off-grid electricity, thermal, or other nonelectricity energyproduction, municipal solid waste, or methane from landfills.
Sources: U.S. Department of Energy, Energy Information Administration and Office of Power Technologies.
Current netsummercapacity (MW) 350 2,600 2,870 6,170 79,130
Annual generation(millions of kWh) 940 4,460 13,070 36,570 312,000
Expected growth PV: 19.3in generation (%) Thermal: 21 5.3 3.3 3.0 -0.1
Cost (cents/kWh) 20 4–6 5–8 6–20 2–6
Solar Wind Geothermal Biomass Hydropower
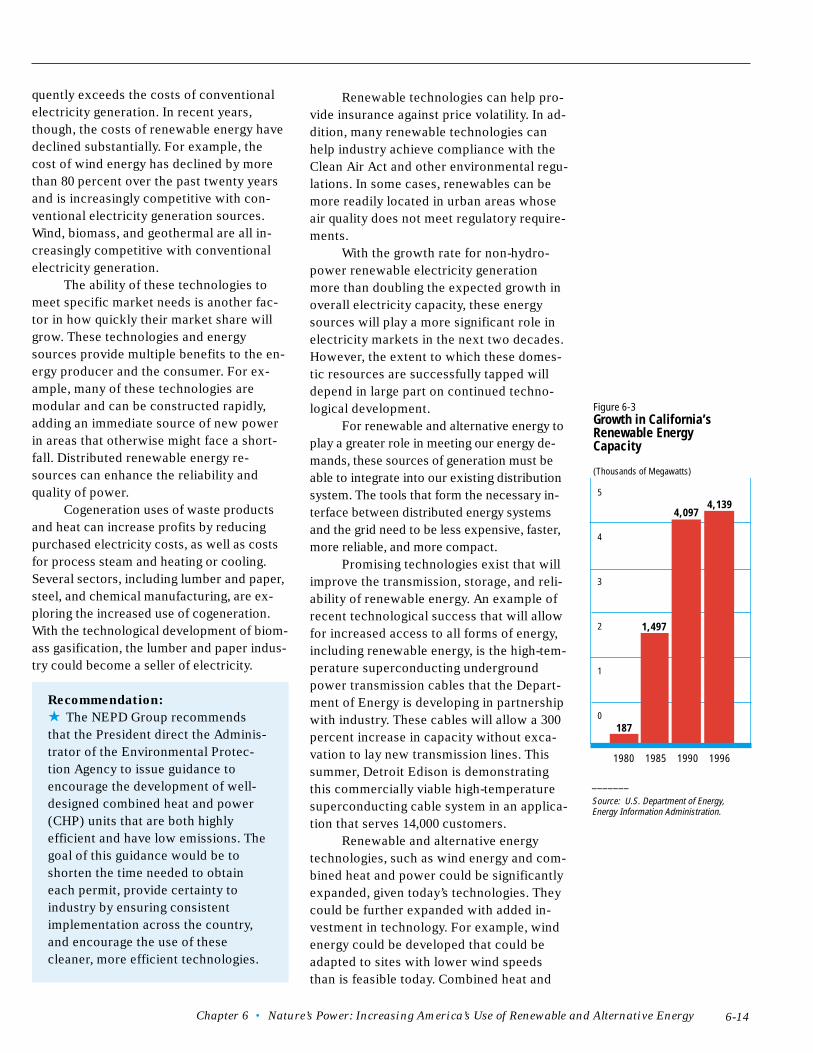
Chapter 6 • Nature’s Power: Increasing America’s Use of Renewable and Alternative Energy 6-14
quently exceeds the costs of conventionalelectricity generation. In recent years,though, the costs of renewable energy havedeclined substantially. For example, thecost of wind energy has declined by morethan 80 percent over the past twenty yearsand is increasingly competitive with con-ventional electricity generation sources.Wind, biomass, and geothermal are all in-creasingly competitive with conventionalelectricity generation.
The ability of these technologies tomeet specific market needs is another fac-tor in how quickly their market share willgrow. These technologies and energysources provide multiple benefits to the en-ergy producer and the consumer. For ex-ample, many of these technologies aremodular and can be constructed rapidly,adding an immediate source of new powerin areas that otherwise might face a short-fall. Distributed renewable energy re-sources can enhance the reliability andquality of power.
Cogeneration uses of waste productsand heat can increase profits by reducingpurchased electricity costs, as well as costsfor process steam and heating or cooling.Several sectors, including lumber and paper,steel, and chemical manufacturing, are ex-ploring the increased use of cogeneration.With the technological development of biom-ass gasification, the lumber and paper indus-try could become a seller of electricity.
Recommendation:
★ The NEPD Group recommendsthat the President direct the Adminis-trator of the Environmental Protec-tion Agency to issue guidance toencourage the development of well-designed combined heat and power(CHP) units that are both highlyefficient and have low emissions. Thegoal of this guidance would be toshorten the time needed to obtaineach permit, provide certainty toindustry by ensuring consistentimplementation across the country,and encourage the use of thesecleaner, more efficient technologies.
Renewable technologies can help pro-vide insurance against price volatility. In ad-dition, many renewable technologies canhelp industry achieve compliance with theClean Air Act and other environmental regu-lations. In some cases, renewables can bemore readily located in urban areas whoseair quality does not meet regulatory require-ments.
With the growth rate for non-hydro-power renewable electricity generationmore than doubling the expected growth inoverall electricity capacity, these energysources will play a more significant role inelectricity markets in the next two decades.However, the extent to which these domes-tic resources are successfully tapped willdepend in large part on continued techno-logical development.
For renewable and alternative energy toplay a greater role in meeting our energy de-mands, these sources of generation must beable to integrate into our existing distributionsystem. The tools that form the necessary in-terface between distributed energy systemsand the grid need to be less expensive, faster,more reliable, and more compact.
Promising technologies exist that willimprove the transmission, storage, and reli-ability of renewable energy. An example ofrecent technological success that will allowfor increased access to all forms of energy,including renewable energy, is the high-tem-perature superconducting undergroundpower transmission cables that the Depart-ment of Energy is developing in partnershipwith industry. These cables will allow a 300percent increase in capacity without exca-vation to lay new transmission lines. Thissummer, Detroit Edison is demonstratingthis commercially viable high-temperaturesuperconducting cable system in an applica-tion that serves 14,000 customers.
Renewable and alternative energytechnologies, such as wind energy and com-bined heat and power could be significantlyexpanded, given today’s technologies. Theycould be further expanded with added in-vestment in technology. For example, windenergy could be developed that could beadapted to sites with lower wind speedsthan is feasible today. Combined heat and
1980 1985 1990 1996
_______
Source: U.S. Department of Energy,Energy Information Administration.
4,139
Figure 6-3Growth in California’sRenewable EnergyCapacity
(Thousands of Megawatts)
5
4
3
2
1
0187
4,097
1,497
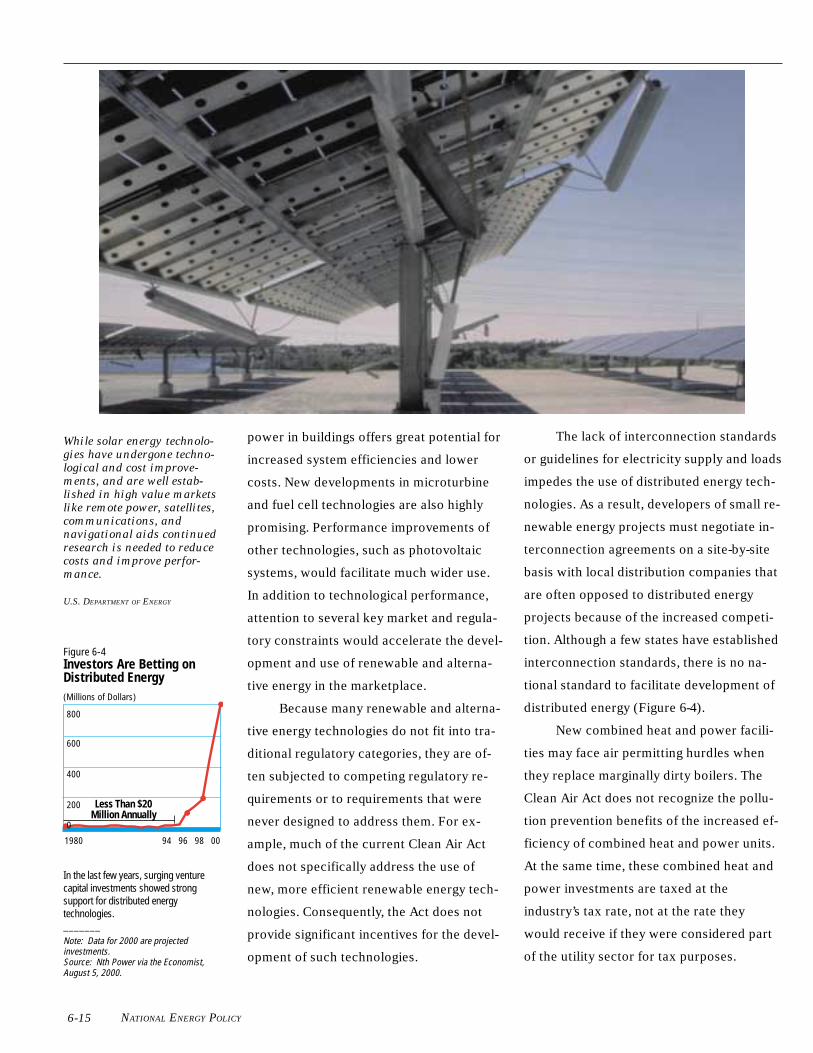
NATIONAL ENERGY POLICY 6-15
power in buildings offers great potential for
increased system efficiencies and lower
costs. New developments in microturbine
and fuel cell technologies are also highly
promising. Performance improvements of
other technologies, such as photovoltaic
systems, would facilitate much wider use.
In addition to technological performance,
attention to several key market and regula-
tory constraints would accelerate the devel-
opment and use of renewable and alterna-
tive energy in the marketplace.
Because many renewable and alterna-
tive energy technologies do not fit into tra-
ditional regulatory categories, they are of-
ten subjected to competing regulatory re-
quirements or to requirements that were
never designed to address them. For ex-
ample, much of the current Clean Air Act
does not specifically address the use of
new, more efficient renewable energy tech-
nologies. Consequently, the Act does not
provide significant incentives for the devel-
opment of such technologies.
The lack of interconnection standards
or guidelines for electricity supply and loads
impedes the use of distributed energy tech-
nologies. As a result, developers of small re-
newable energy projects must negotiate in-
terconnection agreements on a site-by-site
basis with local distribution companies that
are often opposed to distributed energy
projects because of the increased competi-
tion. Although a few states have established
interconnection standards, there is no na-
tional standard to facilitate development of
distributed energy (Figure 6-4).
New combined heat and power facili-
ties may face air permitting hurdles when
they replace marginally dirty boilers. The
Clean Air Act does not recognize the pollu-
tion prevention benefits of the increased ef-
ficiency of combined heat and power units.
At the same time, these combined heat and
power investments are taxed at the
industry’s tax rate, not at the rate they
would receive if they were considered part
of the utility sector for tax purposes. modifi-
While solar energy technolo-
gies have undergone techno-
logical and cost improve-
ments, and are well estab-
lished in high value markets
like remote power, satellites,
communications, and
navigational aids continued
research is needed to reduce
costs and improve perfor-
mance.
U.S. DEPARTMENT OF ENERGY
Figure 6-4Investors Are Betting onDistributed Energy(Millions of Dollars)
In the last few years, surging venturecapital investments showed strongsupport for distributed energytechnologies._______Note: Data for 2000 are projectedinvestments.Source: Nth Power via the Economist,August 5, 2000.
1980 94 96 98 00
Less Than $20Million Annually
800
600
400
200
0
Chapter 6 • Nature’s Power: Increasing America’s Use of Renewable and Alternative Energy 6-16
In addition, modifications to permitting and
siting requirements may be necessary to fa-
cilitate the incorporation of these technolo-
gies into buildings.
The infrastructure needed for increas-
ing the use of renewable and alternative en-
ergy varies considerably. In particular, the
alternative fuels infrastructure lags far be-
hind the existing infrastructure for conven-
tional fuels. The lack of infrastructure for al-
ternative fuels is a major obstacle to con-
sumer acceptance of alternative fuels and
the purchase of alternative fuel vehicles. It
is also one of the main reasons why most al-
ternative fuel vehicles actually operate on
petroleum fuels, such as gasoline and diesel.
In addition, a considerable enlargement of
ethanol production and distribution capac-
ity would be required to expand beyond
their current base in the Midwest in order to
increase use of ethanol-blended fuels.
The use of natural gas or electricity for
vehicles requires enhancements to these
distribution systems, such as compression
stations for natural gas. While many alterna-
tive fuels can be shipped by pipeline, they
may require separation within the pipeline
to avoid mixing different energy products.
Geographically dispersed renewable energy
plants often face significant transmission
barriers, including unfavorable grid sched-
ule policies and increased embedded costs.
Uncertainty regarding the tax treat-
ment of these technologies and energy
sources can discourage long-term invest-
ment. Though existing tax credits provide
an incentive for investing in some types of
renewable energy, the limited scope of the
credit and its frequent expiration discour-
ages investment.
NATIONAL ENERGY POLICY6-17
Summary of Recommendations
Nature’s Power: Increasing America’s Use of Renewable and
Alternative Energy
★ The NEPD Group recommends that the President direct the Secretaries of theInterior and Energy to re-evaluate access limitations to federal lands in order toincrease renewable energy production, such as biomass, wind, geothermal, and solar.
★ The NEPD Group supports the increase of $39.2 million in the FY 2002 budgetamendment for the Department of Energy’s Energy Supply account that wouldprovide increased support for research and development of renewable energy re-sources.
★ The NEPD Group recommends that the President direct the Secretary of Energy toconduct a review of current funding and historic performance of renewable energyand alternative energy research and development programs in light of the recommen-dations of this report. Based on this review, the Secretary of Energy is then directed topropose appropriate funding of those research and development programs that areperformance-based and are modeled as public-private partnerships.
★ The NEPD Group recommends that the President direct the Secretary of theTreasury to work with Congress on legislation to expand the section 29 tax credit tomake it available for new landfill methane projects. The credit could be tiered,depending on whether a landfill is already required by federal law to collect and flareits methane emissions due to local air pollution concerns.
★ The NEPD Group recommends that the President direct the Secretary of theInterior to determine ways to reduce the delays in geothermal lease processing as partof the permitting review process.
★ The NEPD Group recommends that the President direct the Administrator of theEnvironmental Protection Agency to develop a new renewable energy partnershipprogram to help companies more easily buy renewable energy, as well as receiverecognition for the environmental benefits of their purchase, and help consumers bypromoting consumer choice programs that increase their knowledge about theenvironmental benefits of purchasing renewable energy.
★ The NEPD Group recommends that the President direct the Secretary of theTreasury to work with Congress on legislation to extend and expand tax credits forelectricity produced using wind and biomass. The President’s budget request extendsthe present 1.7 cents per kilowatt hour tax credit for electricity produced from windand biomass; expands eligible biomass sources to include forest-related sources,agricultural sources, and certain urban sources; and allows a credit for electricityproduced from biomass co-fired with coal.
★ The NEPD Group recommends that the President direct the Secretary of theTreasury to work with Congress on legislation to provide a new 15 percent tax creditfor residential solar energy property, up to a maximum credit of $2,000.
★ The NEPD Group recommends that the President direct the Secretaries of theInterior and Energy to work with Congress on legislation to use an estimated $1.2billion of bid bonuses from the environmentally responsible leasing of ANWR forfunding research into alternative and renewable energy resources, including wind,solar, geothermal, and biomass.
Chapter 6 • Nature’s Power: Increasing America’s Use of Renewable and Alternative Energy
★ The NEPD Group recommends that the President direct the Secretary of theTreasury to work with Congress to continue the ethanol excise tax exemption.
★ The NEPD Group recommends that the President direct the Secretary of Energy todevelop next-generation technology—including hydrogen and fusion.• Develop an education campaign that communicates the benefits of alternative formsof energy, including hydrogen and fusion.• Focus research and development efforts on integrating current programs regardinghydrogen, fuel cells, and distributed energy.• Support legislation reauthorizing the Hydrogen Energy Act.
★ The NEPD Group recommends that the President direct the Secretary of theTreasury to work with Congress to develop legislation to provide for a temporaryincome tax credit available for the purchase of new hybrid or fuel-cell vehicles be-tween 2002 and 2007.
★ The NEPD Group recommends that the President direct the Administrator of theEnvironmental Protection Agency to issue guidance to encourage the development ofwell-designed combined heat and power (CHP) units that are both highly efficient andhave low emissions. The goal of this guidance would be to shorten the time needed toobtain each permit, provide certainty to industry by ensuring consistent implementa-tion across the country, and encourage the use of these cleaner, more efficient tech-nologies.
6-18
NATIONAL ENERGY POLICY7-1
O ne of the greatest energy chal-lenges facing America is the needto use 21st- century technologyto improve America’s aging en-ergy infrastructure. Americans
need a comprehensive, long-term solutionto deliver energy to industry and consumersin a reliable and safe manner.
Our energy infrastructure is com-prised of many components, such as thephysical network of pipes for oil and natu-ral gas, electricity transmission lines andother means for transporting energy to con-sumers. This infrastructure also includes fa-cilities that turn raw natural resources intouseful energy products. The rail network,truck lines, and marine transportation arealso key components of America’s energyinfrastructure.
The energy industry has undergonemajor changes in the last two decades, andmore are expected. These changes affecthow our energy infrastructure operates. Forexample, while the electricity industry wasonce vertically integrated, it is increasinglyseparated into three isolated segments: gen-eration, transmission, and distribution.
Our energy infrastructure has failed tokeep pace with the changing requirementsof our energy system. Domestic refining ca-pacity has not matched increases in de-mand, requiring the United States to importrefined products. Natural gas pipelines havenot expanded sufficiently to meet demand.The electricity transmission system is con-strained by insufficient capacity. Rail capac-ity was significantly increased during the1970s when rail facilities were improved tomove more coal. Since then, however, fewadditions to the coal transportation rail net-work have been built.
The United States needs to modernizeits energy infrastructure. One sign of a lackof an energy policy in recent years has beenthe failure to maintain the infrastructureneeded to move energy where it is neededmost.
ElectricityThe electricity infrastructure includes
a nationwide power grid of long-distancetransmission lines that move electricity fromregion to region, as well as the local distribu-tion lines that carry electricity to homes andbusinesses. Electricity originates at powerplants, which are primarily fueled by coal,nuclear, natural gas, water and, to a lesserextent, oil. Coal, natural gas and oil pow-ered plants require a dependable transporta-tion infrastructure to deliver the fuels neces-sary for the production of electricity. A trans-portation network for waste disposal is alsonecessary for power plants that create by-products.
RestructuringThe electricity industry has undergone
considerable changes in the last two de-cades. These changes affect how our elec-tricity infrastructure operates. Major indus-try restructuring has separated once verti-cally integrated electric utilities that sup-plied generation, transmission, and distribu-tion services into distinct entities. To facili-tate competition at the wholesale level, in1996, the Federal Energy Regulatory Com-mission (FERC) required transmission-own-ing utilities to “unbundle” their transmis-sion and power marketing functions, andprovide nondiscriminatory, open access totheir transmission systems by other utilities
America’s EnergyInfrastructureA Comprehensive Delivery System
U.S
. DE
PAR
TM
EN
T O
F E
NE
RG
Y
C H A P T E R S E V E N
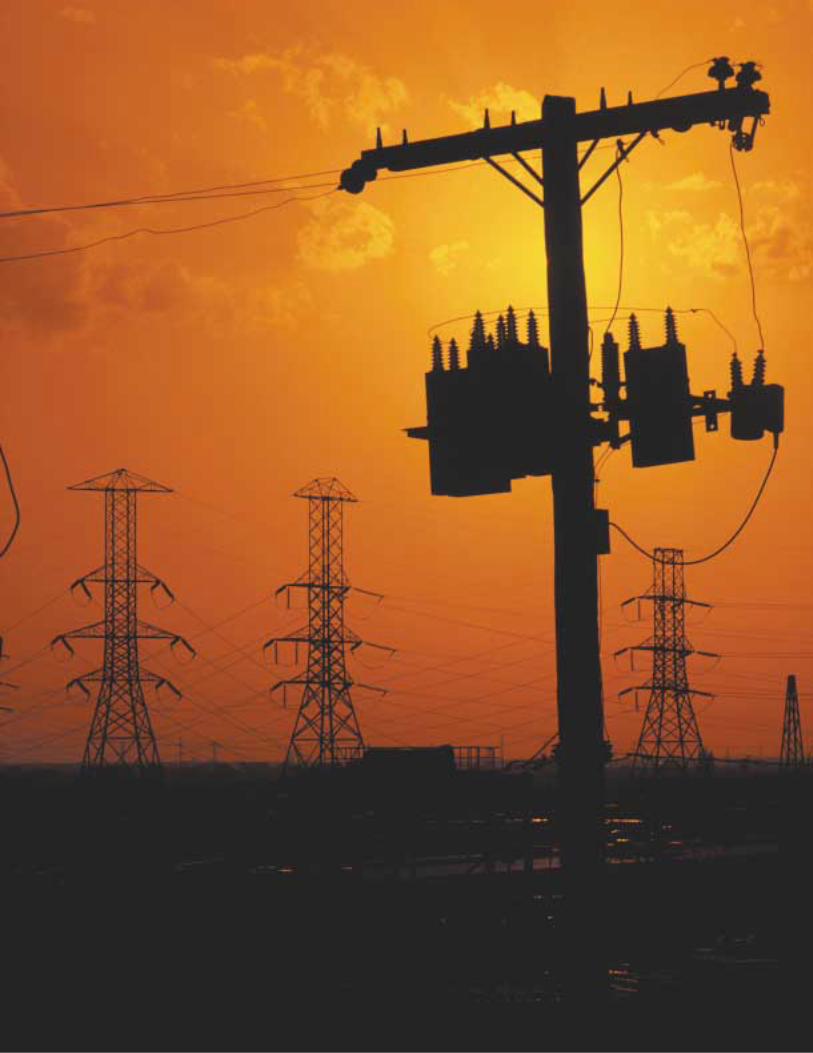
Chapter 7 • America’s Energy Infrastructure: A Comprehensive Delivery System
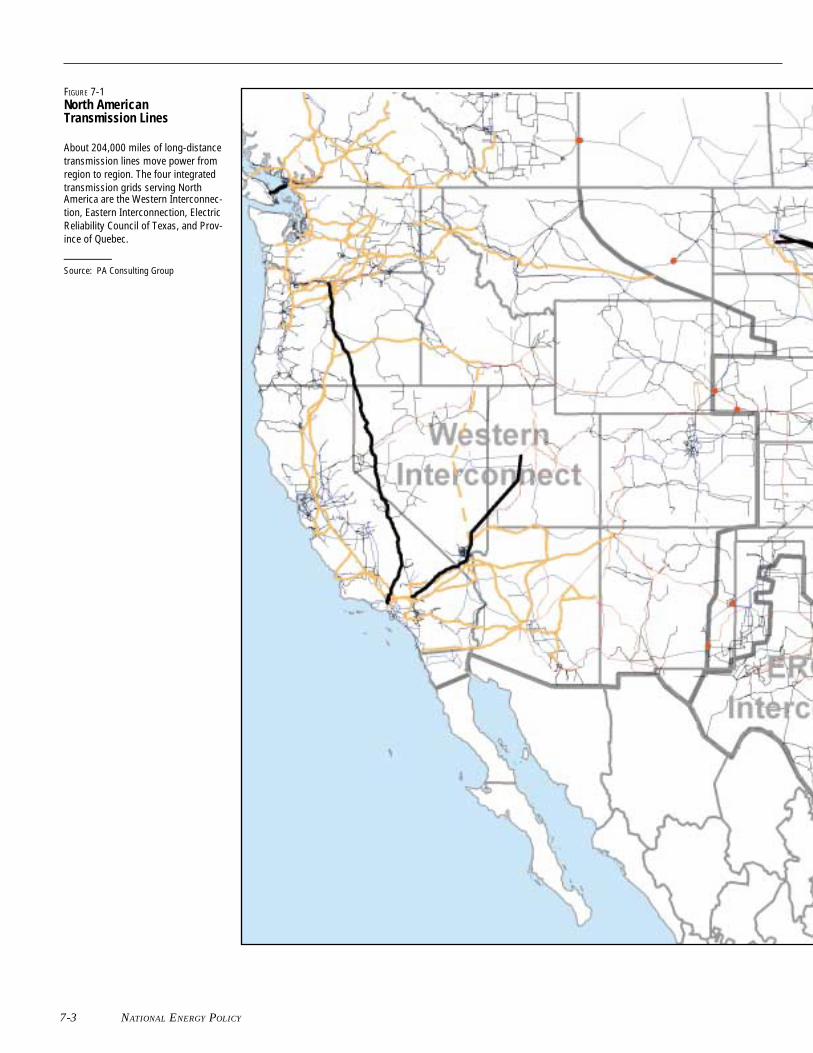
NATIONAL ENERGY POLICY7-3
FIGURE 7-1North AmericanTransmission Lines
About 204,000 miles of long-distancetransmission lines move power fromregion to region. The four integratedtransmission grids serving NorthAmerica are the Western Interconnec-tion, Eastern Interconnection, ElectricReliability Council of Texas, and Prov-ince of Quebec.______Source: PA Consulting Group
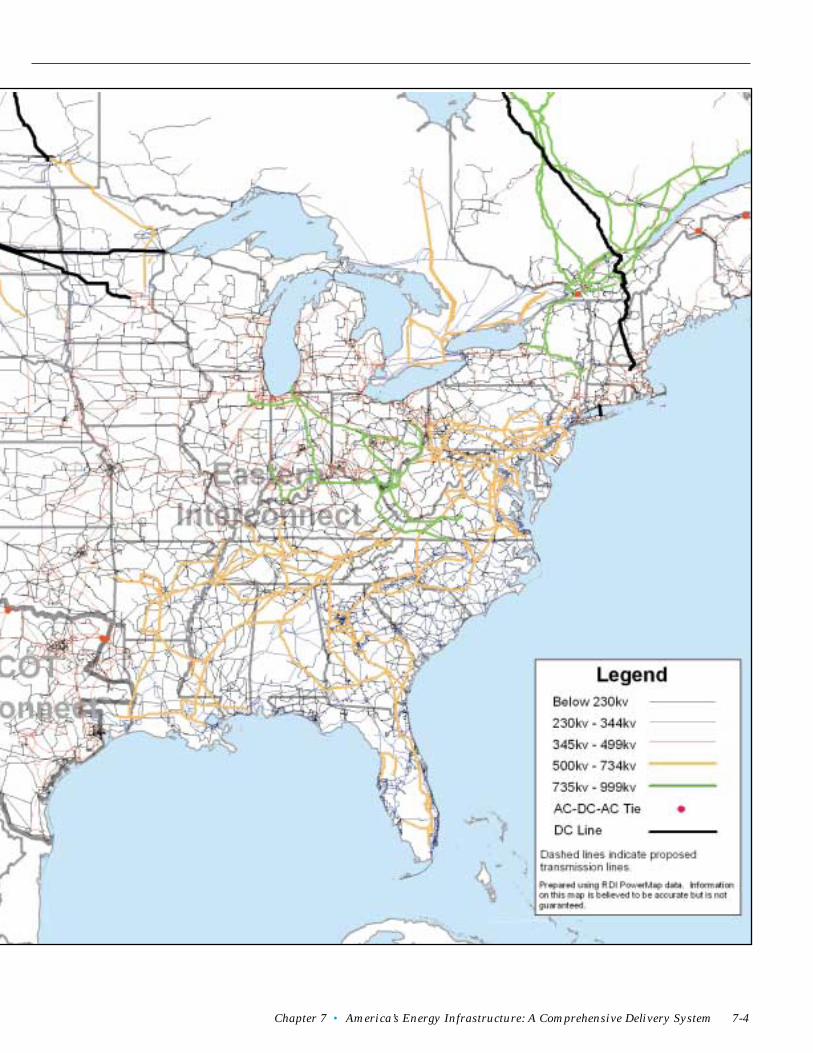
Chapter 7 • America’s Energy Infrastructure: A Comprehensive Delivery System 7-4
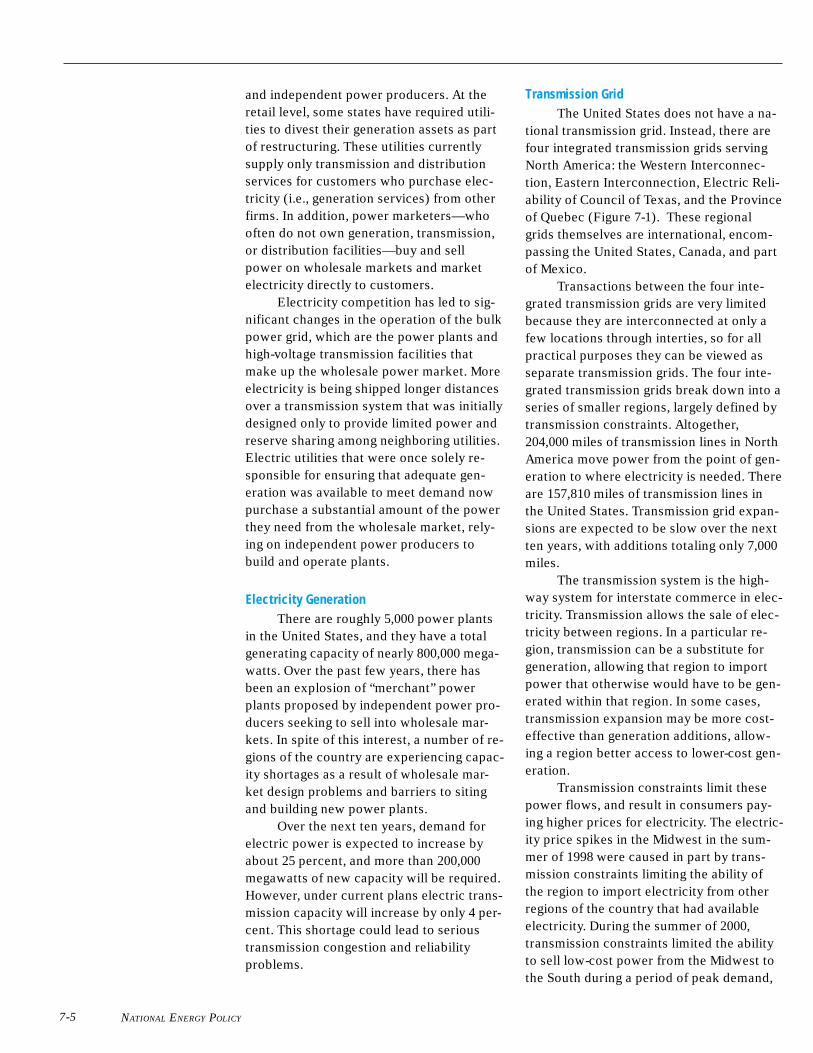
NATIONAL ENERGY POLICY
and independent power producers. At theretail level, some states have required utili-ties to divest their generation assets as partof restructuring. These utilities currentlysupply only transmission and distributionservices for customers who purchase elec-tricity (i.e., generation services) from otherfirms. In addition, power marketers—whooften do not own generation, transmission,or distribution facilities—buy and sellpower on wholesale markets and marketelectricity directly to customers.
Electricity competition has led to sig-nificant changes in the operation of the bulkpower grid, which are the power plants andhigh-voltage transmission facilities thatmake up the wholesale power market. Moreelectricity is being shipped longer distancesover a transmission system that was initiallydesigned only to provide limited power andreserve sharing among neighboring utilities.Electric utilities that were once solely re-sponsible for ensuring that adequate gen-eration was available to meet demand nowpurchase a substantial amount of the powerthey need from the wholesale market, rely-ing on independent power producers tobuild and operate plants.
Electricity GenerationThere are roughly 5,000 power plants
in the United States, and they have a totalgenerating capacity of nearly 800,000 mega-watts. Over the past few years, there hasbeen an explosion of “merchant” powerplants proposed by independent power pro-ducers seeking to sell into wholesale mar-kets. In spite of this interest, a number of re-gions of the country are experiencing capac-ity shortages as a result of wholesale mar-ket design problems and barriers to sitingand building new power plants.
Over the next ten years, demand forelectric power is expected to increase byabout 25 percent, and more than 200,000megawatts of new capacity will be required.However, under current plans electric trans-mission capacity will increase by only 4 per-cent. This shortage could lead to serioustransmission congestion and reliabilityproblems.
Transmission GridThe United States does not have a na-
tional transmission grid. Instead, there arefour integrated transmission grids servingNorth America: the Western Interconnec-tion, Eastern Interconnection, Electric Reli-ability of Council of Texas, and the Provinceof Quebec (Figure 7-1). These regionalgrids themselves are international, encom-passing the United States, Canada, and partof Mexico.
Transactions between the four inte-grated transmission grids are very limitedbecause they are interconnected at only afew locations through interties, so for allpractical purposes they can be viewed asseparate transmission grids. The four inte-grated transmission grids break down into aseries of smaller regions, largely defined bytransmission constraints. Altogether,204,000 miles of transmission lines in NorthAmerica move power from the point of gen-eration to where electricity is needed. Thereare 157,810 miles of transmission lines inthe United States. Transmission grid expan-sions are expected to be slow over the nextten years, with additions totaling only 7,000miles.
The transmission system is the high-way system for interstate commerce in elec-tricity. Transmission allows the sale of elec-tricity between regions. In a particular re-gion, transmission can be a substitute forgeneration, allowing that region to importpower that otherwise would have to be gen-erated within that region. In some cases,transmission expansion may be more cost-effective than generation additions, allow-ing a region better access to lower-cost gen-eration.
Transmission constraints limit thesepower flows, and result in consumers pay-ing higher prices for electricity. The electric-ity price spikes in the Midwest in the sum-mer of 1998 were caused in part by trans-mission constraints limiting the ability ofthe region to import electricity from otherregions of the country that had availableelectricity. During the summer of 2000,transmission constraints limited the abilityto sell low-cost power from the Midwest tothe South during a period of peak demand,
7-5
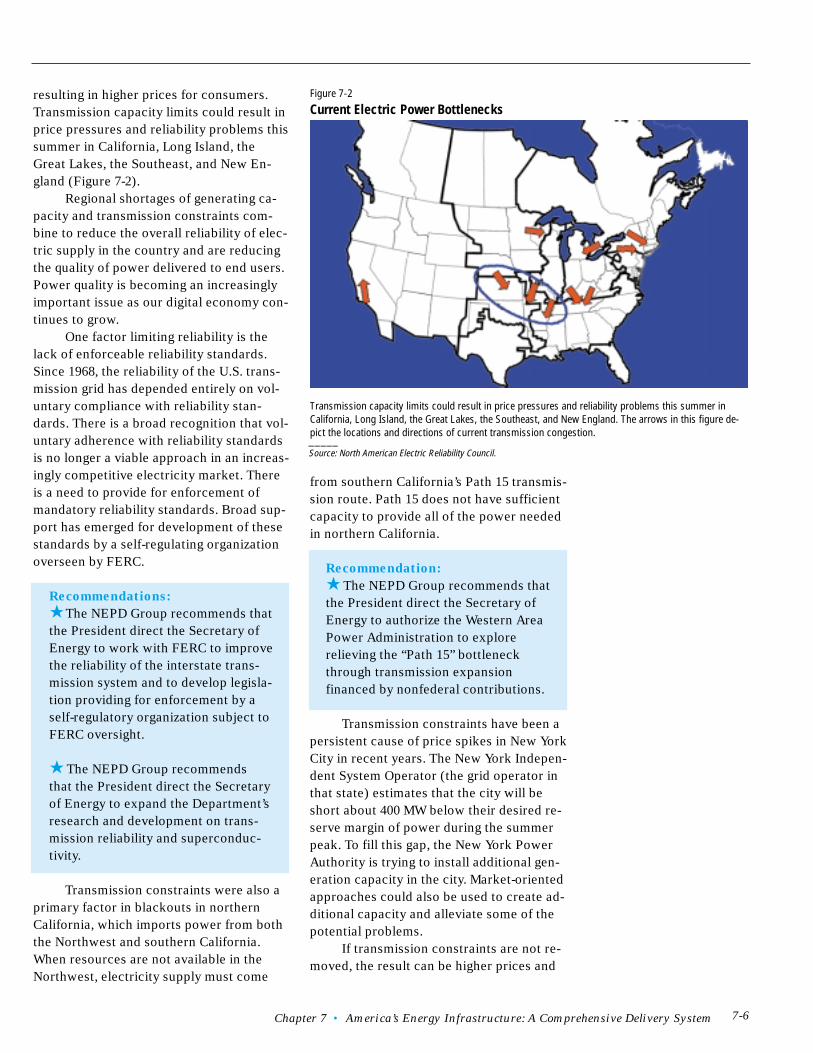
Chapter 7 • America’s Energy Infrastructure: A Comprehensive Delivery System
resulting in higher prices for consumers.Transmission capacity limits could result inprice pressures and reliability problems thissummer in California, Long Island, theGreat Lakes, the Southeast, and New En-gland (Figure 7-2).
Regional shortages of generating ca-pacity and transmission constraints com-bine to reduce the overall reliability of elec-tric supply in the country and are reducingthe quality of power delivered to end users.Power quality is becoming an increasinglyimportant issue as our digital economy con-tinues to grow.
One factor limiting reliability is thelack of enforceable reliability standards.Since 1968, the reliability of the U.S. trans-mission grid has depended entirely on vol-untary compliance with reliability stan-dards. There is a broad recognition that vol-untary adherence with reliability standardsis no longer a viable approach in an increas-ingly competitive electricity market. Thereis a need to provide for enforcement ofmandatory reliability standards. Broad sup-port has emerged for development of thesestandards by a self-regulating organizationoverseen by FERC.
Recommendations:
★ The NEPD Group recommends thatthe President direct the Secretary ofEnergy to work with FERC to improvethe reliability of the interstate trans-mission system and to develop legisla-tion providing for enforcement by aself-regulatory organization subject toFERC oversight.
★ The NEPD Group recommendsthat the President direct the Secretaryof Energy to expand the Department’sresearch and development on trans-mission reliability and superconduc-tivity.
Transmission constraints were also aprimary factor in blackouts in northernCalifornia, which imports power from boththe Northwest and southern California.When resources are not available in theNorthwest, electricity supply must come
from southern California’s Path 15 transmis-sion route. Path 15 does not have sufficientcapacity to provide all of the power neededin northern California.
Recommendation:
★ The NEPD Group recommends thatthe President direct the Secretary ofEnergy to authorize the Western AreaPower Administration to explorerelieving the “Path 15” bottleneckthrough transmission expansionfinanced by nonfederal contributions.
Transmission constraints have been apersistent cause of price spikes in New YorkCity in recent years. The New York Indepen-dent System Operator (the grid operator inthat state) estimates that the city will beshort about 400 MW below their desired re-serve margin of power during the summerpeak. To fill this gap, the New York PowerAuthority is trying to install additional gen-eration capacity in the city. Market-orientedapproaches could also be used to create ad-ditional capacity and alleviate some of thepotential problems.
If transmission constraints are not re-moved, the result can be higher prices and
Figure 7-2
Current Electric Power Bottlenecks
Transmission capacity limits could result in price pressures and reliability problems this summer inCalifornia, Long Island, the Great Lakes, the Southeast, and New England. The arrows in this figure de-pict the locations and directions of current transmission congestion._____Source: North American Electric Reliability Council.
7-6
NATIONAL ENERGY POLICY
state, and there was virtually no interstatecommerce in electricity. Congress did notanticipate the development of an interstateand international transmission system.
State decisions on where to locatetransmission lines often do not recognizethe importance of proposed transmission fa-cilities to the interstate grid. For example, arecent decision by regulators in Connecticutto block a proposed transmission line toLong Island did not recognize the need forelectricity on Long Island. Some state sitinglaws require that the benefits of a proposedtransmission facility accrue to the indi-vidual state, resulting in the rejection oftransmission proposals that benefit an en-tire region, rather than a single state.
Much has changed since 1935. Thetransmission system is the highway for in-terstate commerce in electricity. Transmis-sion constraints are resulting in higherprices for consumers and lower reliability.The siting process must be changed to re-flect the interstate nature of the transmis-sion system.
Recommendations:
★ The NEPD Group recommends thatthe President direct the appropriatefederal agencies to take actions to re-move constraints on the interstatetransmission grid and allow ournation’s electricity supply to meet thegrowing needs of our economy.• Direct the Secretary of Energy, by
December 31, 2001, to examine thebenefits of establishing a nationalgrid, identify transmission bottle-necks, and identify measures to re-move transmission bottlenecks.
• Direct the Secretary of Energy towork with FERC to relieve trans-mission constraints by encouragingthe use of incentive rate-makingproposals.
• Direct the federal utilities to deter-mine whether transmission expan-sions are necessary to remove con-straints. The Administration shouldreview the Bonneville PowerAdministration’s (BPA’s) capital and
Figure 7-3U.S. Investment in New Electric Power Transmission(Millions of 1990 Dollars)
1,400
1,200
1,000
800
600
0
400
310
300
290
280
270
260
0
1990 91 92 93 94 95 96 97 98
Growth in peak demand for electricity has far outstripped in-vestment in transmission capacity. As a result, transmissionconstraints could aggravate already limited supplies ofpower and could result in high prices in some areas of thecountry.________Source: PA Consulting Group, based on data from the UDI data base.
Transmission Investment
System Peak Demand
lower reliability. There are various reasonswhy transmission constraints exist. One isthe lack of sufficient investment in trans-mission. Transmission investment haslagged dramatically over the past decade(Figure 7-3). There is a need to ensure thattransmission rates create incentives for ad-equate investment in the transmission sys-tem, especially as restructuring leads to thecreation of transmission companies whoseonly business is operation of transmissionfacilities. FERC recognizes this need andhas expressed a willingness to consider in-novative transmission pricing proposals.
Another cause of transmission con-straints is the siting process. Under currentlaw, siting of transmission facilities is a re-sponsibility of state governments, not thefederal government, even though the trans-mission system is not only interstate butalso international, extending into bothCanada and Mexico. This stands in starkcontrast to siting of other interstate facili-ties, such as natural gas pipelines, oil pipe-lines, railroads, and interstate highways.
Federal law governing the responsibil-ity for siting transmission facilities waswritten in 1935, nearly 80 years ago. At thetime, transmission facilities were not inter-
7-7
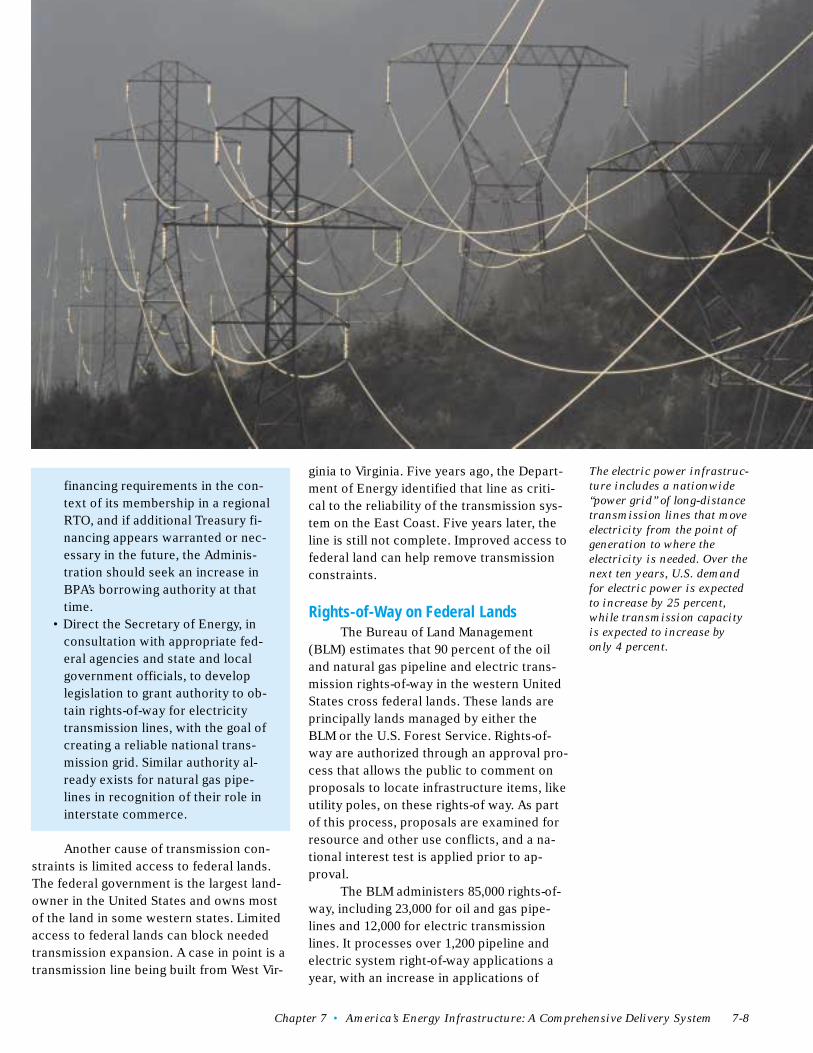
Chapter 7 • America’s Energy Infrastructure: A Comprehensive Delivery System
financing requirements in the con-text of its membership in a regionalRTO, and if additional Treasury fi-nancing appears warranted or nec-essary in the future, the Adminis-tration should seek an increase inBPA’s borrowing authority at thattime.
• Direct the Secretary of Energy, inconsultation with appropriate fed-eral agencies and state and localgovernment officials, to developlegislation to grant authority to ob-tain rights-of-way for electricitytransmission lines, with the goal ofcreating a reliable national trans-mission grid. Similar authority al-ready exists for natural gas pipe-lines in recognition of their role ininterstate commerce.
Another cause of transmission con-straints is limited access to federal lands.The federal government is the largest land-owner in the United States and owns mostof the land in some western states. Limitedaccess to federal lands can block neededtransmission expansion. A case in point is atransmission line being built from West Vir-
ginia to Virginia. Five years ago, the Depart-ment of Energy identified that line as criti-cal to the reliability of the transmission sys-tem on the East Coast. Five years later, theline is still not complete. Improved access tofederal land can help remove transmissionconstraints.
Rights-of-Way on Federal LandsThe Bureau of Land Management
(BLM) estimates that 90 percent of the oiland natural gas pipeline and electric trans-mission rights-of-way in the western UnitedStates cross federal lands. These lands areprincipally lands managed by either theBLM or the U.S. Forest Service. Rights-of-way are authorized through an approval pro-cess that allows the public to comment onproposals to locate infrastructure items, likeutility poles, on these rights-of way. As partof this process, proposals are examined forresource and other use conflicts, and a na-tional interest test is applied prior to ap-proval.
The BLM administers 85,000 rights-of-way, including 23,000 for oil and gas pipe-lines and 12,000 for electric transmissionlines. It processes over 1,200 pipeline andelectric system right-of-way applications ayear, with an increase in applications of
The electric power infrastruc-
ture includes a nationwide
“power grid” of long-distance
transmission lines that move
electricity from the point of
generation to where the
electricity is needed. Over the
next ten years, U.S. demand
for electric power is expected
to increase by 25 percent,
while transmission capacity
is expected to increase by
only 4 percent.
7-8
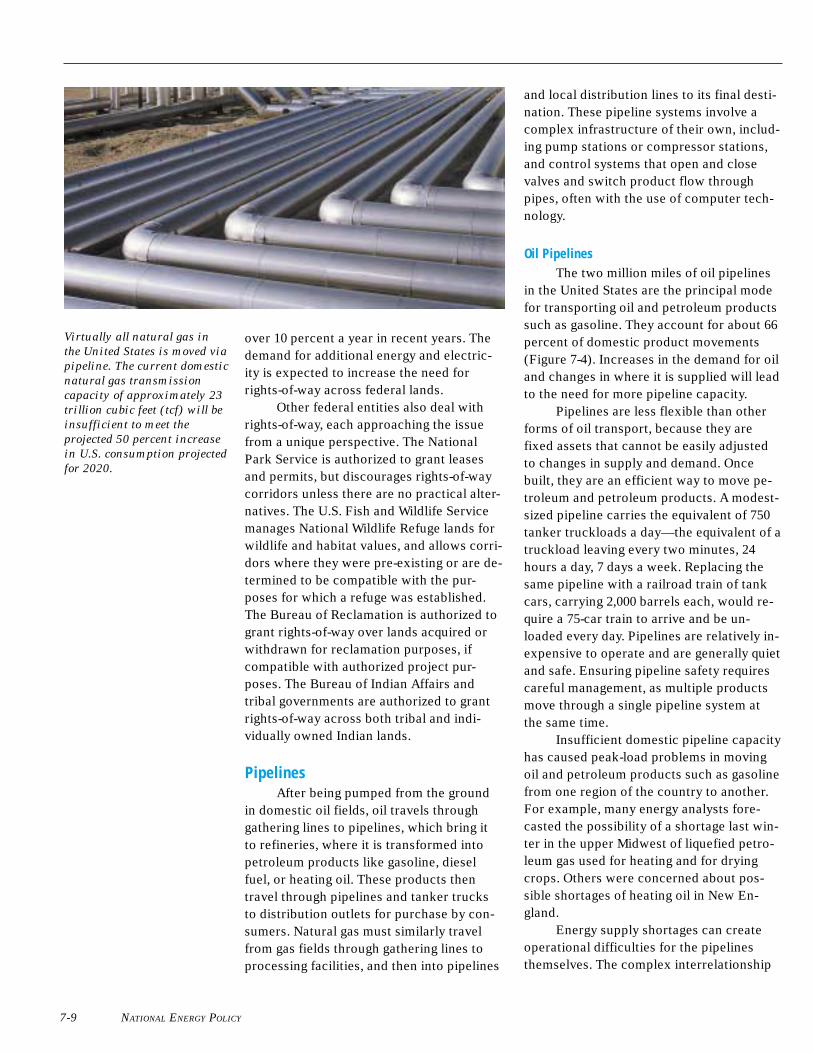
NATIONAL ENERGY POLICY
over 10 percent a year in recent years. Thedemand for additional energy and electric-ity is expected to increase the need forrights-of-way across federal lands.
Other federal entities also deal withrights-of-way, each approaching the issuefrom a unique perspective. The NationalPark Service is authorized to grant leasesand permits, but discourages rights-of-waycorridors unless there are no practical alter-natives. The U.S. Fish and Wildlife Servicemanages National Wildlife Refuge lands forwildlife and habitat values, and allows corri-dors where they were pre-existing or are de-termined to be compatible with the pur-poses for which a refuge was established.The Bureau of Reclamation is authorized togrant rights-of-way over lands acquired orwithdrawn for reclamation purposes, ifcompatible with authorized project pur-poses. The Bureau of Indian Affairs andtribal governments are authorized to grantrights-of-way across both tribal and indi-vidually owned Indian lands.
PipelinesAfter being pumped from the ground
in domestic oil fields, oil travels throughgathering lines to pipelines, which bring itto refineries, where it is transformed intopetroleum products like gasoline, dieselfuel, or heating oil. These products thentravel through pipelines and tanker trucksto distribution outlets for purchase by con-sumers. Natural gas must similarly travelfrom gas fields through gathering lines toprocessing facilities, and then into pipelines
and local distribution lines to its final desti-nation. These pipeline systems involve acomplex infrastructure of their own, includ-ing pump stations or compressor stations,and control systems that open and closevalves and switch product flow throughpipes, often with the use of computer tech-nology.
Oil PipelinesThe two million miles of oil pipelines
in the United States are the principal modefor transporting oil and petroleum productssuch as gasoline. They account for about 66percent of domestic product movements(Figure 7-4). Increases in the demand for oiland changes in where it is supplied will leadto the need for more pipeline capacity.
Pipelines are less flexible than otherforms of oil transport, because they arefixed assets that cannot be easily adjustedto changes in supply and demand. Oncebuilt, they are an efficient way to move pe-troleum and petroleum products. A modest-sized pipeline carries the equivalent of 750tanker truckloads a day—the equivalent of atruckload leaving every two minutes, 24hours a day, 7 days a week. Replacing thesame pipeline with a railroad train of tankcars, carrying 2,000 barrels each, would re-quire a 75-car train to arrive and be un-loaded every day. Pipelines are relatively in-expensive to operate and are generally quietand safe. Ensuring pipeline safety requirescareful management, as multiple productsmove through a single pipeline system atthe same time.
Insufficient domestic pipeline capacityhas caused peak-load problems in movingoil and petroleum products such as gasolinefrom one region of the country to another.For example, many energy analysts fore-casted the possibility of a shortage last win-ter in the upper Midwest of liquefied petro-leum gas used for heating and for dryingcrops. Others were concerned about pos-sible shortages of heating oil in New En-gland.
Energy supply shortages can createoperational difficulties for the pipelinesthemselves. The complex interrelationship
7-9
Virtually all natural gas in
the United States is moved via
pipeline. The current domestic
natural gas transmission
capacity of approximately 23
trillion cubic feet (tcf) will be
insufficient to meet the
projected 50 percent increase
in U.S. consumption projected
for 2020.
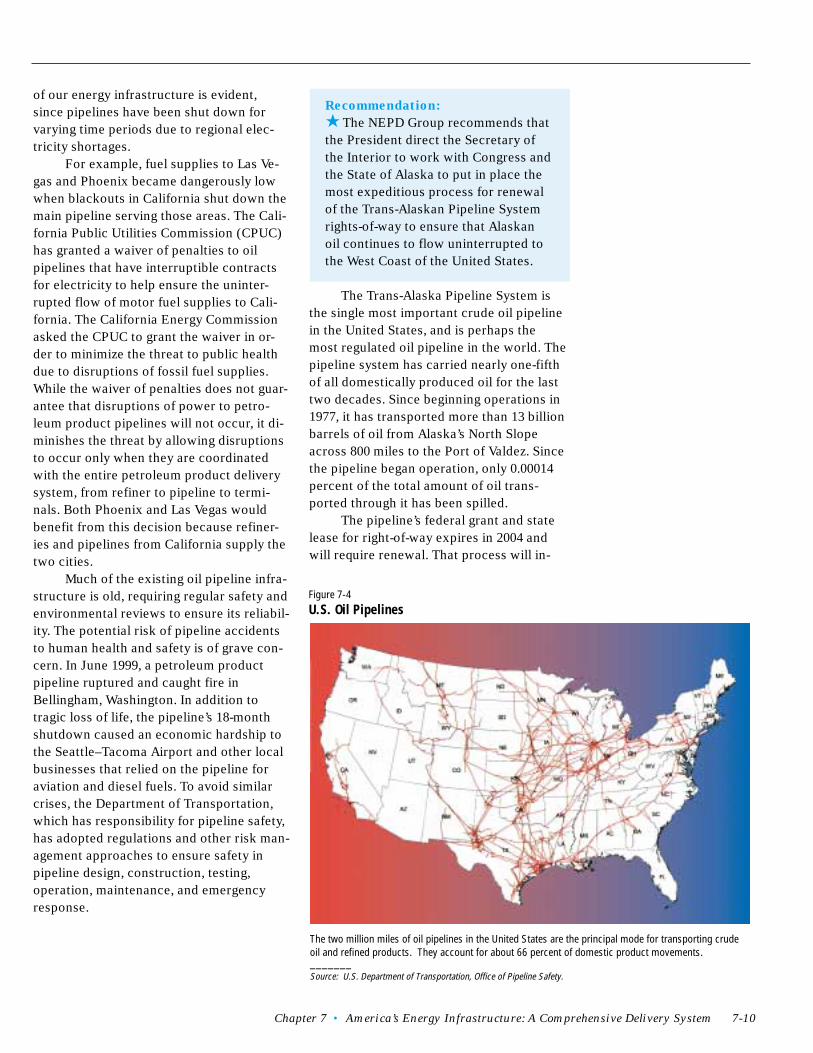
Chapter 7 • America’s Energy Infrastructure: A Comprehensive Delivery System
of our energy infrastructure is evident,since pipelines have been shut down forvarying time periods due to regional elec-tricity shortages.
For example, fuel supplies to Las Ve-gas and Phoenix became dangerously lowwhen blackouts in California shut down themain pipeline serving those areas. The Cali-fornia Public Utilities Commission (CPUC)has granted a waiver of penalties to oilpipelines that have interruptible contractsfor electricity to help ensure the uninter-rupted flow of motor fuel supplies to Cali-fornia. The California Energy Commissionasked the CPUC to grant the waiver in or-der to minimize the threat to public healthdue to disruptions of fossil fuel supplies.While the waiver of penalties does not guar-antee that disruptions of power to petro-leum product pipelines will not occur, it di-minishes the threat by allowing disruptionsto occur only when they are coordinatedwith the entire petroleum product deliverysystem, from refiner to pipeline to termi-nals. Both Phoenix and Las Vegas wouldbenefit from this decision because refiner-ies and pipelines from California supply thetwo cities.
Much of the existing oil pipeline infra-structure is old, requiring regular safety andenvironmental reviews to ensure its reliabil-ity. The potential risk of pipeline accidentsto human health and safety is of grave con-cern. In June 1999, a petroleum productpipeline ruptured and caught fire inBellingham, Washington. In addition totragic loss of life, the pipeline’s 18-monthshutdown caused an economic hardship tothe Seattle–Tacoma Airport and other localbusinesses that relied on the pipeline foraviation and diesel fuels. To avoid similarcrises, the Department of Transportation,which has responsibility for pipeline safety,has adopted regulations and other risk man-agement approaches to ensure safety inpipeline design, construction, testing,operation, maintenance, and emergencyresponse.
Recommendation:
★ The NEPD Group recommends thatthe President direct the Secretary ofthe Interior to work with Congress andthe State of Alaska to put in place themost expeditious process for renewalof the Trans-Alaskan Pipeline Systemrights-of-way to ensure that Alaskanoil continues to flow uninterrupted tothe West Coast of the United States.
The Trans-Alaska Pipeline System isthe single most important crude oil pipelinein the United States, and is perhaps themost regulated oil pipeline in the world. Thepipeline system has carried nearly one-fifthof all domestically produced oil for the lasttwo decades. Since beginning operations in1977, it has transported more than 13 billionbarrels of oil from Alaska’s North Slopeacross 800 miles to the Port of Valdez. Sincethe pipeline began operation, only 0.00014percent of the total amount of oil trans-ported through it has been spilled.
The pipeline’s federal grant and statelease for right-of-way expires in 2004 andwill require renewal. That process will in-
Figure 7-4U.S. Oil Pipelines
The two million miles of oil pipelines in the United States are the principal mode for transporting crudeoil and refined products. They account for about 66 percent of domestic product movements._______Source: U.S. Department of Transportation, Office of Pipeline Safety.
7-10
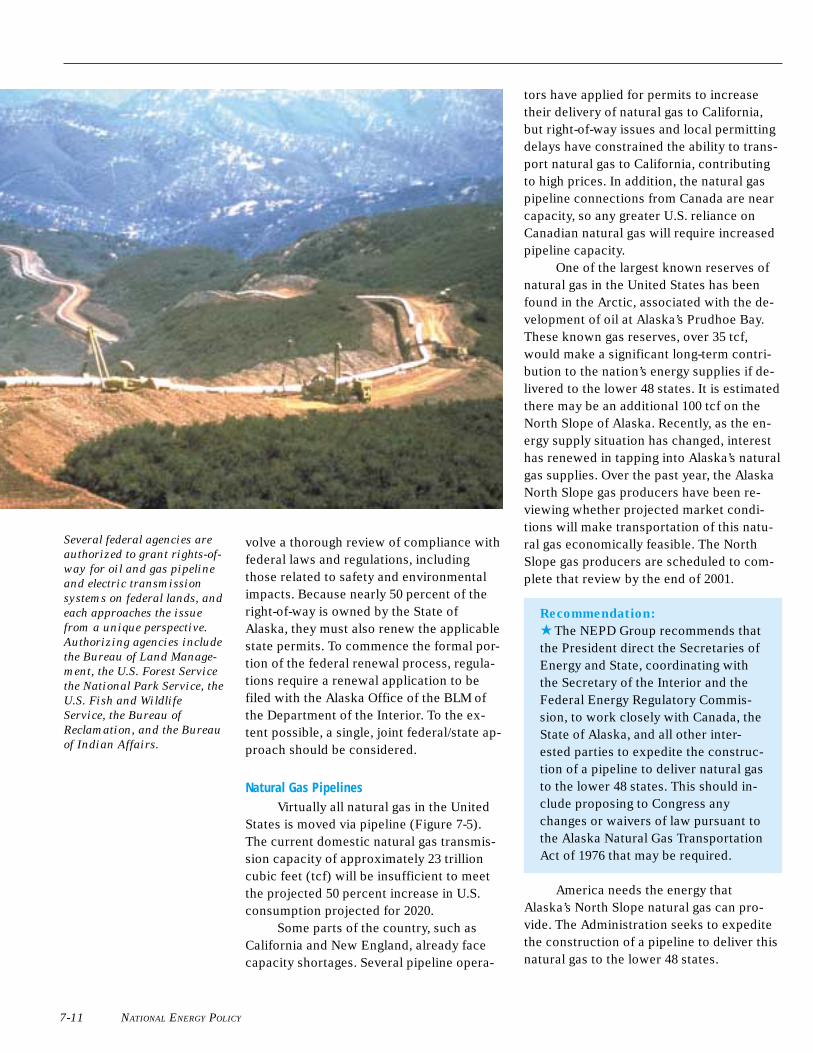
NATIONAL ENERGY POLICY
volve a thorough review of compliance withfederal laws and regulations, includingthose related to safety and environmentalimpacts. Because nearly 50 percent of theright-of-way is owned by the State ofAlaska, they must also renew the applicablestate permits. To commence the formal por-tion of the federal renewal process, regula-tions require a renewal application to befiled with the Alaska Office of the BLM ofthe Department of the Interior. To the ex-tent possible, a single, joint federal/state ap-proach should be considered.
Natural Gas PipelinesVirtually all natural gas in the United
States is moved via pipeline (Figure 7-5).The current domestic natural gas transmis-sion capacity of approximately 23 trillioncubic feet (tcf) will be insufficient to meetthe projected 50 percent increase in U.S.consumption projected for 2020.
Some parts of the country, such asCalifornia and New England, already facecapacity shortages. Several pipeline opera-
tors have applied for permits to increasetheir delivery of natural gas to California,but right-of-way issues and local permittingdelays have constrained the ability to trans-port natural gas to California, contributingto high prices. In addition, the natural gaspipeline connections from Canada are nearcapacity, so any greater U.S. reliance onCanadian natural gas will require increasedpipeline capacity.
One of the largest known reserves ofnatural gas in the United States has beenfound in the Arctic, associated with the de-velopment of oil at Alaska’s Prudhoe Bay.These known gas reserves, over 35 tcf,would make a significant long-term contri-bution to the nation’s energy supplies if de-livered to the lower 48 states. It is estimatedthere may be an additional 100 tcf on theNorth Slope of Alaska. Recently, as the en-ergy supply situation has changed, interesthas renewed in tapping into Alaska’s naturalgas supplies. Over the past year, the AlaskaNorth Slope gas producers have been re-viewing whether projected market condi-tions will make transportation of this natu-ral gas economically feasible. The NorthSlope gas producers are scheduled to com-plete that review by the end of 2001.
Recommendation:
★ The NEPD Group recommends thatthe President direct the Secretaries ofEnergy and State, coordinating withthe Secretary of the Interior and theFederal Energy Regulatory Commis-sion, to work closely with Canada, theState of Alaska, and all other inter-ested parties to expedite the construc-tion of a pipeline to deliver natural gasto the lower 48 states. This should in-clude proposing to Congress anychanges or waivers of law pursuant tothe Alaska Natural Gas TransportationAct of 1976 that may be required.
America needs the energy thatAlaska’s North Slope natural gas can pro-vide. The Administration seeks to expeditethe construction of a pipeline to deliver thisnatural gas to the lower 48 states.
Several federal agencies are
authorized to grant rights-of-
way for oil and gas pipeline
and electric transmission
systems on federal lands, and
each approaches the issue
from a unique perspective.
Authorizing agencies include
the Bureau of Land Manage-
ment, the U.S. Forest Service
the National Park Service, the
U.S. Fish and Wildlife
Service, the Bureau of
Reclamation, and the Bureau
of Indian Affairs.
7-11
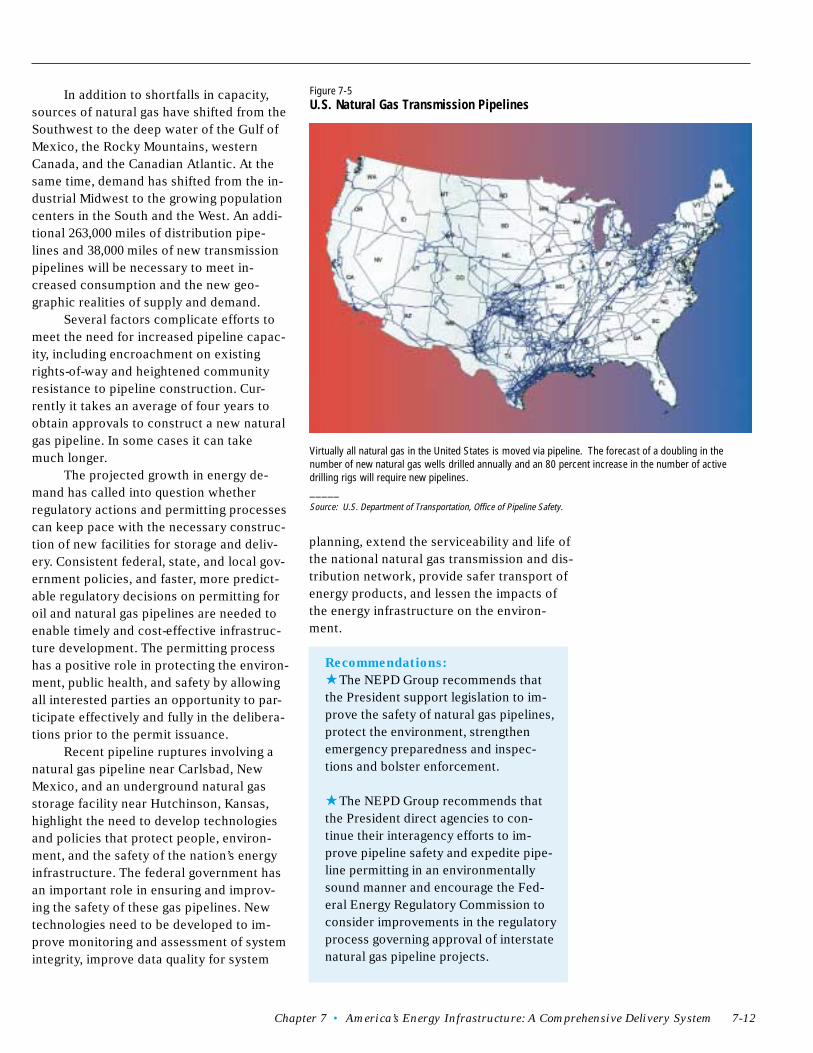
Chapter 7 • America’s Energy Infrastructure: A Comprehensive Delivery System
In addition to shortfalls in capacity,sources of natural gas have shifted from theSouthwest to the deep water of the Gulf ofMexico, the Rocky Mountains, westernCanada, and the Canadian Atlantic. At thesame time, demand has shifted from the in-dustrial Midwest to the growing populationcenters in the South and the West. An addi-tional 263,000 miles of distribution pipe-lines and 38,000 miles of new transmissionpipelines will be necessary to meet in-creased consumption and the new geo-graphic realities of supply and demand.
Several factors complicate efforts tomeet the need for increased pipeline capac-ity, including encroachment on existingrights-of-way and heightened communityresistance to pipeline construction. Cur-rently it takes an average of four years toobtain approvals to construct a new naturalgas pipeline. In some cases it can takemuch longer.
The projected growth in energy de-mand has called into question whetherregulatory actions and permitting processescan keep pace with the necessary construc-tion of new facilities for storage and deliv-ery. Consistent federal, state, and local gov-ernment policies, and faster, more predict-able regulatory decisions on permitting foroil and natural gas pipelines are needed toenable timely and cost-effective infrastruc-ture development. The permitting processhas a positive role in protecting the environ-ment, public health, and safety by allowingall interested parties an opportunity to par-ticipate effectively and fully in the delibera-tions prior to the permit issuance.
Recent pipeline ruptures involving anatural gas pipeline near Carlsbad, NewMexico, and an underground natural gasstorage facility near Hutchinson, Kansas,highlight the need to develop technologiesand policies that protect people, environ-ment, and the safety of the nation’s energyinfrastructure. The federal government hasan important role in ensuring and improv-ing the safety of these gas pipelines. Newtechnologies need to be developed to im-prove monitoring and assessment of systemintegrity, improve data quality for system
planning, extend the serviceability and life ofthe national natural gas transmission and dis-tribution network, provide safer transport ofenergy products, and lessen the impacts ofthe energy infrastructure on the environ-ment.
Recommendations:
★ The NEPD Group recommends thatthe President support legislation to im-prove the safety of natural gas pipelines,protect the environment, strengthenemergency preparedness and inspec-tions and bolster enforcement.
★ The NEPD Group recommends thatthe President direct agencies to con-tinue their interagency efforts to im-prove pipeline safety and expedite pipe-line permitting in an environmentallysound manner and encourage the Fed-eral Energy Regulatory Commission toconsider improvements in the regulatoryprocess governing approval of interstatenatural gas pipeline projects.
Figure 7-5U.S. Natural Gas Transmission Pipelines
Virtually all natural gas in the United States is moved via pipeline. The forecast of a doubling in thenumber of new natural gas wells drilled annually and an 80 percent increase in the number of activedrilling rigs will require new pipelines._____Source: U.S. Department of Transportation, Office of Pipeline Safety.
7-12
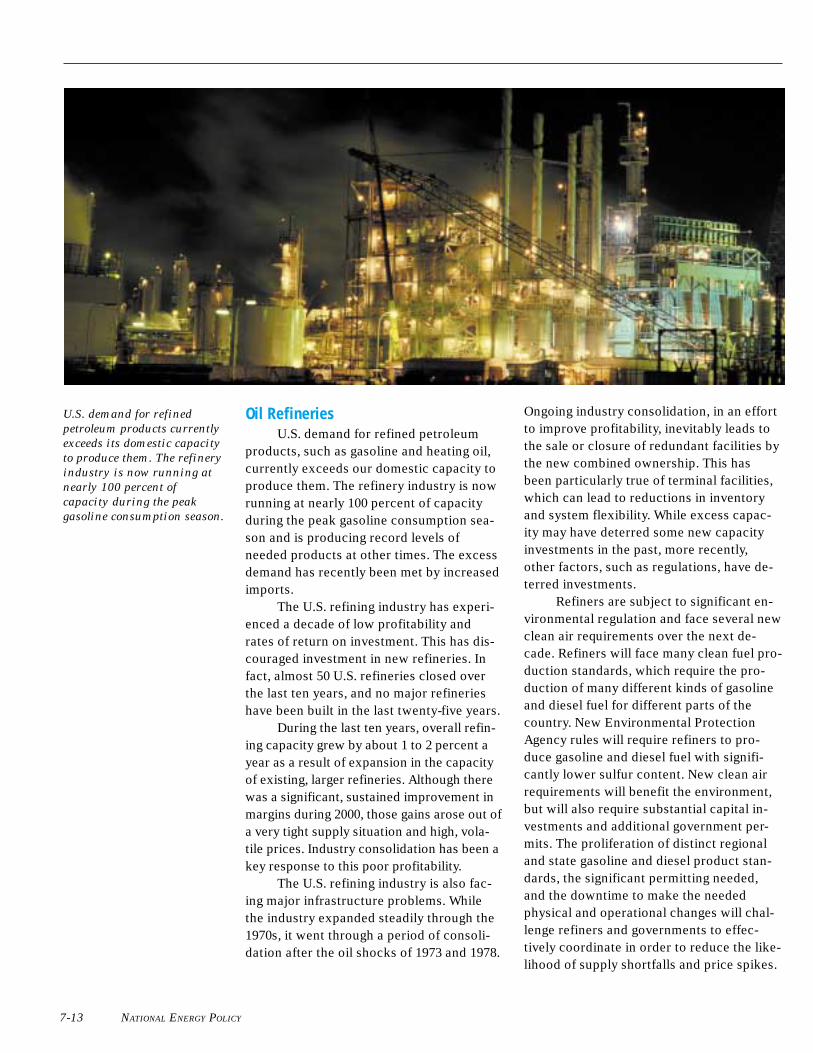
NATIONAL ENERGY POLICY
Oil RefineriesU.S. demand for refined petroleum
products, such as gasoline and heating oil,currently exceeds our domestic capacity toproduce them. The refinery industry is nowrunning at nearly 100 percent of capacityduring the peak gasoline consumption sea-son and is producing record levels ofneeded products at other times. The excessdemand has recently been met by increasedimports.
The U.S. refining industry has experi-enced a decade of low profitability andrates of return on investment. This has dis-couraged investment in new refineries. Infact, almost 50 U.S. refineries closed overthe last ten years, and no major refinerieshave been built in the last twenty-five years.
During the last ten years, overall refin-ing capacity grew by about 1 to 2 percent ayear as a result of expansion in the capacityof existing, larger refineries. Although therewas a significant, sustained improvement inmargins during 2000, those gains arose out ofa very tight supply situation and high, vola-tile prices. Industry consolidation has been akey response to this poor profitability.
The U.S. refining industry is also fac-ing major infrastructure problems. Whilethe industry expanded steadily through the1970s, it went through a period of consoli-dation after the oil shocks of 1973 and 1978.
Ongoing industry consolidation, in an effortto improve profitability, inevitably leads tothe sale or closure of redundant facilities bythe new combined ownership. This hasbeen particularly true of terminal facilities,which can lead to reductions in inventoryand system flexibility. While excess capac-ity may have deterred some new capacityinvestments in the past, more recently,other factors, such as regulations, have de-terred investments.
Refiners are subject to significant en-vironmental regulation and face several newclean air requirements over the next de-cade. Refiners will face many clean fuel pro-duction standards, which require the pro-duction of many different kinds of gasolineand diesel fuel for different parts of thecountry. New Environmental ProtectionAgency rules will require refiners to pro-duce gasoline and diesel fuel with signifi-cantly lower sulfur content. New clean airrequirements will benefit the environment,but will also require substantial capital in-vestments and additional government per-mits. The proliferation of distinct regionaland state gasoline and diesel product stan-dards, the significant permitting needed,and the downtime to make the neededphysical and operational changes will chal-lenge refiners and governments to effec-tively coordinate in order to reduce the like-lihood of supply shortfalls and price spikes.
U.S. demand for refined
petroleum products currently
exceeds its domestic capacity
to produce them. The refinery
industry is now running at
nearly 100 percent of
capacity during the peak
gasoline consumption season.
7-13
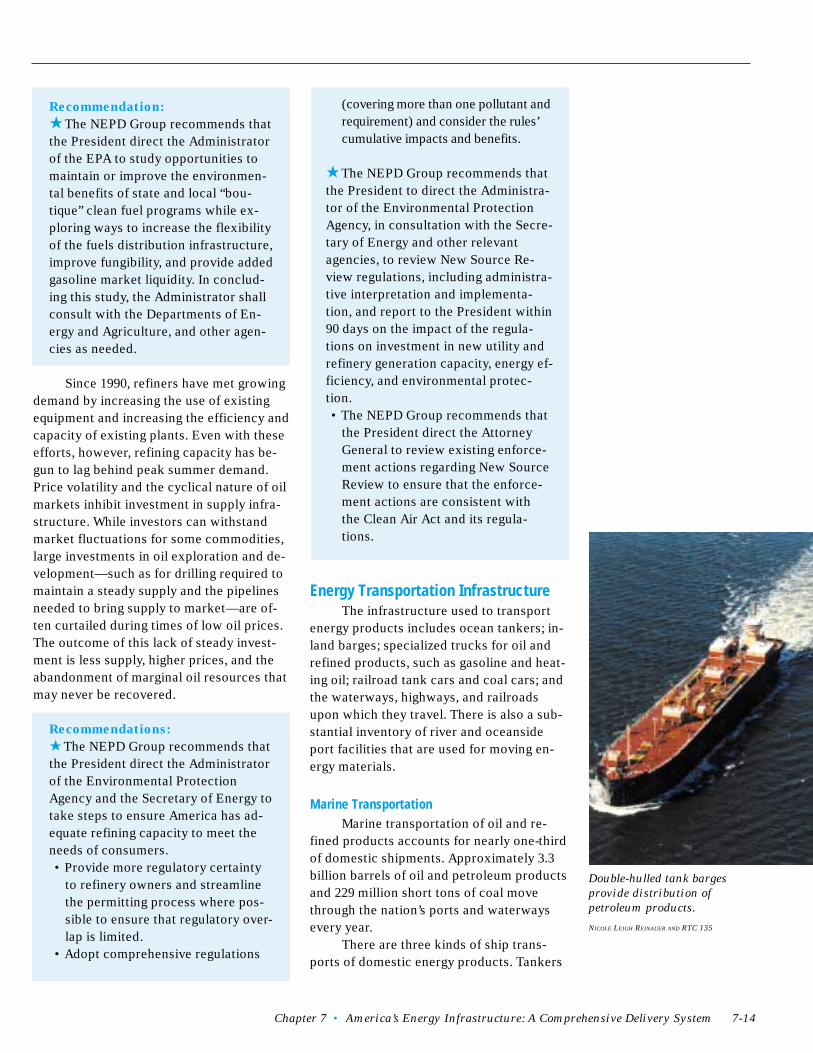
Chapter 7 • America’s Energy Infrastructure: A Comprehensive Delivery System
Recommendation:
★ The NEPD Group recommends thatthe President direct the Administratorof the EPA to study opportunities tomaintain or improve the environmen-tal benefits of state and local “bou-tique” clean fuel programs while ex-ploring ways to increase the flexibilityof the fuels distribution infrastructure,improve fungibility, and provide addedgasoline market liquidity. In conclud-ing this study, the Administrator shallconsult with the Departments of En-ergy and Agriculture, and other agen-cies as needed.
Since 1990, refiners have met growingdemand by increasing the use of existingequipment and increasing the efficiency andcapacity of existing plants. Even with theseefforts, however, refining capacity has be-gun to lag behind peak summer demand.Price volatility and the cyclical nature of oilmarkets inhibit investment in supply infra-structure. While investors can withstandmarket fluctuations for some commodities,large investments in oil exploration and de-velopment—such as for drilling required tomaintain a steady supply and the pipelinesneeded to bring supply to market—are of-ten curtailed during times of low oil prices.The outcome of this lack of steady invest-ment is less supply, higher prices, and theabandonment of marginal oil resources thatmay never be recovered.
Recommendations:
★ The NEPD Group recommends thatthe President direct the Administratorof the Environmental ProtectionAgency and the Secretary of Energy totake steps to ensure America has ad-equate refining capacity to meet theneeds of consumers.• Provide more regulatory certainty
to refinery owners and streamlinethe permitting process where pos-sible to ensure that regulatory over-lap is limited.
• Adopt comprehensive regulations
(covering more than one pollutant andrequirement) and consider the rules’cumulative impacts and benefits.
★ The NEPD Group recommends thatthe President to direct the Administra-tor of the Environmental ProtectionAgency, in consultation with the Secre-tary of Energy and other relevantagencies, to review New Source Re-view regulations, including administra-tive interpretation and implementa-tion, and report to the President within90 days on the impact of the regula-tions on investment in new utility andrefinery generation capacity, energy ef-ficiency, and environmental protec-tion.• The NEPD Group recommends that
the President direct the AttorneyGeneral to review existing enforce-ment actions regarding New SourceReview to ensure that the enforce-ment actions are consistent withthe Clean Air Act and its regula-tions.
Energy Transportation InfrastructureThe infrastructure used to transport
energy products includes ocean tankers; in-land barges; specialized trucks for oil andrefined products, such as gasoline and heat-ing oil; railroad tank cars and coal cars; andthe waterways, highways, and railroadsupon which they travel. There is also a sub-stantial inventory of river and oceansideport facilities that are used for moving en-ergy materials.
Marine TransportationMarine transportation of oil and re-
fined products accounts for nearly one-thirdof domestic shipments. Approximately 3.3billion barrels of oil and petroleum productsand 229 million short tons of coal movethrough the nation’s ports and waterwaysevery year.
There are three kinds of ship trans-ports of domestic energy products. Tankers
Double-hulled tank barges
provide distribution of
petroleum products.
NICOLE LEIGH REINAUER AND RTC 135
7-14
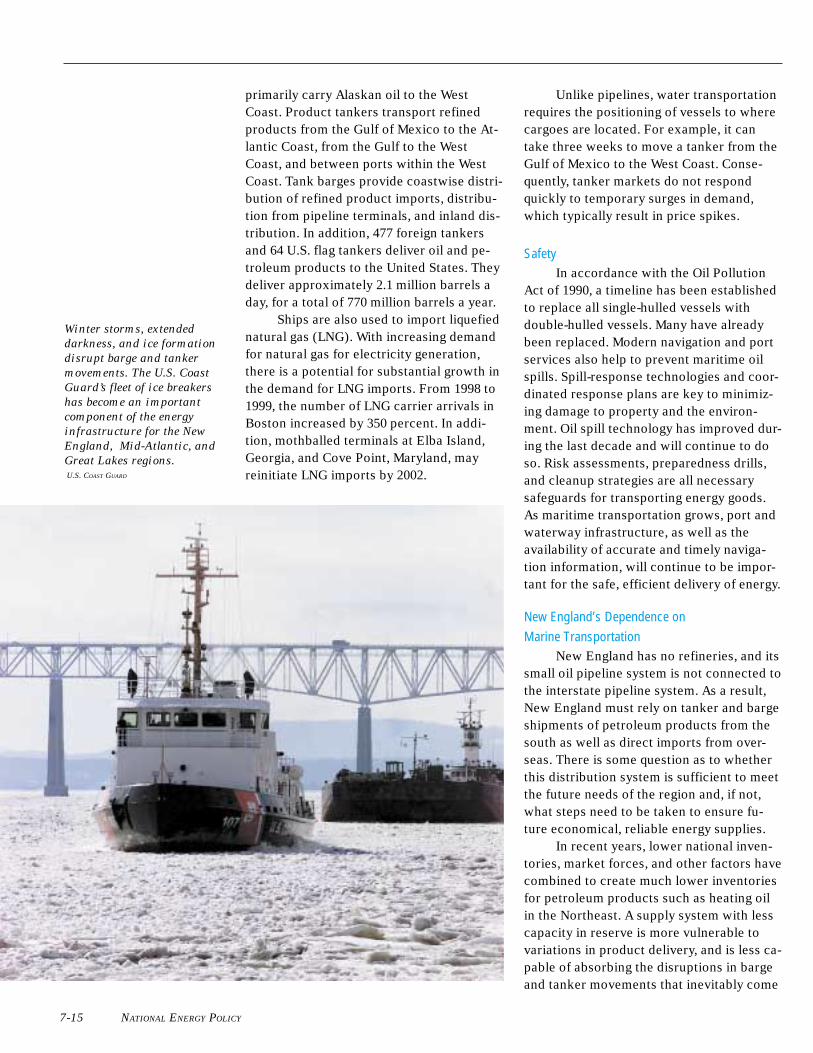
NATIONAL ENERGY POLICY
primarily carry Alaskan oil to the WestCoast. Product tankers transport refinedproducts from the Gulf of Mexico to the At-lantic Coast, from the Gulf to the WestCoast, and between ports within the WestCoast. Tank barges provide coastwise distri-bution of refined product imports, distribu-tion from pipeline terminals, and inland dis-tribution. In addition, 477 foreign tankersand 64 U.S. flag tankers deliver oil and pe-troleum products to the United States. Theydeliver approximately 2.1 million barrels aday, for a total of 770 million barrels a year.
Ships are also used to import liquefiednatural gas (LNG). With increasing demandfor natural gas for electricity generation,there is a potential for substantial growth inthe demand for LNG imports. From 1998 to1999, the number of LNG carrier arrivals inBoston increased by 350 percent. In addi-tion, mothballed terminals at Elba Island,Georgia, and Cove Point, Maryland, mayreinitiate LNG imports by 2002.
Unlike pipelines, water transportationrequires the positioning of vessels to wherecargoes are located. For example, it cantake three weeks to move a tanker from theGulf of Mexico to the West Coast. Conse-quently, tanker markets do not respondquickly to temporary surges in demand,which typically result in price spikes.
SafetyIn accordance with the Oil Pollution
Act of 1990, a timeline has been establishedto replace all single-hulled vessels withdouble-hulled vessels. Many have alreadybeen replaced. Modern navigation and portservices also help to prevent maritime oilspills. Spill-response technologies and coor-dinated response plans are key to minimiz-ing damage to property and the environ-ment. Oil spill technology has improved dur-ing the last decade and will continue to doso. Risk assessments, preparedness drills,and cleanup strategies are all necessarysafeguards for transporting energy goods.As maritime transportation grows, port andwaterway infrastructure, as well as theavailability of accurate and timely naviga-tion information, will continue to be impor-tant for the safe, efficient delivery of energy.
New England’s Dependence onMarine Transportation
New England has no refineries, and itssmall oil pipeline system is not connected tothe interstate pipeline system. As a result,New England must rely on tanker and bargeshipments of petroleum products from thesouth as well as direct imports from over-seas. There is some question as to whetherthis distribution system is sufficient to meetthe future needs of the region and, if not,what steps need to be taken to ensure fu-ture economical, reliable energy supplies.
In recent years, lower national inven-tories, market forces, and other factors havecombined to create much lower inventoriesfor petroleum products such as heating oilin the Northeast. A supply system with lesscapacity in reserve is more vulnerable tovariations in product delivery, and is less ca-pable of absorbing the disruptions in bargeand tanker movements that inevitably come
Winter storms, extended
darkness, and ice formation
disrupt barge and tanker
movements. The U.S. Coast
Guard’s fleet of ice breakers
has become an important
component of the energy
infrastructure for the New
England, Mid-Atlantic, and
Great Lakes regions.
U.S. COAST GUARD
7-15
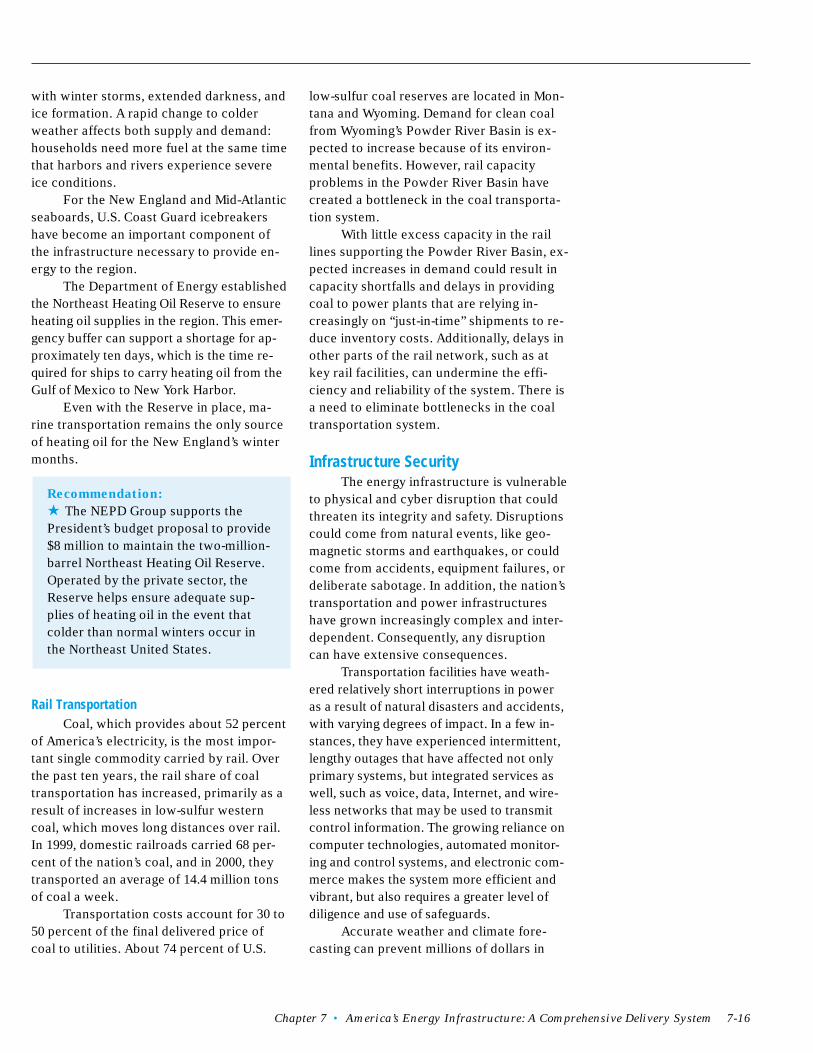
Chapter 7 • America’s Energy Infrastructure: A Comprehensive Delivery System
with winter storms, extended darkness, andice formation. A rapid change to colderweather affects both supply and demand:households need more fuel at the same timethat harbors and rivers experience severeice conditions.
For the New England and Mid-Atlanticseaboards, U.S. Coast Guard icebreakershave become an important component ofthe infrastructure necessary to provide en-ergy to the region.
The Department of Energy establishedthe Northeast Heating Oil Reserve to ensureheating oil supplies in the region. This emer-gency buffer can support a shortage for ap-proximately ten days, which is the time re-quired for ships to carry heating oil from theGulf of Mexico to New York Harbor.
Even with the Reserve in place, ma-rine transportation remains the only sourceof heating oil for the New England’s wintermonths.
Recommendation:
★ The NEPD Group supports thePresident’s budget proposal to provide$8 million to maintain the two-million-barrel Northeast Heating Oil Reserve.Operated by the private sector, theReserve helps ensure adequate sup-plies of heating oil in the event thatcolder than normal winters occur inthe Northeast United States.
Rail TransportationCoal, which provides about 52 percent
of America’s electricity, is the most impor-tant single commodity carried by rail. Overthe past ten years, the rail share of coaltransportation has increased, primarily as aresult of increases in low-sulfur westerncoal, which moves long distances over rail.In 1999, domestic railroads carried 68 per-cent of the nation’s coal, and in 2000, theytransported an average of 14.4 million tonsof coal a week.
Transportation costs account for 30 to50 percent of the final delivered price ofcoal to utilities. About 74 percent of U.S.
low-sulfur coal reserves are located in Mon-tana and Wyoming. Demand for clean coalfrom Wyoming’s Powder River Basin is ex-pected to increase because of its environ-mental benefits. However, rail capacityproblems in the Powder River Basin havecreated a bottleneck in the coal transporta-tion system.
With little excess capacity in the raillines supporting the Powder River Basin, ex-pected increases in demand could result incapacity shortfalls and delays in providingcoal to power plants that are relying in-creasingly on “just-in-time” shipments to re-duce inventory costs. Additionally, delays inother parts of the rail network, such as atkey rail facilities, can undermine the effi-ciency and reliability of the system. There isa need to eliminate bottlenecks in the coaltransportation system.
Infrastructure SecurityThe energy infrastructure is vulnerable
to physical and cyber disruption that couldthreaten its integrity and safety. Disruptionscould come from natural events, like geo-magnetic storms and earthquakes, or couldcome from accidents, equipment failures, ordeliberate sabotage. In addition, the nation’stransportation and power infrastructureshave grown increasingly complex and inter-dependent. Consequently, any disruptioncan have extensive consequences.
Transportation facilities have weath-ered relatively short interruptions in poweras a result of natural disasters and accidents,with varying degrees of impact. In a few in-stances, they have experienced intermittent,lengthy outages that have affected not onlyprimary systems, but integrated services aswell, such as voice, data, Internet, and wire-less networks that may be used to transmitcontrol information. The growing reliance oncomputer technologies, automated monitor-ing and control systems, and electronic com-merce makes the system more efficient andvibrant, but also requires a greater level ofdiligence and use of safeguards.
Accurate weather and climate fore-casting can prevent millions of dollars in
7-16
NATIONAL ENERGY POLICY
damage to U.S. energy infrastructure. Forexample, the interaction of geomagneticstorms with the Earth’s magnetic field cancause additional current to enter transmis-sion lines, which at times has caused re-gional grid collapse and has destroyedpower plant electrical transformers. Givensufficient warning, the industry can initiateprotective countermeasures, such as whenseveral northeastern power plants shed 20percent of their load during a July 2000 geo-magnetic storm.
Improvements in forecasting can fur-ther assist in the management of energy re-sources and materials, can prevent poweroutages in many cases, and can acceleraterestoration of power after outages that dooccur. Also, data from extreme weatherevents can be used to design and build infra-structure, such as transmission lines, pipe-lines, and hydropower dams.
Summary of Recommendations
America’s Energy Infrastructure: A Comprehensive Delivery System
★ The NEPD Group recommends that the President direct the Secretary of Energyto work with the Federal Energy Regulatory Commission (FERC) to improve thereliability of the interstate transmission system and to develop legislation provid-ing for enforcement by a self-regulatory organization subject to FERC oversight.
★ The NEPD Group recommends that the President direct the Secretary ofEnergy to expand the Department’s research and development on transmission re-liability and superconductivity.
★ The NEPD Group recommends that the President direct the Secretary of Energy toauthorize the Western Area Power Administration to explore relieving the “Path 15”bottleneck through transmission expansion financed by nonfederal contributions.
★ The NEPD Group recommends that the President direct the appropriate federalagencies to take actions to remove constraints on the interstate transmission gridand allow our nation’s electricity supply to meet the growing needs of oureconomy.• Direct the Secretary of Energy, by December 31, 2001, to examine the benefits of
establishing a national grid, identify transmission bottlenecks, and identify mea-sures to remove transmission bottlenecks.
• Direct the Secretary of Energy to work with FERC to relieve transmission con-straints by encouraging the use of incentive rate-making proposals.
• Direct the federal utilities to determine whether transmission expansions arenecessary to remove constraints. The Administration should review theBonneville Power Administration’s (BPA’s) capital and financing requirements inthe context of its membership in a regional RTO, and if additional Treasury fi-nancing appears warranted or necessary in the future, the Administrationshould seek an increase in BPA’s borrowing authority at that time.
• Direct the Secretary of Energy, in consultation with appropriate federal agenciesand state and local government officials, to develop legislation to grant author-ity to obtain rights-of-way for electricity transmission lines, with the goal of cre-ating a reliable national transmission grid. Similar authority already exists fornatural gas pipelines in recognition of their role in interstate commerce.
7-17
Chapter 7 • America’s Energy Infrastructure: A Comprehensive Delivery System
★ The NEPD Group recommends that the President direct the Secretary of the Inte-rior to work with Congress and the State of Alaska to put in place the most expeditiousprocess for renewal of the Trans-Alaskan Pipeline System rights-of-way to ensure thatAlaskan oil continues to flow uninterrupted to the West Coast of the United States.
★ The NEPD Group recommends that the President direct the Secretaries of Energyand State, coordinating with the Secretary of the Interior and the Federal EnergyRegulatory Commission, to work closely with Canada, the State of Alaska, and allother interested parties to expedite the construction of a pipeline to deliver naturalgas to the lower 48 states. This should include proposing to Congress any changes orwaivers of law pursuant to the Alaska Natural Gas Transportation Act of 1976 that maybe required.
★ The NEPD Group recommends that the President support legislation to improvethe safety of natural gas pipelines, protect the environment, strengthen emergencypreparedness and inspections and bolster enforcement.
★ The NEPD Group recommends that the President direct agencies to continue theirinteragency efforts to improve pipeline safety and expedite pipeline permitting in anenvironmentally sound manner and encourage FERC to consider improvements in theregulatory process governing approval of interstate natural gas pipeline projects.
★ The NEPD Group recommends that the President direct the Administrator of theEPA to study opportunities to maintain or improve the environmental benefits of stateand local “boutique” clean fuel programs while exploring ways to increase the flexibil-ity of the fuels distribution infrastructure, improve fungibility, and provide added gaso-line market liquidity. In concluding this study, the Administrator shall consult with theDepartments of Energy and Agriculture, and other agencies as needed.
★ The NEPD Group recommends that the President direct the Administrator of theEnvironmental Protection Agency and the Secretary of Energy to take steps to ensureAmerica has adequate refining capacity to meet the needs of consumers.• Provide more regulatory certainty to refinery owners and streamline the permitting
process where possible to ensure that regulatory overlap is limited.• Adopt comprehensive regulations (covering more than one pollutant and require-
ment) and consider the rules’ cumulative impacts and benefits.
★ The NEPD Group recommends that the President direct the Administrator of theEnvironmental Protection Agency, in consultation with the Secretary of Energy andother relevant agencies, to review New Source Review regulations, including adminis-trative interpretation and implementation, and report to the President within 90 dayson the impact of the regulations on investment in new utility and refinery generationcapacity, energy efficiency, and environmental protection.
★ The NEPD Group recommends that the President direct the Attorney General toreview existing enforcement actions regarding New Source Review to ensure that theenforcement actions are consistent with the Clean Air Act and its regulations.
★ The NEPD Group supports the President’s budget proposal to provide $8 million tomaintain the two-million-barrel Northeast Heating Oil Reserve. Operated by the pri-vate sector, the Reserve helps ensure adequate supplies of heating oil in the event thatcolder than normal winters occur in the Northeast United States.
7-18
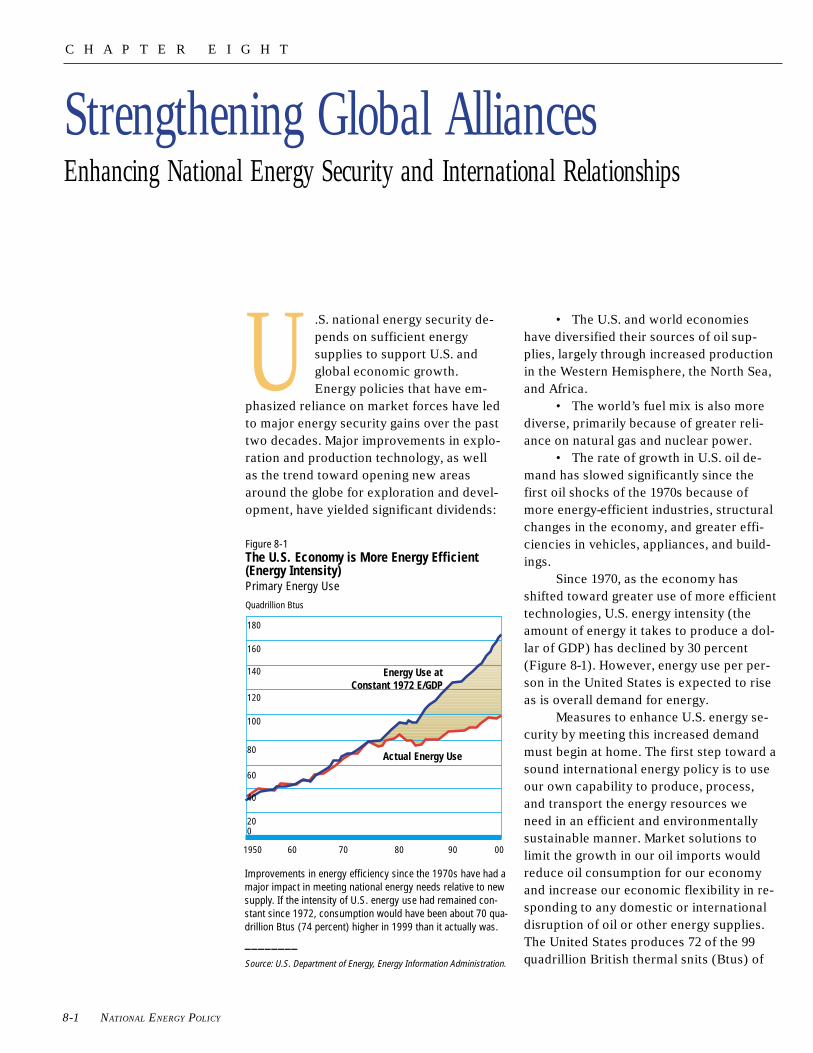
NATIONAL ENERGY POLICY
U .S. national energy security de-pends on sufficient energysupplies to support U.S. andglobal economic growth.Energy policies that have em-
phasized reliance on market forces have ledto major energy security gains over the pasttwo decades. Major improvements in explo-ration and production technology, as wellas the trend toward opening new areasaround the globe for exploration and devel-opment, have yielded significant dividends:
Strengthening Global AlliancesEnhancing National Energy Security and International Relationships
• The U.S. and world economieshave diversified their sources of oil sup-plies, largely through increased productionin the Western Hemisphere, the North Sea,and Africa.
• The world’s fuel mix is also morediverse, primarily because of greater reli-ance on natural gas and nuclear power.
• The rate of growth in U.S. oil de-mand has slowed significantly since thefirst oil shocks of the 1970s because ofmore energy-efficient industries, structuralchanges in the economy, and greater effi-ciencies in vehicles, appliances, and build-ings.
Since 1970, as the economy hasshifted toward greater use of more efficienttechnologies, U.S. energy intensity (theamount of energy it takes to produce a dol-lar of GDP) has declined by 30 percent(Figure 8-1). However, energy use per per-son in the United States is expected to riseas is overall demand for energy.
Measures to enhance U.S. energy se-curity by meeting this increased demandmust begin at home. The first step toward asound international energy policy is to useour own capability to produce, process,and transport the energy resources weneed in an efficient and environmentallysustainable manner. Market solutions tolimit the growth in our oil imports wouldreduce oil consumption for our economyand increase our economic flexibility in re-sponding to any domestic or internationaldisruption of oil or other energy supplies.The United States produces 72 of the 99quadrillion British thermal snits (Btus) of
Improvements in energy efficiency since the 1970s have had amajor impact in meeting national energy needs relative to newsupply. If the intensity of U.S. energy use had remained con-stant since 1972, consumption would have been about 70 qua-drillion Btus (74 percent) higher in 1999 than it actually was.
________Source: U.S. Department of Energy, Energy Information Administration.
Figure 8-1The U.S. Economy is More Energy Efficient(Energy Intensity)Primary Energy UseQuadrillion Btus
Energy Use atConstant 1972 E/GDP
Actual Energy Use
180
160
140
120
100
80
60
40
200
8-1
1950 60 70 80 90 00
C H A P T E R E I G H T
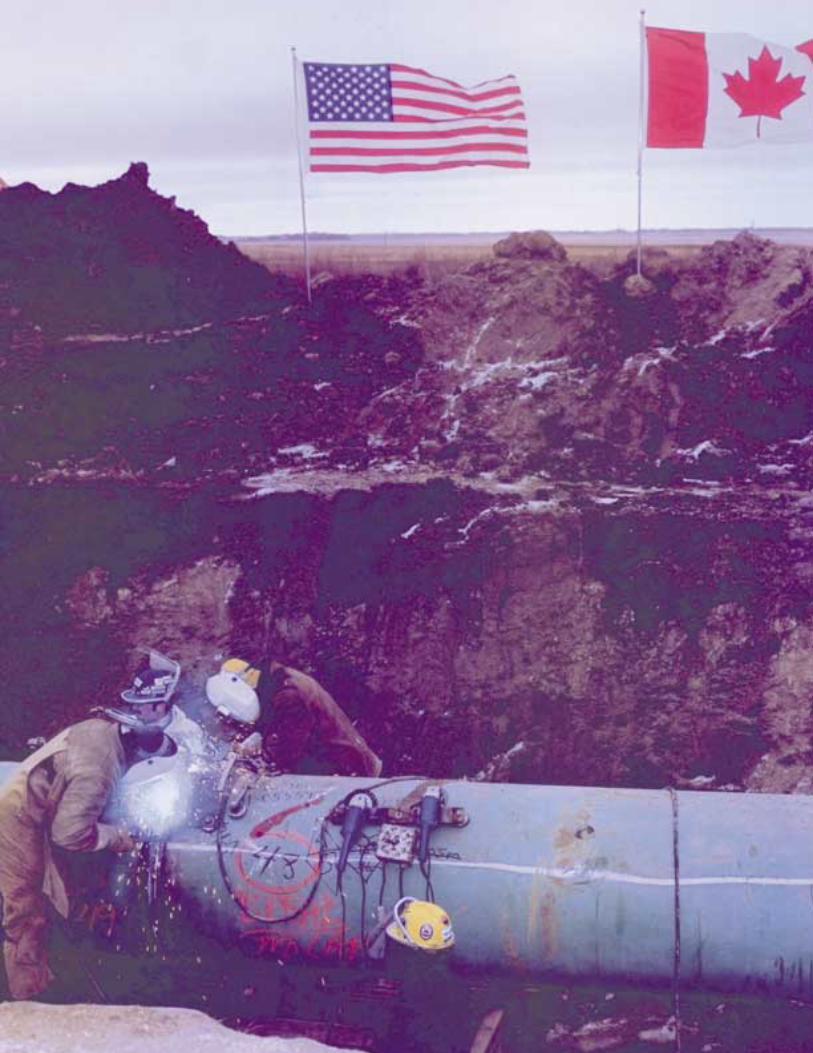
Chapter 8 • Strengthening Global Alliances: Enhancing National Energy Security and International Relationships
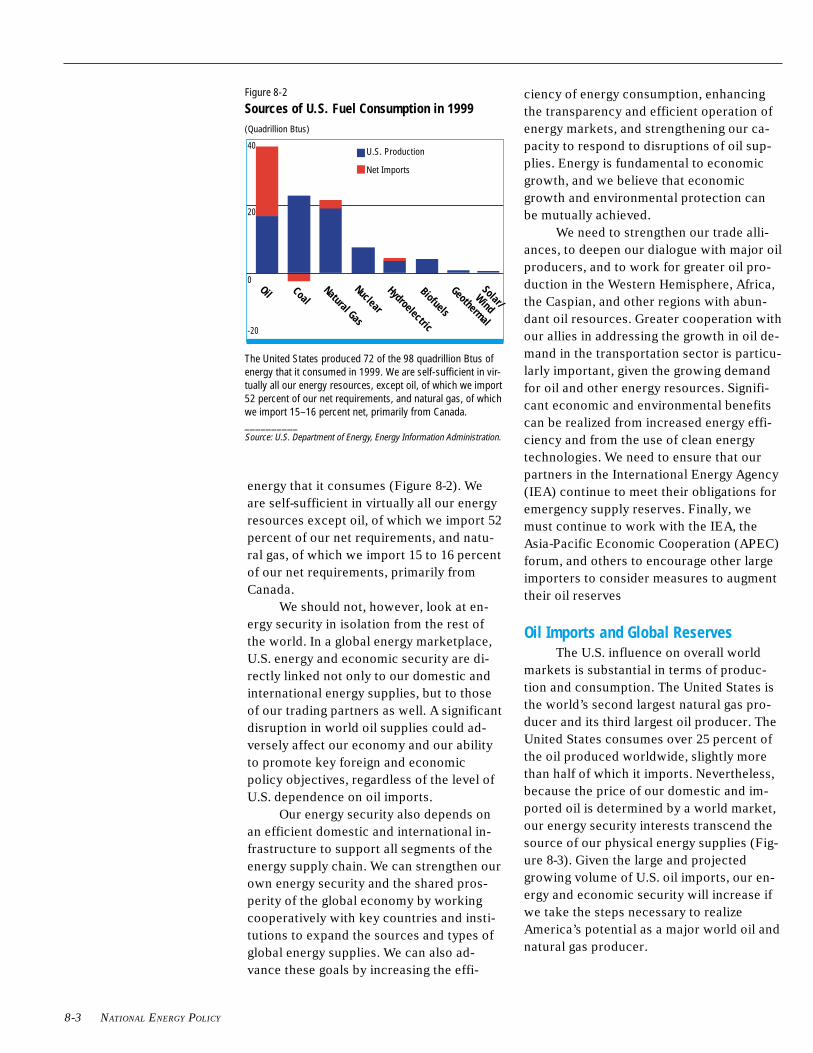
NATIONAL ENERGY POLICY
energy that it consumes (Figure 8-2). Weare self-sufficient in virtually all our energyresources except oil, of which we import 52percent of our net requirements, and natu-ral gas, of which we import 15 to 16 percentof our net requirements, primarily fromCanada.
We should not, however, look at en-ergy security in isolation from the rest ofthe world. In a global energy marketplace,U.S. energy and economic security are di-rectly linked not only to our domestic andinternational energy supplies, but to thoseof our trading partners as well. A significantdisruption in world oil supplies could ad-versely affect our economy and our abilityto promote key foreign and economicpolicy objectives, regardless of the level ofU.S. dependence on oil imports.
Our energy security also depends onan efficient domestic and international in-frastructure to support all segments of theenergy supply chain. We can strengthen ourown energy security and the shared pros-perity of the global economy by workingcooperatively with key countries and insti-tutions to expand the sources and types ofglobal energy supplies. We can also ad-vance these goals by increasing the effi-
ciency of energy consumption, enhancingthe transparency and efficient operation ofenergy markets, and strengthening our ca-pacity to respond to disruptions of oil sup-plies. Energy is fundamental to economicgrowth, and we believe that economicgrowth and environmental protection canbe mutually achieved.
We need to strengthen our trade alli-ances, to deepen our dialogue with major oilproducers, and to work for greater oil pro-duction in the Western Hemisphere, Africa,the Caspian, and other regions with abun-dant oil resources. Greater cooperation withour allies in addressing the growth in oil de-mand in the transportation sector is particu-larly important, given the growing demandfor oil and other energy resources. Signifi-cant economic and environmental benefitscan be realized from increased energy effi-ciency and from the use of clean energytechnologies. We need to ensure that ourpartners in the International Energy Agency(IEA) continue to meet their obligations foremergency supply reserves. Finally, wemust continue to work with the IEA, theAsia-Pacific Economic Cooperation (APEC)forum, and others to encourage other largeimporters to consider measures to augmenttheir oil reserves
Oil Imports and Global ReservesThe U.S. influence on overall world
markets is substantial in terms of produc-tion and consumption. The United States isthe world’s second largest natural gas pro-ducer and its third largest oil producer. TheUnited States consumes over 25 percent ofthe oil produced worldwide, slightly morethan half of which it imports. Nevertheless,because the price of our domestic and im-ported oil is determined by a world market,our energy security interests transcend thesource of our physical energy supplies (Fig-ure 8-3). Given the large and projectedgrowing volume of U.S. oil imports, our en-ergy and economic security will increase ifwe take the steps necessary to realizeAmerica’s potential as a major world oil andnatural gas producer.
8-3
Figure 8-2
Sources of U.S. Fuel Consumption in 1999(Quadrillion Btus)
The United States produced 72 of the 98 quadrillion Btus ofenergy that it consumed in 1999. We are self-sufficient in vir-tually all our energy resources, except oil, of which we import52 percent of our net requirements, and natural gas, of whichwe import 15–16 percent net, primarily from Canada.__________Source: U.S. Department of Energy, Energy Information Administration.
U.S. Production
Net Imports
40
20
0
-20
Solar/
Geothermal
Biofuels
Hydroelectric
Nuclear
Natural Gas
CoalOil Wind
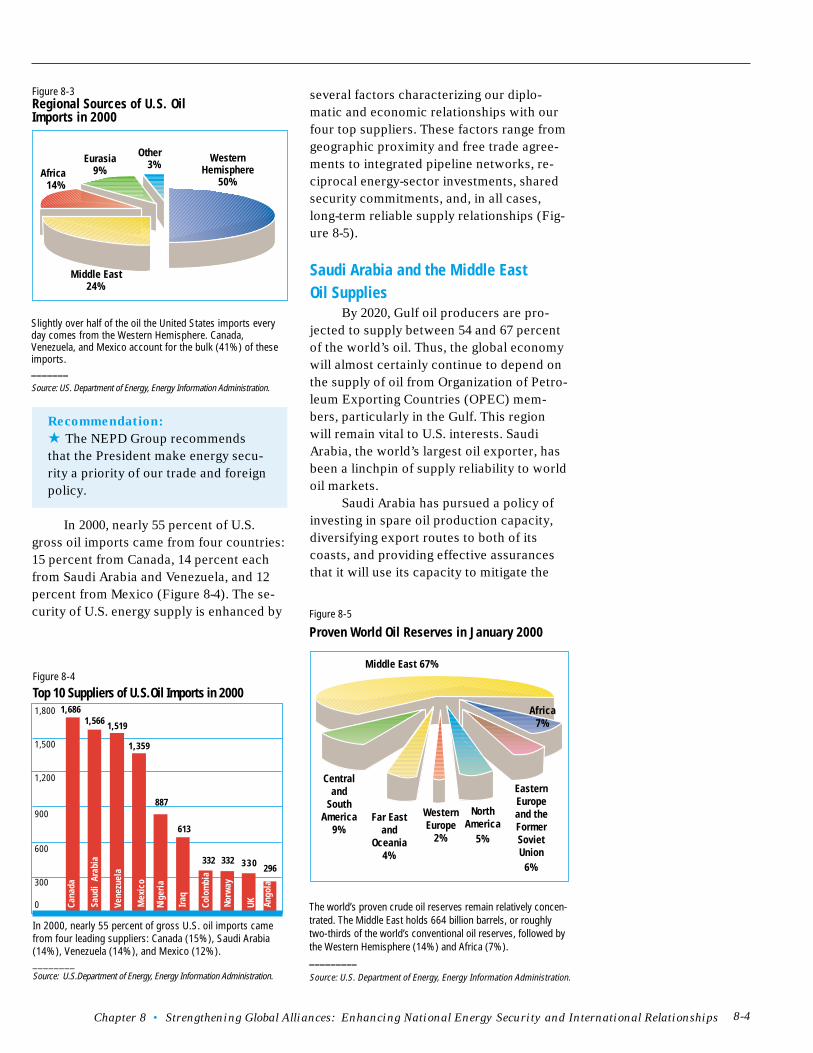
Chapter 8 • Strengthening Global Alliances: Enhancing National Energy Security and International Relationships
Figure 8-4
Top 10 Suppliers of U.S.Oil Imports in 2000
In 2000, nearly 55 percent of gross U.S. oil imports camefrom four leading suppliers: Canada (15%), Saudi Arabia(14%), Venezuela (14%), and Mexico (12%).________Source: U.S.Department of Energy, Energy Information Administration.
Recommendation:
★ The NEPD Group recommendsthat the President make energy secu-rity a priority of our trade and foreignpolicy.
In 2000, nearly 55 percent of U.S.gross oil imports came from four countries:15 percent from Canada, 14 percent eachfrom Saudi Arabia and Venezuela, and 12percent from Mexico (Figure 8-4). The se-curity of U.S. energy supply is enhanced by
several factors characterizing our diplo-matic and economic relationships with ourfour top suppliers. These factors range fromgeographic proximity and free trade agree-ments to integrated pipeline networks, re-ciprocal energy-sector investments, sharedsecurity commitments, and, in all cases,long-term reliable supply relationships (Fig-ure 8-5).
Saudi Arabia and the Middle EastOil Supplies
By 2020, Gulf oil producers are pro-jected to supply between 54 and 67 percentof the world’s oil. Thus, the global economywill almost certainly continue to depend onthe supply of oil from Organization of Petro-leum Exporting Countries (OPEC) mem-bers, particularly in the Gulf. This regionwill remain vital to U.S. interests. SaudiArabia, the world’s largest oil exporter, hasbeen a linchpin of supply reliability to worldoil markets.
Saudi Arabia has pursued a policy ofinvesting in spare oil production capacity,diversifying export routes to both of itscoasts, and providing effective assurancesthat it will use its capacity to mitigate the
8-4
Figure 8-5
Proven World Oil Reserves in January 2000
The world’s proven crude oil reserves remain relatively concen-trated. The Middle East holds 664 billion barrels, or roughlytwo-thirds of the world’s conventional oil reserves, followed bythe Western Hemisphere (14%) and Africa (7%)._________
Source: U.S. Department of Energy, Energy Information Administration.
Middle East 67%
Centraland
SouthAmerica
9%
EasternEuropeand theFormerSovietUnion6%
Far Eastand
Oceania4%
WesternEurope
2%
NorthAmerica
5%
Africa7%
fig 3
Figure 8-3Regional Sources of U.S. OilImports in 2000
Slightly over half of the oil the United States imports everyday comes from the Western Hemisphere. Canada,Venezuela, and Mexico account for the bulk (41%) of theseimports._______Source: US. Department of Energy, Energy Information Administration.
Other3%
WesternHemisphere
50%
Middle East24%
Eurasia9%Africa
14%
1,6861,566
887
332 332 330 296
613
1,519
1,359
Cana
da
Vene
zuel
a
Nige
ria
Colo
mbi
a
UK
1,800
1,500
1,200
900
600
300
0 Saud
i Ar
abia
Mex
ico
Iraq
Norw
ay
Ango
la

NATIONAL ENERGY POLICY
impact of oil supply disruptions in any re-gion (Figure 8-6). Algeria, Kuwait, Oman,Qatar, Saudi Arabia, the United Arab Emir-ates (UAE), Yemen, and other states in theregion with which we maintain diplomaticrelations have all, to some extent, openedtheir energy sectors to international invest-ment. This development provides an impor-tant opportunity to further encourage for-eign investment in these important energy-producing countries, thereby broadeningour shared commercial and strategic inter-ests. By any estimation, Middle East oil pro-ducers will remain central to world oil secu-rity. The Gulf will be a primary focus of U.S.
international energy policy, but our engage-ment will be global, spotlighting existingand emerging regions that will have a majorimpact on the global energy balance.
Recommendation:
★ The NEPD Group recommends thatthe President support initiatives bySaudi Arabia, Kuwait, Algeria, Qatar,the UAE, and other suppliers to openup areas of their energy sectors to for-eign investment.
Improving Market TransparencyThe United States must work with oil
producers to improve the transparency,timeliness, and accuracy of the data thatguide global oil markets. A lack of timelyand accurate data relating to both oil pro-duction and inventory levels has contrib-uted to the price volatility witnessed in2000. Discussions among the major oil pro-ducers and consumer countries should bedesigned to improve the transparency, accu-racy, and timeliness of data that guide themarket. In turn, enhanced data quality andincreased data transparency will improvemarket efficiency. Refocusing that dialoguebeyond short-term market developments tolong-term issues of world economic growth,improving data quality, and addressing en-ergy infrastructure is needed to maintain asmooth flow of energy from the wellhead tothe consumer.
Recommendation:
★ The NEPD Group recommends thatthe President direct the Secretaries ofState, Energy and Commerce work toimprove dialogue among energy pro-ducing and consuming nations.
Promoting International Trade andInvestment
Longstanding U.S. policy supports aliberalized global energy sector that is opento international trade and investment. TheUnited States benefits from international in-vestments at home that have increased our
8-5
Saudi Arabia has pursued a
policy of investing in spare
oil production capacity,
diversifying export routes to
both of its coasts, and
providing effective assur-
ances that it will use its
capacity to mitigate the
impact of oil supply disrup-
tions in any region.
ARAMCO
Figure 8-6Saudi Arabia Export Pipelines
Saudi Arabia, the world’s largest oil supplier, maintains majoroil export ports and storage capacity on both the Gulf and theRed Sea._______ ARAMCO
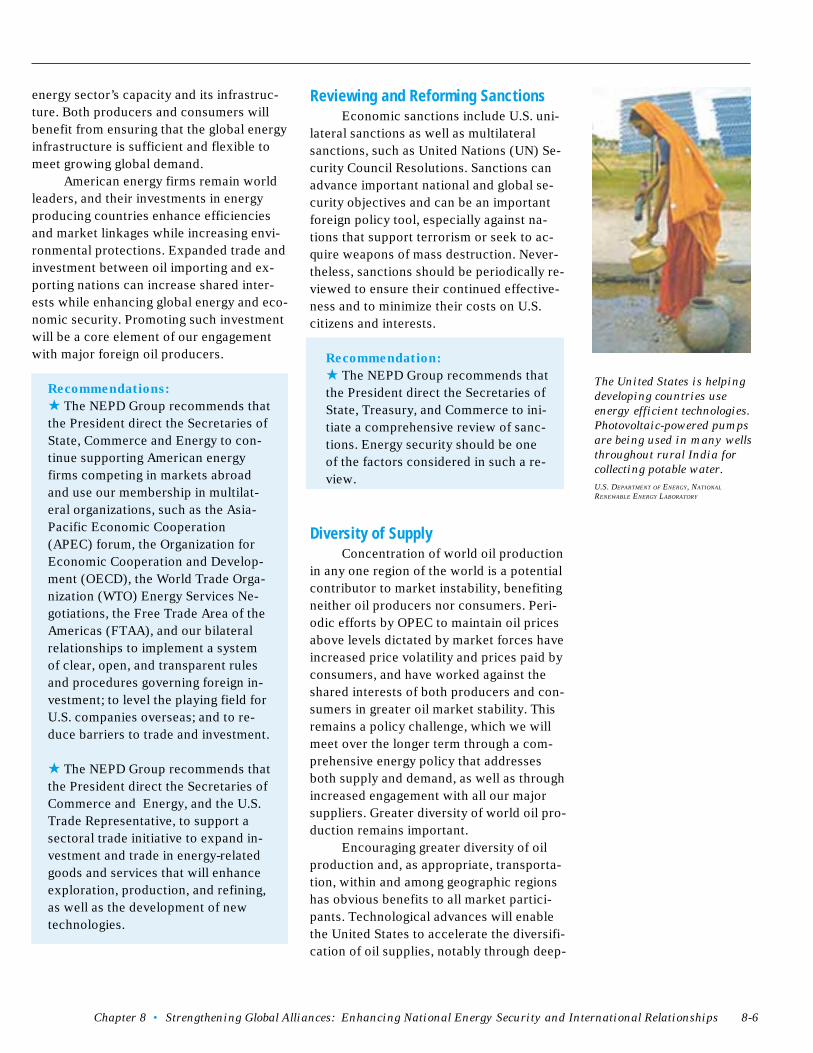
Chapter 8 • Strengthening Global Alliances: Enhancing National Energy Security and International Relationships
energy sector’s capacity and its infrastruc-ture. Both producers and consumers willbenefit from ensuring that the global energyinfrastructure is sufficient and flexible tomeet growing global demand.
American energy firms remain worldleaders, and their investments in energyproducing countries enhance efficienciesand market linkages while increasing envi-ronmental protections. Expanded trade andinvestment between oil importing and ex-porting nations can increase shared inter-ests while enhancing global energy and eco-nomic security. Promoting such investmentwill be a core element of our engagementwith major foreign oil producers.
Recommendations:
★ The NEPD Group recommends thatthe President direct the Secretaries ofState, Commerce and Energy to con-tinue supporting American energyfirms competing in markets abroadand use our membership in multilat-eral organizations, such as the Asia-Pacific Economic Cooperation(APEC) forum, the Organization forEconomic Cooperation and Develop-ment (OECD), the World Trade Orga-nization (WTO) Energy Services Ne-gotiations, the Free Trade Area of theAmericas (FTAA), and our bilateralrelationships to implement a systemof clear, open, and transparent rulesand procedures governing foreign in-vestment; to level the playing field forU.S. companies overseas; and to re-duce barriers to trade and investment.
★ The NEPD Group recommends thatthe President direct the Secretaries ofCommerce and Energy, and the U.S.Trade Representative, to support asectoral trade initiative to expand in-vestment and trade in energy-relatedgoods and services that will enhanceexploration, production, and refining,as well as the development of newtechnologies.
Reviewing and Reforming SanctionsEconomic sanctions include U.S. uni-
lateral sanctions as well as multilateralsanctions, such as United Nations (UN) Se-curity Council Resolutions. Sanctions canadvance important national and global se-curity objectives and can be an importantforeign policy tool, especially against na-tions that support terrorism or seek to ac-quire weapons of mass destruction. Never-theless, sanctions should be periodically re-viewed to ensure their continued effective-ness and to minimize their costs on U.S.citizens and interests.
Recommendation:
★ The NEPD Group recommends thatthe President direct the Secretaries ofState, Treasury, and Commerce to ini-tiate a comprehensive review of sanc-tions. Energy security should be oneof the factors considered in such a re-view.
Diversity of SupplyConcentration of world oil production
in any one region of the world is a potentialcontributor to market instability, benefitingneither oil producers nor consumers. Peri-odic efforts by OPEC to maintain oil pricesabove levels dictated by market forces haveincreased price volatility and prices paid byconsumers, and have worked against theshared interests of both producers and con-sumers in greater oil market stability. Thisremains a policy challenge, which we willmeet over the longer term through a com-prehensive energy policy that addressesboth supply and demand, as well as throughincreased engagement with all our majorsuppliers. Greater diversity of world oil pro-duction remains important.
Encouraging greater diversity of oilproduction and, as appropriate, transporta-tion, within and among geographic regionshas obvious benefits to all market partici-pants. Technological advances will enablethe United States to accelerate the diversifi-cation of oil supplies, notably through deep-
8-6
The United States is helping
developing countries use
energy efficient technologies.
Photovoltaic-powered pumps
are being used in many wells
throughout rural India for
collecting potable water.
U.S. DEPARTMENT OF ENERGY, NATIONAL
RENEWABLE ENERGY LABORATORY
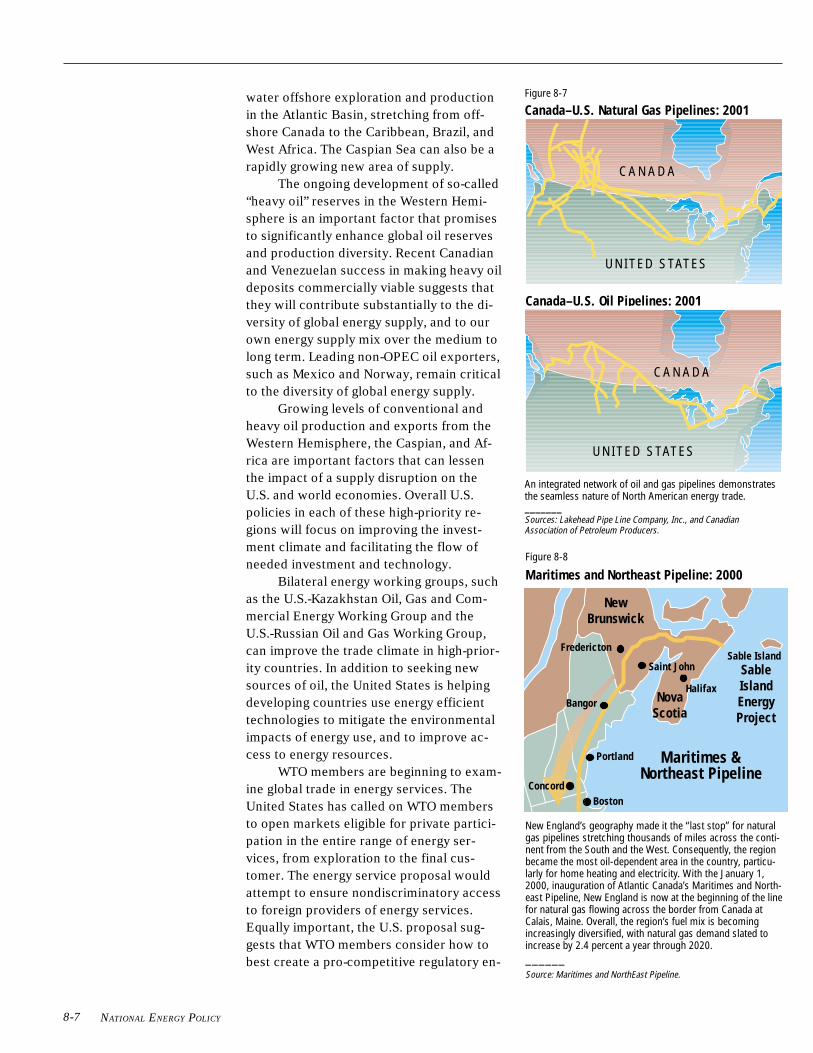
NATIONAL ENERGY POLICY
Figure 8-8
Maritimes and Northeast Pipeline: 2000
New England’s geography made it the “last stop” for naturalgas pipelines stretching thousands of miles across the conti-nent from the South and the West. Consequently, the regionbecame the most oil-dependent area in the country, particu-larly for home heating and electricity. With the January 1,2000, inauguration of Atlantic Canada’s Maritimes and North-east Pipeline, New England is now at the beginning of the linefor natural gas flowing across the border from Canada atCalais, Maine. Overall, the region’s fuel mix is becomingincreasingly diversified, with natural gas demand slated toincrease by 2.4 percent a year through 2020.______Source: Maritimes and NorthEast Pipeline.
water offshore exploration and productionin the Atlantic Basin, stretching from off-shore Canada to the Caribbean, Brazil, andWest Africa. The Caspian Sea can also be arapidly growing new area of supply.
The ongoing development of so-called“heavy oil” reserves in the Western Hemi-sphere is an important factor that promisesto significantly enhance global oil reservesand production diversity. Recent Canadianand Venezuelan success in making heavy oildeposits commercially viable suggests thatthey will contribute substantially to the di-versity of global energy supply, and to ourown energy supply mix over the medium tolong term. Leading non-OPEC oil exporters,such as Mexico and Norway, remain criticalto the diversity of global energy supply.
Growing levels of conventional andheavy oil production and exports from theWestern Hemisphere, the Caspian, and Af-rica are important factors that can lessenthe impact of a supply disruption on theU.S. and world economies. Overall U.S.policies in each of these high-priority re-gions will focus on improving the invest-ment climate and facilitating the flow ofneeded investment and technology.
Bilateral energy working groups, suchas the U.S.-Kazakhstan Oil, Gas and Com-mercial Energy Working Group and theU.S.-Russian Oil and Gas Working Group,can improve the trade climate in high-prior-ity countries. In addition to seeking newsources of oil, the United States is helpingdeveloping countries use energy efficienttechnologies to mitigate the environmentalimpacts of energy use, and to improve ac-cess to energy resources.
WTO members are beginning to exam-ine global trade in energy services. TheUnited States has called on WTO membersto open markets eligible for private partici-pation in the entire range of energy ser-vices, from exploration to the final cus-tomer. The energy service proposal wouldattempt to ensure nondiscriminatory accessto foreign providers of energy services.Equally important, the U.S. proposal sug-gests that WTO members consider how tobest create a pro-competitive regulatory en-
8-7
Maritimes &Northeast Pipeline
NewBrunswick
NovaScotia
Sable Island
BostonConcord
Portland
Bangor
Fredericton
Saint John SableIslandEnergyProject
Halifax
Canada–U.S. Oil Pipelines: 2001
C A N A D A
UNITED STATES
Figure 8-7
Canada–U.S. Natural Gas Pipelines: 2001
UNITED STATES
C A N A D A
An integrated network of oil and gas pipelines demonstratesthe seamless nature of North American energy trade._______Sources: Lakehead Pipe Line Company, Inc., and CanadianAssociation of Petroleum Producers.
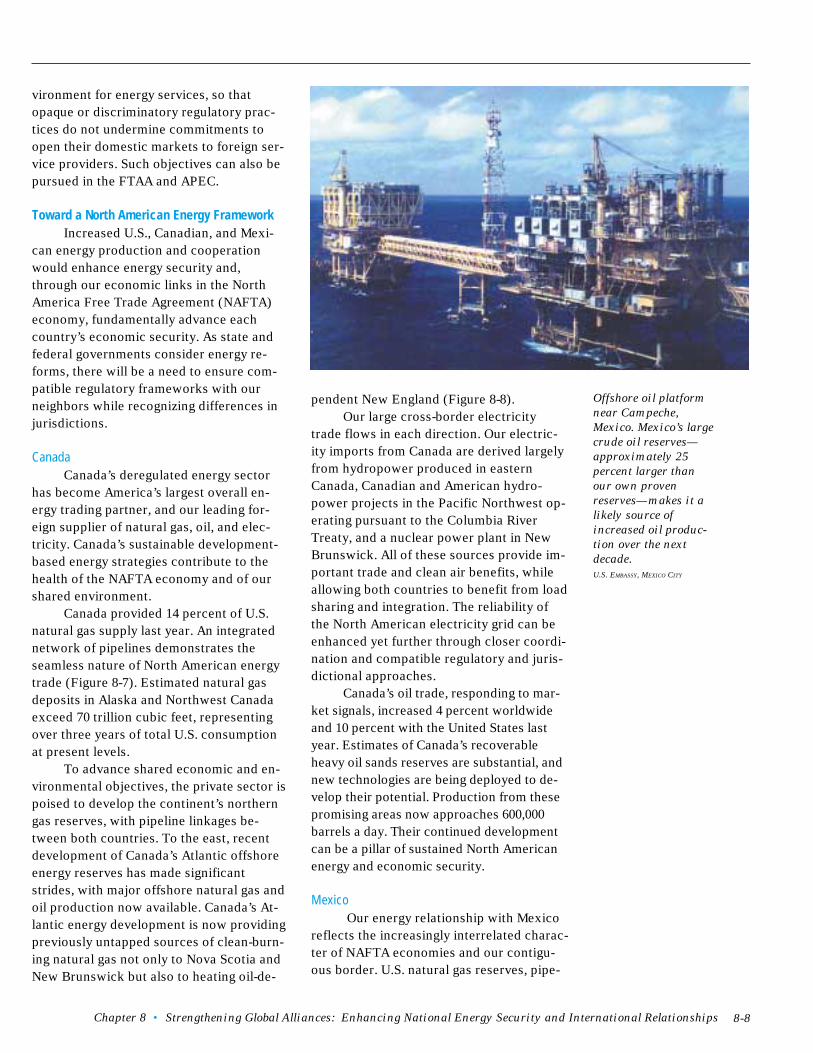
Chapter 8 • Strengthening Global Alliances: Enhancing National Energy Security and International Relationships
vironment for energy services, so thatopaque or discriminatory regulatory prac-tices do not undermine commitments toopen their domestic markets to foreign ser-vice providers. Such objectives can also bepursued in the FTAA and APEC.
Toward a North American Energy FrameworkIncreased U.S., Canadian, and Mexi-
can energy production and cooperationwould enhance energy security and,through our economic links in the NorthAmerica Free Trade Agreement (NAFTA)economy, fundamentally advance eachcountry’s economic security. As state andfederal governments consider energy re-forms, there will be a need to ensure com-patible regulatory frameworks with ourneighbors while recognizing differences injurisdictions.
CanadaCanada’s deregulated energy sector
has become America’s largest overall en-ergy trading partner, and our leading for-eign supplier of natural gas, oil, and elec-tricity. Canada’s sustainable development-based energy strategies contribute to thehealth of the NAFTA economy and of ourshared environment.
Canada provided 14 percent of U.S.natural gas supply last year. An integratednetwork of pipelines demonstrates theseamless nature of North American energytrade (Figure 8-7). Estimated natural gasdeposits in Alaska and Northwest Canadaexceed 70 trillion cubic feet, representingover three years of total U.S. consumptionat present levels.
To advance shared economic and en-vironmental objectives, the private sector ispoised to develop the continent’s northerngas reserves, with pipeline linkages be-tween both countries. To the east, recentdevelopment of Canada’s Atlantic offshoreenergy reserves has made significantstrides, with major offshore natural gas andoil production now available. Canada’s At-lantic energy development is now providingpreviously untapped sources of clean-burn-ing natural gas not only to Nova Scotia andNew Brunswick but also to heating oil-de-
Offshore oil platform
near Campeche,
Mexico. Mexico’s large
crude oil reserves—
approximately 25
percent larger than
our own proven
reserves—makes it a
likely source of
increased oil produc-
tion over the next
decade.
U.S. EMBASSY, MEXICO CITY
pendent New England (Figure 8-8).Our large cross-border electricity
trade flows in each direction. Our electric-ity imports from Canada are derived largelyfrom hydropower produced in easternCanada, Canadian and American hydro-power projects in the Pacific Northwest op-erating pursuant to the Columbia RiverTreaty, and a nuclear power plant in NewBrunswick. All of these sources provide im-portant trade and clean air benefits, whileallowing both countries to benefit from loadsharing and integration. The reliability ofthe North American electricity grid can beenhanced yet further through closer coordi-nation and compatible regulatory and juris-dictional approaches.
Canada’s oil trade, responding to mar-ket signals, increased 4 percent worldwideand 10 percent with the United States lastyear. Estimates of Canada’s recoverableheavy oil sands reserves are substantial, andnew technologies are being deployed to de-velop their potential. Production from thesepromising areas now approaches 600,000barrels a day. Their continued developmentcan be a pillar of sustained North Americanenergy and economic security.
Mexico Our energy relationship with Mexico
reflects the increasingly interrelated charac-ter of NAFTA economies and our contigu-ous border. U.S. natural gas reserves, pipe-
8-8
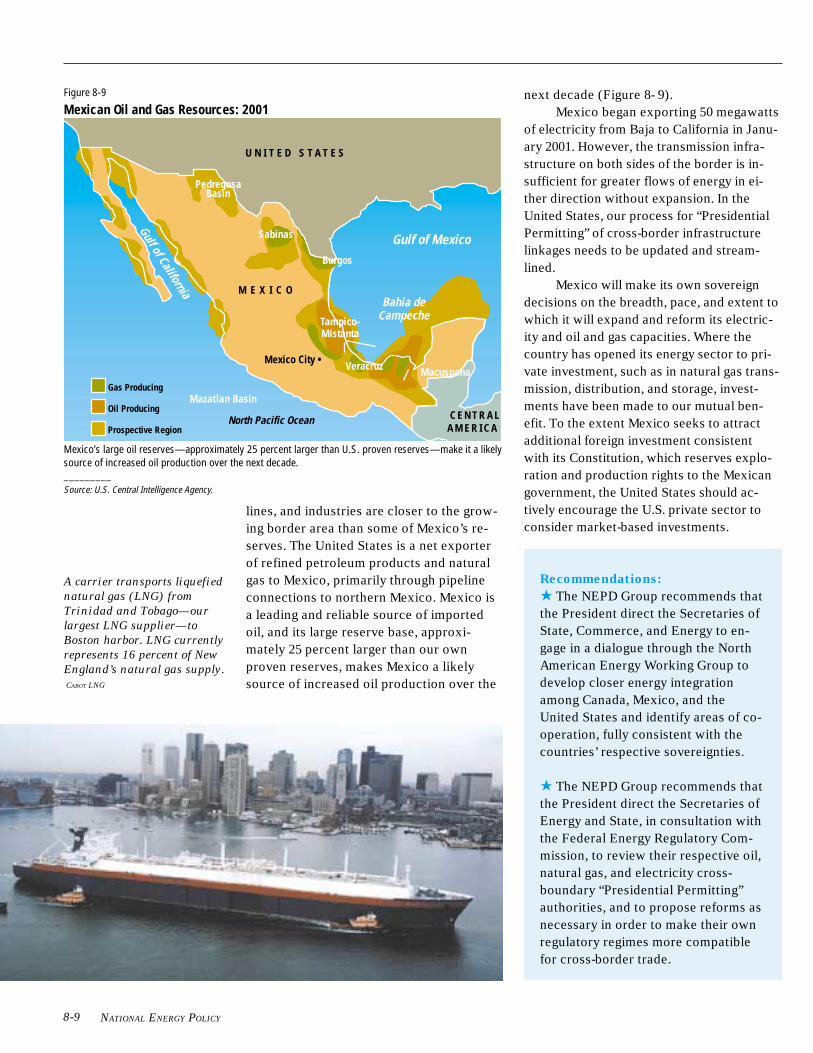
NATIONAL ENERGY POLICY
lines, and industries are closer to the grow-ing border area than some of Mexico’s re-serves. The United States is a net exporterof refined petroleum products and naturalgas to Mexico, primarily through pipelineconnections to northern Mexico. Mexico isa leading and reliable source of importedoil, and its large reserve base, approxi-mately 25 percent larger than our ownproven reserves, makes Mexico a likelysource of increased oil production over the
next decade (Figure 8- 9).Mexico began exporting 50 megawatts
of electricity from Baja to California in Janu-ary 2001. However, the transmission infra-structure on both sides of the border is in-sufficient for greater flows of energy in ei-ther direction without expansion. In theUnited States, our process for “PresidentialPermitting” of cross-border infrastructurelinkages needs to be updated and stream-lined.
Mexico will make its own sovereigndecisions on the breadth, pace, and extent towhich it will expand and reform its electric-ity and oil and gas capacities. Where thecountry has opened its energy sector to pri-vate investment, such as in natural gas trans-mission, distribution, and storage, invest-ments have been made to our mutual ben-efit. To the extent Mexico seeks to attractadditional foreign investment consistentwith its Constitution, which reserves explo-ration and production rights to the Mexicangovernment, the United States should ac-tively encourage the U.S. private sector toconsider market-based investments.
Recommendations:
★ The NEPD Group recommends thatthe President direct the Secretaries ofState, Commerce, and Energy to en-gage in a dialogue through the NorthAmerican Energy Working Group todevelop closer energy integrationamong Canada, Mexico, and theUnited States and identify areas of co-operation, fully consistent with thecountries’ respective sovereignties.
★ The NEPD Group recommends thatthe President direct the Secretaries ofEnergy and State, in consultation withthe Federal Energy Regulatory Com-mission, to review their respective oil,natural gas, and electricity cross-boundary “Presidential Permitting”authorities, and to propose reforms asnecessary in order to make their ownregulatory regimes more compatiblefor cross-border trade.
A carrier transports liquefied
natural gas (LNG) from
Trinidad and Tobago—our
largest LNG supplier—to
Boston harbor. LNG currently
represents 16 percent of New
England’s natural gas supply.
CABOT LNG
8-9
Figure 8-9
Mexican Oil and Gas Resources: 2001
Mexico’s large oil reserves—approximately 25 percent larger than U.S. proven reserves—make it a likelysource of increased oil production over the next decade._________Source: U.S. Central Intelligence Agency.
C E N T R A LA M E R I C A
U N I T E D S T A T E S
M E X I C O
North Pacific Ocean
Gulf of Mexico
PedregosaBasin
Sabinas
Burgos
Tampico-Mistanta
Gas Producing
Oil Producing
Prospective Region
Veracruz
Bahia deCampeche
Macuspana
Gulf of California
Mexico City •
Mazatlan Basin
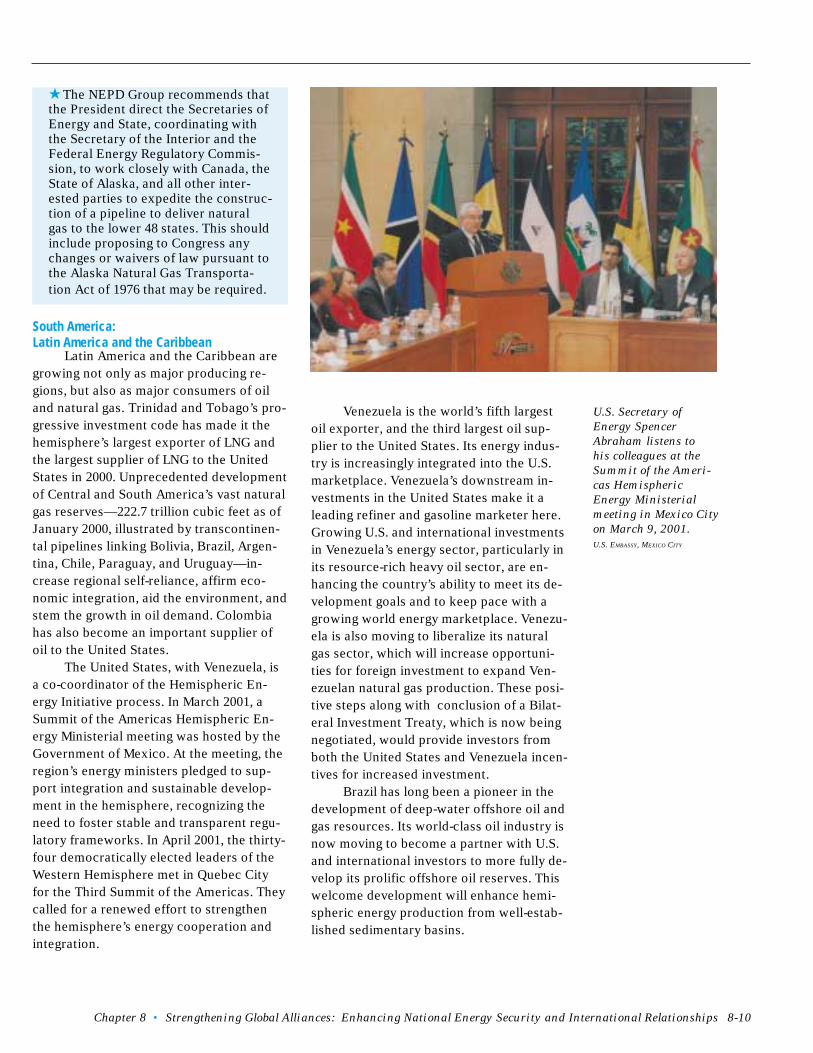
Chapter 8 • Strengthening Global Alliances: Enhancing National Energy Security and International Relationships
U.S. Secretary of
Energy Spencer
Abraham listens to
his colleagues at the
Summit of the Ameri-
cas Hemispheric
Energy Ministerial
meeting in Mexico City
on March 9, 2001.
U.S. EMBASSY, MEXICO CITY
★ The NEPD Group recommends thatthe President direct the Secretaries ofEnergy and State, coordinating withthe Secretary of the Interior and theFederal Energy Regulatory Commis-sion, to work closely with Canada, theState of Alaska, and all other inter-ested parties to expedite the construc-tion of a pipeline to deliver naturalgas to the lower 48 states. This shouldinclude proposing to Congress anychanges or waivers of law pursuant tothe Alaska Natural Gas Transporta-tion Act of 1976 that may be required.
South America:Latin America and the Caribbean
Latin America and the Caribbean aregrowing not only as major producing re-gions, but also as major consumers of oiland natural gas. Trinidad and Tobago’s pro-gressive investment code has made it thehemisphere’s largest exporter of LNG andthe largest supplier of LNG to the UnitedStates in 2000. Unprecedented developmentof Central and South America’s vast naturalgas reserves—222.7 trillion cubic feet as ofJanuary 2000, illustrated by transcontinen-tal pipelines linking Bolivia, Brazil, Argen-tina, Chile, Paraguay, and Uruguay—in-crease regional self-reliance, affirm eco-nomic integration, aid the environment, andstem the growth in oil demand. Colombiahas also become an important supplier ofoil to the United States.
The United States, with Venezuela, isa co-coordinator of the Hemispheric En-ergy Initiative process. In March 2001, aSummit of the Americas Hemispheric En-ergy Ministerial meeting was hosted by theGovernment of Mexico. At the meeting, theregion’s energy ministers pledged to sup-port integration and sustainable develop-ment in the hemisphere, recognizing theneed to foster stable and transparent regu-latory frameworks. In April 2001, the thirty-four democratically elected leaders of theWestern Hemisphere met in Quebec Cityfor the Third Summit of the Americas. Theycalled for a renewed effort to strengthenthe hemisphere’s energy cooperation andintegration.
Venezuela is the world’s fifth largestoil exporter, and the third largest oil sup-plier to the United States. Its energy indus-try is increasingly integrated into the U.S.marketplace. Venezuela’s downstream in-vestments in the United States make it aleading refiner and gasoline marketer here.Growing U.S. and international investmentsin Venezuela’s energy sector, particularly inits resource-rich heavy oil sector, are en-hancing the country’s ability to meet its de-velopment goals and to keep pace with agrowing world energy marketplace. Venezu-ela is also moving to liberalize its naturalgas sector, which will increase opportuni-ties for foreign investment to expand Ven-ezuelan natural gas production. These posi-tive steps along with conclusion of a Bilat-eral Investment Treaty, which is now beingnegotiated, would provide investors fromboth the United States and Venezuela incen-tives for increased investment.
Brazil has long been a pioneer in thedevelopment of deep-water offshore oil andgas resources. Its world-class oil industry isnow moving to become a partner with U.S.and international investors to more fully de-velop its prolific offshore oil reserves. Thiswelcome development will enhance hemi-spheric energy production from well-estab-lished sedimentary basins.
8-10
NATIONAL ENERGY POLICY
Recommendations:
★ The NEPD Group recommends thatthe President direct the Secretaries ofState and Commerce to conclude ne-gotiations with Venezuela on a Bilat-eral Investment Treaty, and proposeformal energy consultations with Bra-zil, to improve the energy investmentclimate for the growing level of energyinvestment flows between the UnitedStates and each of these countries.★ The NEPD Group recommends thatthe President direct the Secretaries ofEnergy, Commerce, and State to workthrough the Summit of the AmericasHemispheric Energy Initiative to de-velop effective and stable regulatoryframeworks and foster reliable supplysources of all fuels within the region.
AfricaSub-Saharan Africa holds 7 percent of
world oil reserves and comprises 11 percentof world oil production. Along with LatinAmerica, West Africa is expected to be oneof fastest-growing sources of oil and gas forthe American market. African oil tends tobe of high quality and low in sulfur, makingit suitable for stringent refined product re-quirements, and giving it a growing marketshare for refining centers on the East Coastof the United States.
In 2000, OPEC member Nigeria ex-ported an average of 900,000 barrels of oilper day to the United States, out of its totalproduction of 2.1 million barrels of oil perday. Nigeria, in partnership with the privatesector, has set ambitious production goalsas high as 5 million barrels of oil per dayover the coming decade.
Angola’s growing offshore oil indus-try, with participation by U.S. and interna-tional oil firms, is also a major source ofgrowth. In 2000, Angola exported 300,000barrels of oil per day out of its 750,000 bar-rels of oil per day of total production to theUnited States, and is thought to have thepotential to double its exports over the nextten years. Other significant exporters to theUnited States included Gabon and theCongo-Brazzaville.
The World Bank has supported Chad’sefforts to begin ambitious oil development.This year an international consortium thatincludes U.S. firms began investing $3.5 bil-lion in this pipeline from Chad to Cameroon,the largest infrastructure project in Africa to-day. When complete, the pipeline will allowChad to export up to 250,000 barrels of oilper day.
The U.S. Agency for International De-velopment (USAID) has provided technicalassistance in support of a West AfricaPower Pool and associated pipeline projectinvolving a number of U.S. oil companies,and is providing assistance for the creationof a regional regulatory framework that willenable Ghana and Nigeria to become majorexporters of natural gas and electricity.
The West Africa Gas Pipeline is a 161-mile (1,000-kilometer), $400 million on-shore/offshore natural gas pipeline connect-ing Nigeria with Benin, Togo, and Ghana.The pipeline is being built by a consortiumof companies, and includes financing by theU.S. Export-Import Bank.
Recommendations:
★ The NEPD Group recommends thatthe President direct the Secretaries ofState, Energy, and Commerce to rein-vigorate the U.S.-Africa Trade andEconomic Cooperation Forum and theU.S.-African Energy Ministerial pro-cess; deepen bilateral and multilateralengagement to promote a more recep-tive environment for U.S. oil and gastrade, investment, and operations; andpromote geographic diversification ofenergy supplies, addressing such is-sues as transparency, sanctity of con-tracts, and security.★ The NEPD Group recommends thatthe President direct the Secretaries ofState, Energy, and Commerce to re-cast the Joint Economic PartnershipCommittee with Nigeria to improvethe climate for U.S. oil and gas trade,investment, and operations and to ad-vance our shared energy interests.★ The NEPD Group recommends thatthe President direct the Secretaries of
8-11
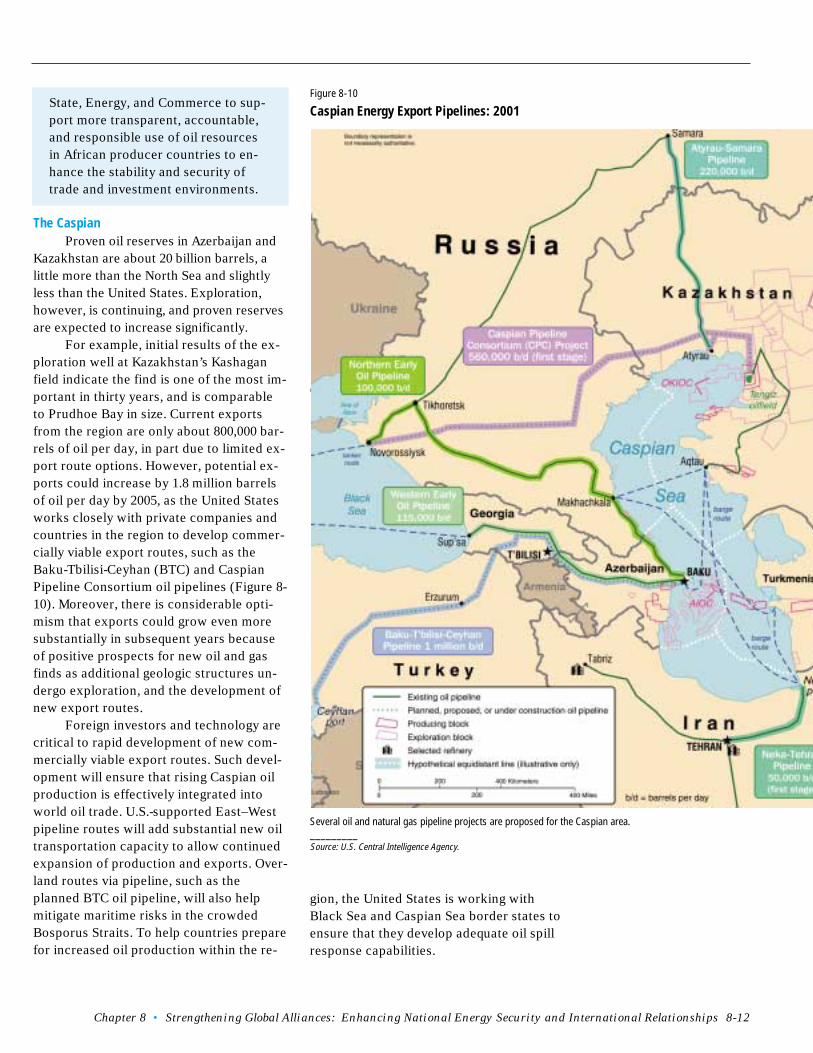
Chapter 8 • Strengthening Global Alliances: Enhancing National Energy Security and International Relationships
State, Energy, and Commerce to sup-port more transparent, accountable,and responsible use of oil resourcesin African producer countries to en-hance the stability and security oftrade and investment environments.
The CaspianProven oil reserves in Azerbaijan and
Kazakhstan are about 20 billion barrels, alittle more than the North Sea and slightlyless than the United States. Exploration,however, is continuing, and proven reservesare expected to increase significantly.
For example, initial results of the ex-ploration well at Kazakhstan’s Kashaganfield indicate the find is one of the most im-portant in thirty years, and is comparableto Prudhoe Bay in size. Current exportsfrom the region are only about 800,000 bar-rels of oil per day, in part due to limited ex-port route options. However, potential ex-ports could increase by 1.8 million barrelsof oil per day by 2005, as the United Statesworks closely with private companies andcountries in the region to develop commer-cially viable export routes, such as theBaku-Tbilisi-Ceyhan (BTC) and CaspianPipeline Consortium oil pipelines (Figure 8-10). Moreover, there is considerable opti-mism that exports could grow even moresubstantially in subsequent years becauseof positive prospects for new oil and gasfinds as additional geologic structures un-dergo exploration, and the development ofnew export routes.
Foreign investors and technology arecritical to rapid development of new com-mercially viable export routes. Such devel-opment will ensure that rising Caspian oilproduction is effectively integrated intoworld oil trade. U.S.-supported East–Westpipeline routes will add substantial new oiltransportation capacity to allow continuedexpansion of production and exports. Over-land routes via pipeline, such as theplanned BTC oil pipeline, will also helpmitigate maritime risks in the crowdedBosporus Straits. To help countries preparefor increased oil production within the re-
8-12
caspian fig 10
Several oil and natural gas pipeline projects are proposed for the Caspian area._________Source: U.S. Central Intelligence Agency.
Figure 8-10
Caspian Energy Export Pipelines: 2001
gion, the United States is working withBlack Sea and Caspian Sea border states toensure that they develop adequate oil spillresponse capabilities.
NATIONAL ENERGY POLICY
Recommendations:
★ The NEPD Group recommends thatthe President direct the Secretaries ofState, Commerce, and Energy to sup-port the BTC oil pipeline as it demon-strates its commercial viability.
★ The NEPD Group recommends thatthe President direct the Secretaries ofCommerce, State, and Energy to con-tinue working with relevant compa-nies and countries to establish thecommercial conditions that will allowoil companies operating in Kazakhstanthe option of exporting their oil via theBTC pipeline.
★ The NEPD Group recommends thatthe President direct the Secretaries ofState, Commerce, and Energy to sup-port the efforts of private investorsand regional governments to developthe Shah Deniz gas pipeline as a wayto help Turkey and Georgia diversifytheir natural gas supplies and helpAzerbaijan export its gas via a pipelinethat will continue diversification of se-cure energy supply routes.
★ The NEPD Group recommends thatthe President direct appropriate fed-eral agencies to complete the currentcycle of oil spill response readinessworkshops and to consider further ap-propriate steps to ensure the imple-mentation of the workshops’ recom-mendations.
★ The NEPD Group recommends thatthe President direct the Secretary ofState to encourage Greece and Turkeyto link their gas pipeline systems to al-low European consumers to diversifytheir gas supplies by purchasingCaspian gas.
★ The NEPD Group recommends thatthe President direct the Secretaries ofCommerce, Energy, and State todeepen their commercial dialoguewith Kazakhstan, Azerbaijan, andother Caspian states to provide astrong, transparent, and stable busi-ness climate for energy and related in-frastructure projects.
RussiaRussia has about 5 percent of the
world’s proven oil reserves. In 2000, Russiaproduced an average of 6.7 million barrelsof oil and natural gas liquids per day, mak-ing it both the world’s third largest pro-ducer and second largest exporter at 4.2million barrels of oil per day. Russia’s oilproduction in 2000 represented an increaseof 7 percent over 1999, the first increasesince the dissolution of the Soviet Union.A similar rate of increase is projected for2001. New fields are being developed, in-cluding those with U.S. and other foreign in-vestors.
Nevertheless, substantial infrastruc-ture investment is still needed, as well aslegislation and a stable and reliable regimeof contracting to finalize the ProductionSharing Agreement (PSA) mechanism forprivate-sector participation and actions toimprove the general investment climate.Russian oil firms are increasingly active ona global scale, with upstream and down-stream investments in the Caspian, theUnited States, Africa, South Asia, and Eu-rope, enhancing Russia’s ability to developits own and international oil reserves.
Russia holds 33 percent of the world’snatural gas reserves, exporting a full 35 per-cent of its production to Europe and Cen-tral Asia in 1999. Russian natural gas ex-ports can increase regional fuel diversifica-tion and advance environmental goals. Withproduction declines now evident in existingfields, development of new reserves that re-quire substantial new investments will benecessary.
Recommendations:
★ The NEPD Group recommends thatthe President direct the Secretaries ofState, Commerce, and Energy todeepen the focus of the discussionswith Russia on energy and the invest-ment climate.★ The NEPD Group recommends thatthe President direct the Secretaries ofCommerce, State, and Energy to assistU.S. companies in their dialogue onthe investment and trade climate with
8-13
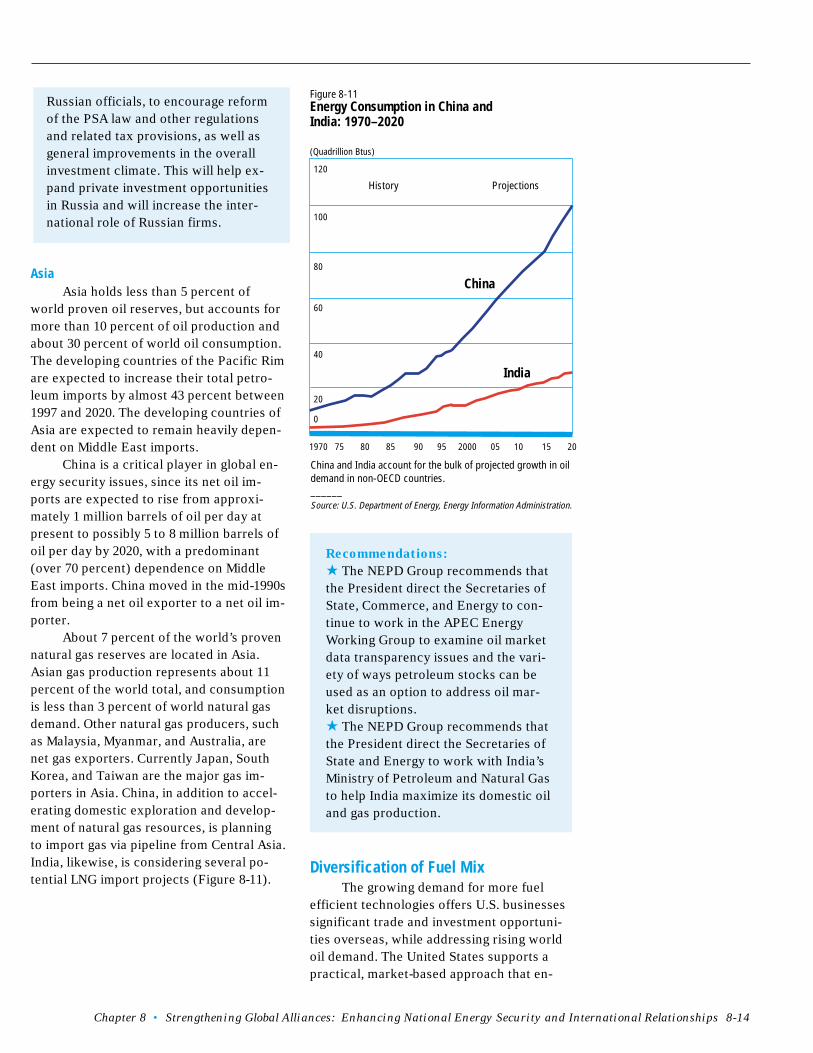
Chapter 8 • Strengthening Global Alliances: Enhancing National Energy Security and International Relationships
Recommendations:
★ The NEPD Group recommends thatthe President direct the Secretaries ofState, Commerce, and Energy to con-tinue to work in the APEC EnergyWorking Group to examine oil marketdata transparency issues and the vari-ety of ways petroleum stocks can beused as an option to address oil mar-ket disruptions.★ The NEPD Group recommends thatthe President direct the Secretaries ofState and Energy to work with India’sMinistry of Petroleum and Natural Gasto help India maximize its domestic oiland gas production.
Diversification of Fuel MixThe growing demand for more fuel
efficient technologies offers U.S. businessessignificant trade and investment opportuni-ties overseas, while addressing rising worldoil demand. The United States supports apractical, market-based approach that en-
8-14
China and India account for the bulk of projected growth in oildemand in non-OECD countries.______Source: U.S. Department of Energy, Energy Information Administration.
Figure 8-11Energy Consumption in China andIndia: 1970–2020
(Quadrillion Btus)
China
120
100
80
60
40
20
0
1970 75 80 85 90 95 2000 05 10 15 20
History Projections
India
Russian officials, to encourage reformof the PSA law and other regulationsand related tax provisions, as well asgeneral improvements in the overallinvestment climate. This will help ex-pand private investment opportunitiesin Russia and will increase the inter-national role of Russian firms.
AsiaAsia holds less than 5 percent of
world proven oil reserves, but accounts formore than 10 percent of oil production andabout 30 percent of world oil consumption.The developing countries of the Pacific Rimare expected to increase their total petro-leum imports by almost 43 percent between1997 and 2020. The developing countries ofAsia are expected to remain heavily depen-dent on Middle East imports.
China is a critical player in global en-ergy security issues, since its net oil im-ports are expected to rise from approxi-mately 1 million barrels of oil per day atpresent to possibly 5 to 8 million barrels ofoil per day by 2020, with a predominant(over 70 percent) dependence on MiddleEast imports. China moved in the mid-1990sfrom being a net oil exporter to a net oil im-porter.
About 7 percent of the world’s provennatural gas reserves are located in Asia.Asian gas production represents about 11percent of the world total, and consumptionis less than 3 percent of world natural gasdemand. Other natural gas producers, suchas Malaysia, Myanmar, and Australia, arenet gas exporters. Currently Japan, SouthKorea, and Taiwan are the major gas im-porters in Asia. China, in addition to accel-erating domestic exploration and develop-ment of natural gas resources, is planningto import gas via pipeline from Central Asia.India, likewise, is considering several po-tential LNG import projects (Figure 8-11).
NATIONAL ENERGY POLICY
courages the adoption of efficient technolo-gies, including those relating to natural gas,nuclear energy, and renewable energy. Thisapproach takes into account existing na-tional and international programs and hasthe potential to energize both public actionand private involvement. Introduction ofthese technologies abroad also supportsU.S. national interests by reducing competi-tion for the oil resources on which the glo-bal economy continues to rely. Overall, theU.S. government’s goal is to adopt policiesthat support innovative finance and marketmechanisms that will provide U.S. busi-nesses and consumers greater incentives tomake more cost effective, energy efficientinvestment and consumption decisions.
Increased use of renewable energytechnologies would improve U.S. energy se-curity, yield global environmental benefits,improve social and economic stability in thedeveloping world, and provide significanttrade and investment opportunities to U.S.businesses. Promotion of clean energy tech-nology exports can mitigate internationaldependence on oil supplies from volatile re-gions, help lower energy costs for U.S. con-sumers, bring U.S. firms greater access tolarge foreign markets, and enhance U.S. in-tegration with global sources of innovation.In consultation with U.S. industry, the U.S.government is participating in efforts of theIEA, the G-8, the OECD, the United Nations,and multilateral development banks to for-mulate effective strategies for acceleratedmarket penetration of renewable energytechnologies. Significant market penetra-tion will depend on further reducing thecosts of deploying these technologies.
The Clean Energy Technology ExportsWorking Group, a Federal interagency taskforce comprised of USAID and the Depart-ments of Commerce and Energy, is creatinga strategic plan that will provide a roadmapfor future exports of U.S. clean energy tech-nologies. Through its international tradeprograms, the Department of Commercewill showcase market-ready U.S. technolo-gies that generate a cleaner environmentand increase energy efficiency.
Recommendation:
★ The NEPD Group recommends thatthe President direct the Secretaries ofCommerce, State, and Energy to pro-mote market-based solutions to envi-ronmental concerns; support exportsof U.S. clean energy technologies andencourage their overseas develop-ment; engage bilaterally and multilat-erally to promote best practices; ex-plore collaborative international basicresearch and development in energyalternatives and energy efficient tech-nologies; and explore innovative pro-grams to support the global adoptionof these technologies.
Climate ChangeThe President is committed to ad-
dressing the issue of global climate changein a manner that protects our environmentand economy. Toward this end, the Admin-istration is undertaking a Cabinet-level re-view of domestic and international policiesfor addressing this issue.
The United States invited other nationsto re-examine global climate change issues,including technologies and market-basedsystems. Increasing our understanding of themost recent science and further researchinto the science of climate change will be es-sential to developing the optimal strategy.
There is increasing awareness of glo-bal competition for fossil fuels and their po-tential threats to the global environment.The United States can diminish both risksby becoming more energy efficient at home,by working with other nations, and by en-couraging developing countries to use thecleanest and most energy-efficient technolo-gies. Through educational programs, theUnited States can encourage developingcountries to use advanced U.S. energy tech-nologies, energy management practices, andmarket-based policies. The United States isuniquely positioned to help emerging na-tions build energy and institutional capacityand to finance energy-related activities andservices. Doing so could prove to be a cost-effective investment, for both the UnitedStates and emerging economies.
8-15
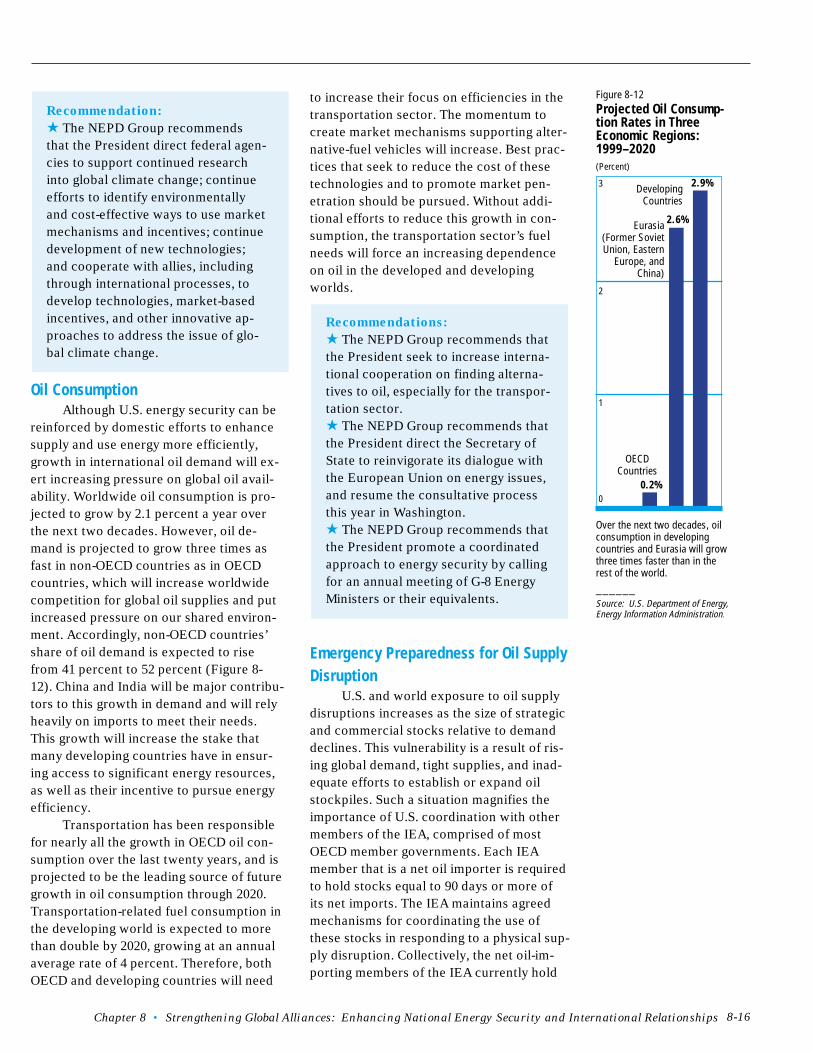
Chapter 8 • Strengthening Global Alliances: Enhancing National Energy Security and International Relationships
Recommendation:
★ The NEPD Group recommendsthat the President direct federal agen-cies to support continued researchinto global climate change; continueefforts to identify environmentallyand cost-effective ways to use marketmechanisms and incentives; continuedevelopment of new technologies;and cooperate with allies, includingthrough international processes, todevelop technologies, market-basedincentives, and other innovative ap-proaches to address the issue of glo-bal climate change.
Oil ConsumptionAlthough U.S. energy security can be
reinforced by domestic efforts to enhancesupply and use energy more efficiently,growth in international oil demand will ex-ert increasing pressure on global oil avail-ability. Worldwide oil consumption is pro-jected to grow by 2.1 percent a year overthe next two decades. However, oil de-mand is projected to grow three times asfast in non-OECD countries as in OECDcountries, which will increase worldwidecompetition for global oil supplies and putincreased pressure on our shared environ-ment. Accordingly, non-OECD countries’share of oil demand is expected to risefrom 41 percent to 52 percent (Figure 8-12). China and India will be major contribu-tors to this growth in demand and will relyheavily on imports to meet their needs.This growth will increase the stake thatmany developing countries have in ensur-ing access to significant energy resources,as well as their incentive to pursue energyefficiency.
Transportation has been responsiblefor nearly all the growth in OECD oil con-sumption over the last twenty years, and isprojected to be the leading source of futuregrowth in oil consumption through 2020.Transportation-related fuel consumption inthe developing world is expected to morethan double by 2020, growing at an annualaverage rate of 4 percent. Therefore, bothOECD and developing countries will need
8-16
Figure 8-12Projected Oil Consump-tion Rates in ThreeEconomic Regions:1999–2020(Percent)
Over the next two decades, oilconsumption in developingcountries and Eurasia will growthree times faster than in therest of the world.
______Source: U.S. Department of Energy,Energy Information Administration.
OECDCountries
DevelopingCountries
Eurasia(Former SovietUnion, Eastern
Europe, andChina)
3
2
1
0
2.9%
2.6%
0.2%
to increase their focus on efficiencies in thetransportation sector. The momentum tocreate market mechanisms supporting alter-native-fuel vehicles will increase. Best prac-tices that seek to reduce the cost of thesetechnologies and to promote market pen-etration should be pursued. Without addi-tional efforts to reduce this growth in con-sumption, the transportation sector’s fuelneeds will force an increasing dependenceon oil in the developed and developingworlds.
Recommendations:
★ The NEPD Group recommends thatthe President seek to increase interna-tional cooperation on finding alterna-tives to oil, especially for the transpor-tation sector.★ The NEPD Group recommends thatthe President direct the Secretary ofState to reinvigorate its dialogue withthe European Union on energy issues,and resume the consultative processthis year in Washington.★ The NEPD Group recommends thatthe President promote a coordinatedapproach to energy security by callingfor an annual meeting of G-8 EnergyMinisters or their equivalents.
Emergency Preparedness for Oil SupplyDisruption
U.S. and world exposure to oil supplydisruptions increases as the size of strategicand commercial stocks relative to demanddeclines. This vulnerability is a result of ris-ing global demand, tight supplies, and inad-equate efforts to establish or expand oilstockpiles. Such a situation magnifies theimportance of U.S. coordination with othermembers of the IEA, comprised of mostOECD member governments. Each IEAmember that is a net oil importer is requiredto hold stocks equal to 90 days or more ofits net imports. The IEA maintains agreedmechanisms for coordinating the use ofthese stocks in responding to a physical sup-ply disruption. Collectively, the net oil-im-porting members of the IEA currently hold
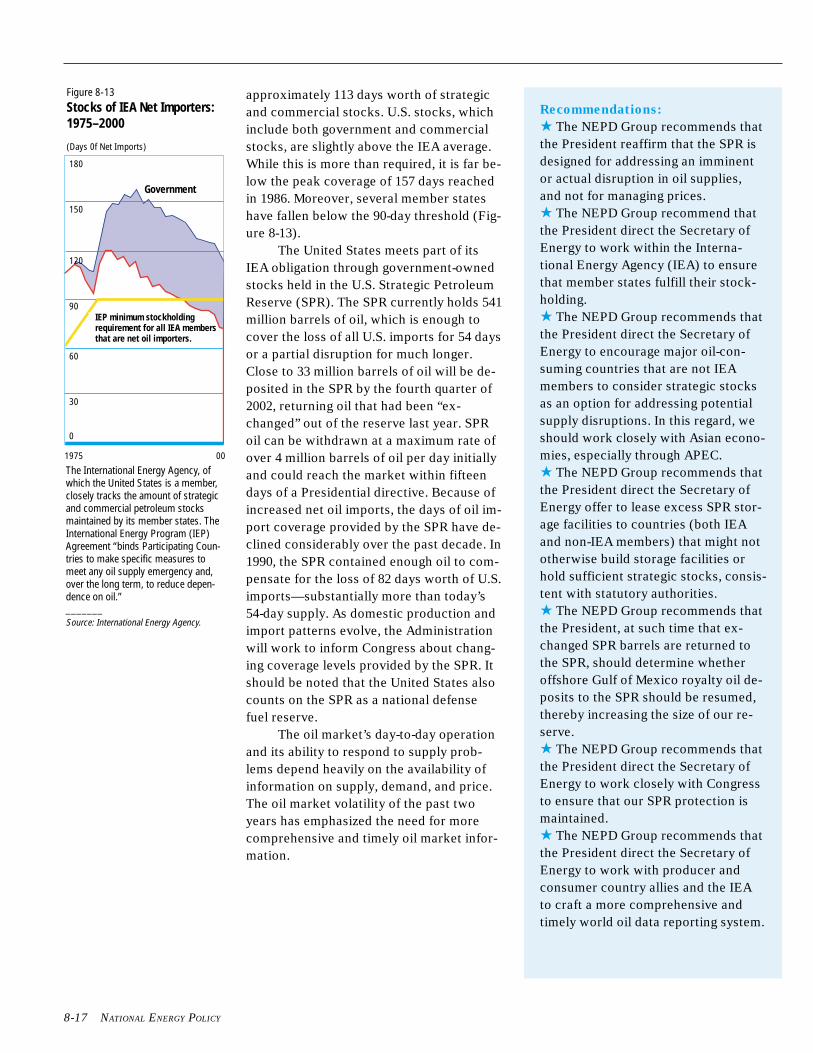
NATIONAL ENERGY POLICY
approximately 113 days worth of strategicand commercial stocks. U.S. stocks, whichinclude both government and commercialstocks, are slightly above the IEA average.While this is more than required, it is far be-low the peak coverage of 157 days reachedin 1986. Moreover, several member stateshave fallen below the 90-day threshold (Fig-ure 8-13).
The United States meets part of itsIEA obligation through government-ownedstocks held in the U.S. Strategic PetroleumReserve (SPR). The SPR currently holds 541million barrels of oil, which is enough tocover the loss of all U.S. imports for 54 daysor a partial disruption for much longer.Close to 33 million barrels of oil will be de-posited in the SPR by the fourth quarter of2002, returning oil that had been “ex-changed” out of the reserve last year. SPRoil can be withdrawn at a maximum rate ofover 4 million barrels of oil per day initiallyand could reach the market within fifteendays of a Presidential directive. Because ofincreased net oil imports, the days of oil im-port coverage provided by the SPR have de-clined considerably over the past decade. In1990, the SPR contained enough oil to com-pensate for the loss of 82 days worth of U.S.imports—substantially more than today’s54-day supply. As domestic production andimport patterns evolve, the Administrationwill work to inform Congress about chang-ing coverage levels provided by the SPR. Itshould be noted that the United States alsocounts on the SPR as a national defensefuel reserve.
The oil market’s day-to-day operationand its ability to respond to supply prob-lems depend heavily on the availability ofinformation on supply, demand, and price.The oil market volatility of the past twoyears has emphasized the need for morecomprehensive and timely oil market infor-mation.
Recommendations:
★ The NEPD Group recommends thatthe President reaffirm that the SPR isdesigned for addressing an imminentor actual disruption in oil supplies,and not for managing prices.★ The NEPD Group recommend thatthe President direct the Secretary ofEnergy to work within the Interna-tional Energy Agency (IEA) to ensurethat member states fulfill their stock-holding.★ The NEPD Group recommends thatthe President direct the Secretary ofEnergy to encourage major oil-con-suming countries that are not IEAmembers to consider strategic stocksas an option for addressing potentialsupply disruptions. In this regard, weshould work closely with Asian econo-mies, especially through APEC.★ The NEPD Group recommends thatthe President direct the Secretary ofEnergy offer to lease excess SPR stor-age facilities to countries (both IEAand non-IEA members) that might nototherwise build storage facilities orhold sufficient strategic stocks, consis-tent with statutory authorities.★ The NEPD Group recommends thatthe President, at such time that ex-changed SPR barrels are returned tothe SPR, should determine whetheroffshore Gulf of Mexico royalty oil de-posits to the SPR should be resumed,thereby increasing the size of our re-serve.★ The NEPD Group recommends thatthe President direct the Secretary ofEnergy to work closely with Congressto ensure that our SPR protection ismaintained.★ The NEPD Group recommends thatthe President direct the Secretary ofEnergy to work with producer andconsumer country allies and the IEAto craft a more comprehensive andtimely world oil data reporting system.
Industry
Government
1975 80 85 90 95 00
fig 13
Figure 8-13Stocks of IEA Net Importers:1975–2000
(Days 0f Net Imports)
180
150
120
90
60
30
0
IEP minimum stockholdingrequirement for all IEA membersthat are net oil importers.
The International Energy Agency, ofwhich the United States is a member,closely tracks the amount of strategicand commercial petroleum stocksmaintained by its member states. TheInternational Energy Program (IEP)Agreement “binds Participating Coun-tries to make specific measures tomeet any oil supply emergency and,over the long term, to reduce depen-dence on oil.”_______Source: International Energy Agency.
8-17
Chapter 8 • Strengthening Global Alliances: Enhancing National Energy Security and International Relationships
Summary of Recommendations
Strengthening Global Alliances: Enhancing National Energy Security and
International Relationships
★ The NEPD Group recommends that the President make energy security a priority ofour trade and foreign policy.
★ The NEPD Group recommends the President support initiatives by Saudi Arabia, Ku-wait, Algeria, Qatar, the UAE, and other suppliers to open up areas of their energy sec-tors to foreign investment.
★ The NEPD Group recommends that the President direct the Secretaries of State, En-ergy and Commerce work to improve dialogue among energy producing and consumingnations.
★ The NEPD Group recommends that the President direct the Secretaries of State,Commerce, and Energy to continue supporting American energy firms competing inmarkets abroad and use our membership in multilateral organizations, such as the Asia-Pacific Economic Cooperation (APEC) forum, the Organization for Economic Coopera-tion and Development (OECD), the World Trade Organization (WTO) Energy ServicesNegotiations, the Free Trade Area of the Americas (FTAA), and our bilateral relation-ships to implement a system of clear, open, and transparent rules and procedures gov-erning foreign investment; to level the playing field for U.S. companies overseas; and toreduce barriers to trade and investment.
★ The NEPD Group recommends that the President direct the Secretaries of Commerceand Energy, and the U.S. Trade Representative, to support a sectoral trade initiative toexpand investment and trade in energy-related goods and services that will enhance ex-ploration, production, and refining, as well as the development of new technologies.
★ The NEPD Group recommends that the President direct the Secretaries of State,Treasury, and Commerce to initiate a comprehensive review of sanctions. Energy secu-rity should be one of the factors considered in such a review.
★ The NEPD Group recommends that the President direct the Secretaries of State,Commerce, and Energy to engage in a dialogue through the North American EnergyWorking Group to develop closer energy integration among Canada, Mexico, and theUnited States and identify areas of cooperation, fully consistent with the countries’ re-spective sovereignties.
★ The NEPD Group recommends that the President direct the Secretaries of Energyand State, in consultation with the Federal Energy Regulatory Commission, to reviewtheir respective oil, natural gas, and electricity cross-boundary “Presidential Permitting”authorities, and to propose reforms as necessary in order to make their own regulatoryregimes more compatible for cross-border trade.
★ The NEPD Group recommends that the President direct the Secretaries of Energyand State, coordinating with the Secretary of the Interior and the Federal EnergyRegulatory Commission, to work closely with Canada, the State of Alaska, and allother interested parties to expedite the construction of a pipeline to deliver naturalgas to the lower 48 states. This should include proposing to Congress any changes orwaivers of law pursuant to the Alaska Natural Gas Transportation Act of 1976 that maybe required.
8-18
NATIONAL ENERGY POLICY8-19
★ The NEPD Group recommends that the President direct the Secretaries of State andCommerce to conclude negotiations with Venezuela on a Bilateral Investment Treaty,and propose formal energy consultations with Brazil, to improve the energy invest-ment climate for the growing level of energy investment flows between the UnitedStates and each of these countries.
★ The NEPD Group recommends that the President direct the Secretaries of Energy,Commerce, and State to work through the Summit of the Americas Hemispheric En-ergy Initiative to develop effective and stable regulatory frameworks and foster reli-able supply sources of all fuels within the region.
★ The NEPD Group recommends that the President direct the Secretaries of State,Energy, and Commerce to reinvigorate the U.S.-Africa Trade and Economic Coopera-tion Forum and the U.S.-African Energy Ministerial process; deepen bilateral and mul-tilateral engagement to promote a more receptive environment for U.S. oil and gastrade, investment, and operations; and promote geographic diversification of energysupplies, addressing such issues as transparency, sanctity of contracts, and security.
★ The NEPD Group recommends that the President direct the Secretaries of State,Commerce, and Energy to support more transparent, accountable, and responsible useof oil resources in African producer countries to enhance the stability and security oftrade and investment environments.
★ The NEPD Group recommends that the President direct the Secretaries of State,Commerce, and Energy to support the BTC oil pipeline as it demonstrates its commer-cial viability.
★ The NEPD Group recommends that the President direct the Secretaries of Com-merce, State, and Energy to continue working with relevant companies and countriesto establish the commercial conditions that will allow oil companies operating inKazakhstan the option of exporting their oil via the BTC pipeline.
★ The NEPD Group recommends that the President direct the Secretaries of State,Commerce, and Energy to support the efforts of private investors and regional govern-ments to develop the Shah Deniz gas pipeline as a way to help Turkey and Georgia di-versify their natural gas supplies and help Azerbaijan export its gas via a pipeline thatwill continue diversification of secure energy supply routes.
★ The NEPD Group recommends that the President direct appropriate federal agen-cies to complete the current cycle of oil spill response readiness workshops and toconsider further appropriate steps to ensure the implementation of the workshops’recommendations.
★ The NEPD Group recommends that the President direct the Secretary of State toencourage Greece and Turkey to link their gas pipeline systems to allow Europeanconsumers to diversify their gas supplies by purchasing Caspian gas.
Chapter 8 • Strengthening Global Alliances: Enhancing National Energy Security and International Relationships 8-20
★ The NEPD Group recommends that the President direct the Secretaries of Com-merce, Energy, and State to deepen their commercial dialogue with Kazakhstan,Azerbaijan, and other Caspian states to provide a strong, transparent, and stablebusiness climate for energy and related infrastructure projects.
★ The NEPD Group recommends that the President direct the Secretaries of State,Commerce, and Energy to deepen the focus of the discussions with Russia on energyand the investment climate.
★ The NEPD Group recommends that the President direct the Secretaries of Com-merce, State, and Energy to assist U.S. companies in their dialogue on the investmentand trade climate with Russian officials, to encourage reform of the PSA law and otherregulations and related tax provisions, as well as general improvements in the overallinvestment climate. This will help expand private investment opportunities in Russiaand will increase the international role of Russian firms.
★ The NEPD Group recommends that the President direct the Secretaries of State,Commerce, and Energy to continue to work in the APEC Energy Working Group to ex-amine oil market data transparency issues and the variety of ways petroleum stockscan be used as an option to address oil market disruptions.
★ The NEPD Group recommends that the President direct the Secretaries of State andEnergy to work with India’s Ministry of Petroleum and Natural Gas to help India maxi-mize its domestic oil and gas production.
★ The NEPD Group recommends that the President direct the Secretaries of Com-merce, State, and Energy to promote market-based solutions to environmental con-cerns; support exports of U.S. clean energy technologies and encourage their overseasdevelopment; engage bilaterally and multilaterally to promote best practices; explorecollaborative international basic research and development in energy alternatives andenergy-efficient technologies; and explore innovative programs to support the globaladoption of these technologies.
★ The NEPD Group recommends that the President direct federal agencies to supportcontinued research into global climate change; continue efforts to identify environ-mentally and cost-effective ways to use market mechanisms and incentives; continuedevelopment of new technologies; and cooperate with allies, including through inter-national processes, to develop technologies, market-based incentives, and other inno-vative approaches to address the issue of global climate change.
★ The NEPD Group recommends that the President seek to increase international co-operation on finding alternatives to oil, especially for the transportation sector.
★ The NEPD Group recommends that the President direct the Secretary of State to re-invigorate its dialogue with the European Union on energy issues, and resume the con-sultative process this year in Washington.
NATIONAL ENERGY POLICY
★ The NEPD Group recommends that the President promote a coordinated approachto energy security by calling for an annual meeting of G-8 Energy Ministers or theirequivalents.
★ The NEPD Group recommends that the President reaffirm that the SPR is designedfor addressing an imminent or actual disruption in oil supplies, and not for managingprices.
★ The NEPD Group recommend that the President direct the Secretary of Energy towork within the International Energy Agency (IEA) to ensure that member states ful-fill their stockholding.
★ The NEPD Group recommends that the President direct the Secretary of Energy toencourage major oil-consuming countries that are not IEA members to consider strate-gic stocks as an option for addressing potential supply disruptions. In this regard, weshould work closely with Asian economies, especially through APEC.
★ The NEPD Group recommends that the President direct the Secretary of Energy of-fer to lease excess SPR storage facilities to countries (both IEA and non-IEA mem-bers) that might not otherwise build storage facilities or hold sufficient strategicstocks, consistent with statutory authorities.
★ The NEPD Group recommends that the President, at such time that exchanged SPRbarrels are returned to the SPR, should determine whether offshore Gulf of Mexicoroyalty oil deposits to the SPR should be resumed, thereby increasing the size of ourreserve.
★ The NEPD Group recommends that the President direct the Secretary of Energy towork closely with Congress to ensure that our SPR protection is maintained.
★ The NEPD Group recommends that the President direct the Secretary of Energy towork with producer and consumer country allies and the IEA to craft a more compre-hensive and timely world oil data reporting system.
8-21
NATIONAL ENERGY POLICY
SUMMARY OF RECOMMENDATIONS
★ The NEPD Group recommends that the President issue an Executive Order to di-rect all federal agencies to include in any regulatory action that could significantly andadversely affect energy supplies, distribution, or use, a detailed statement on: (1) theenergy impact of the proposed action, (2) any adverse energy effects that cannot beavoided should the proposal be implemented, and (3) alternatives to the proposed ac-tion. The agencies would be directed to include this statement in all submissions tothe Office of Management and Budget of proposed regulations covered by ExecutiveOrder 12866, as well as in all notices of proposed regulations published in the FederalRegister.
★ The NEPD Group recommends that the President direct the executive agencies towork closely with Congress to implement the legislative components of a national en-ergy policy.
★ The NEPD Group recommends to the President that the NEPD Group continue towork and meet on the implementation of the National Energy Policy and explore oth-er ways to advance dependable, affordable, and environmentally responsible produc-tion and distribution of energy.
Note: All recommendations in this report are subject to execution in accordance with appli-
cable law. Legislation would be sought where needed. Also, any recommendations that in-
volve foreign countries would be executed in accordance with the customs of international
relations, including appropriate diplomatic consultation.
CHAPTER ONE
Taking Stock:Energy
ChallengesFacing the
United States
Appendix One
SUMMARY OF RECOMMENDATIONS
★ The NEPD Group recommends that the President direct the Secretary of Energy to ex-plore potential opportunities to develop educational programs related to energy develop-ment and use. This should include possible legislation to create public education aware-ness programs about energy. Such programs should be long-term in nature, should befunded and managed by the respective energy industries, and should include informationon energy’s compatibility with a clean environment.
★ The NEPD Group recommends that the President take steps to mitigate impacts ofhigh energy costs on low-income consumers. These steps would include:• Strengthening the Low Income Home Energy Assistance Program by making $1.7 bil-
lion available annually. This is an increase of $300 million over the regular FY 2001 ap-propriation.
• Directing the Secretaries of Interior and Health and Human Services to propose legis-lation to bolster LIHEAP funding by using a portion of oil and gas royalty payments.
• Redirecting royalties above a set trigger price to LIHEAP, whenever crude oil andnatural gas prices exceed that trigger price, as determined by the responsible agencies.
★ The NEPD Group recommends that the President increase funding for the Weatheriza-tion Assistance Program by $1.2 billion over ten years. This will roughly double the spend-ing during that period on weatherization. Consistent with that commitment, the FY 2002Budget includes a $120 million increase over 2001. The Department of Energy will havethe option of using a portion of those funds to test improved implementation approachesfor the weatherization program.
★ The NEPD Group recommends that the President support legislation to allow fundsdedicated for the Weatherization and State Energy Programs to be transferred to LIHEAPif the Department of Energy deems it appropriate.
★ The NEPD Group recommends the President recognize unique regional energy con-cerns by working with the National Governors Association and regional governor associa-tions to determine how to better serve the needs of diverse areas of the country.
★ The NEPD Group recommends the President direct FEMA to prepare for potential en-ergy emergencies.• FEMA should work with states’ Offices of Emergency Management as they expand
existing emergency operations plans to identify potential problems and address conse-quences of the power shortages. FEMA should use its current Regional Incident Re-porting System to identify any situations that might demand immediate attention.
• Using the structure of the already existing Federal Response Plan, FEMA should con-duct Regional Interagency Steering Committee (RISC) meetings for states affected bythe energy shortfalls. The RISC is a FEMA-led interagency committee comprised ofagencies and departments that support the Federal Response Plan. Either an upcom-ing, scheduled RISC meeting or a special-focus RISC meeting can be held to identifythe short-term energy outlook, as well as any expected consequences, in each of thestates during the peak summer season.
CHAPTER TWO
Striking HomeThe Impacts of
High EnergyPrices onFamilies,
Communities,and Businesses
NATIONAL ENERGY POLICY
SUMMARY OF RECOMMENDATIONS
★ The NEPD Group recommends that the President direct the Administrator of theEnvironmental Protection Agency (EPA) to propose multi-pollutant legislation. TheNEPD Group recommends that the President direct the EPA Administrator to workwith Congress to propose legislation that would establish a flexible, market-basedprogram to significantly reduce and cap emissions of sulfur dioxide, nitrogen oxides,and mercury from electric power generators. Such a program (with appropriatemeasures to address local concerns) would provide significant public health benefitseven as we increase electricity supplies.• Establish mandatory reduction targets for emissions of three main pollutants: sulfur
dioxide, nitrogen oxides, and mercury.• Phase in reductions over a reasonable period of time, similar to the successful acid
rain reduction program established by the 1990 amendments to the Clean Air Act.• Provide regulatory certainty to allow utilities to make modifications to their plants
without fear of new litigation.• Provide market-based incentives, such as emissions trading credits to help achieve
the required reductions.
★ The NEPD Group recommends the President direct the Secretary of the Interior towork with Congress to create the “Royalties Conservation Fund.”• This fund will earmark potentially billions of dollars in royalties from new oil and
gas production in ANWR to fund land conservation efforts.• This fund will also be used to eliminate the maintenance and improvements backlog
on federal lands.
★ The NEPD Group recommends the President issue an Executive Order to rational-ize permitting for energy production in an environmentally sound manner by directingfederal agencies to expedite permits and other federal actions necessary for energy-related project approvals on a national basis. This order would establish an inter-agency task force chaired by the Council on Environmental Quality to ensure thatfederal agencies responsible for permitting energy-related facilities are coordinatingtheir efforts. The task force will ensure that federal agencies set up appropriatemechanisms to coordinate federal, state, tribal, and local permitting activity in particu-lar regions where increased activity is expected.
CHAPTERTHREE
ProtectingAmerica’s
Environment:Sustaining the
Nation’sHealth and
Environment
Appendix One
SUMMARY OF RECOMMENDATIONS
★ The NEPD Group recommends that the President direct the Office of Science andTechnology Policy and the President’s Council of Advisors on Science and Technologyto review and make recommendations on using the nation’s energy resources more effi-ciently.
★ The NEPD Group recommends that the President direct the Secretary of Energy toconduct a review of current funding and historic performance of energy efficiency re-search and development programs in light of the recommendations of this report. Basedon this review, the Secretary of Energy is then directed to propose appropriate funding ofthose research and development programs that are performance-based and are modeledas public-private partnerships.
★ The NEPD Group recommends that the President direct the Secretary of Energy topromote greater energy efficiency.
• Expand the Energy Star program beyond office buildings to include schools, re-tail buildings, health care facilities, and homes.
• Extend the Energy Star labeling program to additional products, appliances, andservices.
• Strengthen Department of Energy public education programs relating to energyefficiency.
★ The NEPD Group recommends that the President direct the Secretary of Energy toimprove the energy efficiency of appliances.
• Support the appliance standards program for covered products, setting higherstandards where technologically feasible and economically justified.
• Expand the scope of the appliance standards program, setting standards for ad-ditional appliances where technologically feasible and economically justified.
★ The NEPD Group recommends that the President direct heads of executive depart-ments and agencies to take appropriate actions to conserve energy use at their facilitiesto the maximum extent consistent with the effective discharge of public responsibili-ties. Agencies located in regions where electricity shortages are possible should con-serve especially during periods of peak demand. Agencies should report to the Presi-dent, through the Secretary of Energy, within 30 days on the conservation actions taken.
★ The NEPD Group recommends that the President direct the Secretary of the Trea-sury to work with Congress to encourage increased energy efficiency through combinedheat and power (CHP) projects by shortening the depreciation life for CHP projects orproviding investment tax credits.
★ The NEPD Group recommends that the President direct the Administrator of the En-vironmental Protection Agency (EPA) to work with local and state governments to pro-mote the use of well-designed CHP and other clean power generation at brownfieldssites, consistent with the local communities’ interests. EPA will also work to clarify li-ability issues if they are raised at a particular site.
CHAPTER FOUR
Using EnergyWisely:
IncreasingEnergy
Conservationand Efficiency
NATIONAL ENERGY POLICY
SUMMARY OF RECOMMENDATIONS
★ The NEPD Group recommends that the President direct the EPA Administrator topromote CHP through flexibility in environmental permitting.
★ The NEPD Group recommends that the President direct the Secretary of Transporta-tion to:
• Review and provide recommendations on establishing Corporate Average FuelEconomy (CAFE) standards with due consideration of the National Academy ofSciences study to be released in July 2001. Responsibly crafted CAFE standardsshould increase efficiency without negatively impacting the U.S. automotive indus-try. The determination of future fuel economy standards must therefore be ad-dressed analytically and based on sound science.
• Consider passenger safety, economic concerns, and disparate impact on the U.S.versus foreign fleet of automobiles.
• Look at other market-based approaches to increasing the national average fueleconomy of new motor vehicles.
★ The new NEPD Group recommends that the President direct the Secretary of Trans-portation to review and promote congestion mitigation technologies and strategies andwork with Congress on legislation to implement these strategies.
★ The NEPD Group recommends that the President direct the Secretary of the Trea-sury to work with Congress on legislation to increase energy efficiency with a tax creditfor fuel-efficient vehicles. The NEPD Group recommends that a temporary, efficiency-based income tax credit be available for purchase of new hybrid fuel cell vehicles be-tween 2002 and 2007.
★ The NEPD Group recommends that the President direct all agencies to use techno-logical advances to better protect our environment.
• The Administration remains committed to investing in Intelligent TransportationSystems (ITS) and encourages the private sector to invest in ITS applications.This Department of Transportation (DOT) program funds the development ofimproved transportation infrastructure that will reduce congestion, such as trav-eler information/navigation systems, freeway management, and electronic tollcollection. ITS applications reduce fuel associated with travel.
• The Administration remains committed to the DOT’s fuel-cell-powered transitbus program, authored by the Transportation Equity Act for the 21st Century(TEA-21). This program demonstrates the viability of fuel-cell power plants fortransit bus applications.
• The Administration remains committed to the Clean Buses program. TEA-21 es-tablishes a new clean fuel formula grant program, which provides an opportu-nity to accelerate the introduction of advanced bus propulsion technologies intothe mainstream of the nation’s transit fleet.
CHAPTER FOUR
Appendix One
SUMMARY OF RECOMMENDATIONS
★ The NEPD Group recommends that the President direct the EPA and DOT to developways to reduce demand for petroleum transportation fuels by working with the truckingindustry to establish a program to reduce emissions and fuel consumption from long-haultrucks at truck stops by implementing alternatives to idling, such as electrification andauxiliary power units at truck stops along interstate highways. EPA and DOT will developpartnership agreements with trucking fleets, truck stops, and manufacturers of idle-re-ducing technologies (e.g., portable auxiliary packs, electrification) to install and use low-emission-idling technologies.
★ The NEPD Group recommends that the President direct the Secretary of Energy toestablish a national priority for improving energy efficiency. The priority would be to im-prove the energy intensity of the U.S. economy as measured by the amount of energy re-quired for each dollar of economic productivity. This increased efficiency should be pur-sued through the combined efforts of industry, consumers, and federal, state, and localgovernments.
★ The NEPD Group recommends that the President direct the EPA Administrator to de-velop and implement a strategy to increase public awareness of the sizable savings thatenergy efficiency offers to homeowners across the country. Typical homeowners cansave about 30 percent (about $400) a year on their home energy bill by using Energy Star-labeled products.
NATIONAL ENERGY POLICY
SUMMARY OF RECOMMENDATIONS
★ The NEPD Group recommends that the President direct the Secretaries of Energy andthe Interior to promote enhanced oil and gas recovery from existing wells through newtechnology.
★ The NEPD Group recommends that the President direct the Secretary of Energy toimprove oil and gas exploration technology through continued partnership with public andprivate entities.
★ The NEPD Group recommends that the President direct the Secretary of the Interior toexamine land status and lease stipulation impediments to federal oil and gas leasing, andreview and modify those where opportunities exist (consistent with the law, good environ-mental practice, and balanced use of other resources).
• Expedite the ongoing Energy Policy and Conservation Act study of impedi- m e n t sto federal oil and gas exploration and development.
• Review public lands withdrawals and lease stipulations, with full public consultation,especially with the people in the region, to consider modifications where appropriate.
★ The NEPD Group recommends that the President direct the Secretary of the Interior toconsider economic incentives for environmentally sound offshore oil and gas developmentwhere warranted by specific circumstances: explore opportunities for royalty reductions,consistent with ensuring a fair return to the public where warranted for enhanced oil andgas recovery; for reduction of risk associated with production in frontier areas or deep gasformations; and for development of small fields that would otherwise be uneconomic.
★ The NEPD Group recommends that the President direct the Secretaries of Commerceand Interior to re-examine the current federal legal and policy regime (statutes, regulations,and Executive Orders) to determine if changes are needed regarding energy-related activi-ties and the siting of energy facilities in the coastal zone and on the Outer Continental Shelf(OCS).
★ The NEPD Group recommends that the President direct the Secretary of the Interiorcontinue OCS oil and gas leasing and approval of exploration and development plans onpredictable schedules.
★ The NEPD Group recommends that the President direct the Secretary of the Interior toconsider additional environmentally responsible oil and gas development, based on soundscience and the best available technology, through further lease sales in the National Petro-leum Reserve-Alaska. Such consideration should include areas not currently leased withinthe Northeast corner of the Reserve.
★ The NEPD Group recommends that the President direct the Secretary of the Interiorwork with Congress to authorize exploration and, if resources are discovered, developmentof the 1002 Area of ANWR. Congress should require the use of the best available technologyand should require that activities will result in no significant adverse impact to the sur-rounding environment.
★ The NEPD Group recommends that the President direct the Secretary of the Interior towork with Congress and the State of Alaska to put in place the most expeditious process forrenewal of the Trans-Alaska Pipeline System rights-of-way to ensure that Alaskan oil contin-ues to flow uninterrupted to the West Coast of the United States.
Chapter FiveEnergy for a
New Century:IncreasingDomestic
EnergySupplies
Appendix One
SUMMARY OF RECOMMENDATIONS
★ The NEPD Group recommends that the President direct the Secretary of Energy to pro-pose comprehensive electricity legislation that promotes competition, protects consumers,enhances reliability, promotes renewable energy, improves efficiency repeals the Public UtilityHolding Company Act, and reforms the Public Utility Regulatory Policies Act.
★ The NEPD Group recommends that the President encourage FERC to use its existingstatutory authority to promote competition and encourage investment in transmission facili-ties.
★ The NEPD Group recognizes the importance of looking to technology to help us meet thegoals of increasing electricity generation while protecting our environment. To that end, theNEPD Group recommends that the President direct the Department of Energy to continueto develop advanced clean coal technology by:
• Investing $2 billion over 10 years to fund research in clean coal technologies.• Supporting a permanent extension of the existing research and development tax credit.• Directing federal agencies to explore regulatory approaches that will encourage ad-
vancements in environmental technology.
★ The NEPD Group recommends that the President direct federal agencies to providegreater regulatory certainty relating to coal electricity generation through clear policies thatare easily applied to business decisions.
★ The NEPD Group recommends that the President support the expansion of nuclear en-ergy in the United States as a major component of our national energy policy. Following arespecific components of the recommendation:
• Encourage the Nuclear Regulatory Commission (NRC) to ensure that safety and envi-ronmental protection are high priorities as they prepare to evaluate and expedite appli-cations for licensing new advanced-technology nuclear reactors.
• Encourage the NRC to facilitate efforts by utilities to expand nuclear energy generationin the United States by uprating existing nuclear plants safely.
• Encourage the NRC to relicense existing nuclear plants that meet or exceed safetystandards.
• Direct the Secretary of Energy and the Administrator of the Environmental Protection Agencyto assess the potential of nuclear energy to improve air quality.
• Increase resources as necessary for nuclear safety enforcement in light of the potentialincrease in generation.
• Use the best science to provide a deep geologic repository for nuclear waste.• Support legislation clarifying that qualified funds set aside by plant owners for eventual
decommissioning will not be taxed as part of the transaction.• Support legislation to extend the Price–Anderson Act.
★ The NEPD Group recommends that, in the context of developing advanced nuclear fuelcycles and next generation technologies for nuclear energy, the United States should reex-amine its policies to allow for research, development and deployment of fuel conditioningmethods (such as pyroprocessing) that reduce waste streams and enhance proliferation re-sistance. In doing so, the United States will continue to discourage the accumulation of sepa-rated plutonium, worldwide.
★ The United States should also consider technologies (in collaboration with interna-tional partners with highly developed fuel cycles and a record of close cooperation) to de-velop reprocessing and fuel treatment technologies that are cleaner, more efficient, less waste-intensive, and more proliferation-resistant.
NATIONAL ENERGY POLICY
SUMMARY OF RECOMMENDATIONS
★ The NEPD Group recognizes there is a need to reduce the time and cost of the hydro-power licensing process. The NEPD Group recommends that the President encourage theFederal Energy Regulatory Commission (FERC) and direct federal resource agencies to makethe licensing process more clear and efficient, while preserving environmental goals. In addi-tion, the NEPD Group recognizes the importance of optimizing the efficiency and reliabilityof existing hydropower facilities and will encourage the Administration to adopt efforts to-ward that end.
• Support administrative and legislative reform of the hydropower licensing process.• Direct federal resource agencies to reach interagency agreement on conflicting manda-
tory license conditions before they submit their conditions to FERC for inclusion in alicense.
• Encourage FERC to adopt appropriate deadlines for its own actions during the licensingprocess.
CHAPTER FIVE
Appendix One
SUMMARY OF RECOMMENDATIONS
★ The NEPD Group recommends that the President direct the Secretaries of theInterior and Energy to re-evaluate access limitations to federal lands in order toincrease renewable energy production, such as biomass, wind, geothermal, and solar.
★ The NEPD Group supports the increase of $39.2 million in the FY 2002 budgetamendment for the Department of Energy’s Energy Supply account that wouldprovide increased support for research and development of renewable energy re-sources.
★ The NEPD Group recommends that the President direct the Secretary of Energy toconduct a review of current funding and historic performance of renewable energyand alternative energy research and development programs in light of the recommen-dations of this report. Based on this review, the Secretary of Energy is then directed topropose appropriate funding of those research and development programs that areperformance-based and are modeled as public-private partnerships.
★ The NEPD Group recommends that the President direct the Secretary of theTreasury to work with Congress on legislation to expand the section 29 tax credit tomake it available for new landfill methane projects. The credit could be tiered, de-pending on whether a landfill is already required by federal law to collect and flare itsmethane emissions due to local air pollution concerns.
★ The NEPD Group recommends that the President direct the Secretary of theInterior to determine ways to reduce the delays in geothermal lease processing as partof the permitting review process.
★ The NEPD Group recommends that the President direct the Administrator of theEnvironmental Protection Agency to develop a new renewable energy partnershipprogram to help companies more easily buy renewable energy, as well as receiverecognition for the environmental benefits of their purchase, and help consumers bypromoting consumer choice programs that increase their knowledge about theenvironmental benefits of purchasing renewable energy.
★ The NEPD Group recommends that the President direct the Secretary of theTreasury to work with Congress on legislation to extend and expand tax credits forelectricity produced using wind and biomass. The President’s budget request extendsthe present 1.7 cents per kilowatt hour tax credit for electricity produced from windand biomass; expands eligible biomass sources to include forest-related sources,agricultural sources, and certain urban sources; and allows a credit for electricityproduced from biomass co-fired with coal.
★ The NEPD Group recommends that the President direct the Secretary of theTreasury to work with Congress on legislation to provide a new 15 percent tax creditfor residential solar energy property, up to a maximum credit of $2,000.
★ The NEPD Group recommends that the President direct the Secretaries of theInterior and Energy to work with Congress on legislation to use an estimated $1.2billion of bid bonuses from the environmentally responsible leasing of ANWR forfunding research into alternative and renewable energy resources, including wind,solar, geothermal, and biomass.
★ The NEPD Group recommends that the President direct the Secretary of theTreasury to work with Congress to continue the ethanol excise tax exemption.
CHAPTER SIX
Nature’sPower:
IncreasingAmerica’s Useof Renewable
andAlternative
Energy
NATIONAL ENERGY POLICY
SUMMARY OF RECOMMENDATIONS
★ The NEPD Group recommends that the President direct the Secretary of Energy todevelop next-generation technology—including hydrogen and fusion.• Develop an education campaign that communicates the benefits of alternativeforms of energy, including hydrogen and fusion.• Focus research and development efforts on integrating current programs regardinghydrogen, fuel cells, and distributed energy.• Support legislation reauthorizing the Hydrogen Energy Act.
★ The NEPD Group recommends that the President direct the Secretary of theTreasury to work with Congress to develop legislation to provide for a temporaryincome tax credit available for the purchase of new hybrid or fuel-cell vehiclesbetween 2002 and 2007.
★ The NEPD Group recommends that the President direct the Administrator of theEnvironmental Protection Agency to issue guidance to encourage the development ofwell-designed combined heat and power (CHP) units that are both highly efficientand have low emissions. The goal of this guidance would be to shorten the timeneeded to obtain each permit, provide certainty to industry by ensuring consistentimplementation across the country, and encourage the use of these cleaner, moreefficient technologies.
CHAPTER SIX
Appendix One
SUMMARY OF RECOMMENDATIONS
★ The NEPD Group recommends that the President direct the Secretary of Energy towork with the Federal Energy Regulatory Commission (FERC) to improve the reliabil-ity of the interstate transmission system and to develop legislation providing for en-forcement by a self-regulatory organization subject to FERC oversight.
★ The NEPD Group recommends that the President direct the Secretary of Energy toexpand the Department’s research and development on transmission reliability andsuperconductivity.
★ The NEPD Group recommends that the President direct the Secretary of Energy to au-thorize the Western Area Power Administration to explore relieving the “Path 15” bottle-neck through transmission expansion financed by nonfederal contributions.
★ The NEPD Group recommends that the President direct the appropriate federalagencies to take actions to remove constraints on the interstate transmission grid andallow our nation’s electricity supply to meet the growing needs of our economy.• Direct the Secretary of Energy, by December 31, 2001, to examine the benefits of
establishing a national grid, identify transmission bottlenecks, and identify mea-sures to remove transmission bottlenecks.
• Direct the Secretary of Energy to work with FERC to relieve transmission con-straints by encouraging the use of incentive rate-making proposals.
• Direct the federal utilities to determine whether transmission expansions are nec-essary to remove constraints. The Administration should review the BonnevillePower Administration’s (BPA’s) capital and financing requirements in the context ofits membership in a regional RTO, and if additional Treasury financing appears war-ranted or necessary in the future, the Administration should seek an increase inBPA’s borrowing authority at that time.
• Direct the Secretary of Energy, in consultation with appropriate federal agenciesand state and local government officials, to develop legislation to grant authority toobtain rights-of-way for electricity transmission lines, with the goal of creating a re-liable national transmission grid. Similar authority already exists for natural gaspipelines in recognition of their role in interstate commerce.
★ The NEPD Group recommends that the President direct the Secretary of the Inte-rior to work with Congress and the State of Alaska to put in place the most expedi-tious process for renewal of the Trans-Alaskan Pipeline System lease to ensure thatAlaskan oil continues to flow uninterrupted to the West Coast of the United States.
★ The NEPD Group recommends that the President direct the Secretaries of Energyand State, coordinating with the Secretary of the Interior and the Federal EnergyRegulatory Commission, to work closely with Canada, the State of Alaska, and allother interested parties to expedite the construction of a pipeline to deliver naturalgas to the lower 48 states. This should include proposing to Congress any changes orwaivers of law pursuant to the Alaska Natural Gas Transportation Act of 1976 thatmay be required.
★ The NEPD Group recommends that the President support legislation to improvethe safety of natural gas pipelines, protect the environment, strengthen emergencypreparedness and inspections and bolster enforcement.
CHAPTER SEVEN
America’sEnergy
Infrastructure:A
ComprehensiveDeliverySystem
NATIONAL ENERGY POLICY
SUMMARY OF RECOMMENDATIONS
★ The NEPD Group recommends that the President direct agencies to continue theirinteragency efforts to improve pipeline safety and expedite pipeline permitting in anenvironmentally sound manner and encourage FERC to consider improvements inthe regulatory process governing approval of interstate natural gas pipeline projects.
★ The NEPD Group recommends that the President direct the Administrator of theEPA to study opportunities to maintain or improve the environmental benefits ofstate and local “boutique” clean fuel programs while exploring ways to increase theflexibility of the fuels distribution infrastructure, improve fungibility, and provideadded gasoline market liquidity. In concluding this study, the Administrator shall con-sult with the Departments of Energy and Agriculture, and other agencies as needed.
★ The NEPD Group recommends that the President direct the Administrator of theEnvironmental Protection Agency and the Secretary of Energy to take steps to ensureAmerica has adequate refining capacity to meet the needs of consumers.• Provide more regulatory certainty to refinery owners and streamline the permitting
process where possible to ensure that regulatory overlap is limited.• Adopt comprehensive regulations (covering more than one pollutant and require-
ment) and consider the rules’ cumulative impacts and benefits.
★ The NEPD Group recommends that the President direct the Administrator of theEnvironmental Protection Agency, in consultation with the Secretary of Energy andother relevant agencies, to review New Source Review regulations, including adminis-trative interpretation and implementation, and report to the President within 90 dayson the impact of the regulations on investment in new utility and refinery generationcapacity, energy efficiency, and environmental protection.
★ The NEPD Group recommends that the President direct the Attorney General toreview existing enforcement actions regarding New Source Review to ensure that theenforcement actions are consistent with the Clean Air Act and its regulations.
★ The NEPD Group supports the President’s budget proposal to provide $8 million tomaintain the two-million-barrel Northeast Heating Oil Reserve. Operated by the pri-vate sector, the Reserve helps ensure adequate supplies of heating oil in the eventthat colder than normal winters occur in the Northeast United States.
CHAPTER SEVEN
Appendix One
SUMMARY OF RECOMMENDATIONS
★ The NEPD Group recommends that the President make energy security a priority ofour trade and foreign policy.
★ The NEPD Group recommends the President support initiatives by Saudi Arabia, Ku-wait, Algeria, Qatar, the UAE, and other suppliers to open up areas of their energy sec-tors to foreign investment.
★ The NEPD Group recommends that the President direct the Secretaries of State, En-ergy and Commerce work to improve dialogue among energy producing and consumingnations.
★ The NEPD Group recommends that the President direct the Secretaries of State,Commerce, and Energy to continue supporting American energy firms competing inmarkets abroad and use our membership in multilateral organizations, such as the Asia-Pacific Economic Cooperation (APEC) forum, the Organization for Economic Coopera-tion and Development (OECD), the World Trade Organization (WTO) Energy ServicesNegotiations, the Free Trade Area of the Americas (FTAA), and our bilateral relation-ships to implement a system of clear, open, and transparent rules and procedures gov-erning foreign investment; to level the playing field for U.S. companies overseas; and toreduce barriers to trade and investment.
★ The NEPD Group recommends that the President direct the Secretaries of Commerceand Energy, and the U.S. Trade Representative, to support a sectoral trade initiative toexpand investment and trade in energy-related goods and services that will enhance ex-ploration, production, and refining, as well as the development of new technologies.
★ The NEPD Group recommends that the President direct the Secretaries of State,Treasury, and Commerce to initiate a comprehensive review of sanctions. Energy securi-ty should be one of the factors considered in such a review.
★ The NEPD Group recommends that the President direct the Secretaries of State,Commerce, and Energy to engage in a dialogue through the North American EnergyWorking Group to develop closer energy integration among Canada, Mexico, and theUnited States and identify areas of cooperation, fully consistent with the countries’ re-spective sovereignties.
★ The NEPD Group recommends that the President direct the Secretaries of Energyand State, in consultation with the Federal Energy Regulatory Commission, to reviewtheir respective oil, natural gas, and electricity cross-boundary “Presidential Permitting”authorities, and to propose reforms as necessary in order to make their own regulatoryregimes more compatible for cross-border trade.
★ The NEPD Group recommends that the President direct the Secretaries of Energyand State, coordinating with the Secretary of the Interior and the Federal EnergyRegulatory Commission, to work closely with Canada, the State of Alaska, and allother interested parties to expedite the construction of a pipeline to deliver naturalgas to the lower 48 states. This should include proposing to Congress any changes orwaivers of law pursuant to the Alaska Natural Gas Transportation Act of 1976 that
CHAPTER 8Strengthening
GlobalAlliances:
EnhancingNational
EnergySecurity andInternationalRelationships
NATIONAL ENERGY POLICY
SUMMARY OF RECOMMENDATIONS
may be required.
★ The NEPD Group recommends that the President direct the Secretaries of State andCommerce to conclude negotiations with Venezuela on a Bilateral Investment Treaty,and propose formal energy consultations with Brazil, to improve the energy investmentclimate for the growing level of energy investment flows between the United States andeach of these countries.
★ The NEPD Group recommends that the President direct the Secretaries of Energy,Commerce, and State to work through the Summit of the Americas Hemispheric Ener-gy Initiative to develop effective and stable regulatory frameworks and foster reliablesupply sources of all fuels within the region.
★ The NEPD Group recommends that the President direct the Secretaries of State, En-ergy, and Commerce to reinvigorate the U.S.-Africa Trade and Economic CooperationForum and the U.S.-African Energy Ministerial process; deepen bilateral and multilater-al engagement to promote a more receptive environment for U.S. oil and gas trade, in-vestment, and operations; and promote geographic diversification of energy supplies,addressing such issues as transparency, sanctity of contracts, and security.
★ The NEPD Group recommends that the President direct the Secretaries of State,Commerce, and Energy to support more transparent, accountable, and responsible useof oil resources in African producer countries to enhance the stability and security oftrade and investment environments.
★ The NEPD Group recommends that the President direct the Secretaries of State,Commerce, and Energy to support the BTC oil pipeline as it demonstrates its commer-cial viability.
★ The NEPD Group recommends that the President direct the Secretaries of Com-merce, State, and Energy to continue working with relevant companies and countriesto establish the commercial conditions that will allow oil companies operating in Kaza-khstan the option of exporting their oil via the BTC pipeline.
★ The NEPD Group recommends that the President direct the Secretaries of State,Commerce, and Energy to support the efforts of private investors and regional govern-ments to develop the Shah Deniz gas pipeline as a way to help Turkey and Georgia di-versify their natural gas supplies and help Azerbaijan export its gas via a pipeline thatwill continue diversification of secure energy supply routes.
★ The NEPD Group recommends that the President direct appropriate federal agen-cies to complete the current cycle of oil spill response readiness workshops and toconsider further appropriate steps to ensure the implementation of the workshops’ rec-ommendations.
★ The NEPD Group recommends that the President direct the Secretary of State to en-courage Greece and Turkey to link their gas pipeline systems to allow European con-sumers to diversify their gas supplies by purchasing Caspian gas.
CHAPTER EIGHT
Appendix One
SUMMARY OF RECOMMENDATIONS
★ The NEPD Group recommends that the President direct the Secretaries of Com-merce, Energy, and State to deepen their commercial dialogue with Kazakhstan, Azer-baijan, and other Caspian states to provide a strong, transparent, and stablebusiness climate for energy and related infrastructure projects.
★ The NEPD Group recommends that the President direct the Secretaries of State,Commerce, and Energy to deepen the focus of the discussions with Russia on energyand the investment climate.
★ The NEPD Group recommends that the President direct the Secretaries of Com-merce, State, and Energy to assist U.S. companies in their dialogue on the investmentand trade climate with Russian officials, to encourage reform of the PSA law and otherregulations and related tax provisions, as well as general improvements in the overallinvestment climate. This will help expand private investment opportunities in Russiaand will increase the international role of Russian firms.
★ The NEPD Group recommends that the President direct the Secretaries of State,Commerce, and Energy to continue to work in the APEC Energy Working Group to ex-amine oil market data transparency issues and the variety of ways petroleum stockscan be used as an option to address oil market disruptions.
★ The NEPD Group recommends that the President direct the Secretaries of State andEnergy to work with India’s Ministry of Petroleum and Natural Gas to help India maxi-mize its domestic oil and gas production.
★ The NEPD Group recommends that the President direct the Secretaries of Com-merce, State, and Energy to promote market-based solutions to environmental con-cerns; support exports of U.S. clean energy technologies and encourage their overseasdevelopment; engage bilaterally and multilaterally to promote best practices; explorecollaborative international basic research and development in energy alternatives andenergy-efficient technologies; and explore innovative programs to support the globaladoption of these technologies.
★ The NEPD Group recommends that the President direct federal agencies to supportcontinued research into global climate change; continue efforts to identify environ-mentally and cost-effective ways to use market mechanisms and incentives; continuedevelopment of new technologies; and cooperate with allies, including through inter-national processes, to develop technologies, market-based incentives, and other inno-vative approaches to address the issue of global climate change.
★ The NEPD Group recommends that the President seek to increase international co-operation on finding alternatives to oil, especially for the transportation sector.
★ The NEPD Group recommends that the President direct the Secretary of State to re-invigorate its dialogue with the European Union on energy issues, and resume the con-sultative process this year in Washington.
★ The NEPD Group recommends that the President promote a coordinated approachto energy security by calling for an annual meeting of G-8 Energy Ministers or theirequivalents.
NATIONAL ENERGY POLICY
SUMMARY OF RECOMMENDATIONS
★ The NEPD Group recommends that the President reaffirm that the SPR is designedfor addressing an imminent or actual disruption in oil supplies, and not for managingprices.
★ The NEPD Group recommend that the President direct the Secretary of Energy towork within the International Energy Agency (IEA) to ensure that member states ful-fill their stockholding.
★ The NEPD Group recommends that the President direct the Secretary of Energy toencourage major oil-consuming countries that are not IEA members to consider stra-tegic stocks as an option for addressing potential supply disruptions. In this regard,we should work closely with Asian economies, especially through APEC.
★ The NEPD Group recommends that the President direct the Secretary of Energy of-fer to lease excess SPR storage facilities to countries (both IEA and non-IEA mem-bers) that might not otherwise build storage facilities or hold sufficient strategicstocks, consistent with statutory authorities.
★ The NEPD Group recommends that the President, at such time that exchangedSPR barrels are returned to the SPR, should determine whether offshore Gulf of Mexi-co royalty oil deposits to the SPR should be resumed, thereby increasing the size ofour reserve.
★ The NEPD Group recommends that the President direct the Secretary of Energy towork closely with Congress to ensure that our SPR protection is maintained.
★ The NEPD Group recommends that the President direct the Secretary of Energy towork with producer and consumer country allies and the IEA to craft a more compre-hensive and timely world oil data reporting system.
CHAPTER EIGHT
Glossary • Appendix Two
GlossaryBarrel (Oil): A unit of volume equal to 42 U.S. gallons.
Barrels per Day (Operable Refinery Capacity): The maximum number of barrels of in-put that can be processed during a 24-hour period after making allowances for the followinglimitations: the capability of downstream facilities to absorb the output of crude oil process-ing facilities of a given refinery (no reduction is made when a planned distribution of inter-mediate streams through other than downstream facilities is part of a refinery’s normal op-eration); the types and grades of inputs to be processed; the types and grades of products tobe manufactured; the environmental constraints associated with refinery operations; the re-duction of capacity for scheduled downtime, such as routine inspection, mechanical prob-lems, maintenance, repairs, and turnaround; and the reduction of capacity for unscheduleddowntime, such as mechanical problems, repairs, and slowdowns.
Biomass: Organic nonfossil material of biological origin constituting a renewable energysource.
British Thermal Unit (Btu): The quantity of heat needed to raise the temperature of 1pound of water by 1°F at or near 39.2°F.
Coal: A readily combustible black or brownish-black rock whose composition, including in-herent moisture, consists of more than 50 percent by weight and more than 70 percent byvolume of carbonaceous material. It is formed from plant remains that have been com-pacted, hardened, chemically altered, and metamorphosed by heat and pressure over geo-logic time.
Cogeneration: The production of electricity and another form of useful energy (such asheat or steam) used for industrial, commercial, heating, or cooling purposes.
Commercial Building: A building with more than 50 percent of its floor space used forcommercial activities. Commercial buildings include stores, offices, schools, churches, gym-nasiums, libraries, museums, hospitals, clinics, warehouses, and jails. Government buildingsare also included, except buildings on military bases or reservations.
Commercial Sector: Business establishments that are not engaged in transportation or inmanufacturing or other types of industrial activity (agriculture, mining, or construction).Commercial establishments include hotels, motels, restaurants, wholesale businesses, retailstores, laundries, and other service enterprises; religious and nonprofit organizations;health, social, and educational institutions; and federal, state, and local governments.Streetlights, pumps, bridges, and public services are also included if the establishment oper-ating them is considered commercial.
Conversion Factor: A number that translates units of one system into corresponding val-ues of another system. Conversion factors can be used to translate physical units of mea-sure for various fuels into Btu equivalents.
NATIONAL ENERGY POLICY
Crude Oil: A mixture of hydrocarbons that exists in liquid phase in natural undergroundreservoirs and remains liquid at atmospheric pressure after passing through surface separat-ing facilities. Crude oil may also include:
• Small amounts of hydrocarbons that exist in the gaseous phase in natural under-ground reservoirs but are liquid at atmospheric pressure after being recovered fromoil well (casing head) gas in lease separators and that subsequently are commingledwith the crude stream without being separately measured.
• Small amounts of nonhydrocarbons produced with the oil, such as sulfur and othercompounds
Crude Oil Stocks: Stocks of crude oil and lease condensate held at refineries, in pipelines,at pipeline terminals, and on leases.
District Heat: Steam or hot water from an outside source used as an energy source in abuilding. The steam or hot water is produced in a central plant and is piped into the build-ing. District heat may be purchased from a utility or provided by a physical plant in a sepa-rate building that is part of the same facility (for example, a hospital complex or university).
Electric Power Plant: A station containing prime movers, electric generators, and auxil-iary equipment for converting mechanical, chemical, and/or fission energy into electric en-ergy.
Electricity Generation: The process of producing electric energy or transforming otherforms of energy into electric energy. Also, the amount of electric energy produced or ex-pressed in watt-hours (Wh).
End-Use Sectors: The residential, commercial, industrial, and transportation sectors of theeconomy.
Energy: The capacity for doing work as measured by the capability of doing work (poten-tial energy), or the conversion of this capability to motion (kinetic energy). Energy has sev-eral forms, some of which are easily convertible and can be changed to another form usefulfor work. Most of the world’s convertible energy comes from fossil fuels that are burned toproduce heat that is then used as a transfer medium to mechanical or other means in orderto accomplish tasks. Electrical energy is usually measured in kilowatt-hours, while heat en-ergy is usually measured in British thermal units.
Energy Consumption: The use of energy as a source of heat or power or as an input in themanufacturing process.
Energy Source: A substance, such as oil, natural gas, or coal, that supplies heat or power.Electricity and renewable forms of energy, such as wood, waste, geothermal, wind, and so-lar, are considered to be energy sources.
Exports: Shipments of goods from the 50 states and the District of Columbia to foreigncountries and to Puerto Rico, the Virgin Islands, and other U.S. possessions and territories.
Federal Energy Regulatory Commission (FERC): The federal agency with jurisdictionover interstate electricity sales, wholesale electric rates, hydroelectric licensing, natural gaspricing, oil pipeline rates, and gas pipeline certification. FERC is an independent regulatoryagency within the Department of Energy and is the successor to the Federal Power Com-mission.
Glossary • Appendix Two
Fossil Fuel: Any naturally occurring organic fuel formed in the Earth’s crust, such as oil,coal, and natural gas.
Fuel Ethanol: An anhydrous, denatured aliphatic alcohol intended for motor gasolineblending.
Gas-Turbine Electric Power Plant: A plant in which the prime mover is a gas turbine. Agas turbine typically consists of an axial-flow air compressor and one or more combustionchambers where liquid or gaseous fuel is burned. The hot gases expand to drive the genera-tor and then are used to run the compressor.
Geothermal Energy: Energy from the internal heat of the Earth, which may be residualheat, friction heat, or a result of radioactive decay. The heat is found in rocks and fluids atvarious depths and can be extracted by drilling or pumping.
Gross Domestic Product (GDP): The total value of goods and services produced by la-bor and property located in the United States.
Hydrocarbon: An organic chemical compound of hydrogen and carbon in the gaseous, liq-uid, or solid phase. The molecular structure of hydrocarbon compounds varies from thesimplest (methane, a constituent of natural gas) to the very heavy and very complex.
Hydropower: The production of electricity from the kinetic energy of falling water.
Hydropower Plant: A plant in which the turbine generators are driven by falling water.
Independent Power Producer: Wholesale electricity producers (other than qualifying fa-cilities under the Public Utilities Regulatory Policies Act of 1978) that are unaffiliated withfranchised utilities in the area in which the independent power producers are selling powerand that lack significant marketing power. Unlike traditional electric utilities, independentpower producers do not possess transmission facilities that are essential to their customersand do not sell power in any retail service territory where they have a franchise.
Industrial Sector: Manufacturing industries, which make up the largest part of the sector,along with mining, construction, agriculture, fisheries, and forestry. Establishments in thissector range from steel mills, to small farms, to companies assembling electronic compo-nents.
Jet Fuel: A refined petroleum product used in jet aircraft engines. It includes kerosene-type jet fuel and naphtha-type jet fuel.
Methane: Hydrocarbon gas, which is the major component of natural gas.
Methanol: A light, volatile alcohol eligible for motor gasoline blending.
Methyl Tertiary Butyl Ether (MTBE): An ether, intended for motor gasoline blending.
NATIONAL ENERGY POLICY
Natural Gas: A gaseous mixture of hydrocarbon compounds, primarily methane, deliveredvia pipeline for consumption. It is used as a fuel for electricity generation, a variety of usesin buildings, and as raw material input and fuel for industrial processes. Note: This product,also referred to as dry natural gas or consumer-grade natural gas, is the product that re-mains after wet natural gas has been processed at lease facilities and/or natural gas pro-cessing plants. This processing removes nonhydrocarbon gases (e.g., water vapor, carbondioxide, helium, hydrogen sulfide, and nitrogen) that would otherwise make the gas unmar-ketable and natural gas liquids.
Natural Gas, Dry: The marketable portion of natural gas production, which is obtained bysubtracting extraction losses, including natural gas liquids removed at natural gas process-ing plants, from total production.
Natural Gas, Wet: A mixture of hydrocarbon compounds and small quantities of variousnonhydrocarbons existing in the gaseous phase or in solution with crude oil in porous rockformations at reservoir conditions. The principal hydrocarbons normally contained in themixture are methane, ethane, propane, butane, and pentanes. Typical nonhydrocarbongases that may be present in reservoir natural gas are water vapor, carbon dioxide, helium,hydrogen sulfide, and nitrogen. Under reservoir conditions, natural gas and the liquefiableportions occur either in a single gaseous phase in the reservoir or in solution with oil andare not distinguishable at the time as separate substances.
Nitrogen Oxides (NOx): Compounds of nitrogen and oxygen produced by the burning offossil fuels.
North American Electric Reliability Council (NERC): A council formed in 1968 by theelectric utility industry to promote the reliability and adequacy of bulk power supply in theelectric utility systems of North America. The NERC consists of ten regional reliabilitycouncils and encompasses essentially all the power systems of the contiguous UnitedStates and Canada.
Nuclear Electric Power: Electricity generated by an electric power plant whose turbinesare driven by steam generated in a reactor by heat from the fissioning of nuclear fuel.
Organization for Economic Cooperation and Development (OECD): Current mem-bers are Australia, Austria, Belgium, Canada, Czech Republic, Denmark and its territories(Faroe Islands and Greenland), Finland, France, Germany, Greece, Greenland, Hungary,Iceland, Ireland, Italy, Japan, Luxembourg, Mexico, the Netherlands, New Zealand, Norway,Poland, Portugal, South Korea, Spain, Sweden, Switzerland, Turkey, United Kingdom, andUnited States and its territories (Guam, Puerto Rico, and Virgin Islands).
Organization of Petroleum Exporting Countries (OPEC): Countries that have orga-nized for the purpose of negotiating with oil companies on matters of oil production, prices,and future concession rights. Current members are Algeria, Indonesia, Iran, Iraq, Kuwait,Libya, Nigeria, Qatar, Saudi Arabia, United Arab Emirates, and Venezuela.
Photovoltaic Energy: Direct-current electricity generated from sunlight through solid-state semiconductor devices that have no moving parts.
Glossary • Appendix Two
Pipeline, Natural Gas: A continuous pipe conduit, complete with such equipment asvalves, compressor stations, communications systems, and meters, for transporting naturalgas and/or supplemental gaseous fuels from one point to another, usually from a point in orbeyond the producing field or processing plant to another pipeline or to points of use. Alsorefers to a company operating such facilities.
Pipeline, Oil: Oil and product pipelines (including interstate, intrastate, and intracompanypipelines) used to transport oil and petroleum products, respectively, within the 50 statesand the District of Columbia.
Proved Reserves, Oil: The estimated quantities of all liquids defined as crude oil that geo-logical and engineering data demonstrate with reasonable certainty to be recoverable in fu-ture years from known reservoirs under existing economic and operating conditions.
Proved Reserves, Natural Gas: The estimated quantities of natural gas that analysis ofgeological and engineering data demonstrates with reasonable certainty to be recoverablein future years from known reservoirs under existing economic and operating conditions.
Refinery (Oil): An installation that manufactures finished fuels from oil, unfinished oils,natural gas liquids, other hydrocarbons, and alcohol.
Renewable Energy: Energy obtained from sources that are essentially inexhaustible (un-like, for example, fossil fuels, of which there is a finite supply). Renewable sources of en-ergy include conventional hydroelectric power, wood, waste, geothermal, wind, photovol-taic, and solar thermal energy.
Spot Price: The price for a one-time open market transaction for immediate delivery of thespecific quantity of product at a specific location where the commodity is purchased “onthe spot” at current market rates.
Strategic Petroleum Reserve (SPR): Petroleum stocks maintained by the federal gov-ernment for use during periods of major supply interruption.
Stocks: Supplies of fuel or other energy source(s) stored for future use. Stocks are re-ported as of the end of the reporting period.
Sulfur Dioxide (SO2): A toxic, colorless gas soluble in water, alcohol, and ether. Used as
a chemical intermediate in paper pulping and ore refining, and as a solvent.
Transportation Sector: Private and public vehicles that move people and commodities.Included are automobiles, trucks, buses, motorcycles, railroads, and railways (includingstreetcars), aircraft, ships, barges, and natural gas pipelines.
Wellhead Price: The price of oil or natural gas at the mouth of the well.
Wind Energy: The kinetic energy of wind converted into mechanical energy by wind tur-bines (i.e., blades rotating from a hub) that drive generators to produce electricity.
Wood Energy: Wood and wood products used as fuel, including round wood (cord wood),limb wood, wood chips, bark, sawdust, forest residues, charcoal, pulp waste, and spentpulping liquor.