Nanoscale chemical reaction induced in chemically ... · Nanoscale chemical reaction induced in...
17
1 The Institute of Scientific and Industrial Research, Osaka University Nanoscale chemical reaction induced in chemically amplified resists upon exposure to extreme ultraviolet radiation Takahiro Kozawa
Transcript of Nanoscale chemical reaction induced in chemically ... · Nanoscale chemical reaction induced in...
1The Institute of Scientific and Industrial Research, Osaka University
Nanoscale chemical reaction induced in chemically amplified resists upon exposure to extreme ultraviolet radiation
Takahiro Kozawa
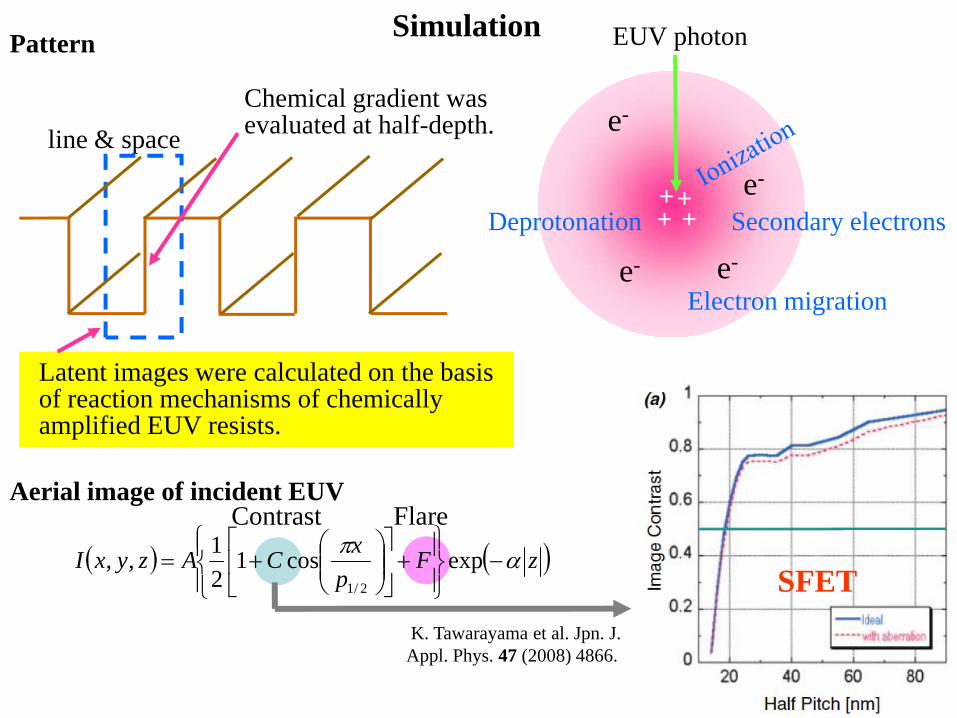
Simulation
line & space
Aerial image of incident EUV
( ) ( )zFp
xCAzyxI απ−
⎪⎭
⎪⎬⎫
⎪⎩
⎪⎨⎧
+⎥⎦
⎤⎢⎣
⎡⎟⎟⎠
⎞⎜⎜⎝
⎛+= expcos1
21,,
2/1
Pattern
SFETK. Tawarayama et al. Jpn. J. Appl. Phys. 47 (2008) 4866.
FlareContrast
e-
e-
e-
e-
++++
EUV photon
Secondary electronsDeprotonation
Electron migration
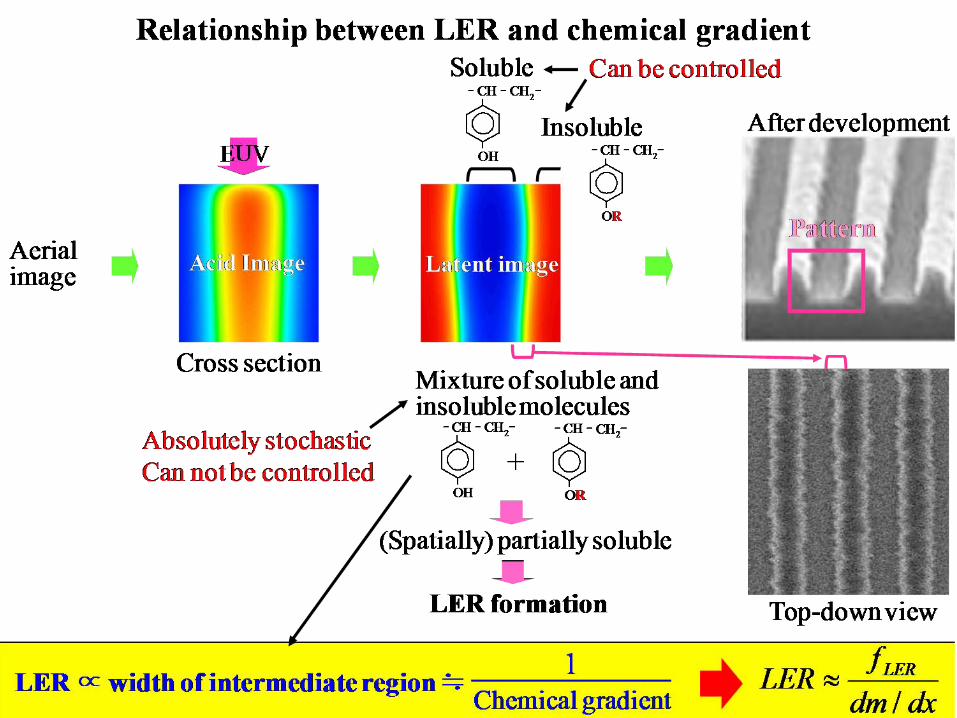
Latent images were calculated on the basis of reaction mechanisms of chemically amplified EUV resists.
Chemical gradient was evaluated at half-depth.

2
*2*
xID
tI
∂∂
=∂∂
( )⎥⎥⎦
⎤
⎢⎢⎣
⎡⎟⎟⎠
⎞⎜⎜⎝
⎛−⎟⎟
⎠
⎞⎜⎜⎝
⎛+= 2
2/1
2
2/1
* expcos12
,,,p
Dtp
xCAtzyxI ππ
)2
(1 2/1*
*2/1* p
xI
IpNILS
∂∂
=
⎟⎟⎠
⎞⎜⎜⎝
⎛−=⎟
⎟⎠
⎞⎜⎜⎝
⎛−
∂∂
=2
2/1
22
22/1
22
2/1 2exp
2exp1
pNILS
pxI
Ip πσπσ
( ) ( )
( )nm
ECfdrrp
drrpdrrrp
EUVAGexcitationelectronAG
electronAGelectronAG14.3
30 )(
0 )(0 )(=
⎥⎦⎤
⎢⎣⎡ +
≈
∫∫∫
∞
∞∞
σ
Effect of secondary electron migration on acid image quality
▲ Without secondary electron migration● With secondary electron migration○ Replotted using NILS*
Photon migration approximation
Dt2=σ : electron diffusion length
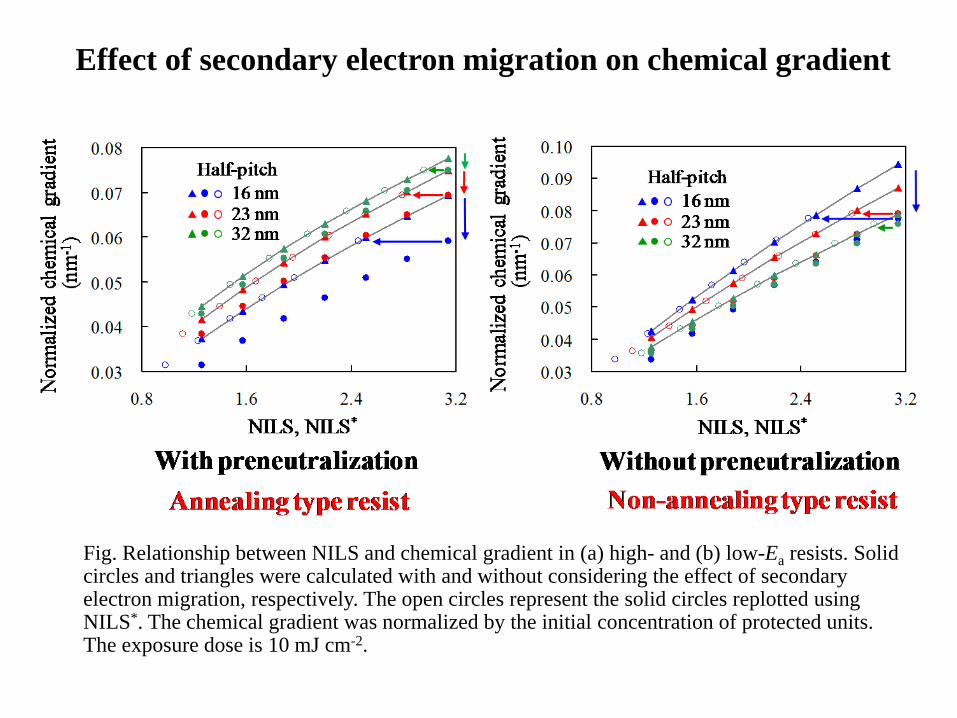
Effect of secondary electron migration on chemical gradient
Fig. Relationship between NILS and chemical gradient in (a) high- and (b) low-Ea resists. Solid circles and triangles were calculated with and without considering the effect of secondary electron migration, respectively. The open circles represent the solid circles replotted using NILS*. The chemical gradient was normalized by the initial concentration of protected units. The exposure dose is 10 mJ cm-2.
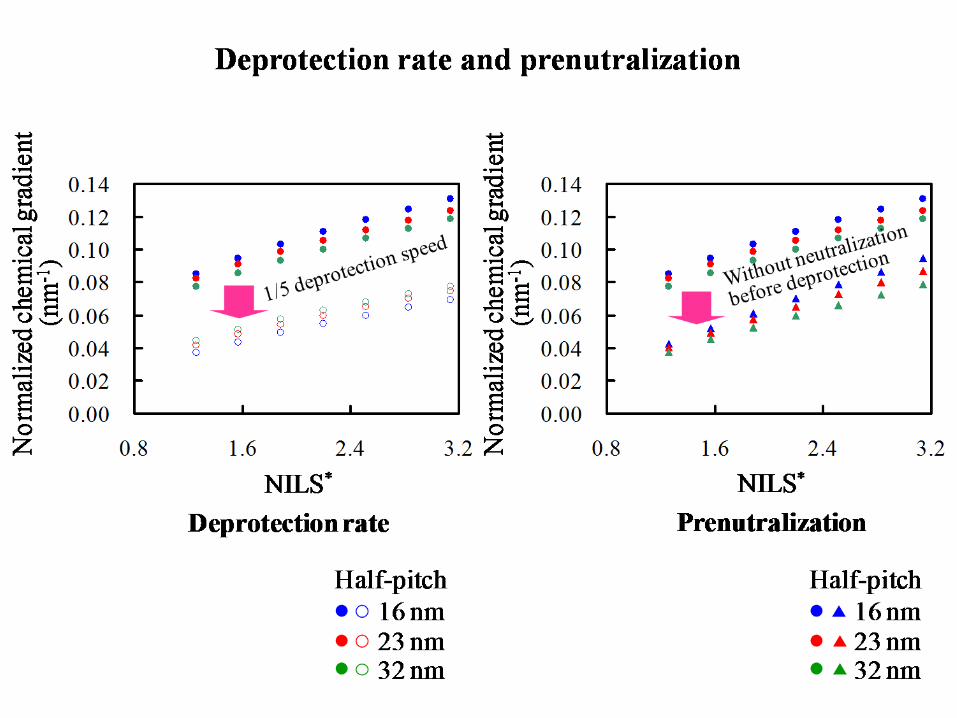
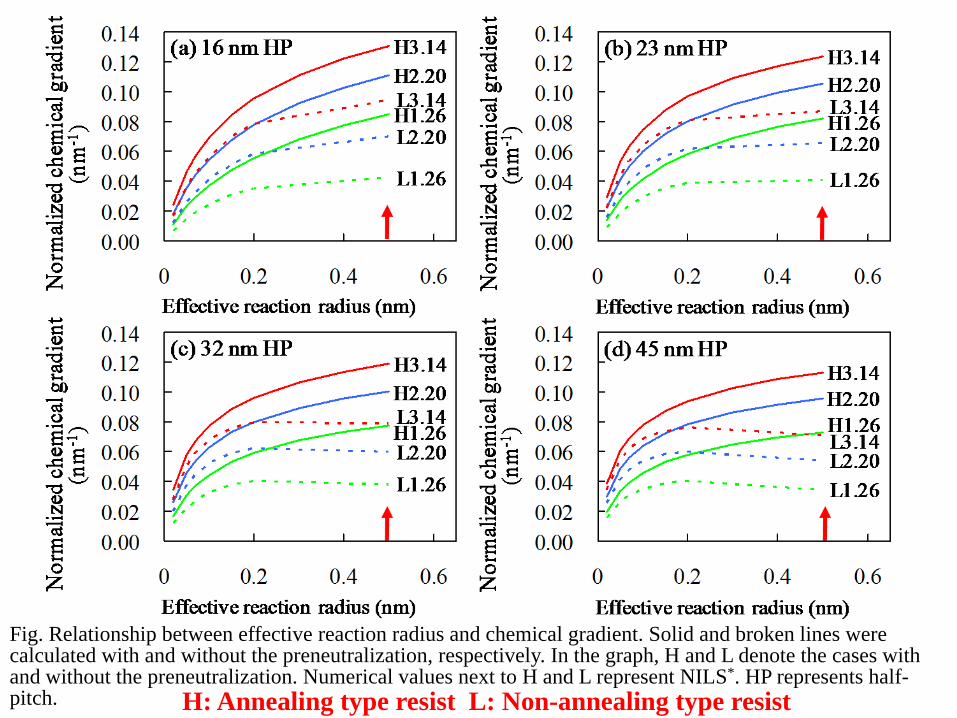
Fig. Relationship between effective reaction radius and chemical gradient. Solid and broken lines were calculated with and without the preneutralization, respectively. In the graph, H and L denote the cases with and without the preneutralization. Numerical values next to H and L represent NILS*. HP represents half-pitch. H: Annealing type resist L: Non-annealing type resist

Fig. Relationship between NILS* and LER. Solid and broken lines were calculated with and without the preneutralization, respectively. In the graph, H and L denote the cases with and without the preneutralization. Numerical values next to H and L represent the effective reaction radius in nm. The half-pitch is 16 nm.
H: Annealing type resist L: Non-annealing type resist
Relationship between NILS* and LER

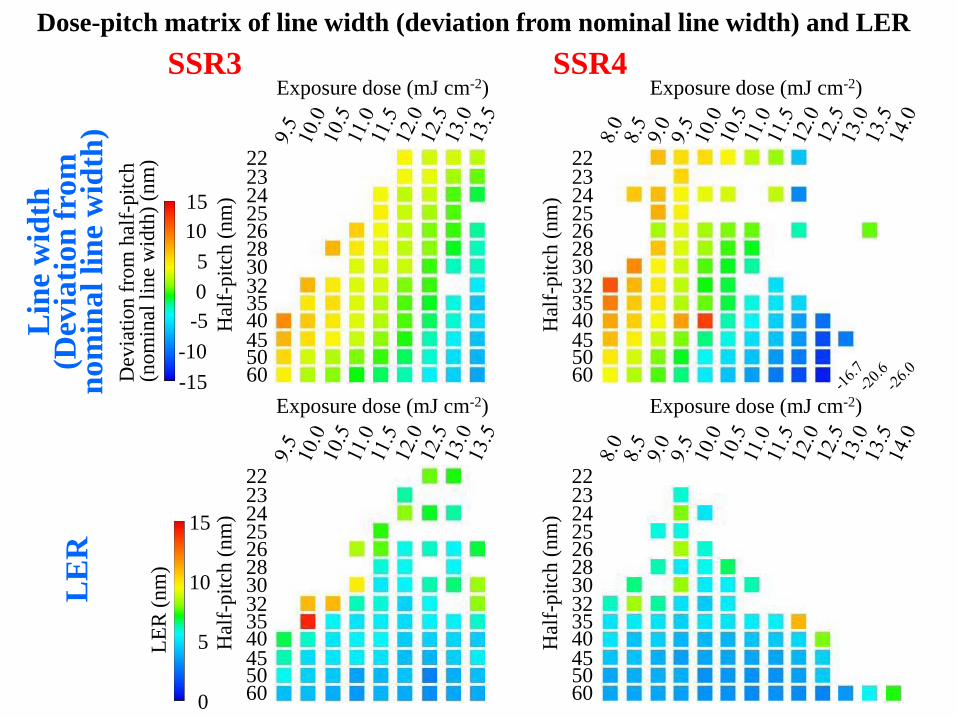
Dose-pitch matrix of line width (deviation from nominal line width) and LER
Hal
f-pi
tch
(nm
)
22232425262830323540455060
Exposure dose (mJ cm-2)
-15
15
Dev
iatio
n fr
om h
alf-
pitc
h (n
omin
al li
ne w
idth
) (nm
)
-5-10
0
105
Hal
f-pi
tch
(nm
)
22232425262830323540455060
Exposure dose (mJ cm-2)
0
15
LER
(nm
)
10
5
Lin
e w
idth
(Dev
iatio
n fr
om
nom
inal
line
wid
th)
LE
RSSR3 SSR4
Hal
f-pi
tch
(nm
)
22232425262830323540455060
Exposure dose (mJ cm-2)
Hal
f-pi
tch
(nm
)
22232425262830323540455060
Exposure dose (mJ cm-2)
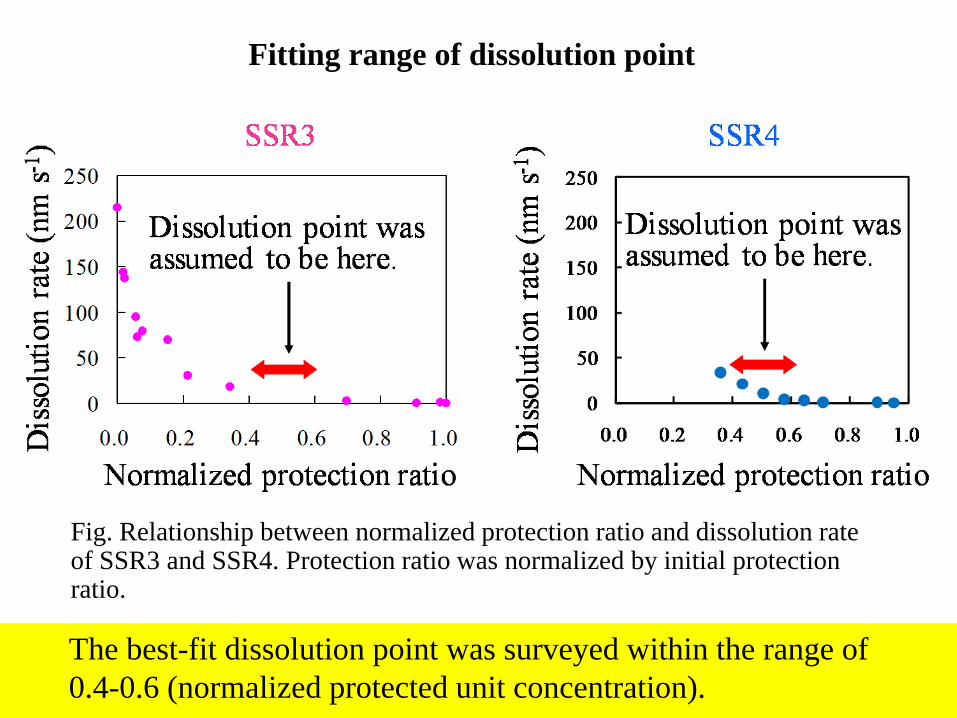
Fitting range of dissolution point
Fig. Relationship between normalized protection ratio and dissolution rate of SSR3 and SSR4. Protection ratio was normalized by initial protection ratio.
The best-fit dissolution point was surveyed within the range of 0.4-0.6 (normalized protected unit concentration).

Hal
f-pi
tch
(nm
)22232425262830323540455060
Exposure dose (mJ cm-2)
-15
15
Dev
iatio
n fr
om h
alf-
pitc
h (n
omin
al li
ne w
idth
) (nm
)
-5-10
0
105
22232425262830323540455060
Exposure dose (mJ cm-2)
16.7
15.9
22232425262830323540455060
Exposure dose (mJ cm-2)
30
-30-20
-10
010
20
Erro
r (%
)
Hal
f-pi
tch
(nm
)
22232425262830323540455060
Exposure dose (mJ cm-2)
(a) Experimental (b) Simulation0
15
LER
(nm
)
10
5
22232425262830323540455060
Exposure dose (mJ cm-2)
11864
60
-60-40
-20
020
40
Erro
r (%
)
(c) Error distrubtion
22232425262830323540455060
Exposure dose (mJ cm-2)
Analysis of SSR3Line width(deviation)
LER
R: 0.1 nm
100.
..×
−sim
simmes
100.
..×
−sim
simmes

Analysis of SSR4 R: 0.05 nm
100.
..×
−sim
simmes
100.
..×
−sim
simmes

Summary
The enhancement of chemical gradient is essential to the reduction of LER without sacrificing resolution and LER.
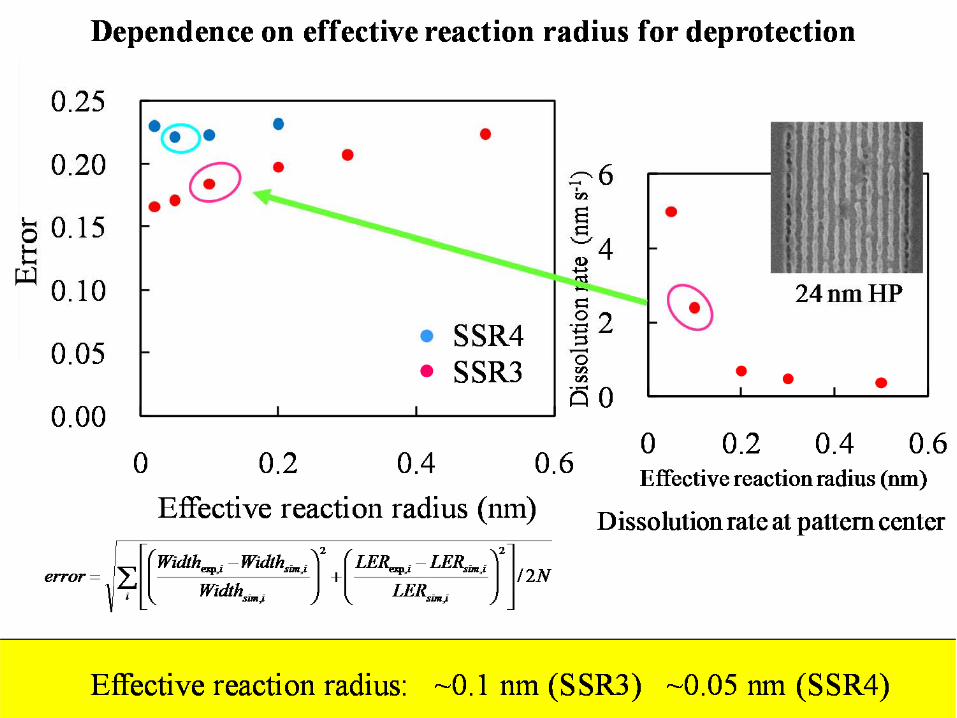
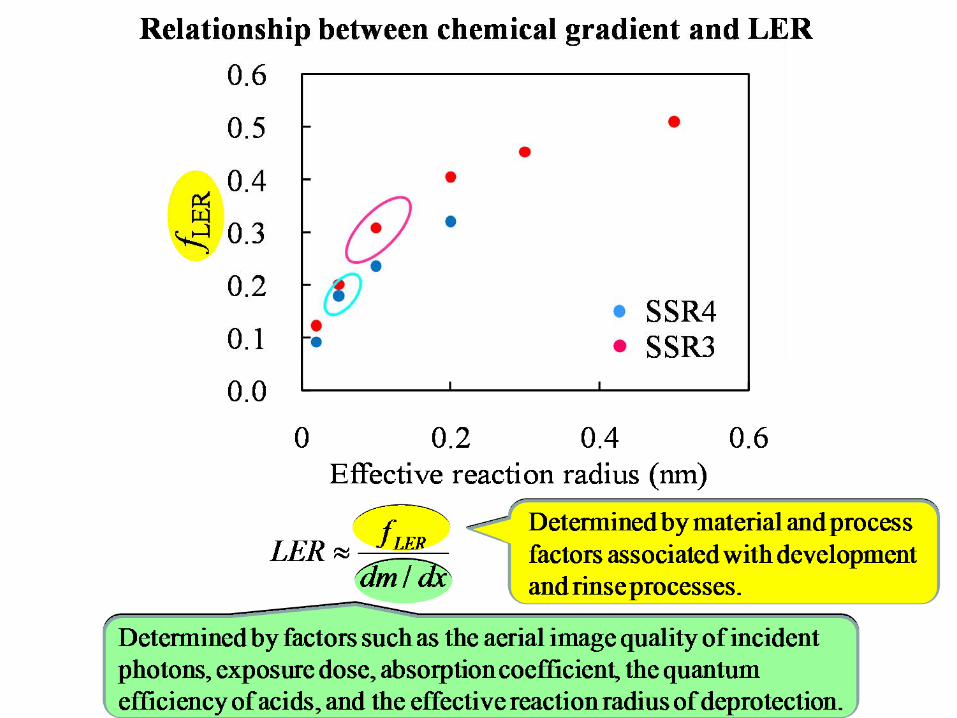
The effective reaction radius for catalytic chain reaction is an important factor to determine the chemical gradient.
The effective reaction radius is smaller than the molecular radius. By increasing the effective reaction radius, LER can be still reduced.