
MULTI-OBJECTIVE OPTIMISATION INTEGRATING ANSA WITH ... · MULTI-OBJECTIVE OPTIMISATION INTEGRATING...
12
3 rd ANSA & μETA International Conference September 9-11, 2009 Olympic Convention Centre, Porto Carras Grand Resort Hotel, Halkidiki Greece MULTI-OBJECTIVE OPTIMISATION INTEGRATING ANSA WITH MODEFRONTIER 1 Alberto Clarich * , 2 Paolo Geremia 1,2 ESTECO srl, Trieste, Italy KEYWORDS – multi-objective optimisation, distributed and automatic computational environment ABSTRACT – This paper is focused on the integration of the multi-objective design environment code modeFRONTIER with the ANSA mesh morphing software. In this environment, the users can easily define a workflow linking together different modules that represent the „bricks‟ of the optimisation problem: design variables, updated mesh files, CAE nodes, specified outputs, as well as optimisation objectives and constraints. In particular, several CAE tools can be easily integrated in the process through the available direct interface nodes, including ANSA. This means that as soon as the user prepares an ANSA model, the morphing parameters are automatically updated by the ANSA direct integration node available in modeFRONTIER, and the optimisation process can be run automatically, according to the selected algorithm or strategy. Several multi-objective optimisation algorithms are available in modeFRONTIER, including Genetic Algorithms, Evolutionary Strategy, Game Theory, Downhill Simplex, Simulated Annealing, Particle Swarm and Gradient Based algorithms, as well as many Design Of Experiments algorithms. To speed up the convergence of algorithms, Response Surface Methodologies are available, as well as many post-processing tools, including Statistical Analysis, Multi-Variate Analysis and Multi-Criteria Decision Making methods, which help the users analyse the influence of the variables on the objectives and assess the optimisation results. In this paper, ANSA applications combined with FEM and CFD solvers are used to illustrate the easiness of use of the integration between ANSA and modeFRONTIER, as well as to highlight the possible strategies to solve any multi-objective problem with the lowest number of simulations. TECHNICAL PAPER – 1. INTRODUCTION Multi-objective optimisation in automatic and distributed environment, that allows direct communication between several simulation software, is becoming continuously a key factor in design process. Traditional design approach („trial and error‟) usually requires many attempts by the designers, which every time need to modify their numerical models by hand and run several solvers especially when it is difficult to know a priori in which direction of the multi- dimensional variables space to move in order to find the best solutions. Conversely, the multi-objective design environment modeFRONTIER [1] integrates different computational software (any commercial or in-house code) into a common design environment, thus allowing the automatic run of a series of computations, until the specified objectives are satisfied. In this modular environment, each component of the optimisation process, including input variables, input files, scripts or direct interfaces to run any software, output files, output variables and objectives, is defined as a node to be connected to the other components. In this scenario, the ANSA direct interface available in modeFRONTIER plays an important role for designers which deal with parametric mesh morphing through ANSA, since all the morphing parameters defined in the model are automatically recognised by the interface, and
Transcript of MULTI-OBJECTIVE OPTIMISATION INTEGRATING ANSA WITH ... · MULTI-OBJECTIVE OPTIMISATION INTEGRATING...
3rd
ANSA & μETA International Conference September 9-11, 2009 Olympic Convention Centre, Porto Carras Grand Resort Hotel, Halkidiki Greece
MULTI-OBJECTIVE OPTIMISATION INTEGRATING ANSA WITH MODEFRONTIER 1Alberto Clarich*, 2Paolo Geremia 1,2 ESTECO srl, Trieste, Italy KEYWORDS – multi-objective optimisation, distributed and automatic computational environment ABSTRACT – This paper is focused on the integration of the multi-objective design environment code modeFRONTIER with the ANSA mesh morphing software. In this environment, the users can easily define a workflow linking together different modules that represent the „bricks‟ of the optimisation problem: design variables, updated mesh files, CAE nodes, specified outputs, as well as optimisation objectives and constraints. In particular, several CAE tools can be easily integrated in the process through the available direct interface nodes, including ANSA. This means that as soon as the user prepares an ANSA model, the morphing parameters are automatically updated by the ANSA direct integration node available in modeFRONTIER, and the optimisation process can be run automatically, according to the selected algorithm or strategy. Several multi-objective optimisation algorithms are available in modeFRONTIER, including Genetic Algorithms, Evolutionary Strategy, Game Theory, Downhill Simplex, Simulated Annealing, Particle Swarm and Gradient Based algorithms, as well as many Design Of Experiments algorithms. To speed up the convergence of algorithms, Response Surface Methodologies are available, as well as many post-processing tools, including Statistical Analysis, Multi-Variate Analysis and Multi-Criteria Decision Making methods, which help the users analyse the influence of the variables on the objectives and assess the optimisation results. In this paper, ANSA applications combined with FEM and CFD solvers are used to illustrate the easiness of use of the integration between ANSA and modeFRONTIER, as well as to highlight the possible strategies to solve any multi-objective problem with the lowest number of simulations. TECHNICAL PAPER – 1. INTRODUCTION Multi-objective optimisation in automatic and distributed environment, that allows direct communication between several simulation software, is becoming continuously a key factor in design process. Traditional design approach („trial and error‟) usually requires many attempts by the designers, which every time need to modify their numerical models by hand and run several solvers especially when it is difficult to know a priori in which direction of the multi-dimensional variables space to move in order to find the best solutions. Conversely, the multi-objective design environment modeFRONTIER [1] integrates different computational software (any commercial or in-house code) into a common design environment, thus allowing the automatic run of a series of computations, until the specified objectives are satisfied. In this modular environment, each component of the optimisation process, including input variables, input files, scripts or direct interfaces to run any software, output files, output variables and objectives, is defined as a node to be connected to the other components. In this scenario, the ANSA direct interface available in modeFRONTIER plays an important role for designers which deal with parametric mesh morphing through ANSA, since all the morphing parameters defined in the model are automatically recognised by the interface, and
3rd
ANSA & μETA International Conference September 9-11, 2009 Olympic Convention Centre, Porto Carras Grand Resort Hotel, Halkidiki Greece
therefore the ANSA model can be easily integrated in the optimisation loop, combined with any FEM/CFD solver used for the simulation. In this way, the complete logic flow from parameterisation to performance evaluation is defined by the user, that can select among several available optimisation algorithms, accordingly to the objectives defined, including Genetic Algorithms [2], Evolutionary Algorithms, Game Strategies [3], Gradient-based Methodologies, Response Surfaces (to speed up the convergence of optimisation, approximating the response of the system by the use of the available meta-models, trained on opportune selected database or DOE [4]) and Robust Design Optimisation (optimisation under uncertainties on input parameters). Statistical and Multi-Variate Analysis tools [10], some of them being illustrated in this paper, can be applied to find important information about the influence of the parameters in the system, in order to face up problems characterised by a large number of parameters and large computational efforts with the highest efficiency. Two application examples are presented in this paper, one related to a structural optimisation (derived from the ANSA tutorial [6]), and one related to a CFD optimisation problem (yacht sail flying shape design): the first example, that is simpler and maybe familiar to ANSA users, is used mainly to illustrate how to integrate a generic ANSA model in modeFRONTIER to drive an optimisation problem, while the second example is used mainly to illustrate optimisation strategies and notable results for a more demanding and realistic industrial problem. 2. FIRST APPLICATION: STRUCTURAL OPTIMISATION OF HOOK
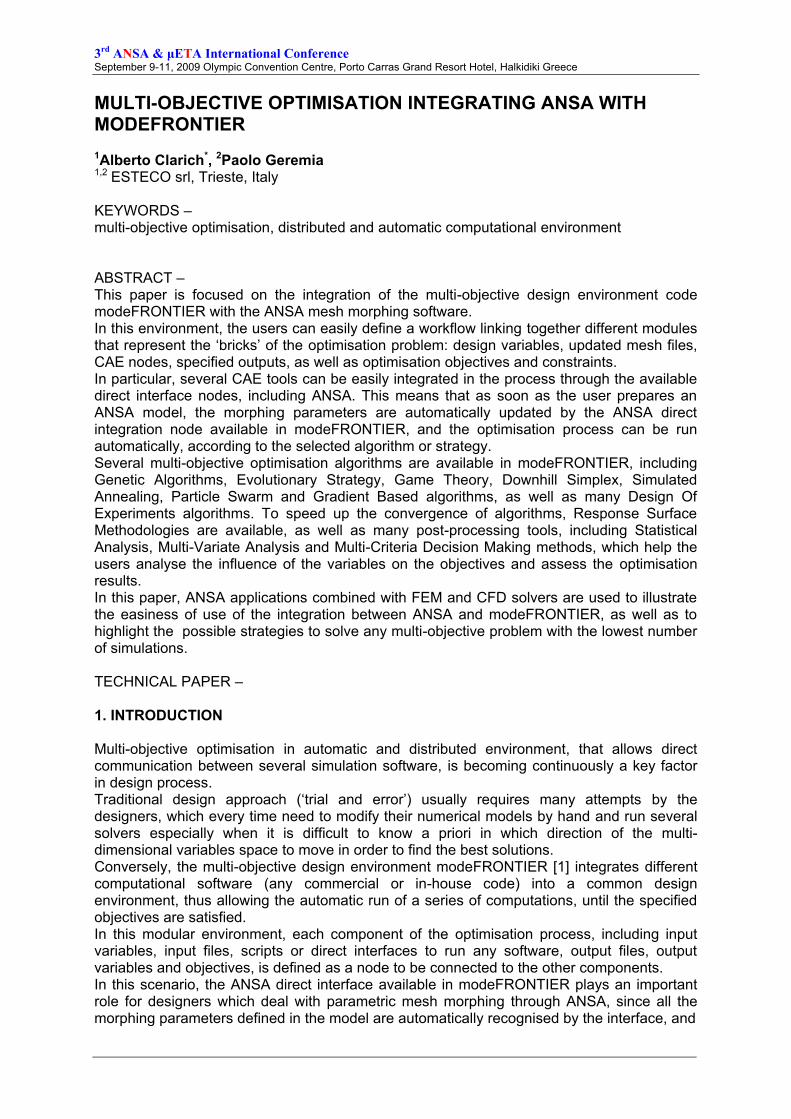
Problem description The model deals with the static analysis of a crane hook having a trapezoidal cross-section. A vertical load of 20kN is applied to the model as static force. The model is already provided with morphing boxes and morphing parameters set in the Optimisation Task of the ANSA tutorial [6]. All the ANSA model parameters are represented in Figure 1, and all the details about how to realize the model are contained in the same ANSA Tutorial. The main scope of the optimisation is to find the optimal values for the hook cross-sections length and outer width in order to minimise the total mass, by imposing a constraint on the maximum stress allowed for a given cross-section of the model (less than 400 MPa). For this purpose, the ANSA model can be handled by modeFRONTIER which looks for the best values of the design variables in order to find the optimal solution.
Figure 1 – ANSA hook model and design parameters summary
3rd
ANSA & μETA International Conference September 9-11, 2009 Olympic Convention Centre, Porto Carras Grand Resort Hotel, Halkidiki Greece
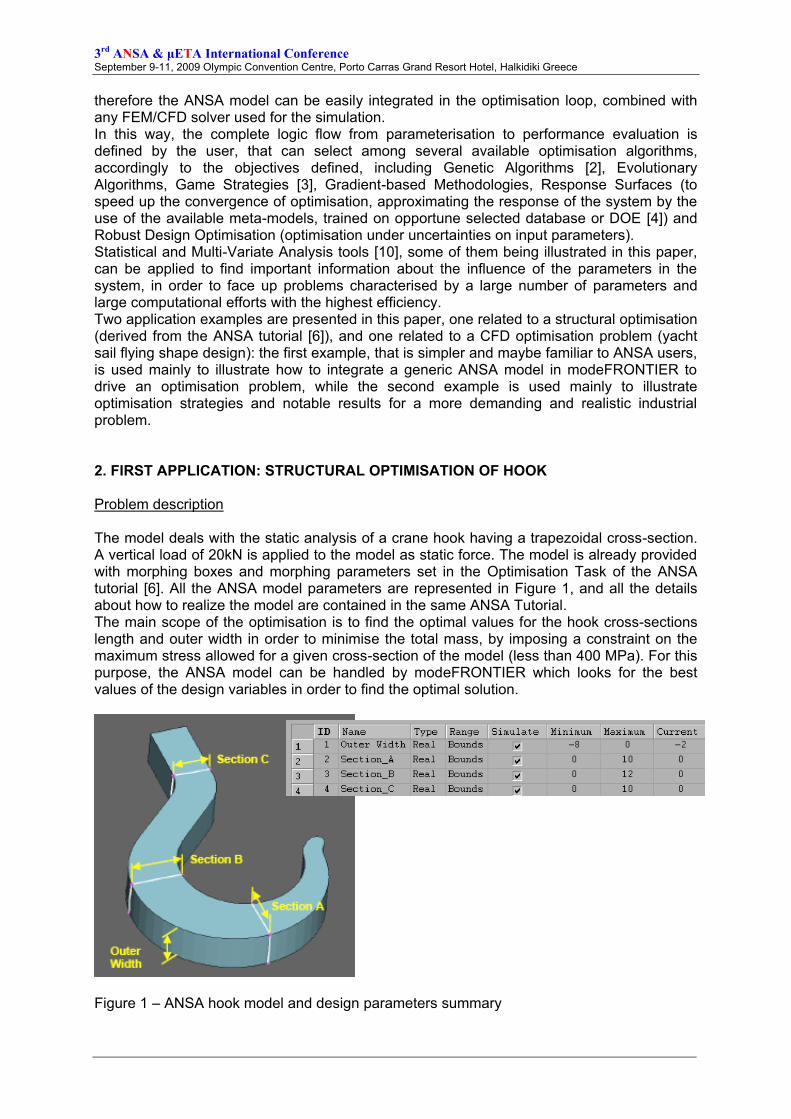
Definition of Input and Output Parameters in the ANSA model The length of the sections A, B, and C and outer width (see Figure 1) are controlled by the design variables called „Section_A‟, „Section_B‟, „Section_C‟ and „Outer_Width‟ respectively in the ANSA model. The Designs Variables ranges are set accordingly to the values specified in Figure 1. In the ANSA model, an Optimisation Task is defined, including all the four Design Variables, a DV Parameters file and a FE Output file for Abaqus. In addition to this, the value of total mass is computed directly by ANSA using a Session Command in the Optimisation Task, which creates a text file where the actual mass value is written as all the ANSA tasks are completed. Workflow creation and usage of ANSA direct interface Figure 2 illustrates the optimisation workflow in modeFRONTIER: each component is just a node connected to the other ones, to define a logic flow to be followed during the optimisation, for each candidate design proposed by the algorithm.
Figure 2 – modeFRONTIER workflow for hook optimisation From the top, the four Design variables are defined by four input nodes, that specify the range of variation of each variable (as defined in Figure 1). They are all connected to the ANSA direct interface. Simple operations (as described in Figure 3) are needed to set the ANSA interface:
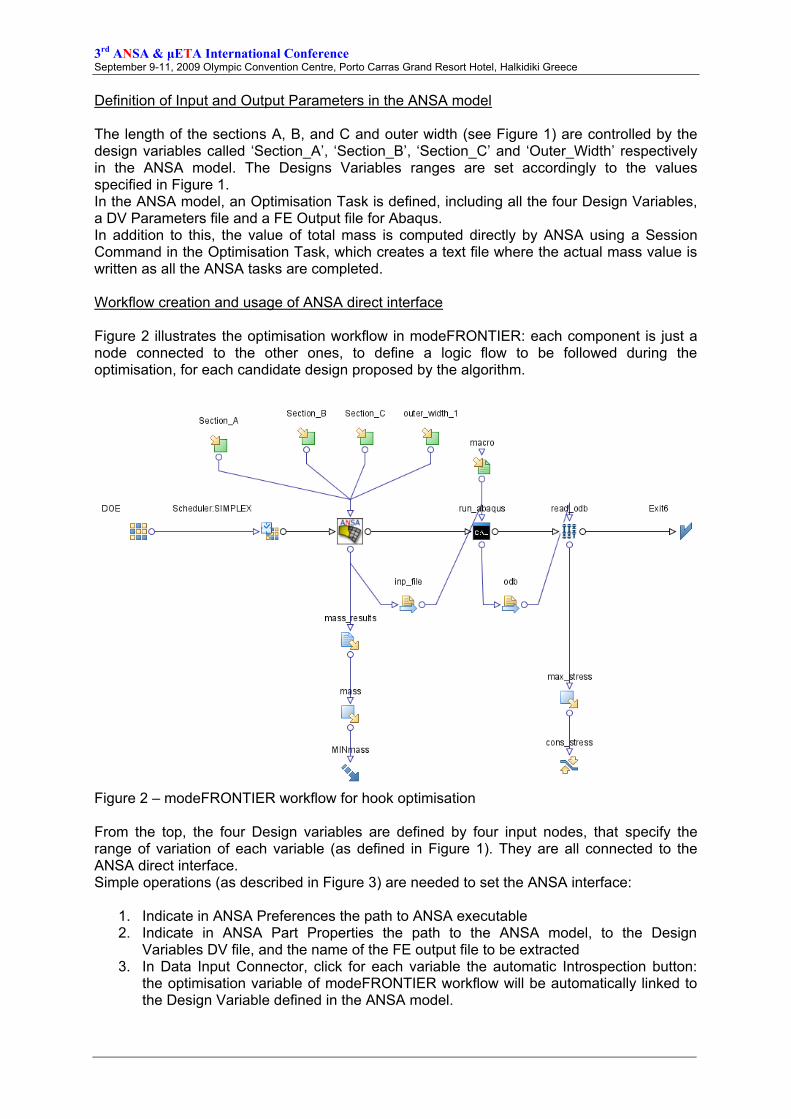
1. Indicate in ANSA Preferences the path to ANSA executable 2. Indicate in ANSA Part Properties the path to the ANSA model, to the Design
Variables DV file, and the name of the FE output file to be extracted 3. In Data Input Connector, click for each variable the automatic Introspection button:
the optimisation variable of modeFRONTIER workflow will be automatically linked to the Design Variable defined in the ANSA model.
3rd
ANSA & μETA International Conference September 9-11, 2009 Olympic Convention Centre, Porto Carras Grand Resort Hotel, Halkidiki Greece
Figure 3 – ANSA direct node interface in modeFRONTIER The extraction of the mass information is made through an Output File node, linked directly to the ANSA node output connector. This node uses as template the text file indicated in the previous paragraph, and the user has just to select the absolute position where the mass value is defined. As we can note in Figure 2, the output variable node „mass‟ is finally linked to an objective node (the blue arrow pointing downward), that defines the objective expression (in this case, just to minimise mass value). On the right part of the workflow, there are the nodes relative to the structural analysis (Abaqus). A DOS shell node, just containing the batch DOS command used to run Abaqus, is defined after the ANSA node. In addition, a Transfer file node („inp_file’) is used to automatically copy the updated mesh file from ANSA to Abaqus application. Note that the DOS node receives also, from the „macro‟ Input file node, a macro file of commands automatically recorded during the creation of the Abaqus model. The file is therefore re-used for each new design proposed during the optmisation, to execute the structural analysis. From the ODB Abaqus results file, all the outputs needed (in this case simply the maximum Von Mises stress), are then extracted automatically by the Abaqus direct interface node („read_odb‟ node in Figure 2). Note that a constraint node, „cons_stress‟, is linked to the stress output, expressing the condition to be satisfied as “maximum stress less than 400”. The optimisation parameters can be set up through two dedicated nodes, the DOE (Design Of Experiment, i.e. initial campaign of designs to initialise the optimisation algorithm [4]) and the Scheduler node (to select the optimisation algorithm). In this particular case, having one objective (mass) and one constraint (stress), a Simplex algorithm [5] is advised (combined with a Random DOE of 5 points), as suggested by the Optimisation Wizard tool available in modeFRONTIER.
1
2
3
3rd
ANSA & μETA International Conference September 9-11, 2009 Olympic Convention Centre, Porto Carras Grand Resort Hotel, Halkidiki Greece
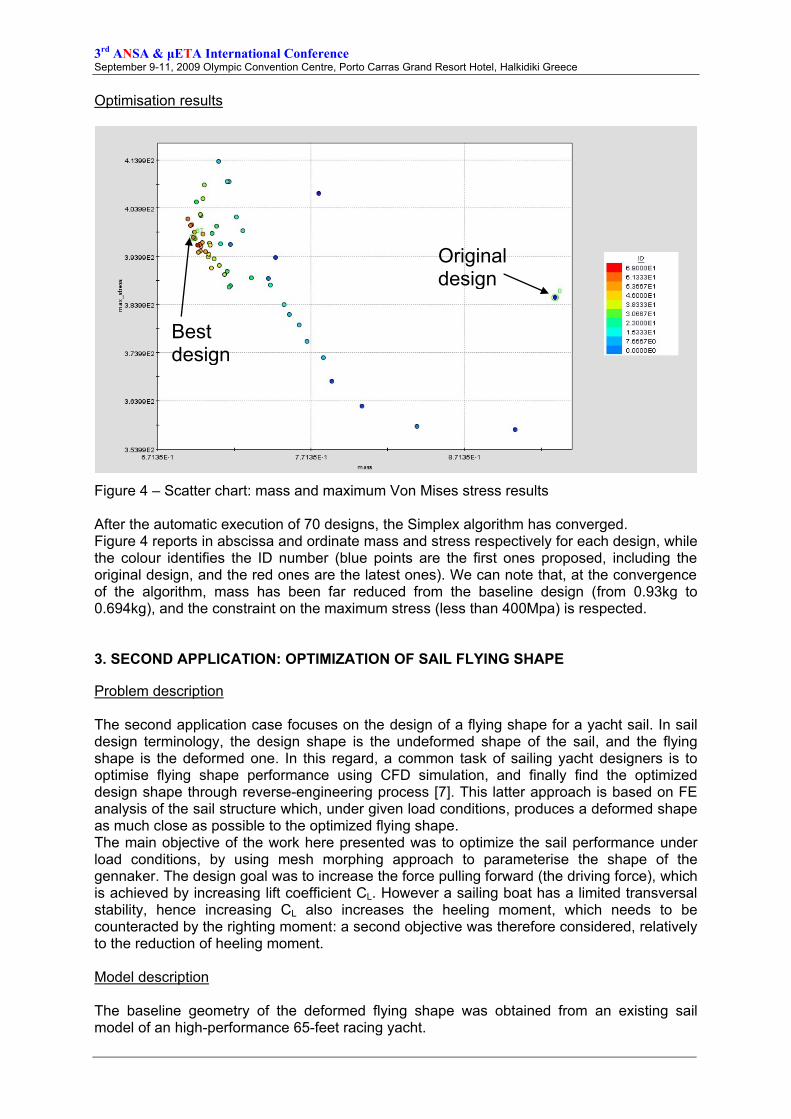
Optimisation results
Figure 4 – Scatter chart: mass and maximum Von Mises stress results After the automatic execution of 70 designs, the Simplex algorithm has converged. Figure 4 reports in abscissa and ordinate mass and stress respectively for each design, while the colour identifies the ID number (blue points are the first ones proposed, including the original design, and the red ones are the latest ones). We can note that, at the convergence of the algorithm, mass has been far reduced from the baseline design (from 0.93kg to 0.694kg), and the constraint on the maximum stress (less than 400Mpa) is respected. 3. SECOND APPLICATION: OPTIMIZATION OF SAIL FLYING SHAPE
Problem description The second application case focuses on the design of a flying shape for a yacht sail. In sail design terminology, the design shape is the undeformed shape of the sail, and the flying shape is the deformed one. In this regard, a common task of sailing yacht designers is to optimise flying shape performance using CFD simulation, and finally find the optimized design shape through reverse-engineering process [7]. This latter approach is based on FE analysis of the sail structure which, under given load conditions, produces a deformed shape as much close as possible to the optimized flying shape. The main objective of the work here presented was to optimize the sail performance under load conditions, by using mesh morphing approach to parameterise the shape of the gennaker. The design goal was to increase the force pulling forward (the driving force), which is achieved by increasing lift coefficient CL. However a sailing boat has a limited transversal stability, hence increasing CL also increases the heeling moment, which needs to be counteracted by the righting moment: a second objective was therefore considered, relatively to the reduction of heeling moment. Model description The baseline geometry of the deformed flying shape was obtained from an existing sail model of an high-performance 65-feet racing yacht.
Original design
Best design
3rd
ANSA & μETA International Conference September 9-11, 2009 Olympic Convention Centre, Porto Carras Grand Resort Hotel, Halkidiki Greece
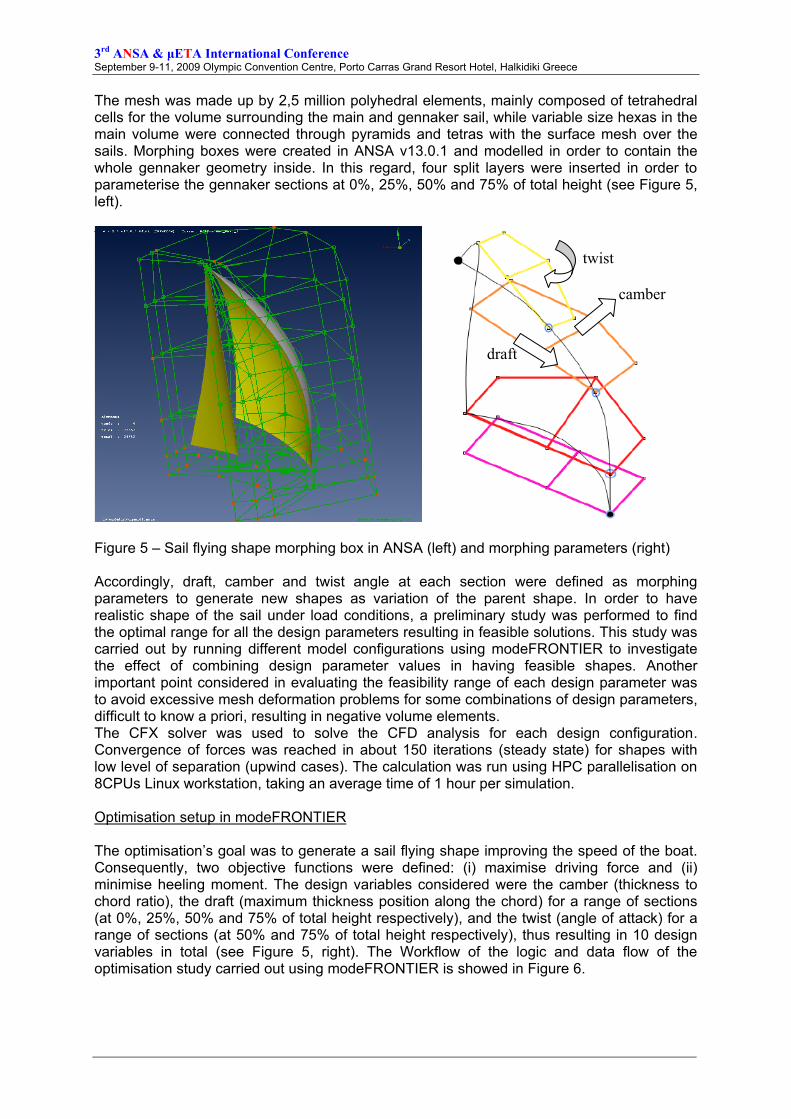
The mesh was made up by 2,5 million polyhedral elements, mainly composed of tetrahedral cells for the volume surrounding the main and gennaker sail, while variable size hexas in the main volume were connected through pyramids and tetras with the surface mesh over the sails. Morphing boxes were created in ANSA v13.0.1 and modelled in order to contain the whole gennaker geometry inside. In this regard, four split layers were inserted in order to parameterise the gennaker sections at 0%, 25%, 50% and 75% of total height (see Figure 5, left).
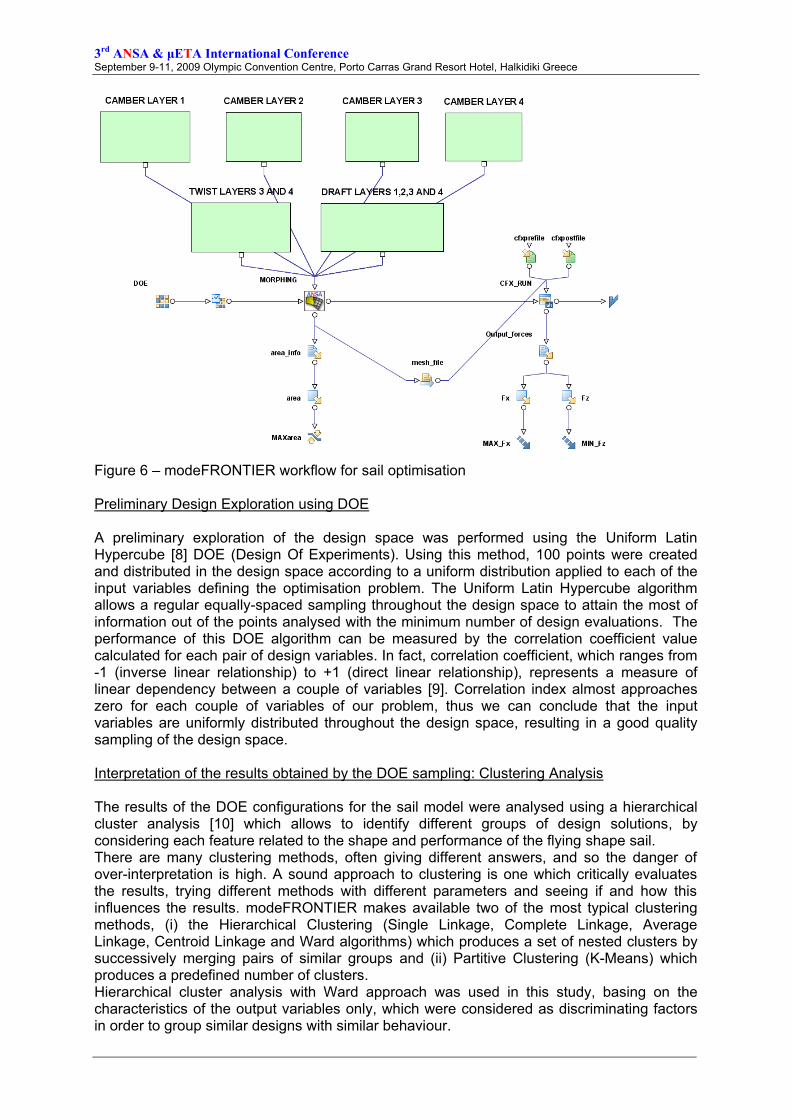
Figure 5 – Sail flying shape morphing box in ANSA (left) and morphing parameters (right) Accordingly, draft, camber and twist angle at each section were defined as morphing parameters to generate new shapes as variation of the parent shape. In order to have realistic shape of the sail under load conditions, a preliminary study was performed to find the optimal range for all the design parameters resulting in feasible solutions. This study was carried out by running different model configurations using modeFRONTIER to investigate the effect of combining design parameter values in having feasible shapes. Another important point considered in evaluating the feasibility range of each design parameter was to avoid excessive mesh deformation problems for some combinations of design parameters, difficult to know a priori, resulting in negative volume elements. The CFX solver was used to solve the CFD analysis for each design configuration. Convergence of forces was reached in about 150 iterations (steady state) for shapes with low level of separation (upwind cases). The calculation was run using HPC parallelisation on 8CPUs Linux workstation, taking an average time of 1 hour per simulation. Optimisation setup in modeFRONTIER The optimisation‟s goal was to generate a sail flying shape improving the speed of the boat. Consequently, two objective functions were defined: (i) maximise driving force and (ii) minimise heeling moment. The design variables considered were the camber (thickness to chord ratio), the draft (maximum thickness position along the chord) for a range of sections (at 0%, 25%, 50% and 75% of total height respectively), for a range of sections (at 50% and 75% of total height respectively), thus resulting in 10 design variables in total (see Figure 5, right). The Workflow of the logic and data flow of the optimisation study carried out using modeFRONTIER is showed in Figure 6.
twist
camber
draft
3rd
ANSA & μETA International Conference September 9-11, 2009 Olympic Convention Centre, Porto Carras Grand Resort Hotel, Halkidiki Greece
Figure 6 – modeFRONTIER workflow for sail optimisation Preliminary Design Exploration using DOE A preliminary exploration of the design space was performed using the Uniform Latin Hypercube [8] DOE (Design Of Experiments). Using this method, 100 points were created and distributed in the design space according to a uniform distribution applied to each of the input variables defining the optimisation problem. The Uniform Latin Hypercube algorithm allows a regular equally-spaced sampling throughout the design space to attain the most of information out of the points analysed with the minimum number of design evaluations. The performance of this DOE algorithm can be measured by the correlation coefficient value calculated for each pair of design variables. In fact, correlation coefficient, which ranges from -1 (inverse linear relationship) to +1 (direct linear relationship), represents a measure of linear dependency between a couple of variables [9]. Correlation index almost approaches zero for each couple of variables of our problem, thus we can conclude that the input variables are uniformly distributed throughout the design space, resulting in a good quality sampling of the design space. Interpretation of the results obtained by the DOE sampling: Clustering Analysis The results of the DOE configurations for the sail model were analysed using a hierarchical cluster analysis [10] which allows to identify different groups of design solutions, by considering each feature related to the shape and performance of the flying shape sail. There are many clustering methods, often giving different answers, and so the danger of over-interpretation is high. A sound approach to clustering is one which critically evaluates the results, trying different methods with different parameters and seeing if and how this influences the results. modeFRONTIER makes available two of the most typical clustering methods, (i) the Hierarchical Clustering (Single Linkage, Complete Linkage, Average Linkage, Centroid Linkage and Ward algorithms) which produces a set of nested clusters by successively merging pairs of similar groups and (ii) Partitive Clustering (K-Means) which produces a predefined number of clusters. Hierarchical cluster analysis with Ward approach was used in this study, basing on the characteristics of the output variables only, which were considered as discriminating factors in order to group similar designs with similar behaviour.
3rd
ANSA & μETA International Conference September 9-11, 2009 Olympic Convention Centre, Porto Carras Grand Resort Hotel, Halkidiki Greece
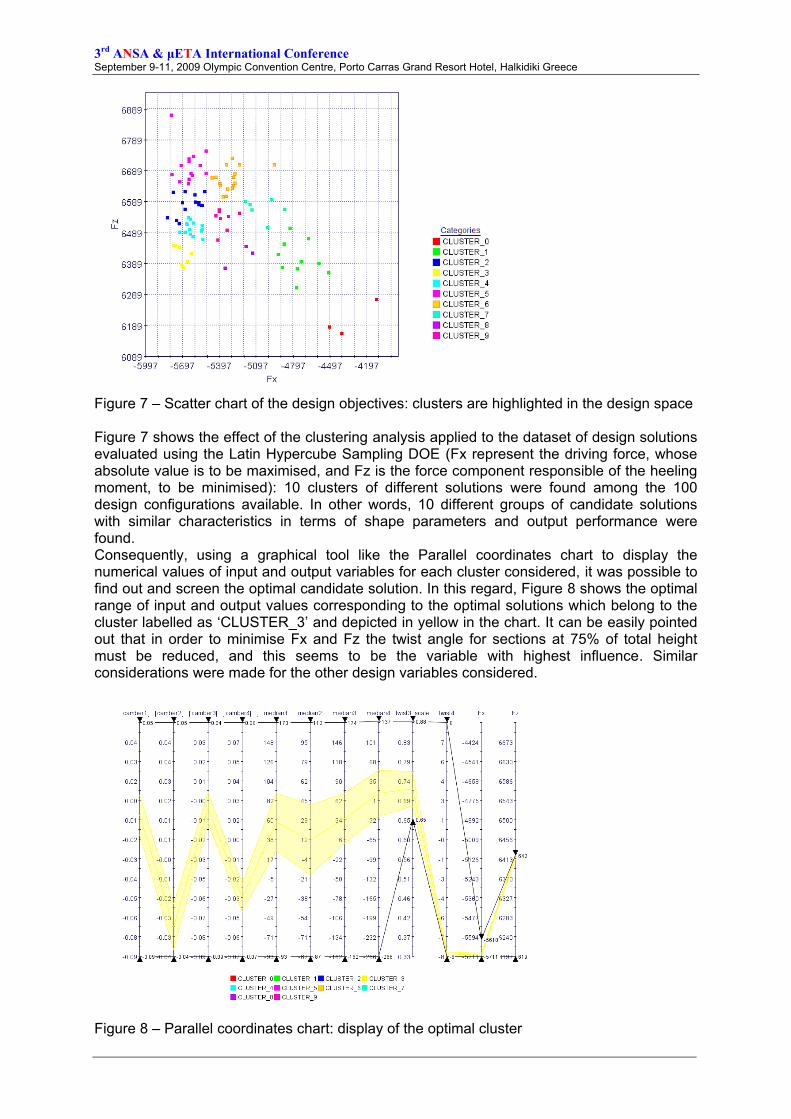
Figure 7 – Scatter chart of the design objectives: clusters are highlighted in the design space Figure 7 shows the effect of the clustering analysis applied to the dataset of design solutions evaluated using the Latin Hypercube Sampling DOE (Fx represent the driving force, whose absolute value is to be maximised, and Fz is the force component responsible of the heeling moment, to be minimised): 10 clusters of different solutions were found among the 100 design configurations available. In other words, 10 different groups of candidate solutions with similar characteristics in terms of shape parameters and output performance were found. Consequently, using a graphical tool like the Parallel coordinates chart to display the numerical values of input and output variables for each cluster considered, it was possible to find out and screen the optimal candidate solution. In this regard, Figure 8 shows the optimal range of input and output values corresponding to the optimal solutions which belong to the cluster labelled as „CLUSTER_3‟ and depicted in yellow in the chart. It can be easily pointed out that in order to minimise Fx and Fz the twist angle for sections at 75% of total height must be reduced, and this seems to be the variable with highest influence. Similar considerations were made for the other design variables considered.
Figure 8 – Parallel coordinates chart: display of the optimal cluster
3rd
ANSA & μETA International Conference September 9-11, 2009 Olympic Convention Centre, Porto Carras Grand Resort Hotel, Halkidiki Greece
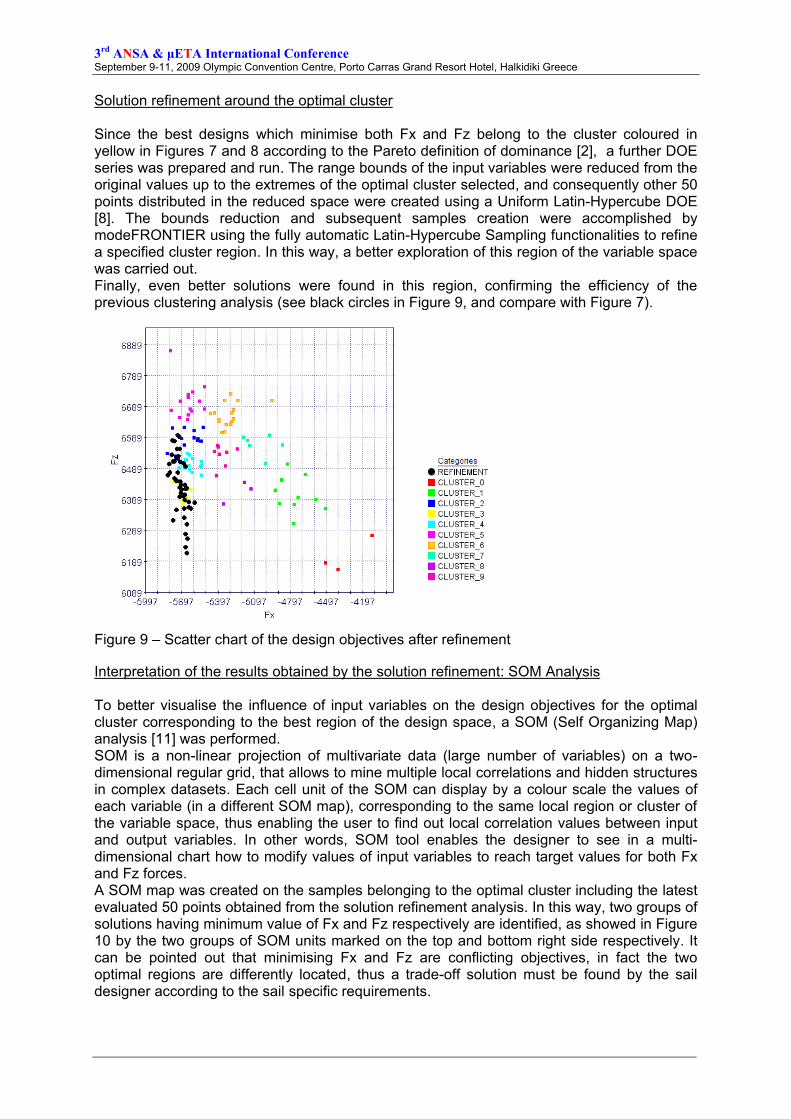
Solution refinement around the optimal cluster Since the best designs which minimise both Fx and Fz belong to the cluster coloured in yellow in Figures 7 and 8 according to the Pareto definition of dominance [2], a further DOE series was prepared and run. The range bounds of the input variables were reduced from the original values up to the extremes of the optimal cluster selected, and consequently other 50 points distributed in the reduced space were created using a Uniform Latin-Hypercube DOE [8]. The bounds reduction and subsequent samples creation were accomplished by modeFRONTIER using the fully automatic Latin-Hypercube Sampling functionalities to refine a specified cluster region. In this way, a better exploration of this region of the variable space was carried out. Finally, even better solutions were found in this region, confirming the efficiency of the previous clustering analysis (see black circles in Figure 9, and compare with Figure 7).
Figure 9 – Scatter chart of the design objectives after refinement
Interpretation of the results obtained by the solution refinement: SOM Analysis To better visualise the influence of input variables on the design objectives for the optimal cluster corresponding to the best region of the design space, a SOM (Self Organizing Map) analysis [11] was performed. SOM is a non-linear projection of multivariate data (large number of variables) on a two-dimensional regular grid, that allows to mine multiple local correlations and hidden structures in complex datasets. Each cell unit of the SOM can display by a colour scale the values of each variable (in a different SOM map), corresponding to the same local region or cluster of the variable space, thus enabling the user to find out local correlation values between input and output variables. In other words, SOM tool enables the designer to see in a multi-dimensional chart how to modify values of input variables to reach target values for both Fx and Fz forces. A SOM map was created on the samples belonging to the optimal cluster including the latest evaluated 50 points obtained from the solution refinement analysis. In this way, two groups of solutions having minimum value of Fx and Fz respectively are identified, as showed in Figure 10 by the two groups of SOM units marked on the top and bottom right side respectively. It can be pointed out that minimising Fx and Fz are conflicting objectives, in fact the two optimal regions are differently located, thus a trade-off solution must be found by the sail designer according to the sail specific requirements.
3rd
ANSA & μETA International Conference September 9-11, 2009 Olympic Convention Centre, Porto Carras Grand Resort Hotel, Halkidiki Greece
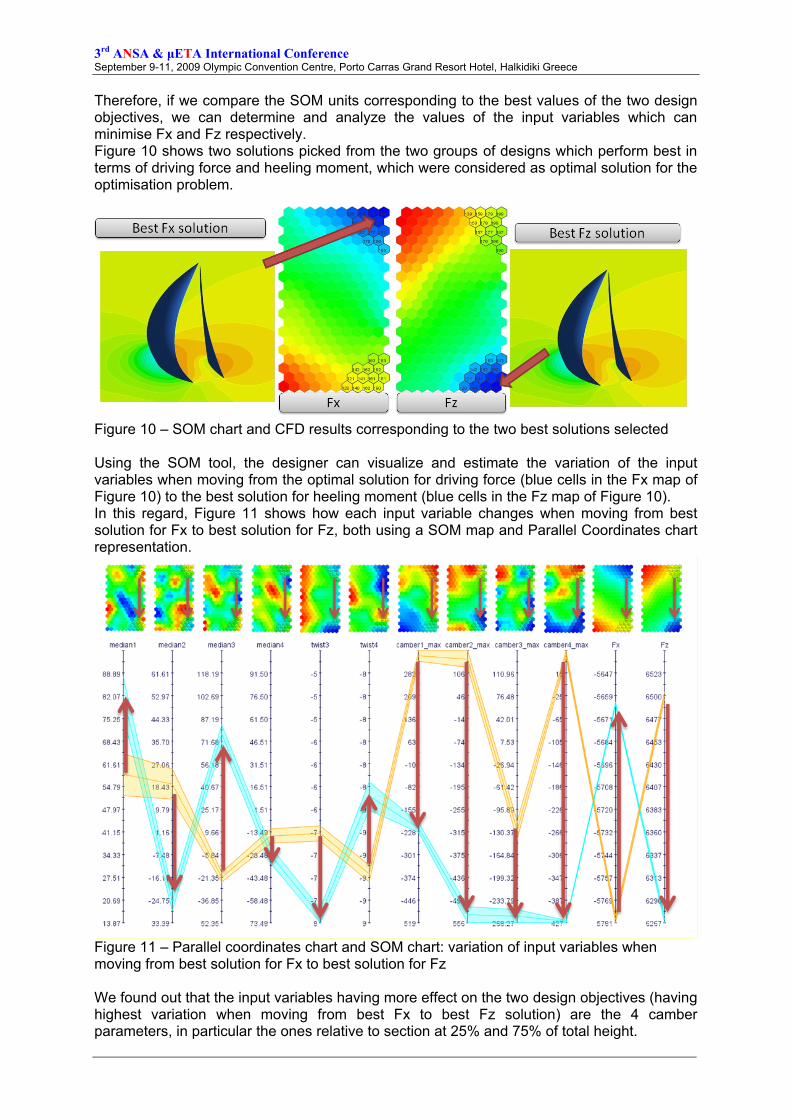
Therefore, if we compare the SOM units corresponding to the best values of the two design objectives, we can determine and analyze the values of the input variables which can minimise Fx and Fz respectively. Figure 10 shows two solutions picked from the two groups of designs which perform best in terms of driving force and heeling moment, which were considered as optimal solution for the optimisation problem.
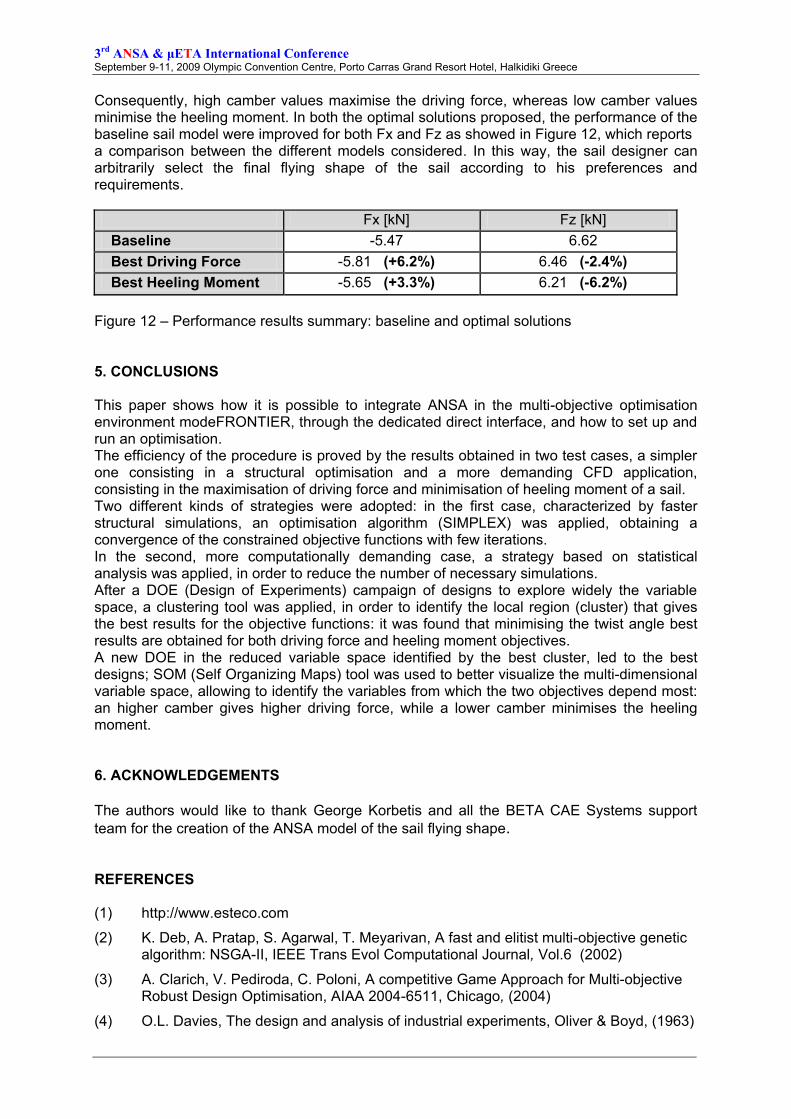
Figure 10 – SOM chart and CFD results corresponding to the two best solutions selected Using the SOM tool, the designer can visualize and estimate the variation of the input variables when moving from the optimal solution for driving force (blue cells in the Fx map of Figure 10) to the best solution for heeling moment (blue cells in the Fz map of Figure 10). In this regard, Figure 11 shows how each input variable changes when moving from best solution for Fx to best solution for Fz, both using a SOM map and Parallel Coordinates chart representation.
Figure 11 – Parallel coordinates chart and SOM chart: variation of input variables when moving from best solution for Fx to best solution for Fz We found out that the input variables having more effect on the two design objectives (having highest variation when moving from best Fx to best Fz solution) are the 4 camber parameters, in particular the ones relative to section at 25% and 75% of total height.
3rd
ANSA & μETA International Conference September 9-11, 2009 Olympic Convention Centre, Porto Carras Grand Resort Hotel, Halkidiki Greece
Consequently, high camber values maximise the driving force, whereas low camber values minimise the heeling moment. In both the optimal solutions proposed, the performance of the baseline sail model were improved for both Fx and Fz as showed in Figure 12, which reports a comparison between the different models considered. In this way, the sail designer can arbitrarily select the final flying shape of the sail according to his preferences and requirements.
Fx [kN] Fz [kN]
Baseline -5.47 6.62
Best Driving Force -5.81 (+6.2%) 6.46 (-2.4%)
Best Heeling Moment -5.65 (+3.3%) 6.21 (-6.2%)
Figure 12 – Performance results summary: baseline and optimal solutions 5. CONCLUSIONS This paper shows how it is possible to integrate ANSA in the multi-objective optimisation environment modeFRONTIER, through the dedicated direct interface, and how to set up and run an optimisation. The efficiency of the procedure is proved by the results obtained in two test cases, a simpler one consisting in a structural optimisation and a more demanding CFD application, consisting in the maximisation of driving force and minimisation of heeling moment of a sail. Two different kinds of strategies were adopted: in the first case, characterized by faster structural simulations, an optimisation algorithm (SIMPLEX) was applied, obtaining a convergence of the constrained objective functions with few iterations. In the second, more computationally demanding case, a strategy based on statistical analysis was applied, in order to reduce the number of necessary simulations. After a DOE (Design of Experiments) campaign of designs to explore widely the variable space, a clustering tool was applied, in order to identify the local region (cluster) that gives the best results for the objective functions: it was found that minimising the twist angle best results are obtained for both driving force and heeling moment objectives. A new DOE in the reduced variable space identified by the best cluster, led to the best designs; SOM (Self Organizing Maps) tool was used to better visualize the multi-dimensional variable space, allowing to identify the variables from which the two objectives depend most: an higher camber gives higher driving force, while a lower camber minimises the heeling moment. 6. ACKNOWLEDGEMENTS
The authors would like to thank George Korbetis and all the BETA CAE Systems support
team for the creation of the ANSA model of the sail flying shape. REFERENCES (1) http://www.esteco.com
(2) K. Deb, A. Pratap, S. Agarwal, T. Meyarivan, A fast and elitist multi-objective genetic algorithm: NSGA-II, IEEE Trans Evol Computational Journal, Vol.6 (2002)
(3) A. Clarich, V. Pediroda, C. Poloni, A competitive Game Approach for Multi-objective Robust Design Optimisation, AIAA 2004-6511, Chicago, (2004)
(4) O.L. Davies, The design and analysis of industrial experiments, Oliver & Boyd, (1963)

3rd
ANSA & μETA International Conference September 9-11, 2009 Olympic Convention Centre, Porto Carras Grand Resort Hotel, Halkidiki Greece
(5) Nelder, J. A., Mead, R., A Simplex Method for Function Minimization, Computer Journal, 7, 308, 1965
(6) ANSA 12.1 User Guide, Tutorial nr.8, Optimisation Static
(7) Rousselon N., 2008, Optimisation for Sail Design, paper presented at the modeFRONTIER Conference, June 2008, Trieste, Italy
(8) Latin Hypercube Sampling: McKay M.D., Conover W. J. and Beckman, R. J. (1979), A Comparison of Three Methods for Selecting Values of Input Variables in the Analysis of Output from a Computer Code, Technometrics 21(2), pp. 239-245
(9) Edwards, A. L. "The Correlation Coefficient." Ch. 4 in An Introduction to Linear Regression and Correlation. San Francisco, CA, W. H. Freeman, pp. 33-46, 1976.
(10) Kaufman, L. and Rousseeuw, P. J. Finding Groups in Data: An Introduction to Cluster Analysis. New York, Wiley, 1990.
(11) T. Kohonen Self-Organizing Maps, 3rd ed. Springer, 2001.