Monitoring and Evaluation of PV Pumping System Performance ... http:/ · International Journal on...
15
International Journal on Electrical Engineering and Informatics - Volume 8, Number 2, June 2016 Monitoring and Evaluation of PV Pumping System Performance Installed in The Algeria’s Sahara City of Adrar Mohammed Yaichi 1 , Abdelkrim Mammeri 1 , and Mohammed-Karim Fellah 2 1 Unité de Recherche en Energies Renouvelables en Milieu Saharien, URERMS, Centre de Développement des Energies Renouvelables, CDER, 01000, Adrar, Algeria 2 Intelligent Control and Electrical Power Systems Laboratory, Djillali Liabes University of Sidi-Bel-Abbes, Algeria Abstract: The Sunbelt area like Algeria, specially the Saharan medium by its arid nature and the availability of huge solar irradiance can be a good choice of the application of the photovoltaic (PV) system. Water pumping by PV system for irrigation purposes can be considered as one of the basic needs in the rural areas of Algeria. PV modules are given a power rating at standard test conditions (STC) of 1000W/m 2 , AM1.5 and a module temperature 25°C, but these conditions do not represent what is typically experienced under outdoor operation. To improve the performances of such type of systems, a study based on outdoor experimental tests is necessary, to establish how much energy is produced and the major parameters that most influence on their quality. The main objective of this paper is to review the state of the art of PV systems in the Adrar Desert of Algeria by the analysis of the operational data of the PV installation. Sophisticated Verification method so called SV method has been used to evaluate a PV pumping system performance during seven months. Differences between real and installed energy of up to 18% have been detected. It has been observed that the high output gain due to the operating condition in an extreme low module temperature. On the basis of these monitoring results, the performance of PV systems is compared to the measured performance of residential PV systems installed in other countries. The results indicated that the motor-pump efficiency changed by the pumping head. Keywords: PV pumping system, Desert of Algeria, Monitoring data, Performance ratio, Losses, Evaluation. 1. Introduction The evaluation of the photovoltaic (PV) systems seems to be very important in order to acquire the deployment of more reliable PV technologies for the future. The energy production of a photovoltaic system primarily depends on the weather conditions of the geographical location where the system is installed and on a number of other factors such as the orientation profile, shading, temperature effect and the power loss in wiring and inverters. The possible PV potential, which is going to widely assist the use of this technology, especially for countries with high solar irradiation can only be provided through the evaluation and detailed outdoor field analysis of the performance of different installed PV systems. Parameters such as the energy yield, performance ratio and system efficiency have been used in order to make a comparison between various kinds of installed PV system technology [1, 2, 3]. Monitoring data provides certainty about electricity yields, available irradiation, and module temperatures. However, not all loss mechanisms can be monitored, at least not with reasonable effort. Several publications report evaluation of PV systems [2, 3] but do not estimate the parameters that affect and individually on energy production. Other reports [5] propose a method for estimating the irradiance on partially shaded system. In this method, a survey of the surroundings based on teodolite reading (topographic coordinates) of only relevant points of the shading objects were done, this is done by carrying out a photographic sweep from East to West using a camera, in order to record a sequence of photographs for the PV generator surroundings. Other works [4] use the PV system simulation software “Zenit” developed at Fraunhofer ISE, for the modeling. Received: December 29 th , 2014. Accepted: May 2 nd , 2016 DOI: 10.15676/ijeei.2016.8.2.2 253
-
Upload
nguyendien -
Category
Documents
-
view
216 -
download
3
Transcript of Monitoring and Evaluation of PV Pumping System Performance ... http:/ · International Journal on...
International Journal on Electrical Engineering and Informatics - Volume 8, Number 2, June 2016
Monitoring and Evaluation of PV Pumping System Performance Installed
in The Algeria’s Sahara City of Adrar
Mohammed Yaichi1, Abdelkrim Mammeri
1, and Mohammed-Karim Fellah
2
1Unité de Recherche en Energies Renouvelables en Milieu Saharien, URERMS, Centre de
Développement des Energies Renouvelables, CDER, 01000, Adrar, Algeria 2Intelligent Control and Electrical Power Systems Laboratory, Djillali Liabes University of
Sidi-Bel-Abbes, Algeria
Abstract: The Sunbelt area like Algeria, specially the Saharan medium by its arid nature and
the availability of huge solar irradiance can be a good choice of the application of the
photovoltaic (PV) system. Water pumping by PV system for irrigation purposes can be
considered as one of the basic needs in the rural areas of Algeria. PV modules are given a
power rating at standard test conditions (STC) of 1000W/m2, AM1.5 and a module temperature
25°C, but these conditions do not represent what is typically experienced under outdoor
operation. To improve the performances of such type of systems, a study based on outdoor
experimental tests is necessary, to establish how much energy is produced and the major
parameters that most influence on their quality. The main objective of this paper is to review
the state of the art of PV systems in the Adrar Desert of Algeria by the analysis of the
operational data of the PV installation. Sophisticated Verification method so called SV method
has been used to evaluate a PV pumping system performance during seven months. Differences
between real and installed energy of up to 18% have been detected. It has been observed that
the high output gain due to the operating condition in an extreme low module temperature. On
the basis of these monitoring results, the performance of PV systems is compared to the
measured performance of residential PV systems installed in other countries. The results
indicated that the motor-pump efficiency changed by the pumping head.
Keywords: PV pumping system, Desert of Algeria, Monitoring data, Performance ratio,
Losses, Evaluation.
1. Introduction
The evaluation of the photovoltaic (PV) systems seems to be very important in order to
acquire the deployment of more reliable PV technologies for the future. The energy production
of a photovoltaic system primarily depends on the weather conditions of the geographical
location where the system is installed and on a number of other factors such as the orientation
profile, shading, temperature effect and the power loss in wiring and inverters. The possible PV
potential, which is going to widely assist the use of this technology, especially for countries
with high solar irradiation can only be provided through the evaluation and detailed outdoor
field analysis of the performance of different installed PV systems. Parameters such as the
energy yield, performance ratio and system efficiency have been used in order to make a
comparison between various kinds of installed PV system technology [1, 2, 3].
Monitoring data provides certainty about electricity yields, available irradiation, and
module temperatures. However, not all loss mechanisms can be monitored, at least not with
reasonable effort. Several publications report evaluation of PV systems [2, 3] but do not
estimate the parameters that affect and individually on energy production. Other reports [5]
propose a method for estimating the irradiance on partially shaded system. In this method, a
survey of the surroundings based on teodolite reading (topographic coordinates) of only
relevant points of the shading objects were done, this is done by carrying out a photographic
sweep from East to West using a camera, in order to record a sequence of photographs for the
PV generator surroundings. Other works [4] use the PV system simulation software “Zenit”
developed at Fraunhofer ISE, for the modeling.
Received: December 29th
, 2014. Accepted: May 2nd
, 2016 DOI: 10.15676/ijeei.2016.8.2.2 253

The evaluation method OV (Ordinary Verification) was developed largely by K. Kurokawa
[6] and was detailed by T. Oozeki and al [7], or a PV system is monitored by a simple data
acquisition system when necessary (hourly in-plane irradiation, PV array temperature, array
output power, hydraulic power output (power from utility). The method based of other detailed
parameters has become possible by SV (Sophisticated Verification) procedure. In contrast with
ordinary procedure, according to SV method, shading factor KHS, load matching factor KPM,
other array factor KPO can be estimated additionally. This method, consider that of the clear-
sky power pattern consists only of partial shading and full shading because the mismatch
hardly occurs in a clear day, it is naturally omitted by the extraction of hourly maximum values
[7, 11].
The results presented in this paper allow extracting conclusions about the expected energy
production of PV systems at the test site in the Adrar Desert of Algeria and about the energy
production losses due their climate nature. Sophisticated Verification method so called SV
method has been used to evaluate a PV pumping system performance during seven months,
which provides useful information about the seasonal behavior of the system. The results are
compared with previous analysis of the operational performance of residential PV systems
installed in Japan, Belgium, Korea and Germany.
2. System Configuration
Monitoring data are including a PV pumping system data which is composed of 2 mc-Si
Solar ET-M536-75W modules technology. The orientation is full south and the tilt angle is 29
degrees. Figure 1 shows the photo of the system to be evaluated and Table 1 and 2 summarizes
the types and manufacturers of the installed PV modules and the measuring devices used. The
data acquisition system automatically will be switched on at every one minute. PV system
performance data are normally taken by data acquisition system for the evaluation of long-term
energy performance; all data were processed on hourly basis for seven months measuring
period.
The outputs current and voltage are measured; meteorological data such as irradiance and
the module temperature are also measured. They are interfaced to a PC based data logging
device Hydra, FLUKE type. The daily pumped water quantity was measured by counter for a
day. In this field test pumping, the data is monitored for three different pumping heads (1.6m,
1.185m and 3.95m).
Figure 1. Photos of the system to study
Mohammed Yaichi, et al.
254
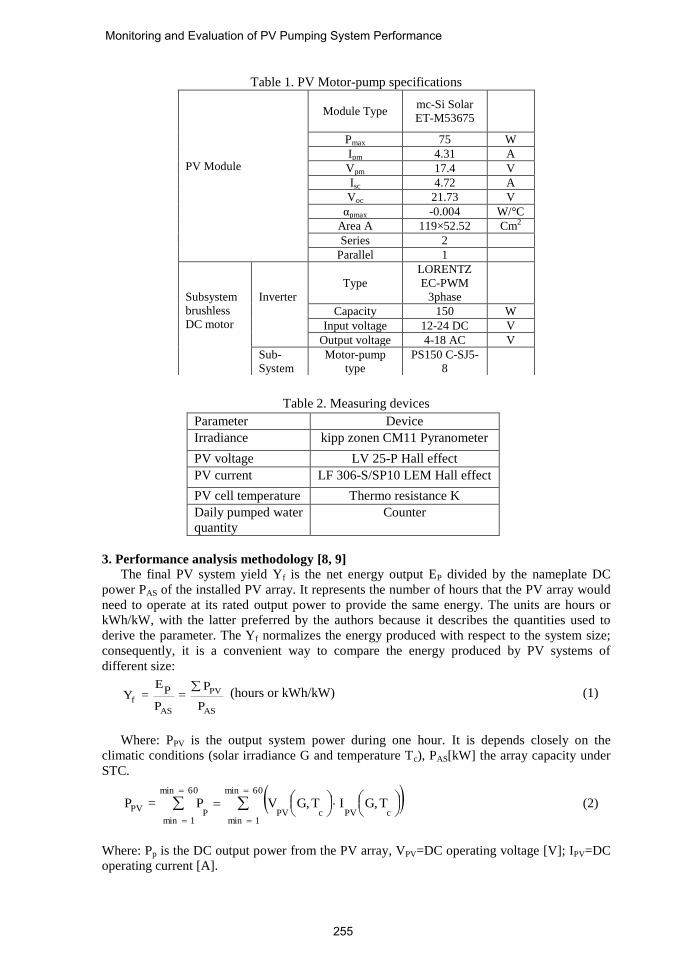
Table 1. PV Motor-pump specifications
Table 2. Measuring devices
3. Performance analysis methodology [8, 9]
The final PV system yield Yf is the net energy output EP divided by the nameplate DC
power PAS of the installed PV array. It represents the number of hours that the PV array would
need to operate at its rated output power to provide the same energy. The units are hours or
kWh/kW, with the latter preferred by the authors because it describes the quantities used to
derive the parameter. The Yf normalizes the energy produced with respect to the system size;
consequently, it is a convenient way to compare the energy produced by PV systems of
different size:
PVf
AS AS
PE P
Y = =P P
(hours or kWh/kW) (1)
Where: PPV is the output system power during one hour. It is depends closely on the
climatic conditions (solar irradiance G and temperature Tc), PAS[kW] the array capacity under
STC.
60min
1mincPVcPV
60min
1minP
PV TG,ITG,VP=P (2)
Where: Pp is the DC output power from the PV array, VPV=DC operating voltage [V]; IPV=DC
operating current [A].
PV Module
Module Type
mc-Si Solar
ET-M53675
Pmax 75 W
Ipm 4.31 A
Vpm 17.4 V
Isc 4.72 A
Voc 21.73 V
αpmax -0.004 W/°C
Area A 119×52.52 Cm2
Series 2
Parallel 1
Subsystem
brushless
DC motor
Inverter
Type
LORENTZ
EC-PWM
3phase
Capacity 150 W
Input voltage 12-24 DC V
Output voltage 4-18 AC V
Sub-
System
Motor-pump
type
PS150 C-SJ5-
8
Parameter Device
Irradiance kipp zonen CM11 Pyranometer
PV voltage LV 25-P Hall effect
PV current LF 306-S/SP10 LEM Hall effect
PV cell temperature Thermo resistance K
Daily pumped water
quantity
Counter
Monitoring and Evaluation of PV Pumping System Performance
255
The reference yield Yr is the total in-plane irradiance HP divided by the PV reference
irradiance GS. It represents an equivalent number of hours at the reference irradiance. GS equals
1kW/m2, then Yr is the number of peak sun-hours or the solar radiation in units of 1kW/m
2.
The Yr defines the solar radiation resource for the PV system. It is a function of the location,
orientation of the PV array, and month-to-month and year-to-year weather variability:
mesr
S S
PH G
Y = =G G
(hours) (3)
Where: Gmes is in-plan irradiance during one hour, HP the total irradiation in the given time
period [kWh/m2], GS the irradiance under STC.
In addition to the energy production by a PV system the performance is further
characterized by the performance ratio PR which is defined as the ratio of the measured system
efficiency and the nominal efficiency of the PV modules (i.e. specifically, the performance
ratio is the ratio of the actual and theoretically possible energy outputs). It is largely
independent of the orientation of a PV system, the incident solar irradiation and system size.
For this reason, the performance ratio can be used to compare PV plants supplying the grid at
different locations all over the world. The performance ratio is one of the most important
variables for evaluating the efficiency of a PV system. The performance ratio PR of a PV
system is the value provided by dividing Yf by the Yr. It is a useful way of quantifying the
overall effect of losses due to the inverter, wiring, power mismatch and other losses such as PV
module temperature, optical reflection, soiling and downtime failures.
f P
r ASP
EYPR = =
Y H × P(dimensionless) (4)
Although the performance ratio gives a global idea of the system behavior, it is very
difficult to use it as a tool to identify components that are not working properly and is thus
provided on an annual basis. Large decreases in PR indicate events that significantly impact
performance such as inverters not operating. Small decreases in PR indicate that a less severe
problem exists [9].
Generating power (Ep) of PV system for a period is calculated by the following equation
[10]:
AS Pp
S
P HE = PR
G(kWh) (5)
4. Photovoltaic energy conversion loss model of PV systems (Sophisticated Verification
method)
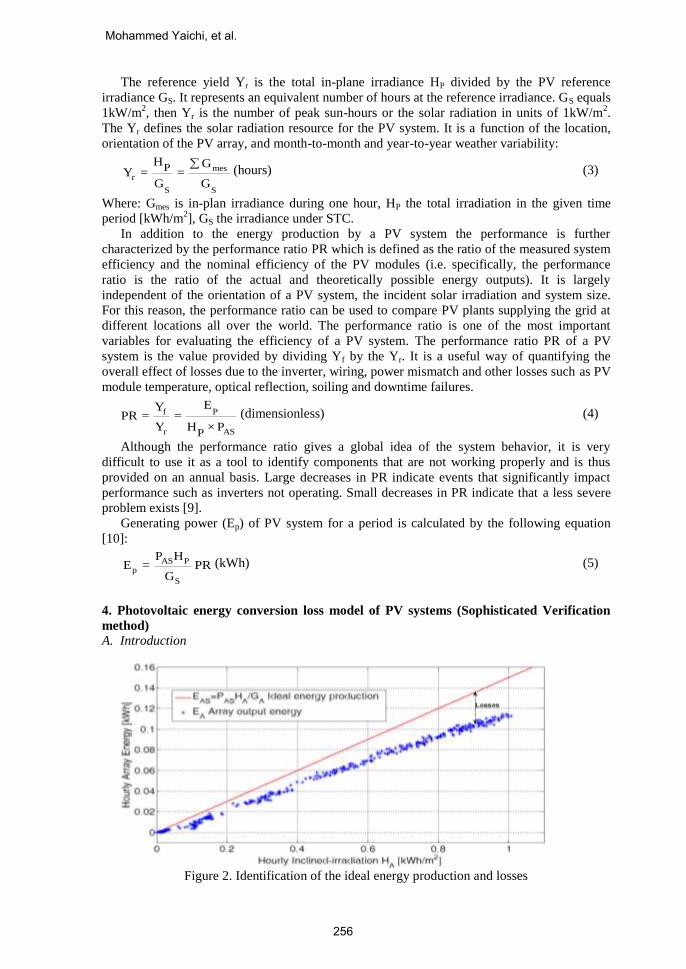
A. Introduction
Figure 2. Identification of the ideal energy production and losses
Mohammed Yaichi, et al.
256

A scattered graph as shown in Figure 2 gives very important information. Horizontal axis
shows all the data in-plane irradiation at each hour during the same month. Vertical axis
corresponds to hourly system output energy. An upper straight line corresponds to ideal energy
production by array with its capacity PAS under irradiation HA.
If the input and output energies of a given component x are denoted Exi and Exo, parameter
Kx is defined by the ratio of two energies as indicated in Figure 3 [6].
ExiKx Exo
xox
xi
EK =
E Figure 3. General definition of system parameters
Therefore, the loss is expressed by:
x xi xo xi xl = E - E = E 1- K (kWh) (6)
For example, if output energy of the modules EA=VPV·IPV, the cell temperature factor KPT is
calculated from the following equation (7) using temperature coefficient: αpmax[W/°C] specific
to a module [7].
PT pmax cK = 1+ T - 25 (kWh) (7)
With: Tc is module temperature.
If Tc>25°C, the KPT<1 (lx>0). On the opposite, the KPT>1 (lx<0). The positive value of lx
means the loss and negative value means the gain in the loss analysis, (lx=0) no losses.
The loss due to the temperature dependence will be calculated by:
pmax c
PT AT A A
pmax c
25 - Tl = E - E = E
1+ T - 25
(kWh) (8)
EAT is array output energy converts into cell temperature on STC.
Complicated and non-linear operations of PV system are assumed to be simple and linear
factors and generating power are easily calculated by those factors. The relationship of main
design parameters is expressed in Figure 4.
No mismatch line
Shading losses
Load mismatch losses
Affect temperature losses
Losses Inverter+motorpump
Hydraulic output energy
Other losses includes incident angle dependent losse due to module glass
surface reflection and array circuit losse as well as losses induced by soiling on module
surface and losses -consisting of series- connected module mismatch
Array output converts into cell temperature on STC
Array output
Ideal energy production
Solar radiation
Photovoltaic effect-incident light moves an electron from the valence band to the
conduction band. Losses induced by resistances and diode of the p-n junction inside module
PVidealη
KPO
lPO
ENM
lHS
KHS
lPM
KPMEAT
lPT
EAKPT
PVη
lIMP
Ehyd
Sη
SSη
PR
EAS
HA
Figure 4. Photovoltaic energy conversion and loss model of PV pumping system
Monitoring and Evaluation of PV Pumping System Performance
257
By using data acquisition system, several energy values are calculated on daily basis,
monthly basis or annual basis. These energy data can be utilized to obtain system parameters
such as system performance ratio PR, cell temperature factor KPT, power conditioner circuit
and motor-pump factor KIMP by a simple calculation.
Losses by inverter and motor-pump are calculated from the following equation according to
the difference of EA and Ehyd:
IMP A hydl = E - E (9)
Ehyd is hydraulic output energy.
Normally other useful parameters can be identified in addition, i.e., shading factor KHS,
load mismatching factor KPM and other array factor KPO. The identification of these additional
parameters has been quite difficult so far. So it is even by a specially planned monitoring
method. In this paper, a novel method developed by researchers Japanese called SV
(Sophisticated Verification) method has been used to obtain performance accurate from a PV
system representing different PV modules technologies.
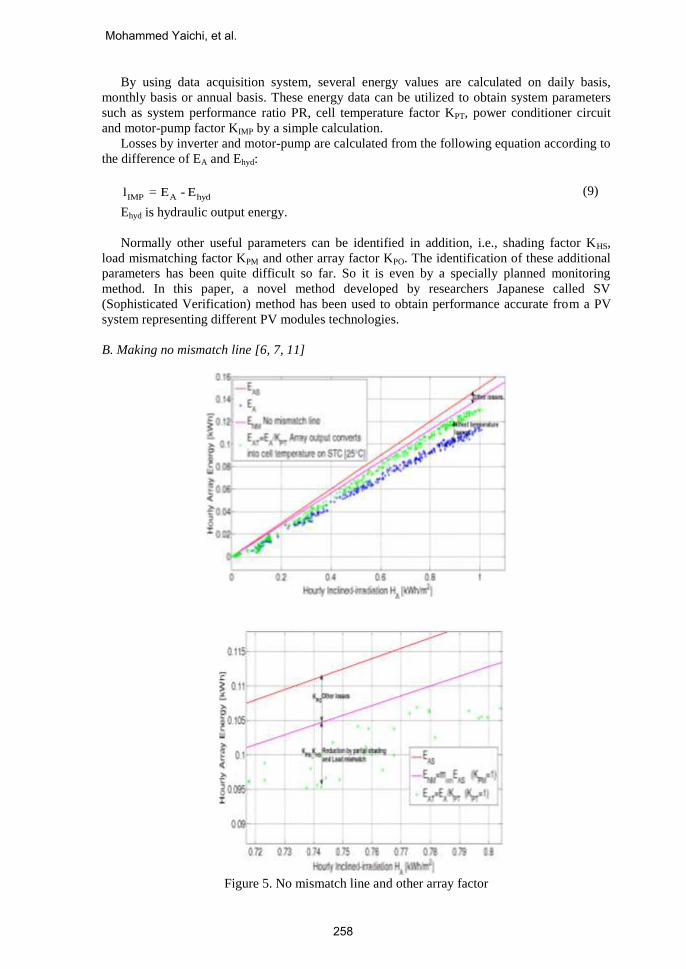
B. Making no mismatch line [6, 7, 11]
Figure 5. No mismatch line and other array factor
Mohammed Yaichi, et al.
258

A scattered graph as shown in Figure 5 also gives very important information. An upper
straight line corresponds to ideal energy production: EAS. Scattered dots are all the hourly data
EAT [it converts into cell temperature: 25°C of standard test condition]. A lower straight line is
drawn as the upper envelope of scattered points by changing mnm in Eq. (10). The line is called
‘‘no mismatch line’’: ENM means the most efficient performance and no shading, no mismatch
and not due to temperature dependence. When data are located below this line, it means partial
shading (which means that shadow exists on a part of PV array surface) and/or KPM≠1 (it is
considered that MPPT does not work well). Then, the remaining part of ENM-EAT is considered
to be Pmax mismatch component.
ANM nm AS
S
HE = m P
G (10)
C. Principle of shading rate definition for a month
AM Ath
AM Ath
HS Ath
AM Ath
E - 0.2E if E > 0.2E
K = 0.8E
1 if E < 0.2E
(11)
(a)
(b)
Figure 6. A typical example of identification of shading effect (a) July, (b) November
Monitoring and Evaluation of PV Pumping System Performance
259
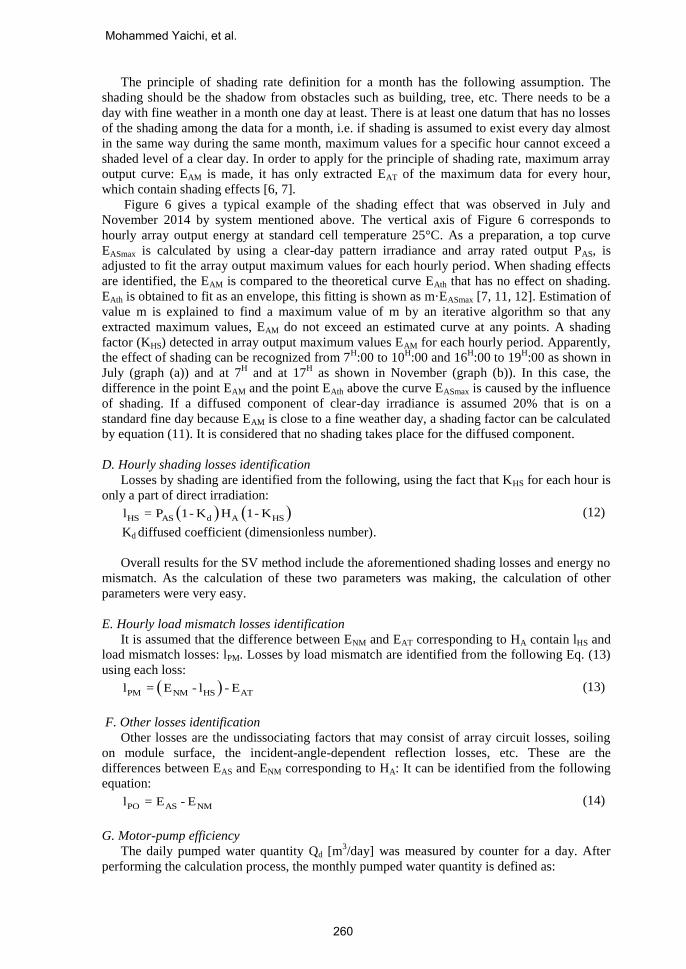
The principle of shading rate definition for a month has the following assumption. The
shading should be the shadow from obstacles such as building, tree, etc. There needs to be a
day with fine weather in a month one day at least. There is at least one datum that has no losses
of the shading among the data for a month, i.e. if shading is assumed to exist every day almost
in the same way during the same month, maximum values for a specific hour cannot exceed a
shaded level of a clear day. In order to apply for the principle of shading rate, maximum array
output curve: EAM is made, it has only extracted EAT of the maximum data for every hour,
which contain shading effects [6, 7].
Figure 6 gives a typical example of the shading effect that was observed in July and
November 2014 by system mentioned above. The vertical axis of Figure 6 corresponds to
hourly array output energy at standard cell temperature 25°C. As a preparation, a top curve
EASmax is calculated by using a clear-day pattern irradiance and array rated output PAS, is
adjusted to fit the array output maximum values for each hourly period. When shading effects
are identified, the EAM is compared to the theoretical curve EAth that has no effect on shading.
EAth is obtained to fit as an envelope, this fitting is shown as m·EASmax [7, 11, 12]. Estimation of
value m is explained to find a maximum value of m by an iterative algorithm so that any
extracted maximum values, EAM do not exceed an estimated curve at any points. A shading
factor (KHS) detected in array output maximum values EAM for each hourly period. Apparently,
the effect of shading can be recognized from 7H:00 to 10
H:00 and 16
H:00 to 19
H:00 as shown in
July (graph (a)) and at 7H and at 17
H as shown in November (graph (b)). In this case, the
difference in the point EAM and the point EAth above the curve EASmax is caused by the influence
of shading. If a diffused component of clear-day irradiance is assumed 20% that is on a
standard fine day because EAM is close to a fine weather day, a shading factor can be calculated
by equation (11). It is considered that no shading takes place for the diffused component.
D. Hourly shading losses identification
Losses by shading are identified from the following, using the fact that KHS for each hour is
only a part of direct irradiation:
HS AS d A HSl = P 1- K H 1- K (12)
Kd diffused coefficient (dimensionless number).
Overall results for the SV method include the aforementioned shading losses and energy no
mismatch. As the calculation of these two parameters was making, the calculation of other
parameters were very easy.
E. Hourly load mismatch losses identification
It is assumed that the difference between ENM and EAT corresponding to HA contain lHS and
load mismatch losses: lPM. Losses by load mismatch are identified from the following Eq. (13)
using each loss:
PM NM HS ATl = E - l - E (13)
F. Other losses identification
Other losses are the undissociating factors that may consist of array circuit losses, soiling
on module surface, the incident-angle-dependent reflection losses, etc. These are the
differences between EAS and ENM corresponding to HA: It can be identified from the following
equation:
PO AS NMl = E - E (14)
G. Motor-pump efficiency
The daily pumped water quantity Qd [m3/day] was measured by counter for a day. After
performing the calculation process, the monthly pumped water quantity is defined as:
Mohammed Yaichi, et al.
260
N
1ndn
m Q=Q (15)
Where: N indicate the number of day per month.
For a month, Qm [m3/month] and head H[m] are defined; it is easy to calculate the pump
energy output [kWh] (i.e. hydraulic energy output) as shown in equation (16) [13, 14].
HQCH=E mhyd (16)
2.725=3600
g=CH
:
-33mkg 10 water volumic mass the constant, g=9.81m·s
-2 the
constant of gravity.
Monthly average motor-pump efficiency can quite simply be calculated from:
100%×E
E100%×
E
Eηη
month A
hyd
P
hyd
SSIMP (17)
H. System and array efficiencies
The system efficiency and array efficiency may be calculated as follows:
100%×AH
E100%×
AH
Eη
month A
hyd
P
hyd
S
(18)
100%×AH
E100%×
AH
Eη
month A
A
P
A
PV
(19)
Where: Array area [m2].
While the array ideal efficiency (PV modules efficiency at STC) may be calculated as follows:
%12η100%×AG
P100%×
AH
HP
100%×AH
Eη
PVidealS
AS
P
PAS
P
month AS
PVideal
S
G
(20)
5. Analysis results
A. Compensation factor and the loss rate
The SV method was evaluated by losses: lx; compensation factors: Kx; and loss ratios: λx.
Compensation factors are coefficient based on the parameter analyzing method [7], and an
output ratio to the input in each loss process. Loss ratios are defined as the ratio of the rate for
which each loss occurs to the system input. The relation between lx and λx is shown below:
x
x
AS P
s
lλ =
P H
G
(21)
B. Results and discussions
During the test period of PV pumping system (May-November 2014), solar radiation per
day in each month range from 2.32 and 7.58kWh/m2/day in the plane of the PV modules, while
array energy output ranged between 0.28 and 1.01kWh/day. Long-term test results indicate the
relation of daily water discharge (m3/day) to the total daily array energy output (kWh/day). For
the three pumping head profiles, the results showed that water delivery by the pump ranged
from 12.18 to 28.99m3/day depending on head.
Monitoring and Evaluation of PV Pumping System Performance
261

Monthly average solar irradiation and array energy output analysis in Figure 7. The average
value of solar irradiation range from 5.7 and 7.1kWh/day. The average value of final PV
system yield range from 5.1 and 5.9kWh/day.
Figure 7. Total solar radiation and array energy output
Monthly performance ratios are summarized in next Figure; it shows the monthly PR based
on the rated PAS values of the modules. A direct comparison between the performance ratio of
the PV array shows that the PR for seven months is within the range of 76%-93%. Performance
ratios were lower in summer and higher in winter. In this particular comparison it is obvious
that the PV systems which provided the highest energy yield also had the highest PR values. In
addition, for example in May, a high solar irradiation is occurred, but the system shows low
PR, while in November a low solar irradiation is registered, but the system shows a high PR. A
direct comparison between the months September and November, the solar irradiation of
November was relatively smaller than the September, but the array energy output in November
was higher than that of September. It is worth noting that the PR as such does not represent the
amount of energy produced because a system with a low PR in a high solar resource location
might produce more energy than a system with a high PR in a low solar resource location.
Figure 8. Monthly performance ratios
Mohammed Yaichi, et al.
262
In order to compare this performance with other previous studies in the literature, we have
adjusted the performance in our system according to the results of the other system installed
years ago in Japan [9], Belgium [2], Korea [3] and Germany [4]. As a comparison, annual
ration the performance around the 72%, 84%, 78% and fairly low PR lower than 80% is
obtained (50% of systems in 2010 show PR>83%) were reported for PV systems installed
years ago in Japan Belgium, Korea and Germany, respectively.
The PR for the PV systems installed in Japan were relatively small than the above-
mentioned PR, related primarily to row shading (because the PV arrays was shaded, the
orientation of array mounted on the eaves had faced east-south, PV arrays on 2nd
and 3rd
floors
were especially shaded by the upper part of the building in seasons at the high solar elevation)
and bad inverter performance (Frequent inverter suspension in high grid-connected voltage)
[10].
C. Losses analysis
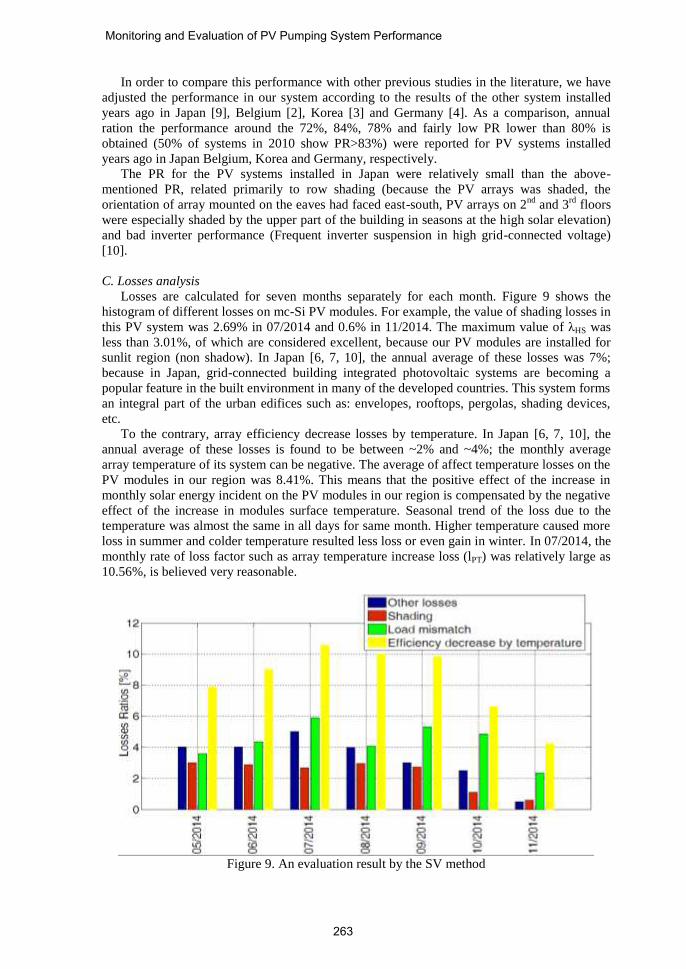
Losses are calculated for seven months separately for each month. Figure 9 shows the
histogram of different losses on mc-Si PV modules. For example, the value of shading losses in
this PV system was 2.69% in 07/2014 and 0.6% in 11/2014. The maximum value of λHS was
less than 3.01%, of which are considered excellent, because our PV modules are installed for
sunlit region (non shadow). In Japan [6, 7, 10], the annual average of these losses was 7%;
because in Japan, grid-connected building integrated photovoltaic systems are becoming a
popular feature in the built environment in many of the developed countries. This system forms
an integral part of the urban edifices such as: envelopes, rooftops, pergolas, shading devices,
etc.
To the contrary, array efficiency decrease losses by temperature. In Japan [6, 7, 10], the
annual average of these losses is found to be between ~2% and ~4%; the monthly average
array temperature of its system can be negative. The average of affect temperature losses on the
PV modules in our region was 8.41%. This means that the positive effect of the increase in
monthly solar energy incident on the PV modules in our region is compensated by the negative
effect of the increase in modules surface temperature. Seasonal trend of the loss due to the
temperature was almost the same in all days for same month. Higher temperature caused more
loss in summer and colder temperature resulted less loss or even gain in winter. In 07/2014, the
monthly rate of loss factor such as array temperature increase loss (lPT) was relatively large as
10.56%, is believed very reasonable.
Figure 9. An evaluation result by the SV method
Monitoring and Evaluation of PV Pumping System Performance
263

The load mismatch losses (lPM) are demonstrated in Figure 10. The average of 4.4% is
considered also excellent. It is thought that MPPT work very well. The results shows that the
monthly load mismatching losses of the PV systems installed in Algeria has the same values as
the monthly load mismatching losses of the PV systems installed in Japan.
The average of other array losses became 4% in summer. Although this is caused by soiling on
module surface, incident-angle-dependent reflection losses, array circuit losses and mismatch,
etc, in principle, the losses of soilure (dust due to sands wind) and the incident-angle-dependent
losses are believed to be major parameter, but the incident-angle-dependent reflection losses
cannot be easily reduced. This may be caused by most solar rays not perpendicular to module
glass surface in some months as May, Jun, July and August.
Figure 10 gives the quick summary of the average of all the parameters which have been
analyzed by the SV method for PV module.
Figure 10. A total evaluation result of PV module by the SV method for 7 months
We can define a new rating plate of photovoltaic modules using energy yield at maximum
power operation for a set of defined standard test day conditions. To encourage PV module
manufacturers to develop PV modules that optimize energy production as follows in Table 3
not power at a single rating condition, typically STC.
Table 3. New rating plate
Generally, if PR is under 65%, various troubles concerning the system performance
obstruction such as the shading, inverter MPPT mismatch, etc. will be suggested to be more
investigated. The results the outdoor exposure tests will clarify the degradation mode of PV
modules, and will leads to the fabrication of the anti-degradation PV modules with higher
reliabilities. It will help to make energy rating of photovoltaic modules under real operating
conditions and help of existing PV systems to find troubles/failures. i.e. to be introduced to the
diagnosis of the system PV. But the performance ratio did not always to identify us
Module Type mc-Si Solar ET-M53675
Pmax 75×2 W
Ipm 4.31 A
Vpm 17.4×2 V
Isc 4.72 A
Voc 21.73×2 V
EP (Adrar, Summer) PAS·HP·PR= 0.15·7·0.78=0.82 kWh/day
EP (Adrar, Winter) 0.15·6·0.91=0.82 kWh/day
Mohammed Yaichi, et al.
264
components that are not working properly; it must make the survey for each component of PV
systems.
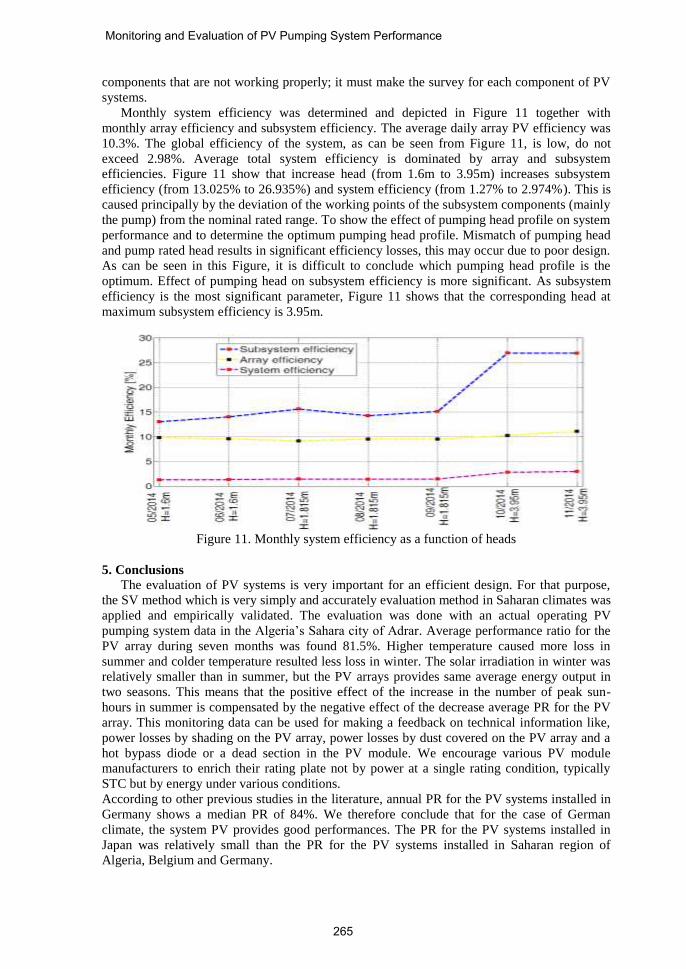
Monthly system efficiency was determined and depicted in Figure 11 together with
monthly array efficiency and subsystem efficiency. The average daily array PV efficiency was
10.3%. The global efficiency of the system, as can be seen from Figure 11, is low, do not
exceed 2.98%. Average total system efficiency is dominated by array and subsystem
efficiencies. Figure 11 show that increase head (from 1.6m to 3.95m) increases subsystem
efficiency (from 13.025% to 26.935%) and system efficiency (from 1.27% to 2.974%). This is
caused principally by the deviation of the working points of the subsystem components (mainly
the pump) from the nominal rated range. To show the effect of pumping head profile on system
performance and to determine the optimum pumping head profile. Mismatch of pumping head
and pump rated head results in significant efficiency losses, this may occur due to poor design.
As can be seen in this Figure, it is difficult to conclude which pumping head profile is the
optimum. Effect of pumping head on subsystem efficiency is more significant. As subsystem
efficiency is the most significant parameter, Figure 11 shows that the corresponding head at
maximum subsystem efficiency is 3.95m.
Figure 11. Monthly system efficiency as a function of heads
5. Conclusions
The evaluation of PV systems is very important for an efficient design. For that purpose,
the SV method which is very simply and accurately evaluation method in Saharan climates was
applied and empirically validated. The evaluation was done with an actual operating PV
pumping system data in the Algeria’s Sahara city of Adrar. Average performance ratio for the
PV array during seven months was found 81.5%. Higher temperature caused more loss in
summer and colder temperature resulted less loss in winter. The solar irradiation in winter was
relatively smaller than in summer, but the PV arrays provides same average energy output in
two seasons. This means that the positive effect of the increase in the number of peak sun-
hours in summer is compensated by the negative effect of the decrease average PR for the PV
array. This monitoring data can be used for making a feedback on technical information like,
power losses by shading on the PV array, power losses by dust covered on the PV array and a
hot bypass diode or a dead section in the PV module. We encourage various PV module
manufacturers to enrich their rating plate not by power at a single rating condition, typically
STC but by energy under various conditions.
According to other previous studies in the literature, annual PR for the PV systems installed in
Germany shows a median PR of 84%. We therefore conclude that for the case of German
climate, the system PV provides good performances. The PR for the PV systems installed in
Japan was relatively small than the PR for the PV systems installed in Saharan region of
Algeria, Belgium and Germany.
Monitoring and Evaluation of PV Pumping System Performance
265

For provides useful information about the seasonal behaviour of any PV technology, by the
evaluation of the long term performances of PV module in the severe natural environment, it is
necessary deployed the PV system for at least for more than a year. We will continue the
performance study of our PV system.
Subsystem efficiencies as a function of system pumping head were investigated. Monthly
efficiency at optimum head was found as: 26.93% for the subsystem, 2.9% for the PV system.
The installation of pump with a pumping head causes efficiency pumping to be some 17%
inferior to optimally pumping head.
6. Acknowledgment
The authors would like acknowledge the financial support of Japan International
Cooperation Agency (JICA) and Japan Science and Technology Agency (JST) for their
training in National Institute of Advanced Industrial Science and Technology (AIST) their
support for the SSB project.
7. References
[1]. A. J. Carr, “A detailed performance comparison of PV modules of different
technologies and the implications for PV system design methods”, Ph.D. Murdoch
University, Western Australia, July 2005.
[2]. J. Leloux, L. Narvarte, D. Trebosc, “Review of the performance of residential PV systems
in Belgium”, Renewable and Sustainable Energy Reviews 16 (2012) 178– 184.
[3]. J.H. So, Y.S. Jung, G.J. Yu, J.Y. Choi, J.H. Choi, “Performance results and analysis of 3
kW grid-connected PV systems”, Renewable Energy 32 (2007) 1858–1872.
[4]. N.H. Reich, B. Mueller, A. Armbruster, W.G.J.H. M. van Sark, K. Kiefer and C. Reise,
“Performance ratio revisited: is PR>90% realistic? ”, Progress in photovoltaic’s: research
and applications prog. photovolt: res. appl. 2012; 20:717–726.
[5]. M. Drif, P. J. Pérez, J. Aguilera, J.D. Aguilar, “A new estimation method of irradiance on
a partially shaded PV generator in grid-connected photovoltaic systems”, Renewable
Energy 33 (2008) 2048–2056.
[6]. K. Kurokawa, D. Uchida, K. Otani, “Sophisticated Verification PV of simple monitored
data for Japanese field test program”, 2nd
World Conference and Exhibition on
Photovoltaic Solar Energy Conversion, Vienna, Austria, July. 6-10, 1998.
[7]. T. Oozeki, T. Izawa, K. Otani, K. Kurokawa, “An evaluation method of PV systems”,
Solar Energy Materials & Solar Cells 75 (2003) 687–695.
[8]. Y. Ueda, Y. Tsuno, M. Kuda, H. Konishi, K. Kurokawa, “Comparison between the I-V
mesurement and the system performance in various kinds of PV technologies”, 5th
WCPEC/25th
EUPVSEC, Valencia, Sep 2010, pp. 6-10.
[9]. B. Marion, J. Adelstein, K. Boyle, H. Hayden, B. Hammond, T. Fletcher, B. Canada, D.
Narang, D. Shugar, H. Wenger, A. Kimber, L. Mitchell, G. Rich, and T. Townsend,
“Performance Parameters for Grid-Connected PV Systems”, 31st IEEE Photovoltaics
Specialists Conference and Exhibition, Lake Buena Vista, Florida, February 2005.
[10]. T. Sugiuraa, T. Yamadaa, H. Nakamuraa, M. Umeyaa, K. Sakutab, K. Kurokawa,
“Measurements, analyses and evaluation of evidential PV systems by Japanese
monitoring program”, Solar Energy Materials & Solar Cells 75 (2003) 767–779.
[11]. D. Uchida, K. Otani, K. Kurokawa, “Evaluation of effective shading factor by fitting a
clear-day pattern obtained from hourly maximum irradiance data”, Solar Energy
Materials & Solar Cells 67 (2011) 519–528.
[12]. K. Kurokawa, H. Sugiyama, D. Uchida, K. Sakamoto, T. Ohshiro, “Realistic PV
performance values obtained by a number of grid-connected systems in Japan”, North
Sun ’99 8th
Intern. Conf. on Solar Energy in High Latitudes, Edmonton, Canada, Aug. 11-
14, 1999.
Mohammed Yaichi, et al.
266

[13]. M. Benghanem, K.O. Daffallah, A.A. Joraid, S.N. Alamri, A. Jabe, "Performances of
solar water pumping system using helical pump for a deep well: A case study for
Madinah, Saudi Arabia", Energy Conversion and Management 65 (2013) 50–56.
[14]. I. Odeh, Y.G. Yohanis, B. Norton, “Influence of pumping head, insolation and PV array
size on PV water pumping system performance”, Solar Energy 80 (2006) 51–64.
Mohammed Yaichi was born on 1980 in Adrar, Algeria. He received the
Engineer degree in Electrical Engineering from University of Bechar, Algeria,
in 2003, and the magister degree from Djillali Liabes University, Sidi-Bel-
Abbes, Algeria in 2006. He is currently working toward the doctorate degree in
the Power Electronics, and the Photovoltaic Pumping System. Since 2009, he is
with the Photovoltaic Pumping Team, Research Unit in Renewable Energies in
the Saharan Medium (URER/MS) Adrar, Algeria. His research interests
include a study on performance improvement of a stand-alone photovoltaic pumping system,
variable-speed AC motor drives, and different multilevel inverter circuit topologies thus its
technique of control PWM.
Abdelkrim Mammeri was born on 1979 in Bechar, Algeria. He received the
Engineer degree in Hydraulic from University of Sciences and Technology,
Oran, Algeria, in 2006, and now studying for master degree. Since
06/11/2006, he is with the Photovoltaic Pumping Team, Research Unit in
Renewable Energies in the Saharan Medium (URER/MS) Adrar, Algeria. His
research interests include a study on performance improvement of a stand-
alone photovoltaic pumping system.
Mohammed-Karim Fellah was born in Oran, Algeria, in 1963. He received
the Eng. degree in Electrical Engineering from University of Sciences and
Technology, Oran, Algeria, in 1986, and the Ph.D. degree from National
Polytechnic Institute of Lorraine (Nancy, France) in 1991. Since 1992, he is
Professor at the University of Sidi Bel-Abbes (Algeria) and Member of the
Intelligent Control and Electrical Power. His current research interest
includes Power Electronics, HVDC links, and Drives.
Monitoring and Evaluation of PV Pumping System Performance
267