([DPSOHใช้ กฎการใช้ และตัวอย่างประโยคพร้อมคำาแปลเป็นภาษาไทยเพื่อให้

การวเคราะหโดยใชสถต
Statistical Analysis
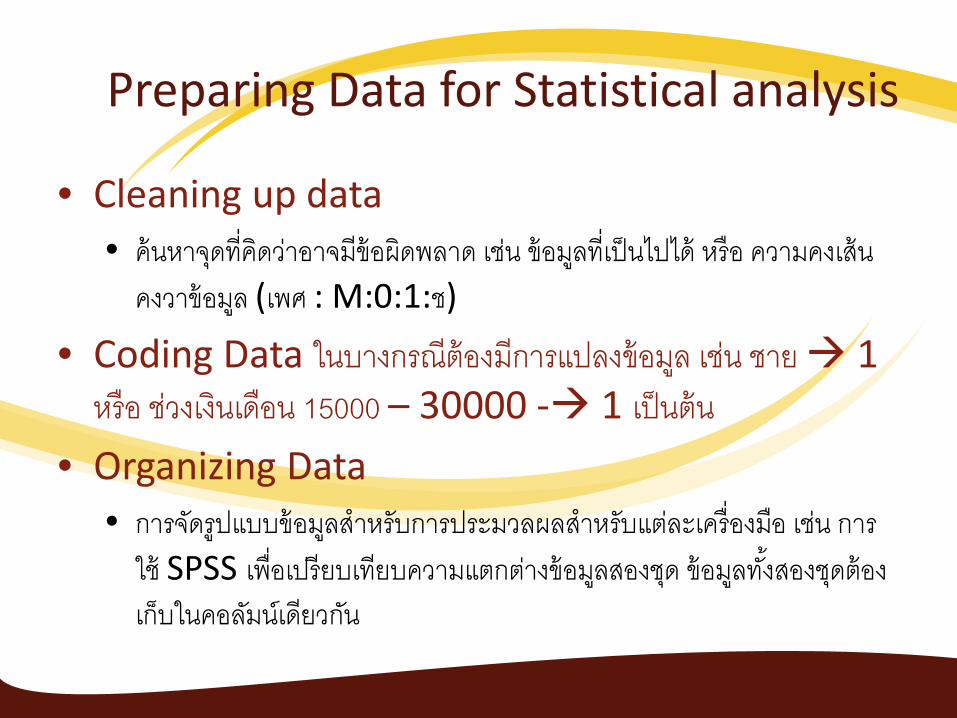
Preparing Data for Statistical analysis
• Cleaning up data
• คนหาจดทคดวาอาจมขอผดพลาด เชน ขอมลทเปนไปได หรอ ความคงเสน
คงวาขอมล (เพศ : M:0:1:ช)
• Coding Data ในบางกรณตองมการแปลงขอมล เชน ชาย 1 หรอ ชวงเงนเดอน 15000 – 30000 - 1 เปนตน
• Organizing Data • การจดรปแบบขอมลสาหรบการประมวลผลสาหรบแตละเครองมอ เชน การ
ใช SPSS เพอเปรยบเทยบความแตกตางขอมลสองชด ขอมลทงสองชดตอง
เกบในคอลมนเดยวกน

Descriptive Statistics • เพอใหเขาใจพนฐานขอมล
• ตวอยาง Means, medians, variances, standard deviation และ ranges
• การวดความเขาสศนยกลาง (Measured of central tendency) : คาเฉลย (mean/average) คามธยฐาน (Median) ฐานนยม (mode)
• วดการกระจาย (Measures of spread) : range, variance, sd
• รปแบบขอมลการกระจาย : normal distribution • กรณไมใช ND, ตองแปลง หรอ ใช non-parametric

การเปรยบเทยบคาเฉลย • Significance test
• t test : two independent sample • ANOVA test มเงอนมากกวาสอง : one-way, factorial, repeated , split-plot
Experiment desing Independent Var(IV) Conditions for each IV Types of test1 2 Independent-sample t test1 3 or more one-way ANOVA
2 or more 2 or more Factorial ANOVA1 2 Paired-sample t test1 3 or more Repeated measure ANOVA
2 or more 2 or more Repeated measure ANOVABetween-and-within-group 2 or more Split-plot ANANO
Between-group
Within-group
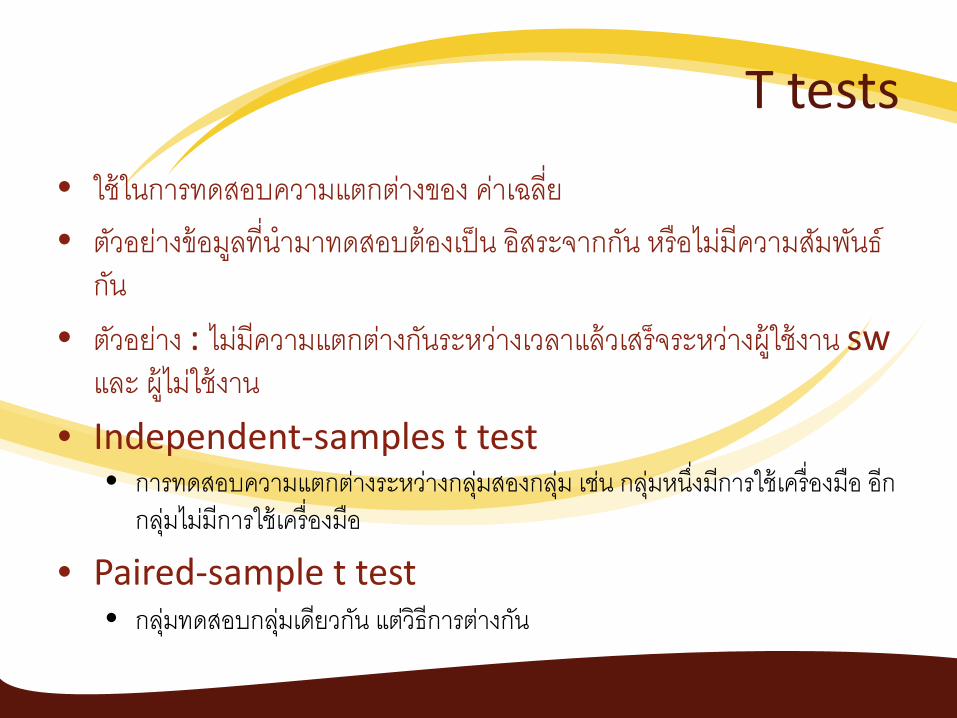
T tests • ใชในการทดสอบความแตกตางของ คาเฉลย
• ตวอยางขอมลทนามาทดสอบตองเปน อสระจากกน หรอไมมความสมพนธกน
• ตวอยาง : ไมมความแตกตางกนระหวางเวลาแลวเสรจระหวางผใชงาน sw และ ผ ไมใชงาน
• Independent-samples t test • การทดสอบความแตกตางระหวางกลมสองกลม เชน กลมหนงมการใชเครองมอ อก
กลมไมมการใชเครองมอ
• Paired-sample t test • กลมทดสอบกลมเดยวกน แตวธการตางกน
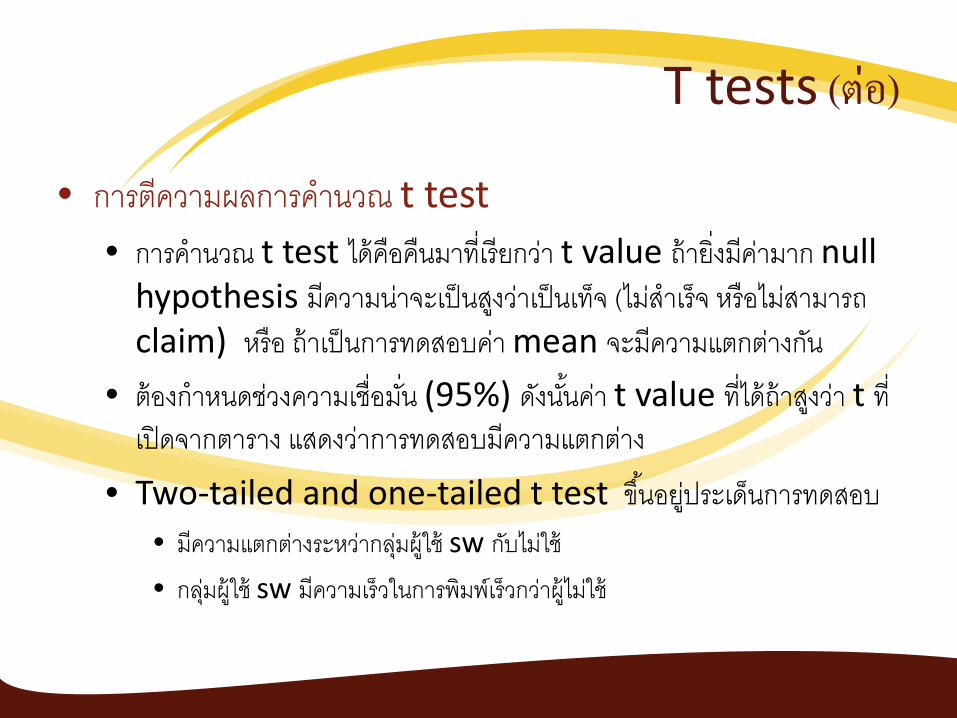
T tests (ตอ)
• การตความผลการคานวณ t test • การคานวณ t test ไดคอคนมาทเรยกวา t value ถายงมคามาก null
hypothesis มความนาจะเปนสงวาเปนเทจ (ไมสาเรจ หรอไมสามารถ
claim) หรอ ถาเปนการทดสอบคา mean จะมความแตกตางกน • ตองกาหนดชวงความเชอมน (95%) ดงนนคา t value ทไดถาสงวา t ท
เปดจากตาราง แสดงวาการทดสอบมความแตกตาง
• Two-tailed and one-tailed t test ขนอยประเดนการทดสอบ
• มความแตกตางระหวากลมผ ใช sw กบไมใช
• กลมผ ใช sw มความเรวในการพมพเรวกวาผ ไมใช

การวเคราะหความแปรปรวน (Analysis of variance)
• ANOVA ใชในการเปรยบเทยบ mean มากกวาสองกลม
• หรอบางทเรยกวาเปน F test • One-way Anova
• ทดสอบความแตกตางระหวางกลม
• ตรวจสอบเฉพาะตวแปรอสระเพยงหนงตวแปร แตมหลายๆ เงอนไง
• ตวอยางเชน ตองการทดสอบประสทธผลของการบนทกขอมลดวยวธการปกต
(Standard) แบบมตวชวย (word-prediction) และ แบบ
speech-based (บนทกดวยเสยง)

ตวอยางขอมล Group Participants task completion time standard Participant 1 245 standard Participant 2 236 standard Participant 3 321 standard Participant 4 212 standard Participant 5 267 standard Participant 6 334 standard Participant 7 287 standard Participant 8 259 prediction Participant 1 246 prediction Participant 2 213 prediction Participant 3 265 prediction Participant 4 189 prediction Participant 5 201 prediction Participant 6 197 prediction Participant 7 289 prediction Participant 8 224 speech-based dictation Participant 1 178 speech-based dictation Participant 2 289 speech-based dictation Participant 3 222 speech-based dictation Participant 4 189 speech-based dictation Participant 5 245 speech-based dictation Participant 6 311 speech-based dictation Participant 7 267 speech-based dictation Participant 8 197

ลองหา ANOVA ดวย Excel
• ดาวนโหลดขอมลจากเวบรายวชา
• ทดลองหา ความแปรปรวนระหวางกลม และ ภายในกลมโดยใช Excel (ใหลองศกษาจากคมอ) ใหเวลาประมาณ 30 นาท นศ. ททราบสามารถใหความรเพอน ๆ ได
• เปดตาราง F (2, 21) = ???
ANOVA
Source of Variation SS df MS F P-value F crit
Between Groups 7842.25 2 3921.125 2.173781 0.138667 3.4668
Within Groups 37880.375 21 1803.827

Factorial ANOVA
• ศกษาความแตกตางระหวางกลม
• มตวแปรอสระมากกวาหนงตวแปร
• ตวอยาง
• จากตวอยางเดมทตองทดสอบประสทธภาพการทางานดวยเครองมอแตละ
ประเภท เราตองการศกษาเพมเตมวางานประเภทใดทเหมาะสมกบการใช
เครองมอ
• สมมตเพมงานอก 2 ประเภท เงอนไขการทดสอบจะมทงสน 6 แบบ (2*3)
• (หาขอมลไมได)

Repeated measures ANOVA
• กรณตองการประเมนความแตกตางภายในกลม และมหลายเงอนไข ทา
ใหตองจดเตรยมขอมลเพม
• ตวอยางเชน ประเภทการบนทกขอมล (Data entry type) - 3 และตามประเภทของงาน (task type) – 2 ตองจดเตรยมขอมล 6 ชด ถาแตละเงอนไขของการทดสอบตองการขอมล 12 รายการ ทาให
ตองจดเตรยมขอมลทงสน 6*12 = 72 ในงานบางงานไมสามารถจดเกบขอมลไดโดยเฉพาะทเกยวของกบมนษย
• ในการออกแบบใหแตละกลม ทาการทดลองใหครบทกประเภท
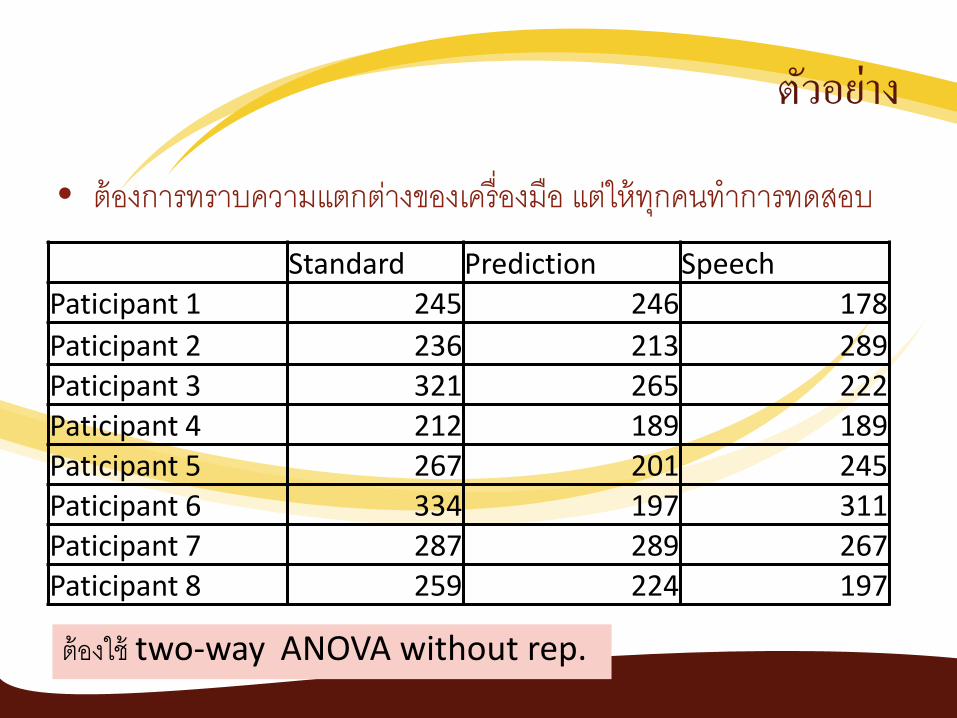
ตวอยาง
• ตองการทราบความแตกตางของเครองมอ แตใหทกคนทาการทดสอบ Standard Prediction Speech
Paticipant 1 245 246 178 Paticipant 2 236 213 289 Paticipant 3 321 265 222 Paticipant 4 212 189 189 Paticipant 5 267 201 245 Paticipant 6 334 197 311 Paticipant 7 287 289 267 Paticipant 8 259 224 197
ตองใช two-way ANOVA without rep.
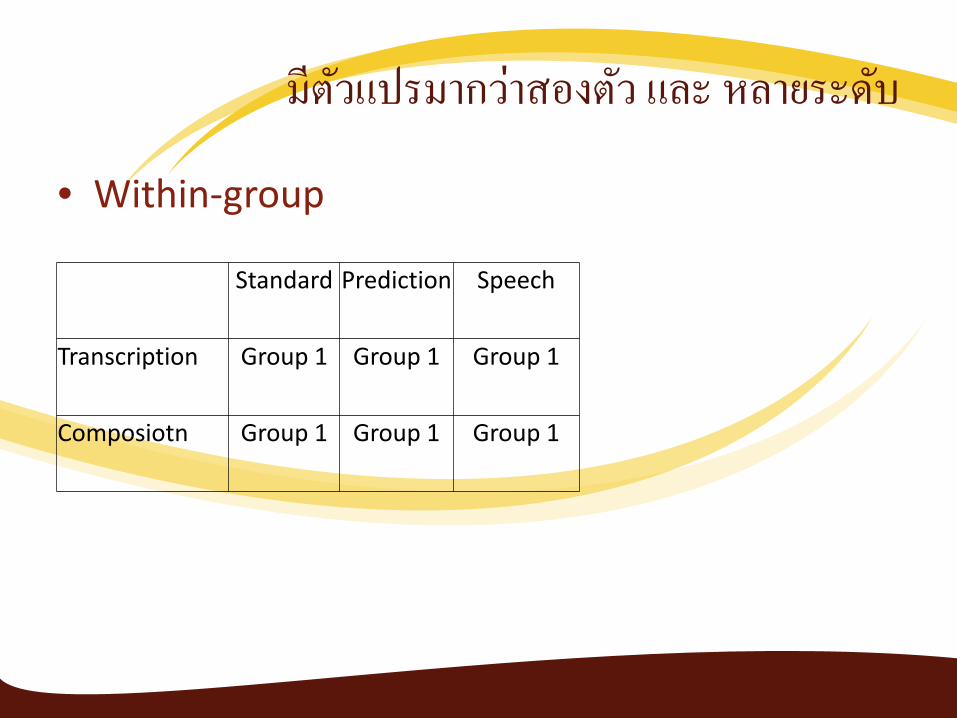
มตวแปรมากวาสองตว และ หลายระดบ
• Within-group
Standard Prediction Speech
Transcription Group 1 Group 1 Group 1
Composiotn Group 1 Group 1 Group 1

ANOVA for split-plot design
• ตองการศกษาทง between-group และ within-group • ตวอยาง กลมตวอยาง 2 กลม แยกการทดลองแตละงาน แตทก
เครองมอ
Keyboard prediction SpeechTransciption Group 1 Group 1 Group 1Composition Group 2 Group 2 Group 2
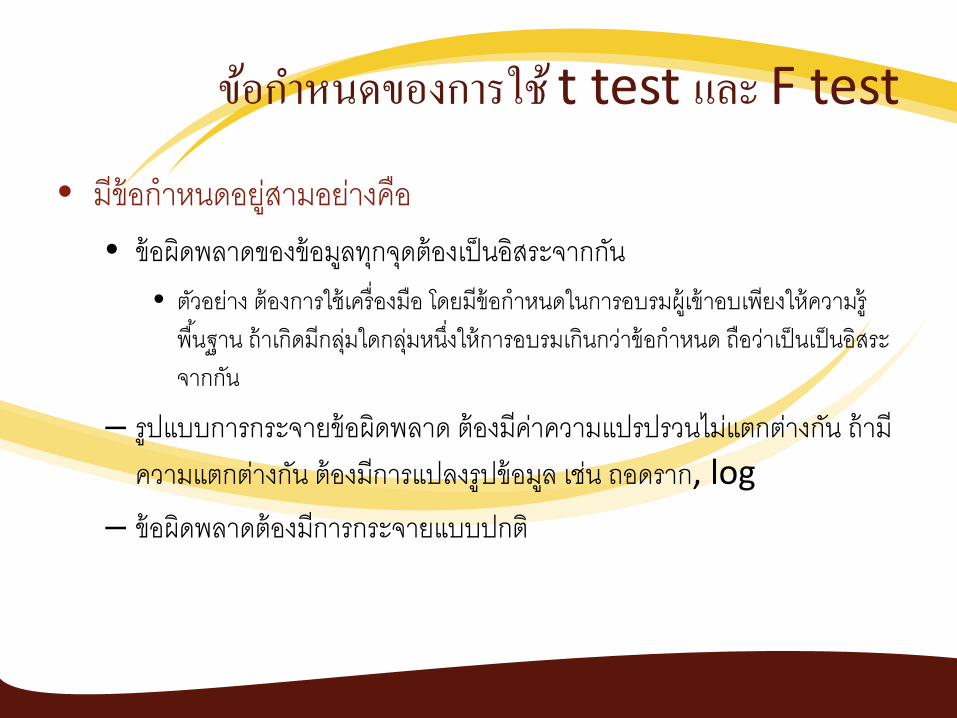
ขอกาหนดของการใช t test และ F test
• มขอกาหนดอยสามอยางคอ
• ขอผดพลาดของขอมลทกจดตองเปนอสระจากกน
• ตวอยาง ตองการใชเครองมอ โดยมขอกาหนดในการอบรมผ เขาอบเพยงใหความร
พนฐาน ถาเกดมกลมใดกลมหนงใหการอบรมเกนกวาขอกาหนด ถอวาเปนเปนอสระ
จากกน
– รปแบบการกระจายขอผดพลาด ตองมคาความแปรปรวนไมแตกตางกน ถาม
ความแตกตางกน ตองมการแปลงรปขอมล เชน ถอดราก, log – ขอผดพลาดตองมการกระจายแบบปกต

Correlation
• เปนหนงในรปแบบของการหาความสมพนธของตวแปร C Exp. Standard Prediction
Participlant 1 12 245 246 Participlant 2 6 236 213 Participlant 3 3 321 265 Participlant 4 19 212 189 Participlant 5 16 267 201 Participlant 6 5 334 197 Participlant 7 8 287 289 Participlant 8 11 259 224
C Exp. Standard Prediction
C Exp. 1
Standard -0.72264 1
Prediction -0.46753 0.324856 1

Regression
• ความสมพนธระหวางตวแปรไมอสระ หนงตวแปร กบตวแปรอสระ
มากกวาหนงตวแปร
• นามาใช
• Model construction • Model prediction

Nonparametric statistical tests
• Chi-square test • ขอมลในตารางสรป (Contingency table) ตองเปนอสระจากกน
• ใชไมไดด กรณขอมลขนาดเลก (ควรมากกวา 20)

การประเมนประสทธผลของโมเดล

Model Evaluation • Metrics for Performance Evaluation
– How to evaluate the performance of a model?
• Methods for Performance Evaluation – How to obtain reliable estimates?
• Methods for Model Comparison
– How to compare the relative performance among competing models?
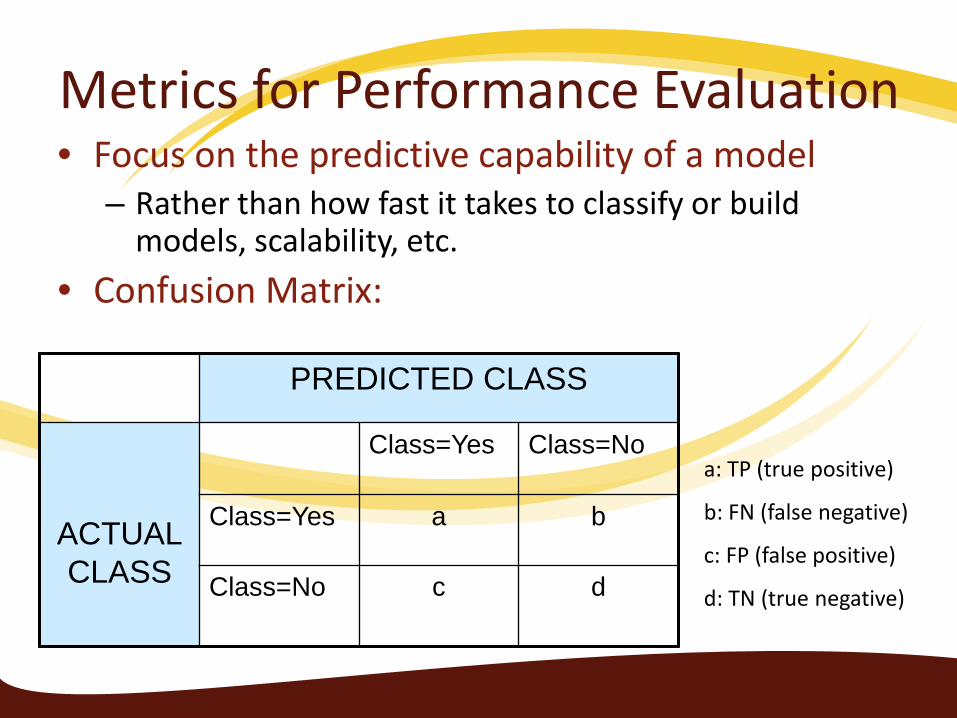
Metrics for Performance Evaluation • Focus on the predictive capability of a model
– Rather than how fast it takes to classify or build models, scalability, etc.
• Confusion Matrix:
PREDICTED CLASS
ACTUAL CLASS
Class=Yes Class=No
Class=Yes a b
Class=No c d
a: TP (true positive)
b: FN (false negative)
c: FP (false positive)
d: TN (true negative)
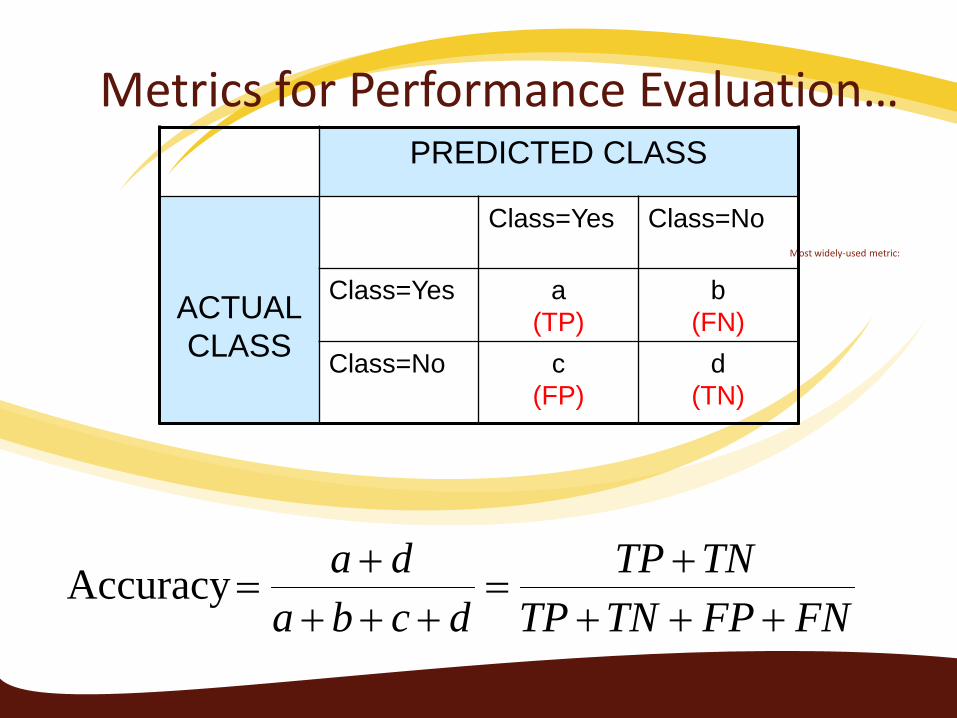
Metrics for Performance Evaluation…
Most widely-used metric:
PREDICTED CLASS
ACTUAL CLASS
Class=Yes Class=No
Class=Yes a (TP)
b (FN)
Class=No c (FP)
d (TN)
FNFPTNTPTNTP
dcbada
++++
=+++
+=Accuracy
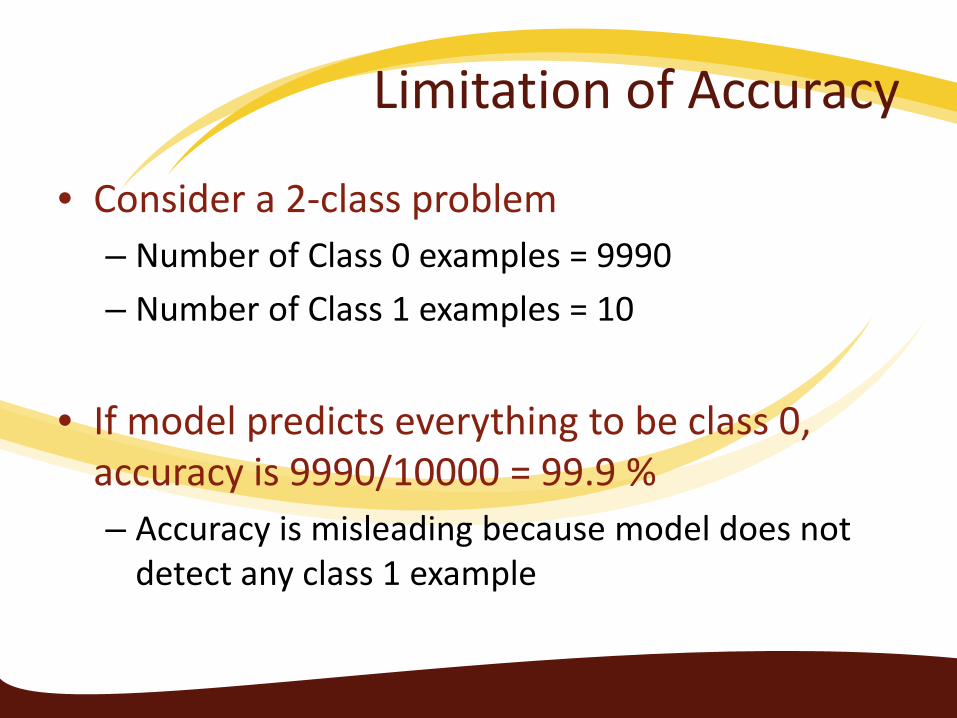
Limitation of Accuracy
• Consider a 2-class problem – Number of Class 0 examples = 9990 – Number of Class 1 examples = 10
• If model predicts everything to be class 0, accuracy is 9990/10000 = 99.9 % – Accuracy is misleading because model does not
detect any class 1 example
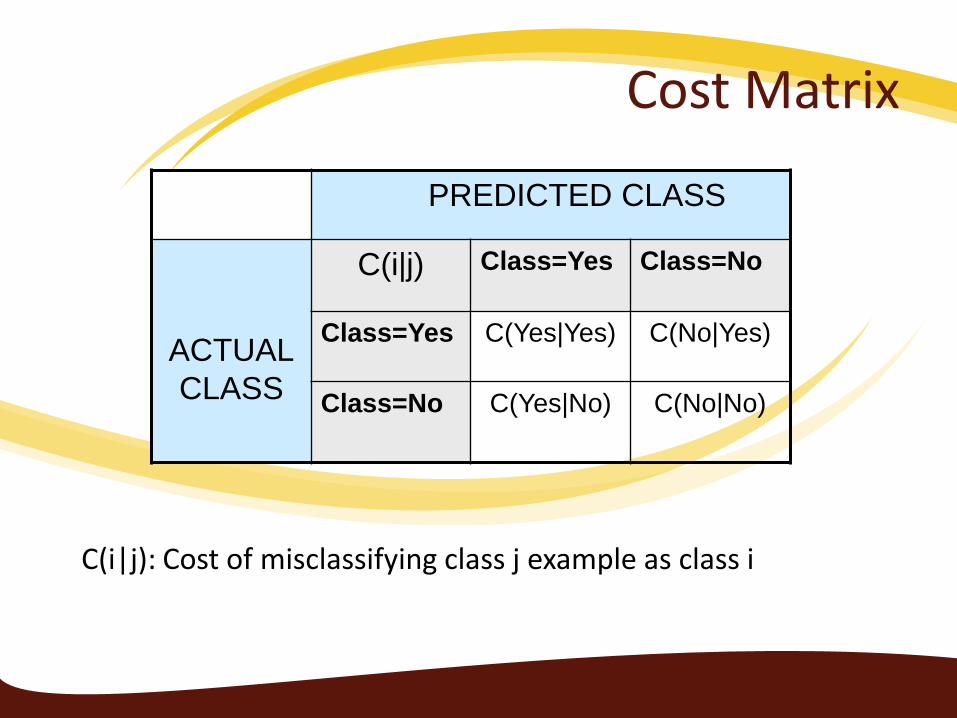
Cost Matrix
PREDICTED CLASS
ACTUAL CLASS
C(i|j) Class=Yes Class=No
Class=Yes C(Yes|Yes) C(No|Yes)
Class=No C(Yes|No) C(No|No)
C(i|j): Cost of misclassifying class j example as class i

Computing Cost of Classification Cost
Matrix PREDICTED CLASS
ACTUAL CLASS
C(i|j) + - + -1 100 - 1 0
Model M1
PREDICTED CLASS
ACTUAL CLASS
+ - + 150 40 - 60 250
Model M2
PREDICTED CLASS
ACTUAL CLASS
+ - + 250 45 - 5 200
Accuracy = 80% Cost = 3910
Accuracy = 90% Cost = 4255

Cost vs Accuracy
Count PREDICTED CLASS
ACTUAL CLASS
Class=Yes Class=No
Class=Yes a b
Class=No c d
Cost PREDICTED CLASS
ACTUAL CLASS
Class=Yes Class=No
Class=Yes p q
Class=No q p
N = a + b + c + d
Accuracy = (a + d)/N
Cost = p (a + d) + q (b + c)
= p (a + d) + q (N – a – d)
= q N – (q – p)(a + d)
= N [q – (q-p) × Accuracy]
Accuracy is proportional to cost if 1. C(Yes|No)=C(No|Yes) = q 2. C(Yes|Yes)=C(No|No) = p

Cost-Sensitive Measures
cbaa
prrp
baa
caa
++=
+=
+=
+=
222(F) measure-F
(r) Recall
(p)Precision
Precision is biased towards C(Yes|Yes) & C(Yes|No) Recall is biased towards C(Yes|Yes) & C(No|Yes) F-measure is biased towards all except C(No|No)
dwcwbwawdwaw
4321
41Accuracy Weighted+++
+=
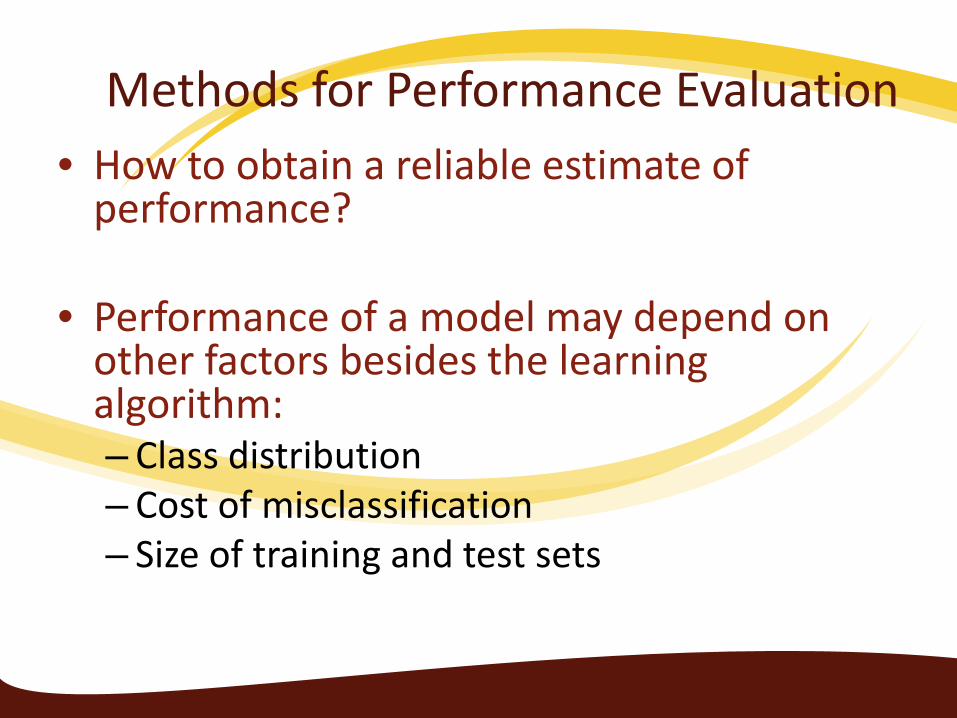
Methods for Performance Evaluation • How to obtain a reliable estimate of
performance?
• Performance of a model may depend on other factors besides the learning algorithm: – Class distribution – Cost of misclassification – Size of training and test sets
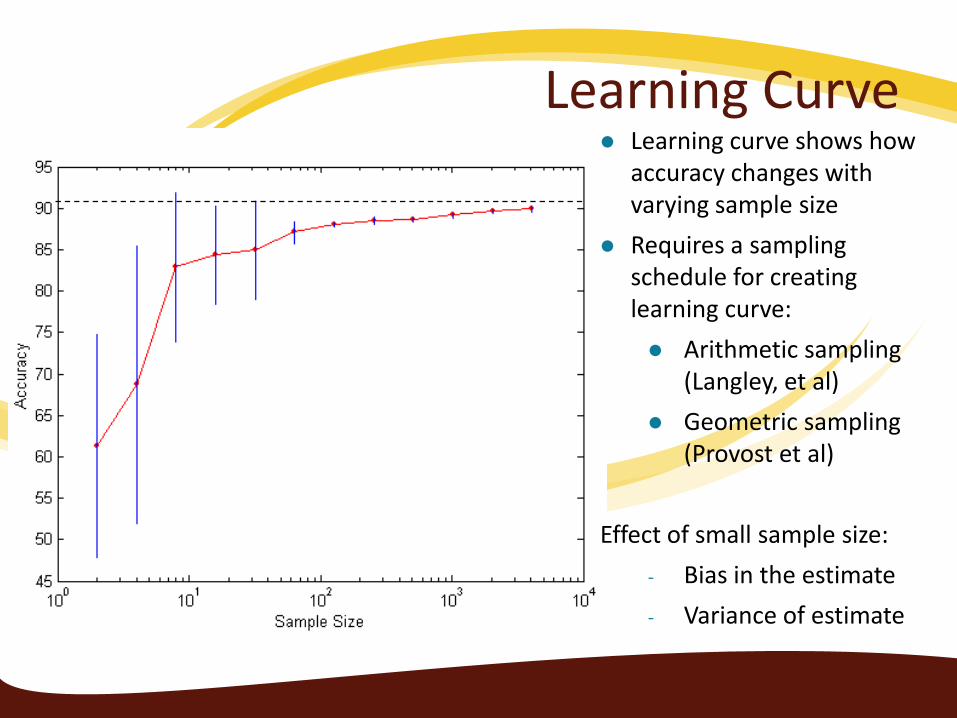
Learning Curve Learning curve shows how
accuracy changes with varying sample size
Requires a sampling schedule for creating learning curve: Arithmetic sampling
(Langley, et al) Geometric sampling
(Provost et al) Effect of small sample size:
- Bias in the estimate - Variance of estimate

Methods of Estimation Holdout
– Reserve 2/3 for training and 1/3 for testing • Random subsampling
– Repeated holdout • Cross validation
– Partition data into k disjoint subsets – k-fold: train on k-1 partitions, test on the remaining one – Leave-one-out: k=n
• Stratified sampling – oversampling vs undersampling
• Bootstrap – Sampling with replacement

Comparing Performance of 2 Models
• Given two models, say M1 and M2, which is better? – M1 is tested on D1 (size=n1), found error rate = e1
– M2 is tested on D2 (size=n2), found error rate = e2
– Assume D1 and D2 are independent – If n1 and n2 are sufficiently large, then
– Approximate:
( )( )222
111
,~,~σµσµ
NeNe
i
ii
i nee )1(ˆ −
=σ

Comparing Performance of 2 Models
• To test if performance difference is statistically significant: d = e1 – e2 – d ~ N(dt,σt) where dt is the true difference – Since D1 and D2 are independent, their variance adds up:
– At (1-α) confidence level,
2)21(2
1)11(1
ˆˆ 2
2
2
1
2
2
2
1
2
nee
nee
t
−+
−=
+≅+= σσσσσ
ttZdd σ
αˆ
2/±=

An Illustrative Example
• Given: M1: n1 = 30, e1 = 0.15 M2: n2 = 5000, e2 = 0.25
• d = |e2 – e1| = 0.1 (2-sided test)
• At 95% confidence level, Zα/2=1.96 => Interval contains 0 => difference may not be statistically significant
0043.05000
)25.01(25.030
)15.01(15.0ˆ =−
+−
=d
σ
128.0100.00043.096.1100.0 ±=×±=t
d

Comparing Performance of 2 Algorithms
Each learning algorithm may produce k models: – L1 may produce M11 , M12, …, M1k – L2 may produce M21 , M22, …, M2k
If models are generated on the same test sets D1,D2, …, Dk (e.g., via cross-validation)
– For each set: compute dj = e1j – e2j
– dj has mean dt and variance σt – Estimate:
tkt
k
j j
t
tddkk
dd
σ
σ
αˆ)1()(
ˆ
1,1
1
2
2
−−
=
±=−
−=
∑

ตารางสถตทจาเปน
• http://www.math.unb.ca/~knight/utility/t-table.htm
• http://www.watpon.com/table/