miR-23b-3p acts as a counter-response against skeletal ...
13
https://doi.org/10.1530/JOE-19-0425 https://joe.bioscientifica.com © 2020 Society for Endocrinology Printed in Great Britain Published by Bioscientifica Ltd. Journal of Endocrinology 244:3 535–547 T Okamura et al. miR-23b-3p and muscle atrophy RESEARCH miR-23b-3p acts as a counter-response against skeletal muscle atrophy Takuro Okamura 1 , Yoshitaka Hashimoto 1 , Takafumi Osaka 1,2 , Takafumi Senmaru 1 , Takuya Fukuda 1 , Masahide Hamaguchi 1 and Michiaki Fukui 1 1 Department of Endocrinology and Metabolism, Kyoto Prefectural University of Medicine, Graduate School of Medical Science, Kyoto, Japan 2 Department of Diabetology, Ayabe City Hospital, Ayabe, Japan Correspondence should be addressed to M Fukui: [email protected] Abstract To investigate the role of microRNA (miRNA) in muscle atrophy, we performed microarray analysis of miRNA expression in skeletal muscles of Sham, orchiectomized (ORX) mice, and ORX mice treated with androgen and identified that the expression of miR-23b-3p in ORX mice was significantly higher than that in Sham mice (P = 0.007); however, miR-23b-3p expression in ORX mice treated with androgen was lower (P = 0.001). We also investigated the mechanism by which overexpression or knockdown of miR-23b-3p influences the expression of myosin heavy chain, muscle protein synthesis, ATP activity, and glucose uptake in C2C12 myotube cells. Moreover, we examined the serum miR-23b-3p levels among male subjects with type 2 diabetes and whether the serum miR-23b-3p levels could be a biomarker for muscle atrophy. The overexpression of miR-23b-3p in C2C12 myotube cells significantly upregulated the expression of myosin heavy chain, protein synthesis, ATP activity, and glucose uptake. Reporter assays raised a possible direct post-transcriptional regulation involving miR-23b-3p and the 3′-UTR of PTEN mRNA. Among subjects with type 2 diabetes, serum miR-23b-3p levels in the subjects with decreased muscle mass were significantly higher compared to the levels in the subjects without. Our results indicate that miR-23b-3p downregulates the expression of PTEN in myotube cells and induces the growth of myosin heavy chain. In addition, the serum level of miR-23b-3p can be used as a diagnostic marker for muscle atrophy. Introduction MicroRNAs (miRNAs) are single-stranded non-coding RNAs that consist of 19–23 nucleotides. They function in the post-transcriptional regulation stage of target mRNAs. miRNA-mediated transcriptional repression is known to play an important role in a wide range of biological processes such as cell proliferation and differentiation, apoptosis, metabolism, and overall development. miRNAs bind with imperfect homology to their target mRNAs, which destabilize the target mRNA and inhibit protein synthesis (Esteller 2011). The dysregulation of miRNA expression in skeletal muscle and myocardium is associated with muscle disorders (Eisenberg et al. 2009, Esteller 2011). The degradation of muscle mass leads to motor function difficulties, falls, and effects daily life activities (Goodpaster et al. 2006, Delmonico et al. 2007). It has also been reported that muscle atrophy increases the risk of death (Cruz-Jentoft et al. 2010). The pathogenesis of skeletal muscle atrophy includes decreased regenerative ability of muscle satellite cells, a reduction of protein Key Words f microRNA f miR-23b-3p f muscle atrophy f PTEN Journal of Endocrinology (2020) 244, 535–547 Downloaded from Bioscientifica.com at 11/17/2021 04:21:27PM via free access
Transcript of miR-23b-3p acts as a counter-response against skeletal ...
https://doi.org/10.1530/JOE-19-0425https://joe.bioscientifica.com © 2020 Society for Endocrinology
Printed in Great BritainPublished by Bioscientifica Ltd.
Journal of Endocrinology
244:3 535–547T Okamura et al. miR-23b-3p and muscle atrophy
-19-0425
RESEARCH
miR-23b-3p acts as a counter-response against skeletal muscle atrophy
Takuro Okamura1, Yoshitaka Hashimoto1, Takafumi Osaka1,2, Takafumi Senmaru1, Takuya Fukuda1, Masahide Hamaguchi1 and Michiaki Fukui1
1Department of Endocrinology and Metabolism, Kyoto Prefectural University of Medicine, Graduate School of Medical Science, Kyoto, Japan2Department of Diabetology, Ayabe City Hospital, Ayabe, Japan
Correspondence should be addressed to M Fukui: [email protected]
Abstract
To investigate the role of microRNA (miRNA) in muscle atrophy, we performed microarray analysis of miRNA expression in skeletal muscles of Sham, orchiectomized (ORX) mice, and ORX mice treated with androgen and identified that the expression of miR-23b-3p in ORX mice was significantly higher than that in Sham mice (P = 0.007); however, miR-23b-3p expression in ORX mice treated with androgen was lower (P = 0.001). We also investigated the mechanism by which overexpression or knockdown of miR-23b-3p influences the expression of myosin heavy chain, muscle protein synthesis, ATP activity, and glucose uptake in C2C12 myotube cells. Moreover, we examined the serum miR-23b-3p levels among male subjects with type 2 diabetes and whether the serum miR-23b-3p levels could be a biomarker for muscle atrophy. The overexpression of miR-23b-3p in C2C12 myotube cells significantly upregulated the expression of myosin heavy chain, protein synthesis, ATP activity, and glucose uptake. Reporter assays raised a possible direct post-transcriptional regulation involving miR-23b-3p and the 3′-UTR of PTEN mRNA. Among subjects with type 2 diabetes, serum miR-23b-3p levels in the subjects with decreased muscle mass were significantly higher compared to the levels in the subjects without. Our results indicate that miR-23b-3p downregulates the expression of PTEN in myotube cells and induces the growth of myosin heavy chain. In addition, the serum level of miR-23b-3p can be used as a diagnostic marker for muscle atrophy.
Introduction
MicroRNAs (miRNAs) are single-stranded non-coding RNAs that consist of 19–23 nucleotides. They function in the post-transcriptional regulation stage of target mRNAs. miRNA-mediated transcriptional repression is known to play an important role in a wide range of biological processes such as cell proliferation and differentiation, apoptosis, metabolism, and overall development. miRNAs bind with imperfect homology to their target mRNAs, which destabilize the target mRNA and inhibit protein synthesis (Esteller 2011). The dysregulation of
miRNA expression in skeletal muscle and myocardium is associated with muscle disorders (Eisenberg et al. 2009, Esteller 2011).
The degradation of muscle mass leads to motor function difficulties, falls, and effects daily life activities (Goodpaster et al. 2006, Delmonico et al. 2007). It has also been reported that muscle atrophy increases the risk of death (Cruz-Jentoft et al. 2010). The pathogenesis of skeletal muscle atrophy includes decreased regenerative ability of muscle satellite cells, a reduction of protein
3
Key Words
f microRNA
f miR-23b-3p
f muscle atrophy
f PTEN
Journal of Endocrinology (2020) 244, 535–547
244
Downloaded from Bioscientifica.com at 11/17/2021 04:21:27PMvia free access
https://doi.org/10.1530/JOE-19-0425https://joe.bioscientifica.com © 2020 Society for Endocrinology
Published by Bioscientifica Ltd.Printed in Great Britain
536miR-23b-3p and muscle atrophyT Okamura et al. 244:3Journal of Endocrinology
synthesis, and the promotion of degradation in myotube cells (Le Grand & Rudnicki 2007). In recent years, it has become clear that a single miRNA can result in multiple gene expressions related to one pathogenesis. Dysfunction of miRNA expression is hypothesized to be the basis of the pathogenesis of skeletal muscle atrophy; however, even though the exact mechanism remains unclear, a reduction in androgen production plays a role in the development of skeletal muscle atrophy. Roy et al. reported that the serum androgen concentration is associated with skeletal muscle mass and muscle strength (Roy et al. 2002). In addition, Basualto-Alarcón et al. reported that androgen signals induce muscle hypertrophy through mTOR and the androgen receptor pathways (Basualto-Alarcón et al. 2013). However, androgen replacement therapy has been reported to have several adverse effects (Basualto-Alarcón et al. 2013). Therefore, new therapeutic options to prevent skeletal muscle atrophy caused by androgen deficiency are crucial.
In this study, we investigated the association between skeletal muscle atrophy and miRNA using orchiectomized (ORX) mouse model.
Materials and methods
Animals and experimental design
All experimental procedures were approved by the Committee for Animal Research, Kyoto Prefectural University of Medicine. Six-week-old C57BL/6 J male mice were purchased from Shimizu Laboratory Supplies (Kyoto, Japan) and housed in a specific pathogen-free controlled environment. The mice were fed a standard diet (SD; 344.9 kcal/100 g, fat kcal 4.6%; CLEA Japan, Tokyo) for 4 weeks starting at 8 weeks of age.
Mice were either orchiectomized (ORX group) or sham-operated (Sham group) at 7 weeks of age. For the androgen-treated group (ORX + A), 8-week-old ORX mice were treated with testosterone administered once every 2 days for 4 weeks, via s.c. injection of androgen enanthate (3.6 μg/g body weight; i.e. Yamagata, Japan) diluted in sesame oil (Senmaru et al. 2013). Moreover, 8-week-old ORX mice were treated with flutamide, which is the nonsteroidal androgen receptor antagonist, administered once every 2 days for 4 weeks, via s.c. injection (10 mg/body, Abcam) (Renier et al. 2014).
When the mice reached 12 weeks of age, we measured the grip strength of each mouse, using a Grip Strength Test (Bioseb, Pinellas Park, FL, USA). Mice were killed at
12 weeks of age by the administration of a combination anesthetic of 0.3 mg/kg of medetomidine, 4.0 mg/kg of midazolam, and 5.0 mg/kg of butorphanol (Kawai et al. 2011). The soleus muscle was obtained, and either fixed with 10% buffered formaldehyde for a histological examination or immediately frozen and kept at −80°C until use in QIAzol Lysis reagent (Qiagen) for miRNA and mRNA extraction. The weight of the soleus muscle and the cross-sectional area of soleus muscle of the Sham, ORX and ORX + A mice were recorded. Additionally, the weight of the plantaris muscle was recorded in order to investigate the responses to androgen treatment. We measured the anatomical cross-sectional area, which is the cross-sectional area of a muscle perpendicular to its longitudinal axis (Timson et al. 1985). All images were acquired using a BZ-X710 microscope (Keyence, Osaka, Japan), while the cross-sectional area was measured using BZ-X analyzer software. The soleus muscle was fixed in 10% formalin solution and embedded in paraffin. Muscle sections were prepared and stained with hematoxylin and eosin or with monoclonal primary antibodies MY32 against myosin heavy chain (MHC) (Sigma-Aldrich), 5.2F anti-myod 1 (Sigma-Aldrich) and F12B anti-myogenin (Sigma-Aldrich), followed by a Texas-red-conjugated anti-mouse secondary antibody (Jackson ImmunoResearch). Nuclei were stained with DAPI (Sigma-Aldrich). Images were captured with a fluorescence microscope BZ-X710 (Keyence, Osaka, Japan), and the fluorescence intensity of myotube cells and cell nuclei count per image were analyzed using ImageJ software.
Analytic procedures and glucose and insulin tolerance tests
The blood glucose levels of mice were measured using a glucometer (Gultest Neo Alpha; Sanwa Kagaku Kenkyusho, Nagoya, Japan). An intraperitoneal glucose tolerance test (iPGTT) (2 g/kg body weight) and an insulin tolerance test (ITT) (0.75 U/kg body weight) were carried out on the 12-week-old mice after 16 h and 7 h of fasting, respectively, while blood glucose was measured at both time points (Bahrami et al. 2010). The area under the curve (AUC) of the iPGTT and ITT results were respectively analyzed.
miRNA microarray analysis
The soleus muscles were obtained from the ORX group, ORX + A group, and Sham group and subjected to GeneChip miRNA 4.0 Arrays (cat. #902412, Applied Biosystems). Further, the relative abundance of the
Downloaded from Bioscientifica.com at 11/17/2021 04:21:27PMvia free access
https://doi.org/10.1530/JOE-19-0425https://joe.bioscientifica.com © 2020 Society for Endocrinology
Published by Bioscientifica Ltd.Printed in Great Britain
537
Research
T Okamura et al. miR-23b-3p and muscle atrophy 244:3Journal of Endocrinology
miRNAs within the groups was evaluated by the WAD method using R (Kadota et al. 2008) and by paired t-tests. The weighted average distance (WAD) method ranked the genes based on higher expression, higher weights, or fold change. WAD was found to be an effective type of transcriptome analysis. The data were preprocessed with Robust Multichip Average (RMA) normalization, and the global miRNA expression was visualized as a volcano plot. We performed an enrichment evaluation of skeletal muscle-specific miRNAs, and the t-statistics between the groups were compared. miR-1a-1, 1a-2, 1a-3, 1b, 133a-1, 133a-2, 133a-3, 133a-5, 133b, 133c, 206, 208a, 208b, 486, and 499 were selected as skeletal muscle-specific miRNA (McCarthy & Esser 2007, Callis et al. 2008, van Rooij et al. 2008, 2009, Small et al. 2010).
Gene expression in murine soleus muscle
The soleus muscles of fasting mice were resected and immediately frozen with liquid nitrogen. Each muscle was homogenized in ice-cold QIAzol Lysis reagent (Qiagen), and total RNA was isolated as described in the manufacturer’s instructions. Total RNA (0.5 μg) was reverse-transcribed using a High-Capacity cDNA RT Kit (Applied Biosystems) for first-strand cDNA synthesis, using an oligonucleotide dT primer and random hexamer priming according to the manufacturer’s recommendations. The RT reaction was performed for 120 min at 37°C, and the inactivation of RT was performed for 5 min at 85°C. We used a real-time RT-PCR (RT-PCR) to quantify the mRNA expression levels of PTEN, and trim63, fbxo32, and hdac4 which are involved in muscle atrophy (Castets et al. 2019). The RT-PCR was performed using TaqMan Fast Advanced Master Mix (Applied Biosystems) according to the manufacturer’s instructions. The following PCR conditions were used: 1 cycle of 2 min at 50°C and 20 s at 95°C, followed by 40 cycles of 1 s at 95°C, and 20 s at 60°C.
The relative expression level of each targeted gene was normalized to hprt threshold cycle (CT) value and quantified using the comparative threshold cycle 2−ΔΔCT method as previously described (Livak & Schmittgen 2001). Signals from Sham mice were assigned a relative value of 1.0. Six mice from each group were examined, and a RT-PCR was run in triplicate for each sample. Total miRNA in soleus muscle was extracted using a miRNeasy kit (Qiagen).
For the miRNA real-time experiments, we synthesized cDNA strand using a Taqman MicroRNA RT kit (Applied Biosystems) with 200 ng of total extracted miRNA. U6 was
used as an endogenous control. A RT-PCR was performed using TaqMan Fast Advanced Master Mix (Applied Biosystems) according to the manufacturer’s instructions. The following PCR conditions were used: 1 cycle of 2 min at 50°C and 20 s at 95°C, followed by 40 cycles of 1 s at 95°C, and 20 s at 60°C. We extracted quantified miR-23b-3p and U6 small nucleolar RNA (snoRNA) by the 2−ΔΔCT method. Signals from Sham mice were assigned a relative value of 1.0. Six mice from each group were examined, and an RT-PCR was run in triplicate for each sample.
Mouse skeletal muscle cell culture
Mouse myoblasts (the cell line C2C12, KAC Co., Ltd., Kyoto, Japan) were seeded on 24-well plates and grown in Dulbecco’s Modified Eagle Medium (DMEM) supplemented with 20% fetal bovine serum (FBS) (Day 2). The medium was changed every other day. When the cells reached 80% confluence, they were differentiated with DMEM supplemented with 2% horse serum (differentiation medium) (Day 0). At 24 h after a medium change, we transfected 30 nM of miR-23b-3p mimic/inhibitor and scrambled the sequence with an X-treme GENE siRNA transfection kit (Roche) according to the manufacturer’s recommendations (Day 1). At 96 h (Day 5), we evaluated the myotube cells by several experiments.
In addition, 100 nM of androgen, testosterone (T-1500, Sigma-Aidrich), was added into DMEM (Day 1), and the expression of miR-23b-3p was evaluated 96 h later (Day 5).
Gene expression in C2C12 myotube cells
Gene expression in C2C12 myotube cells was analyzed at Day 5. We removed the medium and washed the cells with cold PBS twice. Cells were detached using cell scrapers and homogenized them in ice-cold QIAzol Lysis reagent. The subsequent procedure was the same as that described in the ‘Gene expression in murine soleus muscle’ section.
Immunocytochemistry
We cultured C2C12 myotube cells in eight-well chamber slides and performed immunocytochemistry on Day 5. Myotube cells were fixed in 4% paraformaldehyde and incubated with primary monoclonal antibodies; MY32 against myosin heavy chain (Sigma-Aldrich), 5.2F Anti-MyoD1 (Sigma-Aldrich), and F12B anti-myogenin antibody (Sigma-Aldrich) diluted in PBS/1% BSA/0.3%
Downloaded from Bioscientifica.com at 11/17/2021 04:21:27PMvia free access

https://doi.org/10.1530/JOE-19-0425https://joe.bioscientifica.com © 2020 Society for Endocrinology
Published by Bioscientifica Ltd.Printed in Great Britain
538miR-23b-3p and muscle atrophyT Okamura et al. 244:3Journal of Endocrinology
Triton™ X-100 (Sigma-Aldrich) overnight at 4°C, and a Texas-red-conjugated anti-mouse secondary antibody (Jackson ImmunoResearch) diluted in PBS/1% BSA/0.3% Triton™ X-100 overnight at 4°C for 1 h. Nuclei were stained with DAPI (Sigma-Aldrich). Images were captured with the BZ-X710 fluorescence microscope, and the fluorescence intensity of myotube cells and the cell nuclei count per image were analyzed using ImageJ (NIH). In addition, the fusion index was defined and determined according to a previous study (Yamaguchi et al. 2010).
Luciferase reporter assay
The putative miR23-b-3p targets were predicted using TargetScan Human 6.2 (http://www.targetscan.org/). The putative recognition sites of miR23-b-3p in the PTEN3′-UTR (3′-UTR) and its sequences are shown in Supplementary Fig. 1 (see section on supplementary materials given at the end of this article). We used a commercially available Dual-Luciferase miRNA Target Expression vector containing the 3′-UTR of PTEN (cat. no. HmiT015535, Genecopoeia, Rockville, MD, USA), or pEZX-MT01 control vector, which lacked miR-23b-3p target sites (Genecopoeia) (Yoneyama et al. 2015). C2C12 myotube cells in 96-well plates were transfected with 30 nM scrambled sequence (NC), a combination of miR-23b-3p mimicking substrate (Applied Biosystems) and PTEN reporter vector or pEZX-MT01 control vector using an X-treme GENE siRNA transfection kit according to the manufacturer’s instructions. All transfection experiments were performed in triplicate. Luciferase activity was assayed at 48 h after transfection, using a dual-luciferase reporter assay system (Genecopoeia).
Protein extraction and Western blotting
Whole C2C12 myotube cell extracts were prepared in a radio immunoprecipitation assay buffer (RIPA, ATTO, Tokyo; 50 mmol/L Tris (pH 8.0), 150 mmol/L NaCl, 0.5% deoxycholate, 0.1% SDS and 1.0% NP-40) containing a protease inhibitor cocktail (BioVision, Milpitas, CA, USA). Protein assays were performed using a BSA protein assay kit (Pierce/Thermo Scientific) in accord with the manufacturer’s instructions. Total protein (40 mg) was electrophoresed in 12% SDS-PAGE gels, and Western blotting was carried out using standard protocols and proteins detected by ImageQuant LAS 500 (GE Healthcare). The protein expression levels were quantified by optical density using ImageJ. The fold change was calculated as the ratio between the optical density of
each sample transfected with miR-23b-3p mimicking substrate/inhibitor divided by gapdh and the negative control transfected samples divided by gapdh (miR-23b-3p transfected samples/gapdh)/(Neg Control miR transfected samples/gapdh).
C2C12 myotube cells were subjected to protein extractions. First, 40–60 μg of protein extraction were incubated with the following primary antibodies; p-Akt (1:1000), Akt (1:1000), p-mTOR(1:1000), mTOR (1:1000), p-4ebp1 (1:1000), 4ebp1 (1:1000), p-FOXO1 (1:1000), FOXO1 (1:1000), p-S6 (1:1000), S6 (1:1000), pgc1-α (1:1000) or gapdh (1:1500) diluted with EzBlock Chemi (ATTO, Osaka, Japan) overnight at 4°C, followed by incubation with goat anti-mouse IgG secondary antibodies conjugated to horseradish peroxidase diluted with EzBlock Chemi for 30 min at room temperature. All the antibodies listed in this section were obtained from Santa Cruz Biotechnology (Santa Cruz).
ATP activity
C2C12 myotube cells were cultured in 24-well plates, and on Day 5, we extracted the cellular ATP using an IntraCellular ATP assay kit (Toyo-b-net, Tokyo, Japan) according to the manufacturer’s instructions. The medium was removed and cells were washed twice with cold PBS and treated with, 400 μL/well, ATP extraction at room temperature for 5 min. We then dispensed every reagent into 96-well plates in triplicate and added 100 μL/well of luminescent reagent on ice. We quantitated the ATP activity with a luminescent measurement by using an Orion L microplate luminometer (Berthold Detection Systems, Pforzheim, Germany).
The myotube cells’ 2-deoxyglucose uptake
The uptake of [3H]2-deoxyglucose (PerkinElmer) was measured in C2C12 myotube cells cultured in 24-well plates. Cells were washed twice with serum-free DMEM and incubated in the serum-free DMEM for 2 h at 37°C, followed by two washes with PBS and add KRP buffer: 10 mM phosphate (pH 7.5), 113 mM NaCl, 5 mM KCl, 1.3 mM CaCl2, 1.2 mM MgSO4, and 1.2 mM KH2PO4 containing 0.3% BSA in the presence or absence of 10 mU/mL bovine insulin for 30 min at 37°C. The uptake of 10 µM [3H]2-deoxyglucose was then measured over a 5-min period. Reactions were terminated by rapidly washing the cells twice with ice-cold Krebs-Ringer bicarbonate buffer.
Downloaded from Bioscientifica.com at 11/17/2021 04:21:27PMvia free access
https://doi.org/10.1530/JOE-19-0425https://joe.bioscientifica.com © 2020 Society for Endocrinology
Published by Bioscientifica Ltd.Printed in Great Britain
539
Research
T Okamura et al. miR-23b-3p and muscle atrophy 244:3Journal of Endocrinology
Cells were then extracted by using 0.2% SDS, and the aliquots from the cell extracts were counted by liquid scintillation and used to determine the protein concentration. Nonspecific uptake was measured in the presence of 10 µM of cytochalasin-B, and the values were subtracted from those of the specific binding.
Study patients
The KAMOGAWA-DM cohort study is an ongoing prospective cohort study that began in 2014 (Sakai et al. 2018). For the present study, we collected patients’ information aged ≥65 years with type 2 diabetes, all of whom were Japanese, physically active, and KAMOGAWA-DM participants recruited from the outpatient clinics of the Kyoto Prefectural University of Medicine and Kameoka Municipal Hospital from August 2015 to September 2017. We excluded patients with diabetic nephropathy stage 3 or higher (Haneda et al. 2015) and those with inflammatory disease, malignancy, or endocrine disease (Cruz-Jentoft et al. 2010). We also excluded patients with class NYHA II–IV cardiac insufficiency (von Haehling et al. 2013) or severe chronic obstructive pulmonary disease (Abbatecola et al. 2014) because these conditions would influence the patients’ physical activity.
We determined decreased muscle mass by determining each patient’s skeletal muscle index (SMI) based on algorithms proposed by the Asian Working Group for Sarcopenia (Chen et al. 2014). The body composition of each patient was evaluated using a multifrequency impedance body composition analyzer (InBody 720, InBody Japan, Tokyo) (Hashimoto et al. 2016), which is well correlated with the dual-energy X-ray absorptiometry (Kim et al. 2015). We obtained each patient’s body weight (BW, kg), body fat mass (kg), skeletal muscle mass (kg), and appendicular muscle mass (kg) and then calculated the SMI (kg/m2) by dividing the appendicular muscle mass (kg) by the square of the patient’s height (m) (Kim et al. 2015). The BMI was defined as weight in kilograms divided by height in meters squared. The cut-off value of the SMI was set to <7.0 kg/m2 for the men. In this study, we selected a total of 42 male patients to form two groups of 21 patients with or without decreased muscle mass, with matching age. Approval for the study was obtained from the research ethics committees of the Kyoto Prefectural University of Medicine and Kameoka Municipal Hospital, and written informed consent for their data to be used was obtained from all patients.
Serum miRNA extraction
RNA was extracted from serum samples using miRNeasy Serum/Plasma Kits (Qiagen) according to the manufacturer’s instructions. Briefly, 250 μL of serum was thawed on ice and centrifuged at 12,000 g at 4°C for 10 min to remove cellular debris. Thereafter, 200 μL of supernatant was lysed in 1000 μL of QIAzol Lysis Reagent. After incubation for 5 min, 25 fmol of synthetic cel-miR-39 (Syn-cel-miR-39-3p miScript miRNA Mimic, Qiagen) was added to each sample as an external spiked-in control.
Total RNA including small RNA was extracted and eluted in 30 μL of RNase-free water using a QIAcube device (Qiagen). Serum levels of miR-23b-3p and cel-miR-39 were examined by real-time PCR. A fixed volume of 2 μL of total RNA was reverse transcribed using TaqMan MicroRNA RT Kits (cat. #4366597, Applied Biosystems) in a total volume of 15 μL with the following conditions: 16°C for 30 min, 42°C for 30 min, 85°C for 5 min and maintained at 4°C.
A real-time PCR was conducted using MicroRNA Assay Kits and ‘TaqMan Universal Master Mix II, no UNG’ (cat. #4440040, Applied Biosystems), performed in duplicate on the StepOne Plus system (Applied Biosystems) with the following cycling conditions: 95°C for 10 min, followed by 40 cycles of 95°C for 15 s and 60°C for 1 min. Cycle threshold (Ct) values were calculated using StepOne Software v2.3 (Applied Biosystems). Expression levels of miRNAs were normalized to those of cel-miR-39 and determined by the 2−ΔΔCt method.
Statistical analysis
We analyzed the data using JMP ver. 13.0 software (SAS). Student’s t-test was used to compare the different groups. P values of <0.05 were accepted as significant.
Results
Effects of androgen deficiency on body weight, muscle mass, and cross-sectional muscle area
Compared to the Sham mice, the ORX mice had significantly lower body weight (P = 0.038) and muscle mass values (P = 0.017), less muscle cross-sectional area (P < 0.001), and weaker grip strength (P = 0.007); they also showed significantly impaired glucose tolerance (P = 0.038) (Fig. 1A, B, C, D, E, F, G, H, I and J). In contrast, the ORX + A mice had significantly higher body weight (P = 0.032) and muscle mass values (P = 0.005), larger
Downloaded from Bioscientifica.com at 11/17/2021 04:21:27PMvia free access

https://doi.org/10.1530/JOE-19-0425https://joe.bioscientifica.com © 2020 Society for Endocrinology
Published by Bioscientifica Ltd.Printed in Great Britain
540miR-23b-3p and muscle atrophyT Okamura et al. 244:3Journal of Endocrinology
cross-sectional muscle area (P < 0.001), and improved glucose tolerance (P = 0.032) compared to the ORX mice. Similarly, the ratio of plantaris muscle weight in body weight in ORX mice was significantly lower than that in sham and ORX + A mice (sham: P = 0.007, ORX+A: P = 0.008) (Supplementary Fig. 2B). Additionally, the ratio of both soleus and plantaris muscle in body weight in mice treated with flutamide was significantly higher than that in Sham mice (Supplementary Fig. 2A and B). There was no significant difference in insulin resistance (P = 0.787) or grip strength (P = 0.389) between the ORX and ORX + A mice.
Expressions of myosin heavy chain, myod, and myogenin in soleus muscle tissue were upregulated by androgen treatment
Our immunochemical analysis of the mouse soleus muscle tissue revealed that the fluorescence intensity values of myod and myogenin in the ORX mice were significantly lower than the values in the sham mice (myod: P = 0.004, myogenin: P = 0.008). On the other hand, the ORX+A
mice were significantly higher than the values in the ORX mice (myosin heavy chain: P < 0.001, myod: P = 0.006, myogenin: P = 0.009) (Fig. 2A, B, C and D).
miRNA array analyses of murine soleus muscle
We next examined the changes in the miRNA expression and the miRNA expression profiles in murine soleus muscle of ORX mice by performing a microarray analysis comparing the Sham and ORX+A mice. The comparison revealed that known skeletal muscle-specific miRNA were significantly upregulated in the ORX+A group (Fig. 3A, B, C and D). Additionally, the top 20 miRNAs of the most varied in OCX mice compared to those in sham mice were demonstrated in Supplementary Fig. 2A. Our results also showed that the expression of miR-23b-3p was significantly elevated in androgen deficiency (P = 0.011) and reduced in androgen replacement (P = 0.001) (Fig. 3E). In plantaris muscle, the expression of miR-23b-3p was significantly elevated in androgen deficiency (P = 0.042) and reduced in androgen replacement compared to that in sham mice (P < 0.001) (Supplementary Fig. 2E).
Figure 1Skeletal muscle atrophy and impaired glucose tolerance in orchiectomized mice. (A) Seven-week-old mice were orchiectomized (ORX) or sham-operated (Sham). Androgen treatment started at 8 weeks of age (ORX + A). Body weight changes (n = 12) are shown. (B and D) When the mice reached 12 weeks of age, an iPGTT (2 g/kg body weight) was performed and the data’s AUC was analyzed (n = 12). (C and E) At 12 weeks of age, an ITT (0.75 U/kg body weight) was performed and the AUC was analyzed (n = 12). (F) Grip strength (mean ± s.e.m.; n = 12) was measured at 12 weeks of age. (G) Representative cross-sectional histology of soleus muscle. (H and I) The weight of the soleus muscle and the ratio of soleus to body weight (n = 12) are shown. (J) The cross-sectional area of soleus muscle (n = 12) was measured. Data are mean ± s.e.m.; *P < 0.05, **P < 0.01, ***P < 0.001 by one-way ANOVA.
Downloaded from Bioscientifica.com at 11/17/2021 04:21:27PMvia free access

https://doi.org/10.1530/JOE-19-0425https://joe.bioscientifica.com © 2020 Society for Endocrinology
Published by Bioscientifica Ltd.Printed in Great Britain
541
Research
T Okamura et al. miR-23b-3p and muscle atrophy 244:3Journal of Endocrinology
Figure 2Impaired myotube formation in orchiectomized mice. (A) The immune histochemistry of soleus muscle the Sham, ORX, and ORX + A. Red: Myosin heavy chain, myod or myogenin. Blue: DAPI. Scale bar, 50 µm. The fluorescence intensity of myosin heavy chain (B), myod (C), or myogenin (D) with arbitrary unit (a.u.) were compared. Data are mean ± s.e.m.; *P < 0.05, **P < 0.01, ***P < 0.001 by one-way ANOVA.
Figure 3The upregulated expression of miR-23b-3p in murine soleus muscle of ORX mice. (A and B) Global miRNA expression (3163 miRNAs) was visualized as a volcano plot. The top 100 genes according to the fold change (red circle) or p-value (blue circle) are shown. (C and D) The cumulative distribution function for the t-statistics between the mRNA expression profiles of the ORX and ORX + A groups or the ORX and sham groups (black line, total genes; red line, skeletal muscle-specific miRNAs) (n = 3 each). (E) The relative expression of miR-23b-3p in soleus muscle normalized to U6 (n = 6). (F) The relative expression of mRNAs of indicated genes in soleus muscle normalized to hprt (n = 6). Data are mean ± s.e.m.; *P < 0.05, **P < 0.01, ***P < 0.001 by one-way ANOVA.
Downloaded from Bioscientifica.com at 11/17/2021 04:21:27PMvia free access

https://doi.org/10.1530/JOE-19-0425https://joe.bioscientifica.com © 2020 Society for Endocrinology
Published by Bioscientifica Ltd.Printed in Great Britain
542miR-23b-3p and muscle atrophyT Okamura et al. 244:3Journal of Endocrinology
Additionally, the expression of miR-23b-3p in both soleus and plantaris muscle was elevated in androgen receptor antagonist compared to that in sham mice (soleus: P < 0.001, plantaris: P = 0.016) (Supplementary Fig. 2D and E).
Expressions of miR-23b-3p and pten, trim63, fbxo32, and hdac4 in murine soleus muscle
RT-PCR revealed that the expression of miR-23b-3p in murine soleus muscle was significantly higher in ORX mice than in the Sham mice (P = 0.012). Conversely, the expression of miR-23b-3p in ORX+A mice was significantly lower than that in the Sham mice (P < 0.001) (Fig. 3E). The expression of PTEN in the ORX mice was significantly lower than those in the Sham and ORX + A mice (P < 0.001), whereas the expressions of trim63, fbxo32 and hdac4, involved in muscle atrophy, in the ORX mice were each significantly higher than the respective
expression in the Sham and ORX + A mice (trim63: P = 0.007, fbxo32: P < 0.001, hdac4: P < 0.001) (Fig. 3D). In the plantaris muscle as well, the expression of pten in the ORX mice was significantly lower than that in the Sham and ORX + A mice (P < 0.001), whereas the expression of trim63, fbxo32 and hdac4 in the ORX mice were each significantly higher than the respective expression in the Sham mice (trim63: P = 0.008, fbxo32: P < 0.001, hdac4: P < 0.001) (Supplementary Fig. 2F).
Transfection of miR-23b-3p into C2C12 myotube cells
We confirmed that the expression of miR-23b-3p in C2C12 myotube cells was significantly increased by the transfection of the mimicking substrate, and that the expression was decreased by the transfection of an inhibitor (P < 0.001) (Fig. 4A). Moreover, with the addition of testosterone into the medium, the expression of miR-23b-3p in C2C12 myotube cells was significantly
Figure 4miR-23b-3p activates myotube formation in C2C12 cells via a repression of pten. (A) The expression level of miR-23b-3p in C2C12 myotube cells was assessed after the transfection of a miR-23b-3p mimic or an inhibitor (30 nM). (B) The expression level of miR-23b-3p in C2C12 myotube cells was assessed after testosterone treatment. (C) The immunohistochemistry of C2C12 myotube cells. Red: Myosin heavy chain, myod, or myogenin. Blue: DAPI. Scale bar, 50 µm. Fluorescence intensity of myosin heavy chain (D), myod (E), or myogenin (F) with arbitrary unit (a.u.) and the number of cells in an image (G) were compared. Fusion index of C2C12 myotube cells was expressed in (H). Data are mean ± s.e.m.; *P < 0.05, **P < 0.01, ***P < 0.001 by one-way ANOVA.
Downloaded from Bioscientifica.com at 11/17/2021 04:21:27PMvia free access
https://doi.org/10.1530/JOE-19-0425https://joe.bioscientifica.com © 2020 Society for Endocrinology
Published by Bioscientifica Ltd.Printed in Great Britain
543
Research
T Okamura et al. miR-23b-3p and muscle atrophy 244:3Journal of Endocrinology
suppressed compared to the expression in the negative controls (P < 0.001) (Fig. 4B).
Overexpression of miR-23b-3p upregulated the expression of myosin heavy chain, myod, and myogenin in C2C12 myotube cells
We performed immunostaining with monoclonal antibodies for myosin heavy chain, myod and myogenin diluted with PBS/1% BSA/0.3% Triton™ X-100. Myotube cells transfected with miR-23b-3p mimicking substrate induced growth, and the myotube cells transfected with miR-23b-3p inhibitor atrophied (Fig. 4C). In addition, the fluorescence intensity of myosin heavy chain and myogenin in the C2C12 myotube cells transfected with the miR-23b-3p mimic substrate was significantly higher than those transfected with the negative control (myosin heavy chain: P = 0.008, myod: P < 0.001, myogenin: P < 0.001) (Fig. 4D, E and F). Similarly, the fluorescence intensity of myosin heavy chain, myod, and myogenin in the C2C12 myotube cells transfected with the miR-23b-3p inhibitor were significantly lower than the negative control (myosin heavy chain: P = 0.009, myod: P < 0.001, myogenin: P < 0.001) (Fig. 4D, E and F). The number of cells per image of the cells transfected with the miR-23b-3p mimicking substrate was significantly larger than that of both the negative control (P < 0.034) and the inhibitor (P < 0.001) (Fig. 4G). In addition, fusion index
of the miR-23b-3p mimic substrate was also significantly larger than that of the negative control (P < 0.007) or the inhibitor (P < 0.001) (Fig. 4H).
PTEN is a possible target of miR-23b-3p
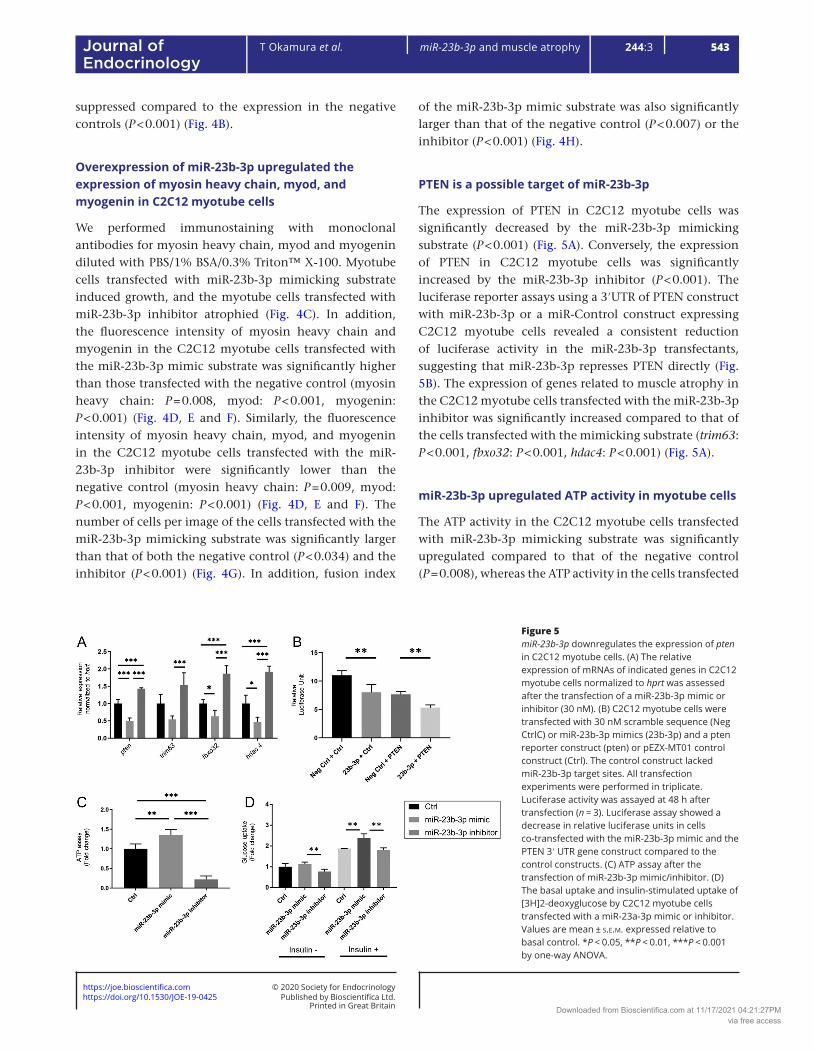
The expression of PTEN in C2C12 myotube cells was significantly decreased by the miR-23b-3p mimicking substrate (P < 0.001) (Fig. 5A). Conversely, the expression of PTEN in C2C12 myotube cells was significantly increased by the miR-23b-3p inhibitor (P < 0.001). The luciferase reporter assays using a 3′UTR of PTEN construct with miR-23b-3p or a miR-Control construct expressing C2C12 myotube cells revealed a consistent reduction of luciferase activity in the miR-23b-3p transfectants, suggesting that miR-23b-3p represses PTEN directly (Fig. 5B). The expression of genes related to muscle atrophy in the C2C12 myotube cells transfected with the miR-23b-3p inhibitor was significantly increased compared to that of the cells transfected with the mimicking substrate (trim63: P < 0.001, fbxo32: P < 0.001, hdac4: P < 0.001) (Fig. 5A).
miR-23b-3p upregulated ATP activity in myotube cells
The ATP activity in the C2C12 myotube cells transfected with miR-23b-3p mimicking substrate was significantly upregulated compared to that of the negative control (P = 0.008), whereas the ATP activity in the cells transfected
Figure 5miR-23b-3p downregulates the expression of pten in C2C12 myotube cells. (A) The relative expression of mRNAs of indicated genes in C2C12 myotube cells normalized to hprt was assessed after the transfection of a miR-23b-3p mimic or inhibitor (30 nM). (B) C2C12 myotube cells were transfected with 30 nM scramble sequence (Neg CtrlC) or miR-23b-3p mimics (23b-3p) and a pten reporter construct (pten) or pEZX-MT01 control construct (Ctrl). The control construct lacked miR-23b-3p target sites. All transfection experiments were performed in triplicate. Luciferase activity was assayed at 48 h after transfection (n = 3). Luciferase assay showed a decrease in relative luciferase units in cells co-transfected with the miR-23b-3p mimic and the PTEN 3′ UTR gene construct compared to the control constructs. (C) ATP assay after the transfection of miR-23b-3p mimic/inhibitor. (D) The basal uptake and insulin-stimulated uptake of [3H]2-deoxyglucose by C2C12 myotube cells transfected with a miR-23a-3p mimic or inhibitor. Values are mean ± s.e.m. expressed relative to basal control. *P < 0.05, **P < 0.01, ***P < 0.001 by one-way ANOVA.
Downloaded from Bioscientifica.com at 11/17/2021 04:21:27PMvia free access

https://doi.org/10.1530/JOE-19-0425https://joe.bioscientifica.com © 2020 Society for Endocrinology
Published by Bioscientifica Ltd.Printed in Great Britain
544miR-23b-3p and muscle atrophyT Okamura et al. 244:3Journal of Endocrinology
with the miR-23b-3p inhibitor was downregulated (P < 0.001) (Fig. 5C).
miR-23b-3p upregulated glucose uptake in myotube cells
The glucose uptake in the C2C12 myotube cells transfected with a miR-23b-3p mimicking substrate, after stimulation by insulin, was significantly increased compared to the uptake in the cells transfected with the negative control (P = 0.009) (Fig. 5D). Even before stimulation by insulin, the glucose uptake in the C2C12 myotube cells transfected with the miR-23b-3p mimicking substrate was significantly higher than that in the cells transfected with inhibitor (P = 0.006).
PI3K/Akt/mTOR signaling was modulated by miR-23b-3p in C2C12 myotube cells
We performed Western blotting to investigate the phosphorylation pattern of proteins in the PI3K/Akt/mTOR signaling pathway (Fig. 6A). We observed an increase in the optical density (OD) to gapdh of phosphorylated p-Akt,
p-mTOR, and p-S6 in the C2C12 myotube cells transfected with the miR-23b-3p mimicking substrate compared to the negative control. Conversely, the OD of p-FOXO1 in the C2C12 myotube cells transfected with the mimicking substrate was decreased compared to the negative control. In the myotube cells transfected with the miR-23b-3p inhibitor, those of p-Akt, p-mTOR and p-S6 significantly decreased, and those of p-4EBP-1, p-FOXO1 and PGC1-α significantly increased compared to the negative control (Fig. 6B, C, D, E, F and G).
Serum expression of miR-23b-3p in patients with muscle atrophy was significantly higher than that in patients without muscle atrophy
The characteristics of the 42 male patients with diabetes (with and without muscle atrophy) are summarized in Table 1. We investigated the differences in the expression of miR-23b-3p in serum between the two groups. The serum miR-23b-3p expression in the patients with muscle atrophy was significantly higher than that in the patients without muscle atrophy (P = 0.016) (Fig. 7A).
Figure 6miR-23b-3p activated akt-mtor signaling via the inhibition of pten expression. (A) Western blotting to detect the levels of phosho-akt, total akt, phospho-mtor, total mtor, phospho-4ebp1, total 4ebp1, phospho-foxo1, total foxo1, phospho-s6, total s6, pgc1-a, and gapdh in C2C12 myotube cells transfected with a miR-23b-3p mimic/inhibitor. C2C12 myotube cells were treated with insulin (100 nM) for 30 min. The relative optical density of p-akt (B), p-mtor (C), p-4ebp-1 (D), p-foxo-1 (E), p-s6 (F), and pgc1-a (G) to gapdh. Values are mean ± s.e.m. *P < 0.05, **P < 0.01, ***P < 0.001 by one-way ANOVA. OD, optical density.
Downloaded from Bioscientifica.com at 11/17/2021 04:21:27PMvia free access

https://doi.org/10.1530/JOE-19-0425https://joe.bioscientifica.com © 2020 Society for Endocrinology
Published by Bioscientifica Ltd.Printed in Great Britain
545
Research
T Okamura et al. miR-23b-3p and muscle atrophy 244:3Journal of Endocrinology
Discussion
Androgen deficiency has been known to be associated with not only muscle atrophy (Axell et al. 2006) but also insulin resistance, type 2 diabetes, metabolic syndrome, and visceral fat accumulation (Traish et al. 2009). In the present study, the ORX mice showed significantly impaired glucose tolerance and muscle atrophy compared to the Sham and ORX+A mice. The expression of mRNA related to muscle atrophy (i.e., trim63, fbxo32, and hdac4) was significantly increased. To the best of our knowledge, this is the first study to demonstrate that compared to Sham mice, the expression of miR-23b-3p is increased in soleus muscle of ORX mice and the corresponding expression in ORX + A mice is decreased as a counter-response against skeletal muscle atrophy.
We also demonstrated that the overexpression of miR-23b-3p in C2C12 myotube cells promoted protein synthesis via the inhibition of PTEN expression, and the activation of myosin heavy chain and myogenin.
Zaman et al. reported that miR-23b-3p inhibited a PTEN tumor suppressor (Zaman et al. 2012) that plays an important role in muscle protein degradation (Hu et al. 2007). Herein, the expression of PTEN in C2C12 myotube cells was downregulated by the overexpression of miR-23b-3p but upregulated by the suppression of miR-23b-3p in RT-PCR. Moreover, the results of our luciferase assay raised a possibility that miR-23b-3p directly targeted the PTEN 3′UTR region to modulate its expression, the same as in a previous study (Zaman et al. 2012).
In addition, in the PTEN -Akt-mTOR pathway, several proteins related to the promotion of protein synthesis (i.e., Akt, mTOR and S6) were activated and, contrarily, proteins related to the reduction of protein synthesis (FOXO1) was inactivated by the overexpression of miR-23b-3p. In addition, mTOR is also known to promote the differentiation of myotubes to myofibers (von Walden et al. 2016). We observed that the overexpression of miR-23b-3p in C2C12 myotube cells activated the PTEN -Akt-mTOR pathway, which promoted the expression of myosin heavy chain and myogenin protein.
The androgen signal of orchiectomized mice is attenuated, which is reported to be one of main caused of muscle atrophy (Basualto-Alarcón et al. 2013). Androgen is known to induce muscle hypertrophy through not only androgen receptor pathway but also through that of mTOR (Senmaru et al. 2013). We thus speculate that an increase in the expression of miR-23b-3p may prevent muscle atrophy, by suppressing PTEN and activating the mTOR pathway through an androgen receptor independent pathway. In fact, the expression of miR-23b-3p was significantly decreased by the addition of androgen to the medium.
Our results also demonstrated that miR-23b-3p changed the glucose uptake in C2C12 myotube cells. A previous study reported that PTEN plays a key role in glucose metabolism (Butler et al. 2002), which is derived from a phosphatase-independent role for PTEN during vesicular trafficking of the glucose transporter GLUT1 (Shinde & Maddika 2017). In this study, we found that the glucose uptake in the C2C12 myotube cells transfected with a miR-23b-3p mimicking substrate was significantly higher than that in the cells transfected with a miR-23b-3p inhibitor. This result indicates that overexpression of miR-23b-3p in skeletal muscle not only prevents muscle atrophy but also improves glucose metabolism.
Moreover, miR-23b-3p might affect mitochondrial function. Ji et al. demonstrated that inhibiting PTEN induced the elevation of ATP production (Ji et al. 2015). herein, the ATP production in the C2C12 myotube cells
Table 1 Characteristics of the study patients with and without muscle atrophy.
With muscle atrophy (n = 21)
Without muscle atrophy (n = 21) P value
Age, years 69.6 (6.6) 69.6 (6.2) 0.981SMI, kg/m2 5.7 (0.73) 7.74 (0.94) <0.001miR-23b-3p 2.13 (1.34) 1.24 (0.92) 0.016
Data are mean (s.d.).SMI, skeletal muscle mass index.
Rim fo noisserpxe evitale
R-2
3b-3
pot dezila
mronm
iR-3
9
Non-sarcopenia
Sarcopenia
0
2
4
6
✱
Figure 7The serum circulating miR-23b-3p in the patients with muscle atrophy was significantly increased compared to the patients without muscle atrophy. The relative expression of serum circulating miR-23b-3p normalized to miR-39 in the patients with and without muscle atrophy is shown. Data are mean ± s.e.m. *P < 0.05, **P < 0.01, ***P < 0.001 by Pearson’s chi-square test.
Downloaded from Bioscientifica.com at 11/17/2021 04:21:27PMvia free access

https://doi.org/10.1530/JOE-19-0425https://joe.bioscientifica.com © 2020 Society for Endocrinology
Published by Bioscientifica Ltd.Printed in Great Britain
546miR-23b-3p and muscle atrophyT Okamura et al. 244:3Journal of Endocrinology
transfected with a miR-23b-3p mimicking substrate was significantly higher than that in the cells transfected with the inhibitor. Increased ATP production in skeletal muscle is known to be important in muscular endurance (Wibom et al. 1992) and skeletal muscle of patients with type 2 diabetes was reported to have a reduced capacity to increase ATP production with high insulin levels (Stump et al. 2003). In light of these past findings and our present results, it appears that increased ATP production in skeletal muscle by overexpression of miR-23b-3p may improve physical activity.
Finally, we performed an investigation on human subjects. The serum miR-23b-3p levels in patients with muscle atrophy were significantly higher than the levels in the patients without muscle atrophy. This suggests that serum miR-23b-3p levels can be used as a diagnostic marker. We speculate that the patients’ serum miR-23b-3p levels rose in order to reduce the atrophy of skeletal muscle caused by deficiency in androgen. However, it is difficult to derive causal relationships from this cross-sectional analysis. Therefore, in the future study, we would like to perform the longitudinal analyses.
In conclusion, our findings indicate that the Akt-mTOR pathway activated by the overexpression of miR-23b-3p in skeletal muscle may induce several beneficial effects, such as increased developments of myosin heavy chain, myod, and myogenin and increased glucose uptake and ATP activity, and act as a counter-response against skeletal muscle atrophy, thus improving exercise tolerance and glucose metabolism in patients with muscle atrophy. Moreover, the serum miR-23b-3p level could be useful as a diagnostic marker for muscle atrophy.
Supplementary materialsThis is linked to the online version of the paper at https://doi.org/10.1530/JOE-19-0425.
Declaration of interestY Hashimoto received grants from Asahi Kasei Corporation outside the submitted work. M Fukui received grants from AstraZeneca plc, Astellas Pharma Inc., Nippon Boehringer Ingelheim Co., Ltd., Daiichi Sankyo Co., Ltd., Eli Lilly Japan K.K., Kyowa Hakko Kirin Co. Ltd., Kissei Pharmaceutical Co., Ltd., MSD K.K., Mitsubishi Tanabe Pharma Corp., Novo Nordisk Pharma Ltd., Sanwa Kagaku Kenkyusho Co., Ltd., Sanofi K.K., Ono Pharmaceutical Co., Ltd, and Takeda Pharmaceutical Co., Ltd., outside the submitted work. The sponsors were not involved in the study design; in the collection, analysis, interpretation of data; in the writing of this manuscript; or in the decision to submit the article for publication. The authors, their immediate families, and any research foundations with which they are affiliated have not received any financial payments or other benefits from any commercial entity related to the subject of this article. The authors declare that although they are affiliated with a department that is supported financially by pharmaceutical company, the authors received no current funding for
this study, and this does not alter their adherence to all the journal policies on sharing data and materials. The other authors have nothing to disclose.
FundingThis work was supported by KAKENHI, Grant-in-Aid for Scientific Research (C) (15K09441).
AcknowledgmentsThe authors thank all of the staff members of the Kyoto Prefectural University of Medicine. They would like to thank Editage (www.editage.com) for English language editing.
ReferenceAbbatecola AM, Fumagalli A, Spazzafumo L, Betti V, Misuraca C,
Corsonello A, Cherubini A, Guffanti EE & Lattanzio F 2014 Body composition markers in older persons with COPD. Age and Ageing 43 548–553. (https://doi.org/10.1093/ageing/aft196)
Axell AM, MacLean HE, Plant DR, Harcourt LJ, Davis JA, Jimenez M, Handelsman DJ, Lynch GS & Zajac JD 2006 Continuous testosterone administration prevents skeletal muscle atrophy and enhances resistance to fatigue in orchidectomized male mice. American Journal of Physiology: Endocrinology and Metabolism 291 E506–E516. (https://doi.org/10.1152/ajpendo.00058.2006)
Bahrami J, Longuet C, Baggio LL, Li K & Drucker DJ 2010 Glucagon-like peptide-2 receptor modulates islet adaptation to metabolic stress in the ob/ob mouse. Gastroenterology 139 857–868. (https://doi.org/10.1053/j.gastro.2010.05.006)
Basualto-Alarcón C, Jorquera G, Altamirano F, Jaimovich E & Estrada M 2013 Testosterone signals through mTOR and androgen receptor to induce muscle hypertrophy. Medicine and Science in Sports and Exercise 45 1712–1720. (https://doi.org/10.1249/MSS.0b013e31828cf5f3)
Butler M, McKay RA, Popoff IJ, Gaarde WA, Witchell D, Murray SF, Dean NM, Bhanot S & Monia BP 2002 Specific inhibition of PTEN expression reverses hyperglycemia in diabetic mice. Diabetes 51 1028–1034. (https://doi.org/10.2337/diabetes.51.4.1028)
Callis TE, Deng Z, Chen JF & Wang DZ 2008 Muscling through the microRNA world. Experimental Biology and Medicine 233 131–138. (https://doi.org/10.3181/0709-MR-237)
Castets P, Rion N, Théodore M, Falcetta D, Lin S, Reischl M, Wild F, Guérard L, Eickhorst C, Brockhoff M, et al. 2019 mTORC1 and PKB/Akt control the muscle response to denervation by regulating autophagy and HDAC4. Nature Communications 10 3187. (https://doi.org/10.1038/s41467-019-11227-4)
Chen LK, Liu LK, Woo J, Assantachai P, Auyeung TW, Bahyah KS, Chou MY, Chen LY, Hsu PS, Krairit O, et al. 2014 Sarcopenia in Asia: consensus report of the Asian Working Group for Sarcopenia. Journal of the American Medical Directors Association 15 95–101. (https://doi.org/10.1016/j.jamda.2013.11.025)
Cruz-Jentoft AJ, Baeyens JP, Bauer JM, Boirie Y, Cederholm T, Landi F, Martin FC, Michel JP, Rolland Y, Schneider SM, et al. 2010 Sarcopenia: European consensus on definition and diagnosis: report of the European Working Group on Sarcopenia in Older People. Age and Ageing 39 412–423. (https://doi.org/10.1093/ageing/afq034)
Delmonico MJ, Harris TB, Lee JS, Visser M, Nevitt M, Kritchevsky SB, Tylavsky FA, Newman AB & Health, Aging and Body Composition Study 2007 Alternative definitions of sarcopenia, lower extremity performance, and functional impairment with aging in older men and women. Journal of the American Geriatrics Society 55 769–774. (https://doi.org/10.1111/j.1532-5415.2007.01140.x)
Downloaded from Bioscientifica.com at 11/17/2021 04:21:27PMvia free access

https://doi.org/10.1530/JOE-19-0425https://joe.bioscientifica.com © 2020 Society for Endocrinology
Published by Bioscientifica Ltd.Printed in Great Britain
547
Research
T Okamura et al. miR-23b-3p and muscle atrophy 244:3Journal of Endocrinology
Eisenberg I, Alexander MS & Kunkel LM 2009 miRNAS in normal and diseased skeletal muscle. Journal of Cellular and Molecular Medicine 13 2–11. (https://doi.org/10.1111/j.1582-4934.2008.00524.x)
Esteller M 2011 Non-coding RNAs in human disease. Nature Reviews: Genetics 12 861–874. (https://doi.org/10.1038/nrg3074)
Goodpaster BH, Park SW, Harris TB, Kritchevsky SB, Nevitt M, Schwartz AV, Simonsick EM, Tylavsky FA, Visser M & Newman AB 2006 The loss of skeletal muscle strength, mass, and quality in older adults: the health, aging and body composition study. Journals of Gerontology: Series A, Biological Sciences and Medical Sciences 61 1059–1064. (https://doi.org/10.1093/gerona/61.10.1059)
Haneda M, Utsunomiya K, Koya D, Babazono T, Moriya T, Makino H, Kimura K, Suzuki Y, Wada T, Ogawa S, et al. 2015 A new classification of diabetic nephropathy 2014: a report from Joint Committee on Diabetic Nephropathy. Journal of Diabetes Investigation 6 242–246. (https://doi.org/10.1111/jdi.12319)
Hashimoto Y, Osaka T, Fukuda T, Tanaka M, Yamazaki M & Fukui M 2016 The relationship between hepatic steatosis and skeletal muscle mass index in men with type 2 diabetes. Endocrine Journal 63 877–884. (https://doi.org/10.1507/endocrj.EJ16-0124)
Hu Z, Lee IH, Wang X, Sheng H, Zhang L, Du J & Mitch WE 2007 PTEN expression contributes to the regulation of muscle protein degradation in diabetes. Diabetes 56 2449–2456. (https://doi.org/10.2337/db06-1731)
Ji J, Qin Y, Ren J, Lu C, Wang R, Dai X, Zhou R, Huang Z, Xu M, Chen M, et al. 2015 Mitochondria-related miR-141-3p contributes to mitochondrial dysfunction in HFD-induced obesity by inhibiting PTEN. Scientific Reports 5 16262. (https://doi.org/10.1038/srep16262)
Kadota K, Nakai Y & Shimizu K 2008 A weighted average difference method for detecting differentially expressed genes from microarray data. Algorithms for Molecular Biology 3 8. (https://doi.org/10.1186/1748-7188-3-8)
Kawai S, Takagi Y, Kaneko S & Kurosawa T 2011 Effect of three types of mixed anesthetic agents alternate to ketamine in mice. Experimental Animals 60 481–487. (https://doi.org/10.1538/expanim.60.481)
Kim M, Shinkai S, Murayama H & Mori S 2015 Comparison of segmental multifrequency bioelectrical impedance analysis with dual-energy X-ray absorptiometry for the assessment of body composition in a community-dwelling older population. Geriatrics and Gerontology International 15 1013–1022. (https://doi.org/10.1111/ggi.12384)
Le Grand F & Rudnicki MA 2007 Skeletal muscle satellite cells and adult myogenesis. Current Opinion in Cell Biology 19 628–633. (https://doi.org/10.1016/j.ceb.2007.09.012)
Livak KJ & Schmittgen TD 2001 Analysis of relative gene expression data using real-time quantitative PCR and the 2(-delta delta C(T)) method. Methods 25 402–408. (https://doi.org/10.1006/meth.2001.1262)
McCarthy JJ & Esser KA 2007 MicroRNA-1 and microRNA-133a expression are decreased during skeletal muscle hypertrophy. Journal of Applied Physiology 102 306–313. (https://doi.org/10.1152/japplphysiol.00932.2006)
Renier KJ, Troxell-Smith SM, Johansen JA, Katsuno M, Adachi H, Sobue G, Chua JP, Sun Kim H, Lieberman AP, Breedlove SM, et al. 2014 Antiandrogen flutamide protects male mice from androgen-dependent toxicity in three models of spinal bulbar muscular atrophy. Endocrinology 155 2624–2634. (https://doi.org/10.1210/en.2013-1756)
Roy TA, Blackman MR, Harman SM, Tobin JD, Schrager M & Metter EJ 2002 Interrelationships of serum testosterone and free testosterone index with FFM and strength in aging men. American Journal of Physiology: Endocrinology and Metabolism 283 E284–E294. (https://doi.org/10.1152/ajpendo.00334.2001)
Sakai R, Hashimoto Y, Ushigome E, Miki A, Okamura T, Matsugasumi M, Fukuda T, Majima S, Matsumoto S, Senmaru T, et al. 2018 Late-night-
dinner is associated with poor glycemic control in people with type 2 diabetes: the KAMOGAWA-DM cohort study. Endocrine Journal 65 395–402. (https://doi.org/10.1507/endocrj.EJ17-0414)
Senmaru T, Fukui M, Okada H, Mineoka Y, Yamazaki M, Tsujikawa M, Hasegawa G, Kitawaki J, Obayashi H & Nakamura N 2013 Testosterone deficiency induces markedly decreased serum triglycerides, increased small dense LDL, and hepatic steatosis mediated by dysregulation of lipid assembly and secretion in mice fed a high-fat diet. Metabolism: Clinical and Experimental 62 851–860. (https://doi.org/10.1016/j.metabol.2012.12.007)
Shinde SR & Maddika S 2017 PTEN regulates glucose transporter recycling by impairing SNX27 retromer assembly. Cell Reports 21 1655–1666. (https://doi.org/10.1016/j.celrep.2017.10.053)
Small EM, O’Rourke JR, Moresi V, Sutherland LB, McAnally J, Gerard RD, Richardson JA & Olson EN 2010 Regulation of PI3-kinase/Akt signaling by muscle-enriched microRNA-486. PNAS 107 4218–4223. (https://doi.org/10.1073/pnas.1000300107)
Stump CS, Short KR, Bigelow ML, Schimke JM & Nair KS 2003 Effect of insulin on human skeletal muscle mitochondrial ATP production, protein synthesis, and mRNA transcripts. PNAS 100 7996–8001. (https://doi.org/10.1073/pnas.1332551100)
Timson BF, Bowlin BK, Dudenhoeffer GA & George JB 1985 Fiber number, area, and composition of mouse soleus muscle following enlargement. Journal of Applied Physiology 58 619–624. (https://doi.org/10.1152/jappl.1985.58.2.619)
Traish AM, Saad F & Guay A 2009 The dark side of testosterone deficiency: II. Type 2 diabetes and insulin resistance. Journal of Andrology 30 23–32. (https://doi.org/10.2164/jandrol.108.005751)
van Rooij E, Liu N & Olson EN 2008 MicroRNAs flex their muscles. Trends in Genetics 24 159–166. (https://doi.org/10.1016/j.tig.2008.01.007)
van Rooij E, Quiat D, Johnson BA, Sutherland LB, Qi X, Richardson JA, Kelm Jr RJ & Olson EN 2009 A family of microRNAs encoded by myosin genes governs myosin expression and muscle performance. Developmental Cell 17 662–673. (https://doi.org/10.1016/j.devcel.2009.10.013)
von Haehling S, Steinbeck L, Doehner W, Springer J & Anker SD 2013 Muscle wasting in heart failure: an overview. International Journal of Biochemistry and Cell Biology 45 2257–2265. (https://doi.org/10.1016/j.biocel.2013.04.025)
von Walden F, Liu C, Aurigemma N & Nader GA 2016 MTOR signaling regulates myotube hypertrophy by modulating protein synthesis, rDNA transcription, and chromatin remodeling. American Journal of Physiology: Cell Physiology 311 C663–C672. (https://doi.org/10.1152/ajpcell.00144.2016)
Wibom R, Hultman E, Johansson M, Matherei K, Constantin-Teodosiu D & Schantz PG 1992 Adaptation of mitochondrial ATP production in human skeletal muscle to endurance training and detraining. Journal of Applied Physiology 73 2004–2010. (https://doi.org/10.1152/jappl.1992.73.5.2004)
Yamaguchi T, Suzuki T, Arai H, Tanabe S & Atomi Y 2010 Continuous mild heat stress induces differentiation of mammalian myoblasts, shifting fiber type from fast to slow. American Journal of Physiology: Cell Physiology 298 C140–C148. (https://doi.org/10.1152/ajpcell.00050.2009)
Yoneyama K, Ishibashi O, Kawase R, Kurose K & Takeshita T 2015 miR-200a, miR-200b and miR-429 are onco-miRs that target the PTEN gene in endometrioid endometrial carcinoma. Anticancer Research 35 1401–1410.
Zaman MS, Thamminana S, Shahryari V, Chiyomaru T, Deng G, Saini S, Majid S, Fukuhara S, Chang I, Arora S, et al. 2012 Inhibition of PTEN gene expression by oncogenic miR-23b-3p in renal cancer. PLoS ONE 7 e50203. (https://doi.org/10.1371/journal.pone.0050203)
Received in final form 7 January 2020Accepted 16 January 2020Accepted Manuscript published online 20 January 2020
Downloaded from Bioscientifica.com at 11/17/2021 04:21:27PMvia free access