
Mikko Kaarakainen SPARE PART OPTIMIZATION FOR W32 FUEL ...
44
Mikko Kaarakainen SPARE PART OPTIMIZATION FOR W32 FUEL INJECTION EQUIPMENT Wärtsilä Technical Service W32 Department School of Technology 2015
Transcript of Mikko Kaarakainen SPARE PART OPTIMIZATION FOR W32 FUEL ...
Mikko Kaarakainen
SPARE PART OPTIMIZATION FOR W32
FUEL INJECTION EQUIPMENT
Wärtsilä Technical Service W32 Department
School of Technology
2015
VAASAN AMMATTIKORKEAKOULU
Kone –ja tuotantotekniikan koulutusohjelma
TIIVISTELMÄ
Tekijä Mikko Kaarakainen
Opinnäytetyön nimi Varaosa optimointi W32 moottorin ruiskutuslaitteistolle
Vuosi 2015
Kieli Englanti
Sivumäärä 62 + 2 liitettä
Ohjaaja Lotta Saarikoski
Wärtsilä 32 moottorin ruiskutuslaitteistoa on kehitetty vuosien varrella todella
paljon. Kehityksestä on seurannut suuri määrä erilaisia ruiskutuspumppu, - sekä
venttiili malleja. Tämän työn tarkoituksena on selvittää onko näiden
vanhentuneiden mallejen varaosia mahdollista poistaa käytöstä ja näin optimoida
varaosa kantaa.
Tässä työssä käytettiin tutkimustietona Wärtsilän SAP-järjestelmää, teknisen
huollon sisäistä dokumentaatiota sekä kollegoiden tietotaitoa. Työ alkoi
tietokannan seulonnalla. Tämän jälkeen paneuduttiin ruiskutuslaitteiston
kehitykseen ja muutoksiin, jonka perusteella korvausketjut tarkastettiin ja
päivitettiin. Tietojen keruun jälkeen laskettiin vanhojen varaosien vuotuiset
varastointikustannukset, sekä ruiskutuslaitteiston huoltokustannuksia vertailtiin
päivityskustannuksiin. Viimeisenä etsittiin piraattiosien valmistajia/jakelioita
internetistä.
Työn tuloksena kehitettiin kolme varaosaoptimointisuunnitelmaa
ruiskutuspumpuille, kaksi varaosaoptimointisuunnitelmaa ruiskutusventtiileille,
luotiin kaksi uutta korvausketjua, sekä päivitettiin sisäistä dokumentaatiota
ruiskutuslaitteistosta.
Osa työstä on Wärtsilän toiveesta julistettu salaiseksi.
Avainsanat ruiskutuslaitteisto, ruiskutuspumppu, ruiskutusventtiili,
varaosaoptimointi
VAASAN AMMATTIKORKEAKOULU
UNIVERSITY OF APPLIED SCIENCES
Kone –ja tuotantotekniikan koulutusohjelma
ABSTRACT
Author Mikko Kaarakainen
Title Spare Part Optimization for W32 Fuel Injection Equipment
Year 2015
Language English
Pages 62 + 2 Appendices
Name of Supervisor Lotta Saarikoski
This thesis was made for the Wärtsilä Technical Services W32 department. The
rapid development of injection pumps and injection valves has resulted in numer-
ous models; therefore lots of different spare parts are needed. The purpose of this
thesis was to find a way to optimize spare parts for W32 conventional injection
equipment.
Information for this thesis was gathered from SAP, internal documentation and
from coworkers. The work of this thesis was started by screening the database.
After that the design and development of injection equipment were studied. Based
on the design and development research, replacement chains were updated. Based
on the previous work, service cost calculations were done by comparing overhaul-
ing costs and by calculating inventory costs for old spare parts. Finally, the search
of the non-OEM part sellers on the Internet was done.
As a result, three different optimization plans for injection pumps and two for in-
jection valves were developed, two new replacement chains were created and in-
ternal documentation was updated.
Part of this thesis is declared secret.
Keywords Injection Pump, Injection Valve, Spare Part optimization
4
CONTENTS
TIIVISTELMÄ
ABSTRACT
1 INTRODUCTION .......................................................................................... 11
1.1 Purpose .................................................................................................... 11
1.2 Frame and Structure ................................................................................ 11
2 WÄRTSILÄ ................................................................................................... 12
2.1 Wärtsilä in General ................................................................................. 12
2.2 Services ................................................................................................... 13
2.3 Technical Service .................................................................................... 13
3 FUEL SYSTEM ............................................................................................. 14
3.1 Wärtsilä 32 Engine .................................................................................. 14
3.2 W32 Fuel System .................................................................................... 14
3.3 Injection Pump ....................................................................................... 16
3.3.1 Injection Pump in General .......................................................... 16
3.3.2 Multihousing ............................................................................... 17
3.3.3 Pump Element ............................................................................. 18
3.3.4 Pump Cover ................................................................................. 19
3.3.5 Fuel Rack and Stop Cylinder ...................................................... 20
3.3.6 Pump Spring ................................................................................ 21
3.4 Injection Valve ........................................................................................ 22
4 OBSOLESCENCE MANAGEMENT ........................................................... 23
4.1 Obsolescence in General ......................................................................... 23
4.2 Obsolescence Management ..................................................................... 24
4.2.1 Proactive Obsolescence Management ......................................... 24
4.2.2 Reactive Obsolescence Management .......................................... 25
4.3 Obsolescence Types ................................................................................ 25
5 INVENTORY COSTS ................................................................................... 27
5.1 Holding Cost ........................................................................................... 27
5.2 Ordering Cost .......................................................................................... 28
5.3 Stock-out Cost ......................................................................................... 28
5.4 Inventory Types ...................................................................................... 28
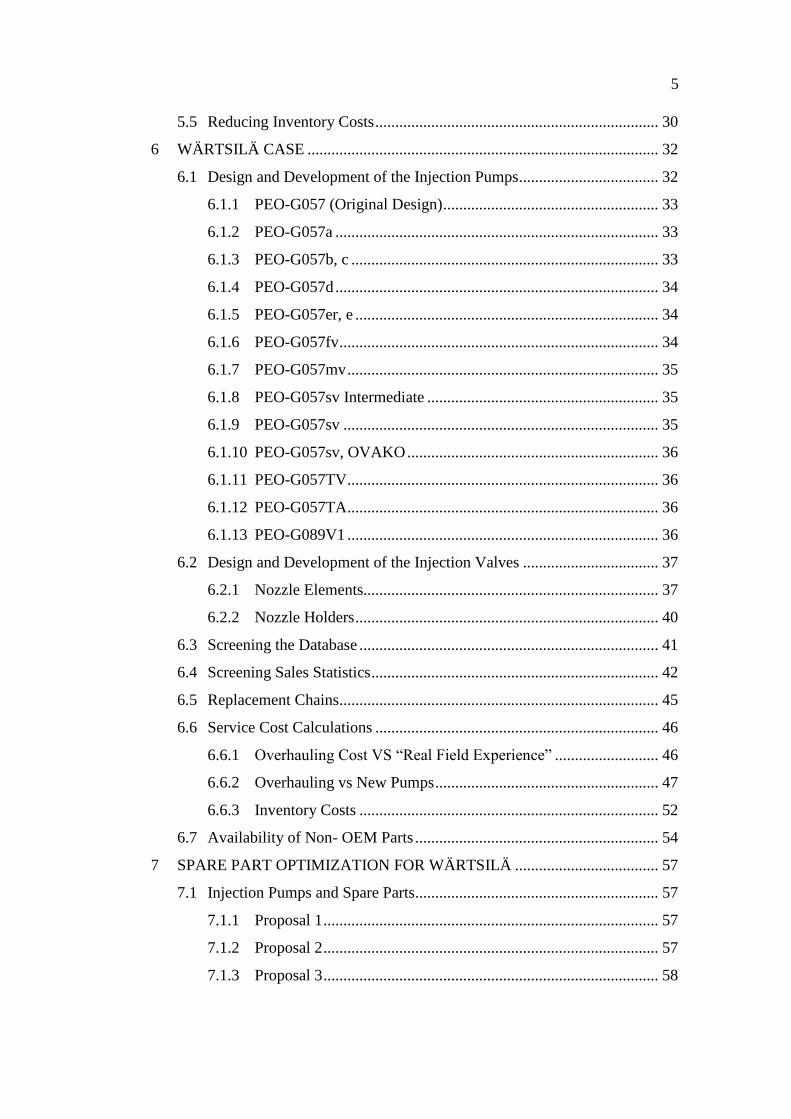
5
5.5 Reducing Inventory Costs ....................................................................... 30
6 WÄRTSILÄ CASE ........................................................................................ 32
6.1 Design and Development of the Injection Pumps ................................... 32
6.1.1 PEO-G057 (Original Design) ...................................................... 33
6.1.2 PEO-G057a ................................................................................. 33
6.1.3 PEO-G057b, c ............................................................................. 33
6.1.4 PEO-G057d ................................................................................. 34
6.1.5 PEO-G057er, e ............................................................................ 34
6.1.6 PEO-G057fv ................................................................................ 34
6.1.7 PEO-G057mv .............................................................................. 35
6.1.8 PEO-G057sv Intermediate .......................................................... 35
6.1.9 PEO-G057sv ............................................................................... 35
6.1.10 PEO-G057sv, OVAKO ............................................................... 36
6.1.11 PEO-G057TV .............................................................................. 36
6.1.12 PEO-G057TA .............................................................................. 36
6.1.13 PEO-G089V1 .............................................................................. 36
6.2 Design and Development of the Injection Valves .................................. 37
6.2.1 Nozzle Elements.......................................................................... 37
6.2.2 Nozzle Holders ............................................................................ 40
6.3 Screening the Database ........................................................................... 41
6.4 Screening Sales Statistics ........................................................................ 42
6.5 Replacement Chains................................................................................ 45
6.6 Service Cost Calculations ....................................................................... 46
6.6.1 Overhauling Cost VS “Real Field Experience” .......................... 46
6.6.2 Overhauling vs New Pumps ........................................................ 47
6.6.3 Inventory Costs ........................................................................... 52
6.7 Availability of Non- OEM Parts ............................................................. 54
7 SPARE PART OPTIMIZATION FOR WÄRTSILÄ .................................... 57
7.1 Injection Pumps and Spare Parts............................................................. 57
7.1.1 Proposal 1 .................................................................................... 57
7.1.2 Proposal 2 .................................................................................... 57
7.1.3 Proposal 3 .................................................................................... 58
6
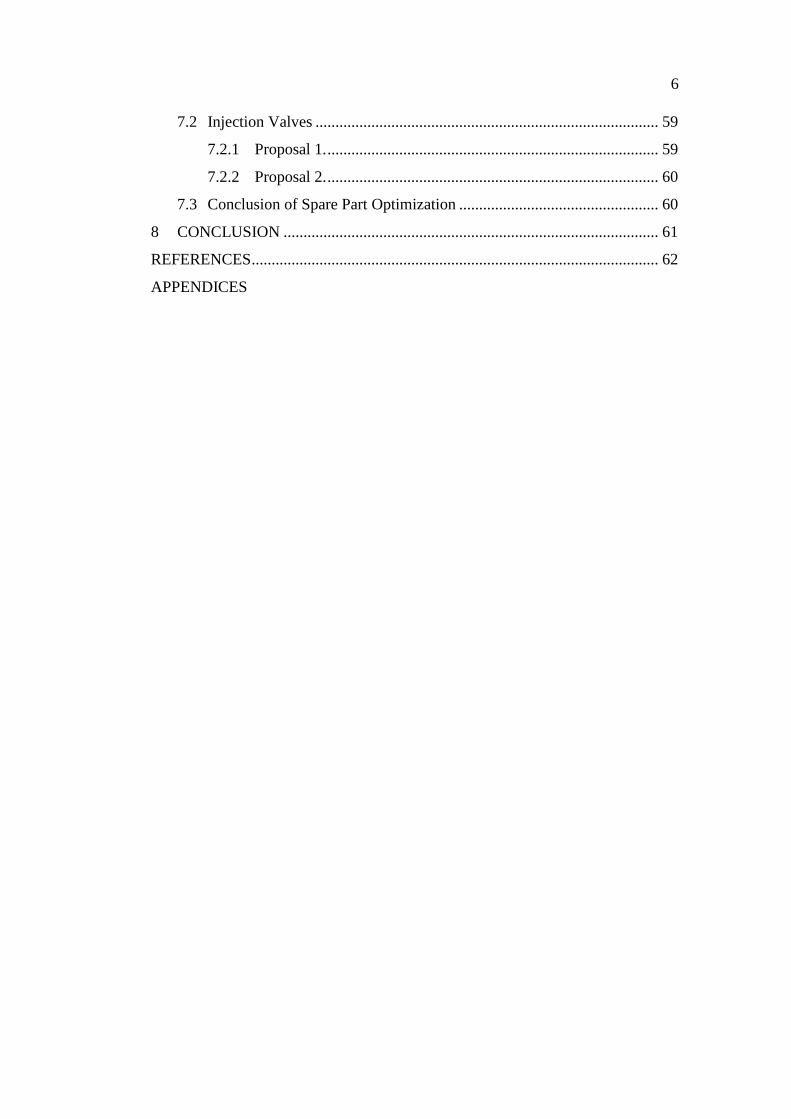
7.2 Injection Valves ...................................................................................... 59
7.2.1 Proposal 1. ................................................................................... 59
7.2.2 Proposal 2. ................................................................................... 60
7.3 Conclusion of Spare Part Optimization .................................................. 60
8 CONCLUSION .............................................................................................. 61
REFERENCES ...................................................................................................... 62
APPENDICES
7
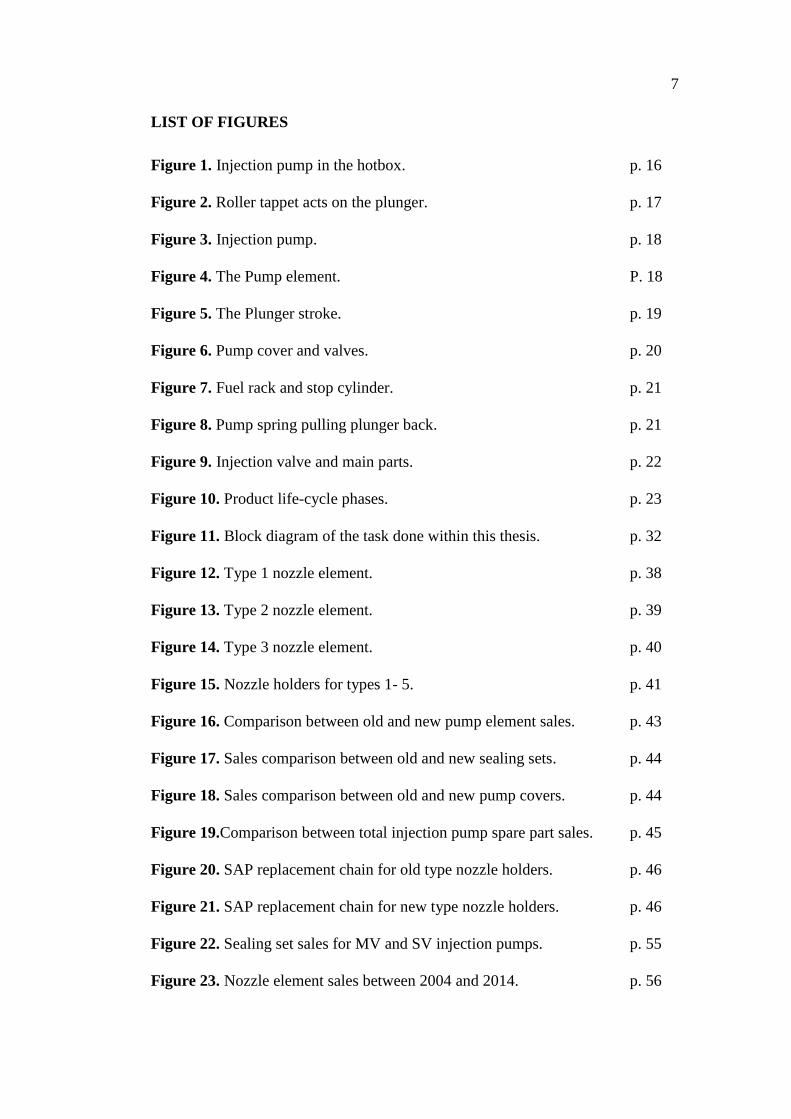
LIST OF FIGURES
Figure 1. Injection pump in the hotbox. p. 16
Figure 2. Roller tappet acts on the plunger. p. 17
Figure 3. Injection pump. p. 18
Figure 4. The Pump element. P. 18
Figure 5. The Plunger stroke. p. 19
Figure 6. Pump cover and valves. p. 20
Figure 7. Fuel rack and stop cylinder. p. 21
Figure 8. Pump spring pulling plunger back. p. 21
Figure 9. Injection valve and main parts. p. 22
Figure 10. Product life-cycle phases. p. 23
Figure 11. Block diagram of the task done within this thesis. p. 32
Figure 12. Type 1 nozzle element. p. 38
Figure 13. Type 2 nozzle element. p. 39
Figure 14. Type 3 nozzle element. p. 40
Figure 15. Nozzle holders for types 1- 5. p. 41
Figure 16. Comparison between old and new pump element sales. p. 43
Figure 17. Sales comparison between old and new sealing sets. p. 44
Figure 18. Sales comparison between old and new pump covers. p. 44
Figure 19.Comparison between total injection pump spare part sales. p. 45
Figure 20. SAP replacement chain for old type nozzle holders. p. 46
Figure 21. SAP replacement chain for new type nozzle holders. p. 46
Figure 22. Sealing set sales for MV and SV injection pumps. p. 55
Figure 23. Nozzle element sales between 2004 and 2014. p. 56

8
LIST OF TABLES
Table 1. Technical data of W32 engine D version. p. 14
Table 2. Main pressures and temperatures for HFO and LFO. p. 15
Table 3. Conventional injection pumps models. p. 33
Table 4. Pump spring differences from mv to sv. p. 36
Table 5. All conventional injection valves those are used in the field. p. 37
Table 6. Old type nozzles element specifications. p. 38
Table 7. Intermediate nozzle element specifications. p. 38
Table 8. New nozzle element specifications. p. 39
Table 9. Nozzle holder models. p. 40
Table 10. All W32 injection pumps active according to Wärtsilä’s system. p. 42
Table 11. All injection valves active according to Wärtsilä’s system. p. 42
Table 12. Injection pump FV overhaul vs new pump SV OVAKO. p. 48
Table 13. Injection pump SV overhaul vs new pump SV OVAKO. p. 49
Table 14. Injection pump SV overhaul vs new pump SV OVAKO… p. 50
Table 15. Injection pump SV overhaul vs new pump SV OVAKO… p. 51
Table 16. Annual inventory costs calculated with formula (5). p. 53
Table 17. Annual inventory costs calculated with formula (3). p. 53
Table 18. Possible savings made when committed capital is taken into… p. 53
Table 19. Possible savings made when committed capital is taken into… p. 54
Table 20. Major external spare part suppliers for Wärtsilä engines. p. 54
Table 21. Quantity of original design pumps on the field. p. 57
Table 22. All engines that still use original, b, c and d injection pumps p. 58
Table 23. Total quantity of engines to be upgraded. p. 58
9
Table 24. Injection valves to be upgraded to VUO-A202. p. 59
Table 25. Injection valves to be upgraded to VUO-A201. p. 59
10
LIST OF ABBREVATIONS
Rpm = Rounds per minute
IMO Tier II = emission standard II
cST = kinematic viscosity
SFOC = specific fuel oil consumption
HFO = heavy fuel oil
LFO = light fuel oil
W32 = Wärtsilä engine type 32
W32GD = Wärtsilä gas diesel engine type 32
W32E = Wärtsilä 32 engine E type (latest design)
MD valve = main delivery valve
CP valve = constant pressure valve
EPN = extended part number
EOL = end of life notice
QTY = quantity
OEM = original equipment manufacturer
Pcs = pieces
Pc = piece
11
1 INTRODUCTION
1.1 Purpose
This thesis was done for and under supervision of Wärtsilä Technical Services,
W32 department. The rapid development of injection pumps and injection valves
has resulted in numerous models; therefore lots of different spare parts are needed.
The purpose of this thesis was to find a way to optimize spare parts for W32 con-
ventional injection equipment.
This thesis is important for Wärtsilä Technical Services because this subject has
not been looked into that deep and there is no accurate knowledge about the real
situation in the field. Neither is there accurate knowledge about spare parts sales
or need for old injection equipment.
The outcome of this thesis is: a plan according to which spare parts can and
should be phased out, an update for replacement chains if necessary, a bulletin
proposal if necessary, an analysis of pump overhaul costs and finally updated in-
ternal TS documentation.
1.2 Frame and Structure
This thesis is limited to include only conventional injection equipment, priority in
injection pumps. The frame, instructions and outcome for this thesis have been
defined and specified by Wärtsilä. The deadline for this thesis is set to be at the
end of April.
The structure of this thesis is as follows: In the second chapter the company is
briefly introduced. The third chapter introduces the W32 engine, its fuel system,
main components and their functions. Chapters 4 and 5 are theoretical chapters
about obsolescence and inventory costs. Chapters 6 and 7 explain the research,
results and proposals for spare part optimization. Chapter 8 is the summary for the
thesis.
12
2 WÄRTSILÄ
2.1 Wärtsilä in General
Wärtsilä is a Finnish engineering industrial company that was established in 1834.
It started as a small sawmill but grew over the years to a huge global company.
Along the road it has also worked in shipbuilding, paper, machine, lock, ceramic
and glass industry. Nowadays Wärtsilä is a world leading company in ship power
and power plant business.
Wärtsilä is divided in three core business areas: Ship Power, Power Plants and
Services. Ship Power (marine) provides engines and generating sets, reduction
gears, propulsion equipment, control systems and sealing solutions for all types of
vessels and offshore applications. Wärtsilä Power Plants offers power plants for
base load, peaking and industrial self-generation purposes as well as for the oil
and gas industry. Services support the client’s installations through their whole
life cycle. /1/
Wärtsilä key figures in 2013 (2012):
Net sales EUR 4,654 million (4,725)
Operating result EUR 552 million (515)
Order intake EUR 4,872 million (4,940)
Order book 31 Dec 2013 EUR 4,426 million (4,492)
Personnel 18,663 (18,887)
13
2.2 Services
Wärtsilä Services main purpose is to maintain the customer’s installations running
all the time. It offers service, maintenance and training for Power Plants and Ship
Power. Services offer also reconditioning of old products and parts. The Services
cover nearly 40% of annual net sales.
“In parallel with its main service operations Wärtsilä has launched innovative new
services that support its customers’ business operations, such as service for multi-
ple engine brands in key ports, predictive and condition based maintenance, and
training/1/”.
2.3 Technical Service
Technical Services experts provide technical support for internal and external cus-
tomers. Technical service is divided into departments/groups according to the en-
gine models and types e.g. W20, W32, W34, W46 and W50. Product groups pro-
vide detailed product know-how regarding technical properties, performance, de-
sign and design development.
Technical service is responsible for field tests related to product developments,
initiator and maker of service bulletins, support network technical service and re-
gional sales on the technical side and it participates in sales promotion work and
as lecturers in product related international seminars. /2/
14
3 FUEL SYSTEM
3.1 Wärtsilä 32 Engine
The predecessor of the Wärtsilä 32 engine was the Vasa 32 engine, which made a
long and rewarding career. The production of the W32 engine started in Vaasa in
1995. W32 is used in ships as a main engine or as a back-up engine. It is also used
in power plants as an engine-generator set.
W32 is a four stroke medium speed engine 720-750 rpm. Its name comes from the
piston diameter which is 320 mm; stroke is 400 mm and displacement 32,2
L/cylinder (Table 1.). W32 is available in a line engine with 6, 7, 8 and 9 cylin-
ders and in a V engine with 12, 16, 18 and 20 cylinders. /3/
Table 1. Technical data of W32 engine D version /3/.
3.2 W32 Fuel System
The W32 fuel system is divided into two parts: internal and external fuel system.
The internal fuel system comprises the following equipment: fuel feed pipes, fuel
line, fuel injection pumps, shielded injection pipes, injection valves and optional
pressure control valves. The external fuel system is mostly auxiliary systems and
is not part of this thesis.
The fuel injection equipment and the system piping are located in a hotbox,
providing the maximum reliability and safety when using preheated heavy fuels.
There is one fuel injection pump per cylinder with shielded high-pressure pipe to
15
the injector. The injection pumps, which are of the flow-through type, ensure good
performance with all types of fuel. The pumps are completely sealed off from the
camshaft compartment. The fuel feed pipes are mounted directly to the injection
pumps, using a specially designed connecting piece. The return pipe is integrated
in the tappet housing.
The W32 fuel system has a regulating mechanism for increasing or decreasing the
fuel feed quantity according to the engine load and speed. The pumps are gov-
erned by the governor. The governor adjusts the pumps with a control sleeve,
which is attached to the fuel rack.
The W32 engine is designed for continuous operation on HFO as well as LFO. A
preheated engine can be started directly on HFO provided that the external fuel
system has the correct temperature and pressure. The engine can also be stopped
on HFO but the external system has to stay in operation i.e. fuel must be circulat-
ed through the stopped engine continuously for heating purposes (Table 2.). /5/
Table 2. Main pressures and temperatures for HFO and LFO. /5/
*) LFO min. (An extra external cooler might be necessary to avoid too low viscos-
ity on LFO installations).
1 Additionally a min. fuel temperature has to be always at least 10 °C above the
pour point, cloud and cold filter plugging point of the fuel and the injection vis-
cosity is allowed to be max. 24 cSt.
2 If the LFO is circulated through an external booster the fuel outlet pressure will
be the same as for HFO /5/.
HFO LFO
Pressure before injection pumps, nominal [ kPa ] (FO press, engine inlet, PT101) 700 ± 50 700 ± 50
Viscosity at engine inlet at running conditions [ cSt ] 16 - 24 2 *
Quantity of clean leak fuel (100% load) [% of SFOC] ~ 0.4 ~ 2
Fuel flow / consumption ratio (100%) load, min. 5 : 1 5 : 1
Filtration, Cold side [?m], absolute 34 34
Filtration, Hot side [?m], absolute 34 -
Fuel oil temperature before injection pumps, max. [ºC] (FO temp, engine inlet, TE101) 140 45
Fuel oil temperature before injection pumps, min. [ºC] (FO temp, engine inlet, TE101) 5¹ 5¹
FO press, engine outlet, PT102 [ kPa ] 400 ± 100 100 ± 100²
16
3.3 Injection Pump
The structure and functions of the injection pump are discussed next.
3.3.1 Injection Pump in General
Injection pumps are the soul of the fuel system. Its main task is to pressurize and
transport the fuel into the fuel injector on the cylinder head. Conventional W32
engines are equipped with one injection pump per cylinder. Injection pumps are
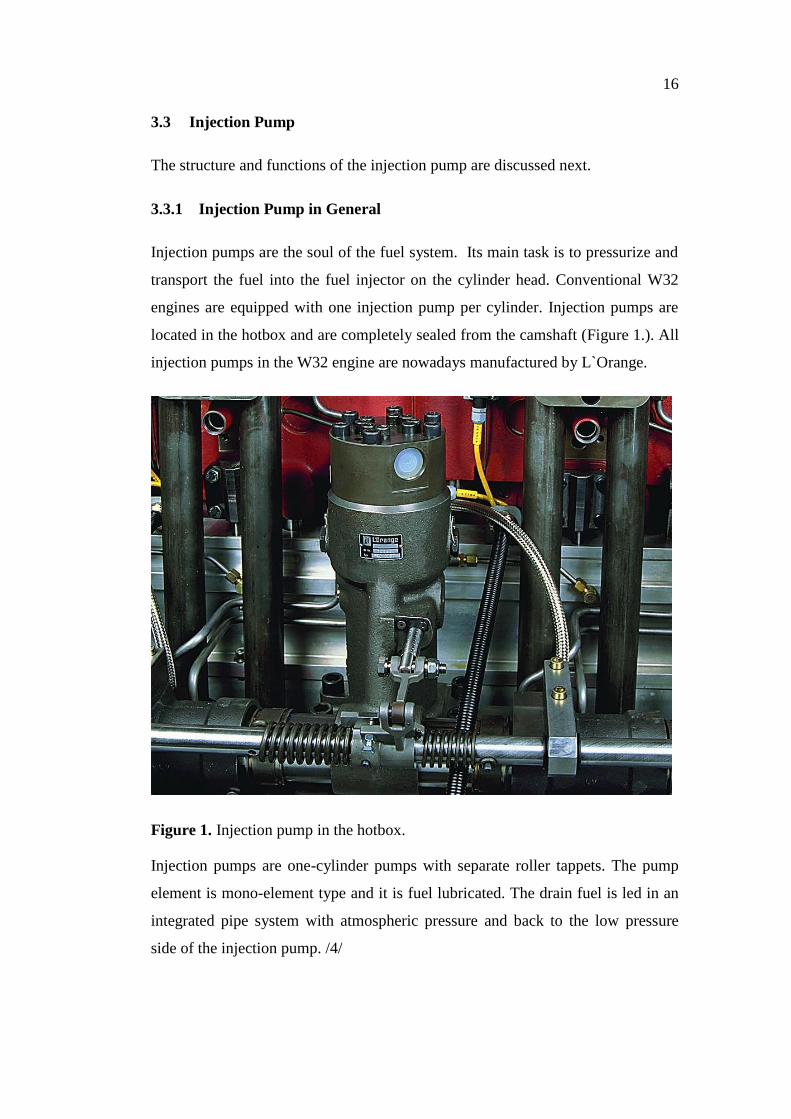
located in the hotbox and are completely sealed from the camshaft (Figure 1.). All
injection pumps in the W32 engine are nowadays manufactured by L`Orange.
Figure 1. Injection pump in the hotbox.
Injection pumps are one-cylinder pumps with separate roller tappets. The pump
element is mono-element type and it is fuel lubricated. The drain fuel is led in an
integrated pipe system with atmospheric pressure and back to the low pressure
side of the injection pump. /4/
17
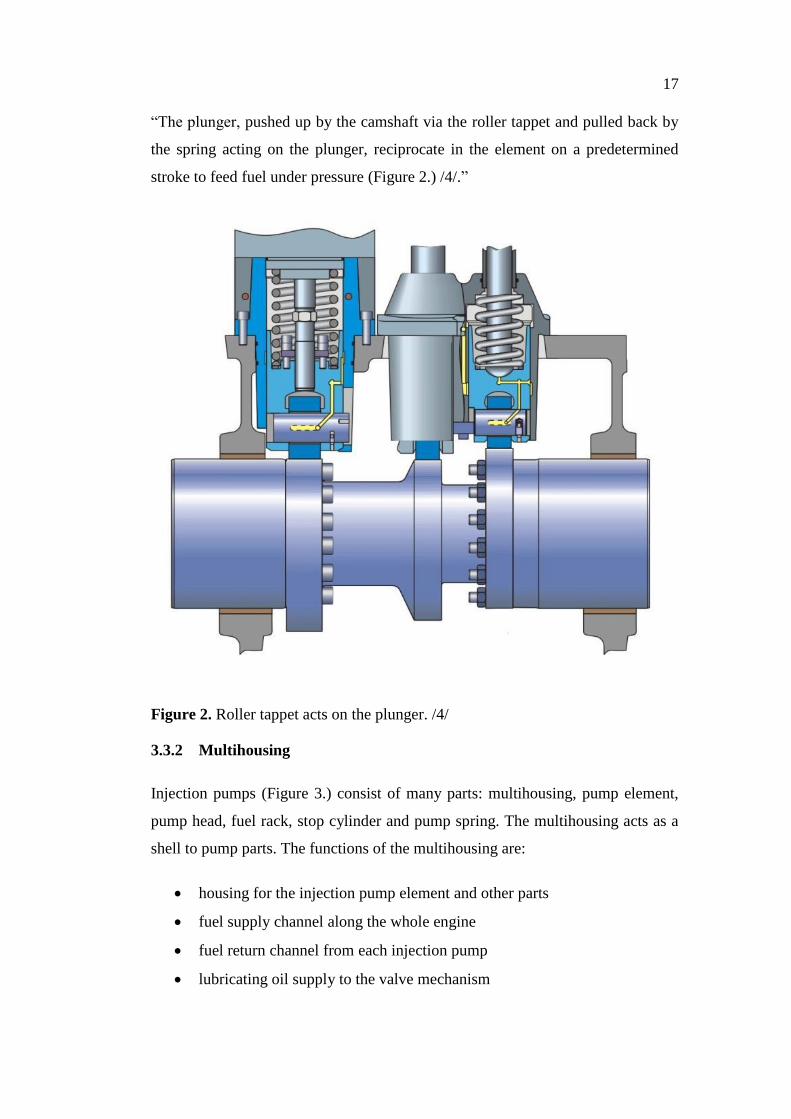
“The plunger, pushed up by the camshaft via the roller tappet and pulled back by
the spring acting on the plunger, reciprocate in the element on a predetermined
stroke to feed fuel under pressure (Figure 2.) /4/.”
Figure 2. Roller tappet acts on the plunger. /4/
3.3.2 Multihousing
Injection pumps (Figure 3.) consist of many parts: multihousing, pump element,
pump head, fuel rack, stop cylinder and pump spring. The multihousing acts as a
shell to pump parts. The functions of the multihousing are:
housing for the injection pump element and other parts
fuel supply channel along the whole engine
fuel return channel from each injection pump
lubricating oil supply to the valve mechanism
18
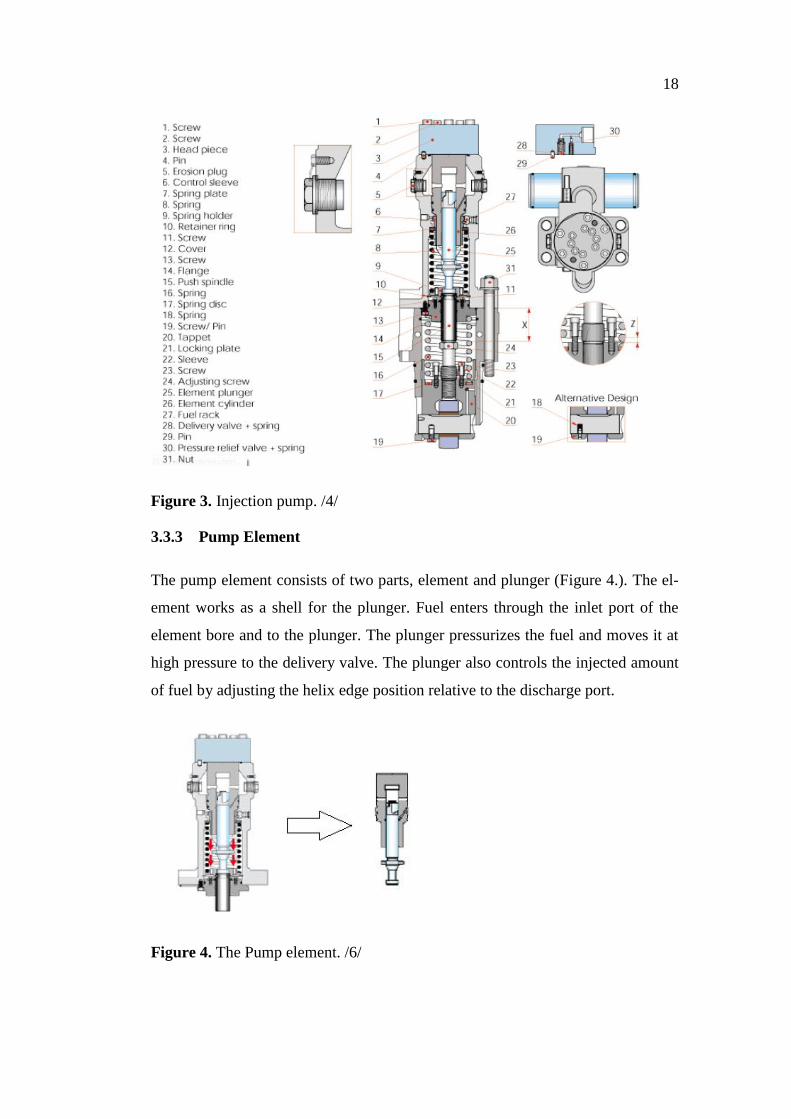
Figure 3. Injection pump. /4/
3.3.3 Pump Element
The pump element consists of two parts, element and plunger (Figure 4.). The el-
ement works as a shell for the plunger. Fuel enters through the inlet port of the
element bore and to the plunger. The plunger pressurizes the fuel and moves it at
high pressure to the delivery valve. The plunger also controls the injected amount
of fuel by adjusting the helix edge position relative to the discharge port.
Figure 4. The Pump element. /6/
19
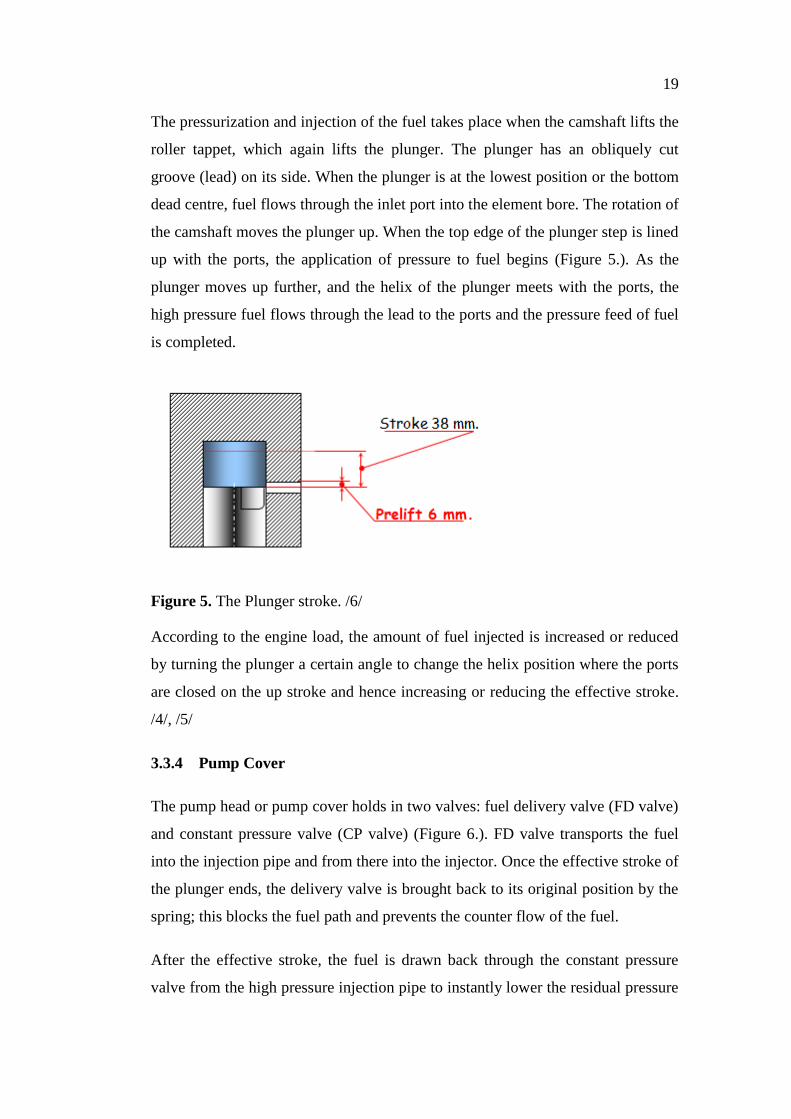
The pressurization and injection of the fuel takes place when the camshaft lifts the
roller tappet, which again lifts the plunger. The plunger has an obliquely cut
groove (lead) on its side. When the plunger is at the lowest position or the bottom
dead centre, fuel flows through the inlet port into the element bore. The rotation of
the camshaft moves the plunger up. When the top edge of the plunger step is lined
up with the ports, the application of pressure to fuel begins (Figure 5.). As the
plunger moves up further, and the helix of the plunger meets with the ports, the
high pressure fuel flows through the lead to the ports and the pressure feed of fuel
is completed.
Figure 5. The Plunger stroke. /6/
According to the engine load, the amount of fuel injected is increased or reduced
by turning the plunger a certain angle to change the helix position where the ports
are closed on the up stroke and hence increasing or reducing the effective stroke.
/4/, /5/
3.3.4 Pump Cover
The pump head or pump cover holds in two valves: fuel delivery valve (FD valve)
and constant pressure valve (CP valve) (Figure 6.). FD valve transports the fuel
into the injection pipe and from there into the injector. Once the effective stroke of
the plunger ends, the delivery valve is brought back to its original position by the
spring; this blocks the fuel path and prevents the counter flow of the fuel.
After the effective stroke, the fuel is drawn back through the constant pressure
valve from the high pressure injection pipe to instantly lower the residual pressure

20
between the delivery valve and the nozzle. This termination maintains a consistent
injection "shot to shot" by maintaining a constant pressure in the pipe line be-
tween injections. /4/
Figure 6. Pump cover and valves.
3.3.5 Fuel Rack and Stop Cylinder
Other important parts of the injection pump are fuel rack and overspeed trip de-
vice. Setting the fuel rack to zero position stops the fuel injection. The fuel rack is
connected to the regulating mechanism of the governor. If the fuel rack is moved,
the control sleeve in mesh with the rack is turned. Since the control sleeve acts on
the plunger, the plunger turns with the control sleeve, thus the effective stroke
changes and the injected fuel amount increases or decreases.
For emergencies the fuel rack of each injection pump is fitted with a stop cylinder
(Figure 7.). The pneumatic overspeed trip device is mounted on the multihousing
and acts directly on the fuel rack. If the overspeed trip device is activated, pressur-
ized air acts on a piston in a cylinder attached to the multihousing. The piston
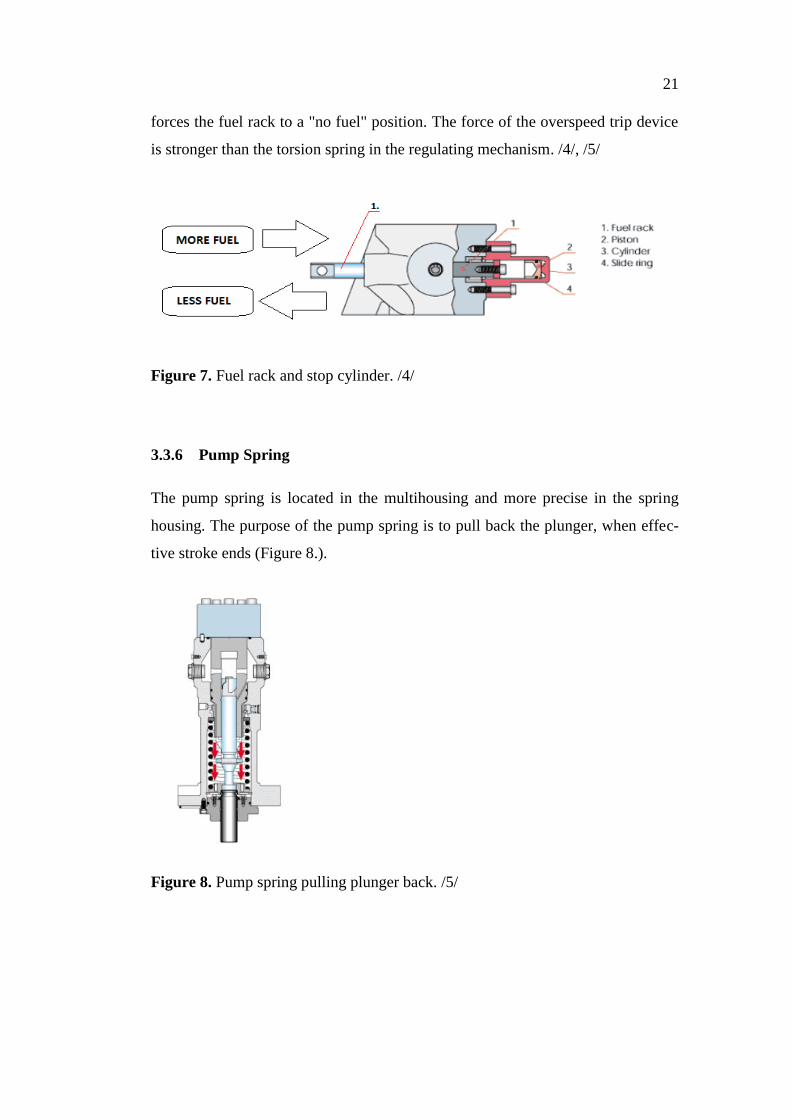
21
forces the fuel rack to a "no fuel" position. The force of the overspeed trip device
is stronger than the torsion spring in the regulating mechanism. /4/, /5/
Figure 7. Fuel rack and stop cylinder. /4/
3.3.6 Pump Spring
The pump spring is located in the multihousing and more precise in the spring
housing. The purpose of the pump spring is to pull back the plunger, when effec-
tive stroke ends (Figure 8.).
Figure 8. Pump spring pulling plunger back. /5/
22
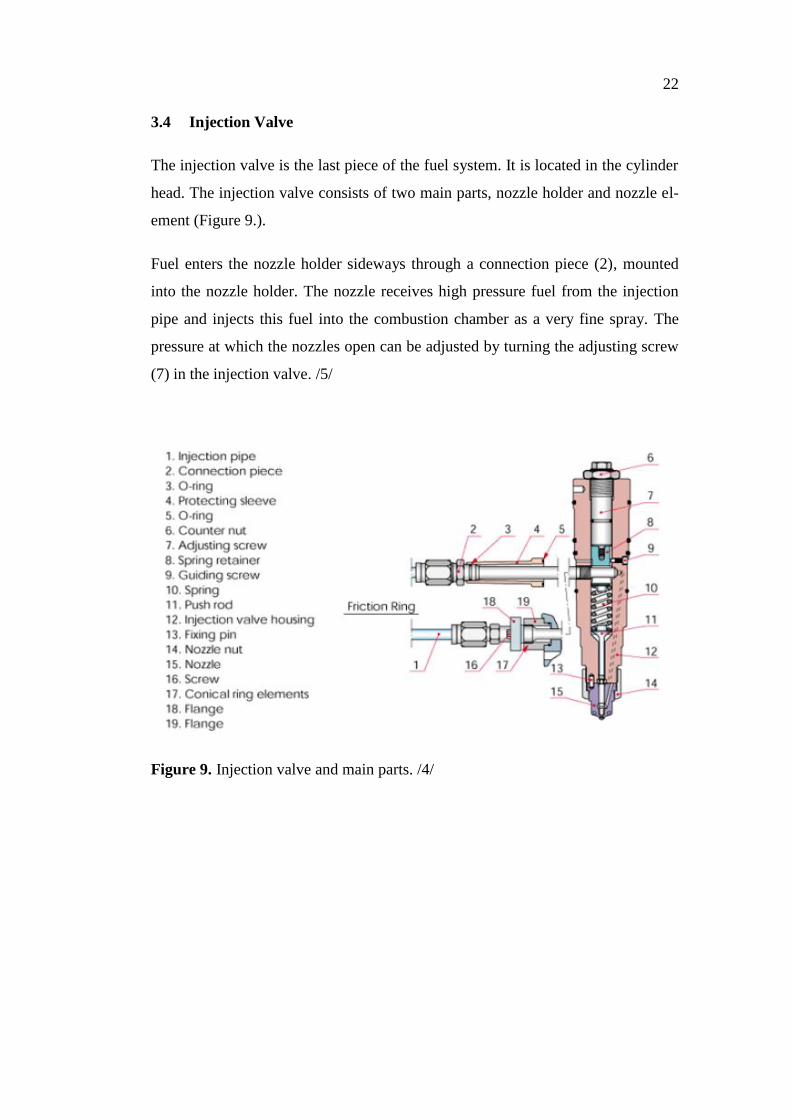
3.4 Injection Valve
The injection valve is the last piece of the fuel system. It is located in the cylinder
head. The injection valve consists of two main parts, nozzle holder and nozzle el-
ement (Figure 9.).
Fuel enters the nozzle holder sideways through a connection piece (2), mounted
into the nozzle holder. The nozzle receives high pressure fuel from the injection
pipe and injects this fuel into the combustion chamber as a very fine spray. The
pressure at which the nozzles open can be adjusted by turning the adjusting screw
(7) in the injection valve. /5/
Figure 9. Injection valve and main parts. /4/
23
4 OBSOLESCENCE MANAGEMENT
4.1 Obsolescence in General
Obsolescence is a state that occurs when a product or service is no longer wanted,
manufactured or supplied but it may still work properly. Obsolescence occurs
when replacement has become available and old products or services are super-
seded by the new ones. Typically, obsolescence is preceded by a gradual decline
in popularity.
Obsolescence is usually referred to as Diminishing Manufacturing Sources and
Material Shortages (DMSMS). Both terms are often used interchangeably, but ob-
solescence refers to the lack of availability through improved technology and
DMSMS to the shortage of manufacturing materials or sources. A third term used
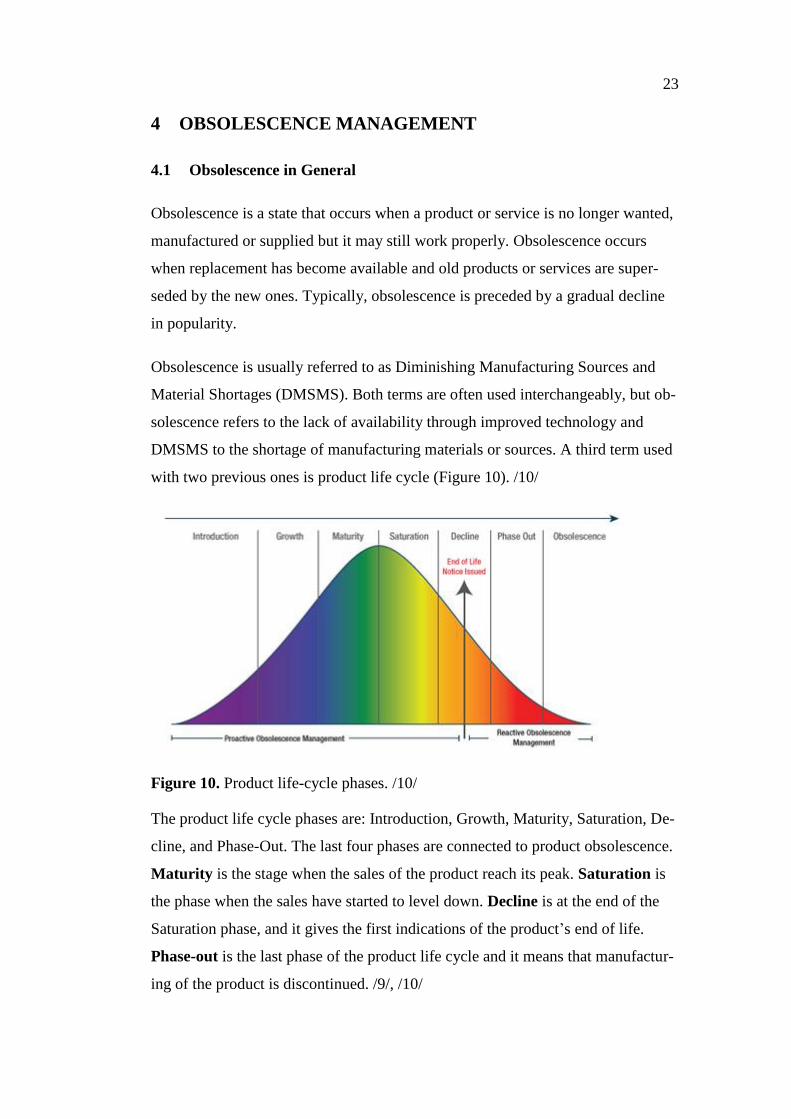
with two previous ones is product life cycle (Figure 10). /10/
Figure 10. Product life-cycle phases. /10/
The product life cycle phases are: Introduction, Growth, Maturity, Saturation, De-
cline, and Phase-Out. The last four phases are connected to product obsolescence.
Maturity is the stage when the sales of the product reach its peak. Saturation is
the phase when the sales have started to level down. Decline is at the end of the
Saturation phase, and it gives the first indications of the product’s end of life.
Phase-out is the last phase of the product life cycle and it means that manufactur-
ing of the product is discontinued. /9/, /10/

24
4.2 Obsolescence Management
Obsolescence management is a sum of many factors. Managers are usually trying
to find the most profitable solutions when making decisions about product obso-
lescence. Factors that affect the decisions are supply and demand, costs, availabil-
ity, product development, laws and regulations.
Obsolescence Management is needed to mitigate the risk of component obsoles-
cence or to plan when make end of life (EOL) notices. Effective obsolescence
management strategies can save a lot of money and time, by avoiding the redesign
of end products. Yet, there are no real standards for obsolescence management,
only guidelines and law regulations. Organizations usually generate their own pol-
icies on how to manage old products or spare parts for older products. For exam-
ple, if companies are investing a lot of money to product development, older
products are often phased out step by step after launching new model to market.
/10/
Obsolescence management can be divided in two categories: proactive and reac-
tive obsolescence management. As seen in Figure 10, proactive obsolescence
management tries to identify and prevent obsolescence risks, while reactive obso-
lescence management acts after EOL notice trying to find solutions to obsoles-
cence issue. The following chapters explain differences between proactive and
reactive obsolescence management.
4.2.1 Proactive Obsolescence Management
Proactive obsolescence management is a method of creating a strategy to mitigate
the risk of component obsolescence in future. It approaches obsolescence in so
called Manufacturer's Point of View. Proactive obsolescence management is usu-
ally followed from the design phase all the way to the decline phase. While there
are no quick or easy solutions, using proactive obsolescence management tech-
niques the problems faced on long life-cycle programs can be minimized.
Proactive obsolescence management techniques can be divided into two catego-
ries: design-based techniques and production engineering-based techniques. De-
25
sign-based techniques attempt to minimize the initial problem and alleviate obso-
lescence management challenges. It is a matter of changing the perspective to save
the design.
Production engineering-based strategy attempts to control the existing situa-
tion. It uses “silicon road map strategy” to manage obsolescence issue. Road maps
sent to customers are used to tell which products are going EOL and new products
superseding the old ones. These road maps can be reviewed for new products that
can fill the role of the ones that are going EOL, allowing customers to do modifi-
cations to certain systems or subsystems with minimal disruption. /10/
4.2.2 Reactive Obsolescence Management
When a product achieves the decline phase of its life-cycle, reactive obsolescence
management is taken in action. Reactive obsolescence is more from the custom-
ers’ point of view. Reactive obsolescence management is the method of acting
upon the end of life of a component, after the EOL notice is released. It tries to
mitigate the risk of obsolescence with following solutions:
Finding alternate replacement from a different manufacturer.
If there is no alternate replacement, costly last time buys (LTB) can be
made. This means that the company buys remaining old parts from the
supplier and storages them for future use.
Finding nearest equivalent alternate part, to reduce the redesign cost.
Creating a custom component similar to the obsolete one, and having a
contract signed with a qualified manufacturer for a certain period.
Redesign a sub-section or entire product. /10/
4.3 Obsolescence Types
As products evolve into updated versions, they require parts and technology dis-
tinct from their predecessors. However, the earlier versions of the product often
still need to be maintained throughout their life cycle. As the new product be-
comes predominant, there are fewer parts available to fix the earlier versions and
26
the technology becomes outdated. Obsolescence can be divided in four main cate-
gories: technical, functional, planned-and postponement obsolescence.
Technical obsolescence occurs when a new product or technology supersedes the
old; even if the older product may still be functional, it is preferred to use the
newer technology. Another reason for technical obsolescence can be that support-
ing technologies for producing or repairing the product may no longer be availa-
ble.
Parts or products can become functionally obsolete: when they do not work as
they should or the way they were created, if replacements for worn parts are no
longer available or the cost of replacing a worn part is higher than a new compo-
nent. Functional obsolescence can also be result of natural wear or some interven-
ing act. Products would be rendered obsolete due to the inability to access service.
Planned obsolescence can be introduced as a marketing strategy with the objec-
tive of generating long-term sales volume by narrowing time between purchases.
Products can be designed to wear out, for example four years from its purchase.
This kind of design pushes the customer to replace product within four years.
Postponement obsolescence refers to a situation where technological improve-
ments are not introduced to a product, even though they could be. One possible
example is when an auto manufacturer develops a new feature for its line of cars,
but chooses not to implement that feature in the production of the least expensive
car in its product line. /10/
27
5 INVENTORY COSTS
In general over half of the warehousing costs are caused by the personnel costs,
the rest are divided between buildings, machines, equipment, IT equipment - and
software. Inventory management involves a number of cost factors that should be
identified, so that costs can be reduced. Inventory costs associated with are: price
of raw materials and products, holding costs, ordering costs and stock-out costs.
/7/
5.1 Holding Cost
Holding cost (or carrying costs) means the total cost of holding the inventory.
This includes warehousing costs, such as rent, utilities and salaries and financial
costs, opportunity cost, and inventory costs related to perishability, pilferage,
shrinkage and insurance. Holding cost depends on the value of inventory and is
usually around 10-40% of annual value of inventory. Costs vary depending on the
products size and storage requirements.
Holding costs are divided in three classes: cost of capital, storage space cost and
risk cost. Cost of capital is the opportunity cost for capital or rate of return. It in-
cludes the costs of investments, interest on working capital, taxes on inventory
paid, insurance costs and other costs associate with legal liabilities. Storage space
costs are e.g. rent or cost of storage place. Storage space costs depend on the size
of the storage place and dimensions and storage requirements of a product. Risk
cost refers to outlet risk and price risk. Companies usually express holding cost as
a percentage of units’ value /7/, /8/:
CA = v * r (1)
Where:
CA = annual storage cost for one unit (€/unit)
v = value (€/unit)
r = percentage of storage cost (%)
28
5.2 Ordering Cost
Ordering costs are costs of ordering a new batch of raw materials or finished
products. These include cost of placing a purchase order, costs of inspection of
received batches, documentation costs, etc. For the same item, ordering cost is the
same, regardless of the order size.
Ordering costs vary inversely with holding costs. It means that the more orders a
business places with its suppliers, the higher will be the ordering costs. However,
more orders mean smaller average inventory levels and hence lower holding costs.
Total inventory costs are equal to total ordering cost plus total holding cost. It is
important for a business to minimize the sum of these costs, which it does by ap-
plying the economic order quantity model. How much to order is determined by
arriving at the Economic Order Quantity (EOQ). /7/, /8/
5.3 Stock-out Cost
Stock-out costs are the cost associated with the lost opportunity caused by the ex-
haustion of the inventory. The exhaustion of inventory could be a result of various
factors, e.g. the most notable amongst them is defective shelf replenishment prac-
tices.
Stock-outs could prove to be very costly for the companies. The subtle responses
could be postponement of purchase. The more disastrous ones are that the con-
sumers may get frustrated and switch stores or even purchase substitute items
(brands). Various retailers follow the concept of “Safety Stock” in order to avoid
the situation of stock-outs. Stock-outs could occur at any point of the supply
chain. /7/, /8/
5.4 Inventory Types
Inventories can be divided in four classes: cycle, safety stock, anticipation and
pipeline inventory. The partition of total inventory varies directly with the lot size
and is called cycle inventory. Determining the order frequency and quantity of
items is called lot sizing.
29
Two principles apply to lot sizing: 1. Lot size Q varies directly with the elapsed
time or cycle between orders. If a lot is ordered every 5 weeks, the average lot
size must be equal 5 weeks’ demand. 2. The longer the time between orders for
given item, the greater the cycle inventory must be.
Average cycle inventory = (Q + 0) / 2 = Q / 2 (2)
Total inventory costs for cycle inventory can be calculated with following formu-
la:
C = (Q / 2) * CA + (D / Q) * S (3)
Where:
C = total annual inventory cost
Q = Lot size in units
CA = Annual holding cost for one unit
D = Annual demand, units per year
S = Ordering cost for one lot
Safety stock inventory is the surplus inventory that the company holds to protect
against uncertainties in demand, lead time and supply changes. Companies hold
safety stocks to avoid service problems or hidden costs. The safety stock ensures
that services are not disrupted when problems occur.
To create a safety stock the company places an order for delivery earlier than the
item is needed. Therefore, the order arrives earlier than it is needed, creating a
safety stock. For example, the lead time for product “x” is six weeks, but the
company orders eight weeks in advance just to be safe. This creates a safety stock
equal to two weeks.
Anticipation inventory is used to absorb uneven rates of demand or supply. The
manufacturer can make products in stock during periods of low demand. This
30
makes it easier to the manufacturer to control the demand peaks and keep output
level steady during the high demand periods.
Pipeline inventory is created when an order for an item is issued but not placed
in inventory. Pipeline inventory exists in form of materials or product that moves
between two places e.g. from plant to customer. Longer lead times of higher de-
mands create more pipeline inventory. Pipeline inventory between two stocking
points can be measured as:
DL = dL (4)
Where:
DL = average demand during lead time
d = average demand for the item/period
L = the number of periods in the items lead time to move between the two points.
/8/, /9/
5.5 Reducing Inventory Costs
Basic tactics for reducing inventory costs are called levers. Levers can be divided
in primary level and secondary level. A primary level lever is the one that has to
be activated when reducing inventory. The secondary level reduces the penalty
cost applying the primary lever and having the inventory at the first place.
In cycle inventory the primary lever is to reduce the quantity of items moving in
supply chain. Without the secondary lever this might lead to a huge increase in
ordering cost. If this happens, next two secondary levers can be used: Streamline
the order methods or increase repeatability. Primary leaver for safety stock is to
place an order closer the time that parts must be received. Without secondary lev-
ers this can lead to unacceptable customer service. Four secondary leavers can be
used: 1. Improve forecasts and information flow between customers, 2. Cut lead
times of purchased items, 3. Reduce supply uncertainties by sharing information
on production with the supplier, and 4. Rely more on equipment and labor buffers.
31
Primary leaver for anticipation inventory is to match the demand rate with the
supplier production rate. Secondary levers that can be used are: 1. Add new prod-
ucts with different demand cycles to compensate seasonal demand, 2. Provide off-
seasonal promotion campaigns and 3. Offer seasonal pricing plans.
For pipeline inventory primary lever is to reduce lead time. Two secondary leav-
ers can be used. 1. Find more responsive suppliers, improve logistics and improve
handling in a plant. 2. Make changes in quantity if the lead time depends on a lot
size. /8/

32
6 WÄRTSILÄ CASE
The idea of the whole thesis was to find out the current status in the field, based
on guiding from Wärtsilä. The required outcome for the whole process was to
screen a possibility to eliminate old injection pumps, injection valves and spare
parts for them. The figure below describes the whole process done (Figure 11.).
Figure 11. Block diagram of the task done within this thesis.
In this chapter tasks from design & development to availability of non-OEM parts
are being described. Chapters are formed as follows: what is needed to be done,
how it is done and results. Spare part optimization is explained in Chapter 7.
6.1 Design and Development of the Injection Pumps
The Injection pumps have been developed in several steps in the W32 engine.
Continuous development has resulted in the birth of several pump models during
the years (Table 3.). This chapter explains the differences and improvements be-
tween old and new injection pump models. /6/
Secret, contains information that can`t be published.
SPARE PART OPTIMIZATION
AVAILABILITY OF NON OEM PARTS Internet Theory
SERVICE COST CALCULATIONS Overhauling Costs Inventory Costs
RPLACEMENT CHAINS Internal documentation SAP
SCREENING THE DATABASE Engine Number List Sales Statistics
DESIGN & DEVELOPMENT Injection Pumps Injection Valves
THESIS
33
6.1.1 PEO-G057 (Original Design)
Secret, contains information that can`t be published.
6.1.2 PEO-G057a
Secret, contains information that can`t be published.
6.1.3 PEO-G057b, c
Secret, contains information that can`t be published.
6.1.4 PEO-G057d
Secret, contains information that can`t be published.
6.1.5 PEO-G057er, e
Secret, contains information that can`t be published.
6.1.6 PEO-G057fv
Secret, contains information that can`t be published.
6.1.7 PEO-G057mv
Secret, contains information that can`t be published.
6.1.8 PEO-G057sv Intermediate
Secret, contains information that can`t be published.
6.1.9 PEO-G057sv
Secret, contains information that can`t be published.
6.1.10 PEO-G057sv, OVAKO
Secret, contains information that can`t be published.
34
6.1.11 PEO-G057TV
Secret, contains information that can`t be published.
6.1.12 PEO-G057TA
Secret, contains information that can`t be published.
6.1.13 PEO-G089V1
Secret, contains information that can`t be published.
6.2 Design and Development of the Injection Valves
As the injection pumps have developed, so have the injection valves. Over the
years new injection valves have been brought to the market. The table below
shows all different conventional valve models for W32 engine.
Secret, contains information that can`t be published.
6.2.1 Nozzle Elements
Nozzle elements can be divided in three categories: Type 1 (old), Type 2 (inter-
mediate) and Type 3 (new). Type 1 nozzles are old models those are not available
anymore. Old nozzle models can be seen in table 6.
Secret, contains information that can`t be published.
6.2.2 Nozzle Holders
Nozzle holders can be divided into five types. Types are referred to design stages,
which again is referred to injection pressure. All five nozzle holder types can be
seen in Table 9.
Secret, contains information that can`t be published.
35
6.3 Screening the Database
The thesis was started by screening the engine database. The task was to investi-
gate which kind of injection pumps, elements and injection valves were still active
according to our system. The emphasis was on the situation of old pump models.
Some cases needed further investigation because of the upgrades in injection
equipment.
In this task the SAP-program was used and more precise the CR Query Report.
Searching terms “165001” was used, which is the spare part number (SPN) for
injection pump and W32 in the reference field. This search gave a list of 2821 en-
gine numbers. A list was also received from a colleague, which was compared to
the list from SAP.
The first task was to exclude the common rail injection pumps from the list. After
deleting the common rail pumps engines that were scrapped and/or updated to
new pumps were sorted out. Finally, a list of engines active in the field was as-
sembled, 2785 pieces in total (Table 10.).
Secret, contains information that can`t be published.
Status means whether pumps are still available as a complete spare part pump, 02
= available and Z3 = obsolete. Engine QTY means the number of engines operat-
ing in the field. Pump QTY is the number of pumps operating in the field. Stock
QTY means the quantity of injection pumps physically in stock.
The same process was repeated with injection valves. The number of engines
found in the CR Query Report was 2810. After sorting and deleting scrapped, up-
dated and gas engine valves, the number was 2749 (Table 11.).
Secret, contains information that can`t be published.
6.4 Screening Sales Statistics
The task was to investigate spare part sales and find out how much old parts are
still sold. Due to the lack of rights to this part of the SAP, this data was received
36
from a colleague from the Business Applications department; that is sales statistic
for injection pumps, injection valves and their spare parts that were found active
according to SAP. The data was gathered between 2004 and 2014. All the follow-
ing graphs shown in this chapter use the same form, the vertical axis is the sales
quantity in units and the horizontal axis is years.
Because of screening the database the number of old injection pumps was now
known. The pump elements were studied first. The following graph demonstrates
the difference between old and new element sales.
Secret, contains information that can`t be published.
6.5 Replacement Chains
The task was to find out if the SAP replacement chains were up- to- date. The
Technical Services internal documentation was used and an injection expert was
consulted to figure out if the chains were right and if there were any possibilities
to make any new ones.
All possible replacement chains for injection pumps existed in SAP and there
were no new ones to make at the moment. For injection valves and valve parts
there were possible chains to be upgraded.
Secret, contains information that can`t be published.
6.6 Service Cost Calculations
There were three different tasks in service cost calculations. The first was to com-
pare the plan overhauling costs to “real field experience”, the second was the
comparison of spare part price between overhauls versus new pumps. The final
task was to calculate the inventory costs for old spare parts.
6.6.1 Overhauling Cost VS “Real Field Experience”
Wärtsilä makes example calculations to customers with the program Service Cal-
culation Office (SCO). SCO is a web-based calculation application in Wärtsilä's
37
portal. The purpose of SCO is to aid in the making of service agreements by cal-
culating the maintenance work costs, spare parts cost, personnel cost and opera-
tions cost.
SCO calculations are based on statistics, and time consumed to work is calculated
for dismounting, over all inspection, element and sealing change and reassembly.
Depending on the working conditions, time used is different. SCO offers three
different options for working conditions: workshop, normal and difficult condi-
tions. The SCO injection pump overhaul calculation form is found at the end of
the thesis in Appendix 1.
Secret, contains information that can`t be published.
6.6.2 Overhauling vs New Pumps
The cost between overhauling the pump vs. upgrading the old pump to the new
version was compared. This topic was approached in four different ways:
Injection pump FV overhaul vs new pump SV OVAKO (cost prices)
Injection pump SV overhaul vs new pump SV OVAKO (cost prices)
Injection pump SV overhaul vs new pump SV OVAKO (GLP prices)
Injection pump SV overhaul vs new pump SV OVAKO (cost prices, GLP
prices and work included).
Secret, contains information that can`t be published.
6.6.3 Inventory Costs
The idea was to calculate how much money can be saved when old spare parts can
be left out of the inventory. These calculations were done for old spare parts only
and parts included were: pump element, three sealing sets and pump cover. The
total inventory costs are calculated with two different methods.
The first thing was to calculate the annual holding cost for one unit with formula
(1). The percentage of storage cost is xx% (calculated from cost price). The safety
stock is found from SAP. The ordering cost per order line is xx€. Savings made in
38
inventory costs are seen in Table 16. The annual inventory costs are calculated
with formula (5), which is a modified version of the formula (3).
Cs = Qs * CA + O * S (5)
Where:
Cs = Annual inventory cost
Qs = (Safety stock + Reorder quantity) / 2
CA = annual storage cost for one unit (€/unit)
O = Number of orders
S = Ordering cost for one lot (€/order)
Secret, contains information that can`t be published.
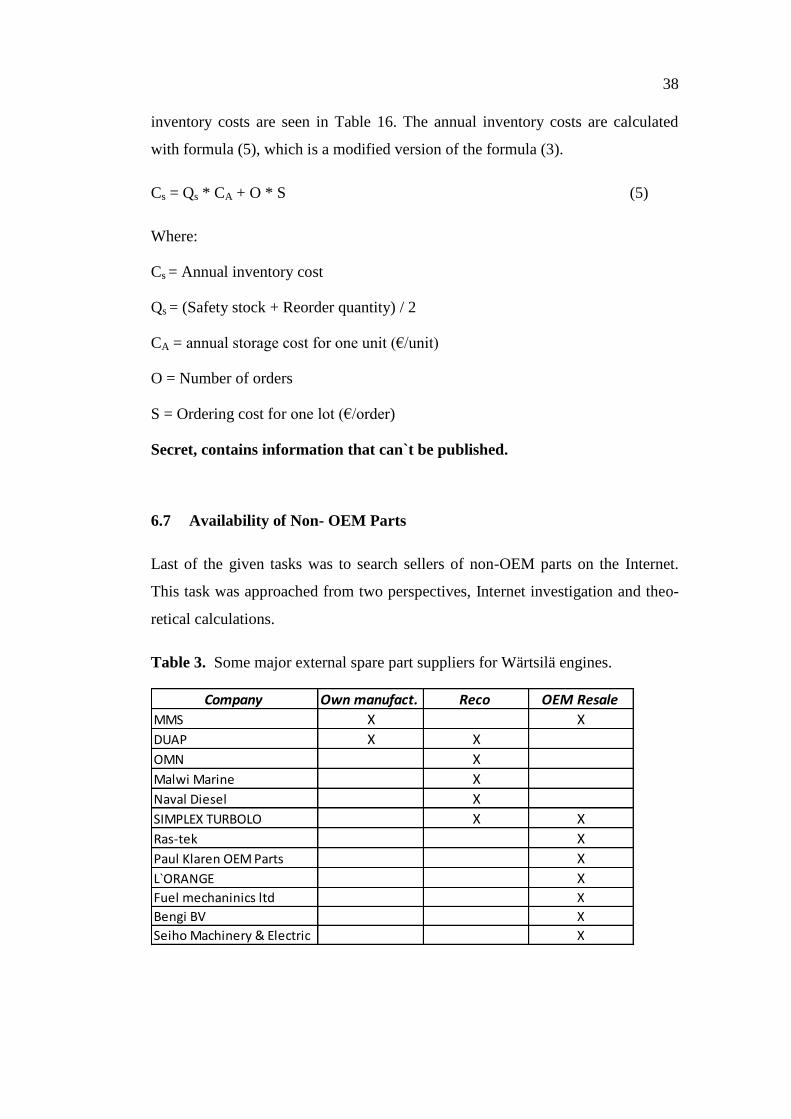
6.7 Availability of Non- OEM Parts
Last of the given tasks was to search sellers of non-OEM parts on the Internet.
This task was approached from two perspectives, Internet investigation and theo-
retical calculations.
Table 3. Some major external spare part suppliers for Wärtsilä engines.
Company Own manufact. Reco OEM Resale
MMS X X
DUAP X X
OMN X
Malwi Marine X
Naval Diesel X
SIMPLEX TURBOLO X X
Ras-tek X
Paul Klaren OEM Parts X
L`ORANGE XFuel mechaninics ltd X
Bengi BV X
Seiho Machinery & Electric X
39
Suppliers can be divided into three main categories: own manufacturing, recondi-
tioning and OEM resale. Major service suppliers found are seen in the table
above.
Secret, contains information that can`t be published.
40
7 SPARE PART OPTIMIZATION FOR WÄRTSILÄ
7.1 Injection Pumps and Spare Parts
A proposal was to be made on obsoleting and terminating the older injection
pump spare parts if possible. This topic was approached with three different pro-
posals. Proposal 1 is the easiest with minor changes on the existing situation, pro-
posal 2 is something in between and proposal 3 is the most effective one.
7.1.1 Proposal 1
Secret, contains information that can`t be published.
7.1.2 Proposal 2
Secret, contains information that can`t be published.
7.1.3 Proposal 3
Secret, contains information that can`t be published.
7.2 Injection Valves
7.2.1 Proposal 1.
Secret, contains information that can`t be published.
7.2.2 Proposal 2.
Secret, contains information that can`t be published.
7.3 Conclusion of Spare Part Optimization
Secret, contains information that can`t be published.
41
8 CONCLUSION
The thesis was useful for Wärtsilä because accurate knowledge of the number of
old injection pumps in the field and amount of sales for old spare parts is now
known. The replacement chains are now up-to-date. Work books and internal da-
tabase has been updated. Big decisions can be made based on the information of
this thesis.
As a whole, the process went well. During the research phase some unpredictable
cases and challenges appeared but solving these problems went well. Writing the
theory part of the report and searching the information could have gone faster.
This has been a very educational process. During the project a huge amount of
knowledge about injection equipment has been learned, basic skills of SAP have
been developed and documentation skills have improved. It was very pleasant to
work with professionals and learn from them.
More accurate calculations should be done for the component holding costs,
which are now calculated to be xx% and seem a bit small. Usually component
holding costs are around 10%.
If Wärtsilä still determines to keep old spare parts, such as old model pump ele-
ments and sealing sets for sale, the price of these components should be increased.
And finally pump covers should be evaluated to be included to the injection pump
overhaul calculations in SCO.
42
REFERENCES
/1/ About Us, Company & Management, General Information 2015. Wärtsilä
global web pages. Accessed 6.1.2015.
http://www.wartsila.com/en/about/company-management/overview
/2/ Technical Support, Wärtsilä 32 2015. Wärtsilä Intranet web pages. Ac-
cessed 6.1.2015.
http://compass.wartsila.com/Operations/Life_cycle_support/Technical_Support/Pr
oduct_Support/Product_Groups/W32,_Vasa_32/Pages/Default.aspx
/3/ Products, W32 2015. Wärtsilä global web page. Accessed 6.1.2015
http://www.wartsila.com/en/engines/medium-speed-engines/wartsila32
/4/ W32 Instruction Manual, 16: Injection System. Accessed 9.1.2015
http://eldoc.wartsila.com/eldoc/main.jsp?reftype=w32
/5/ Installation manual W32D, 2: Fuel system 2015. Accessed 12.1.2015.
http://infoboard.wartsila.com:8080/infoboard/main.jsp?documentref=103463.xml
/6/ W32 Injection valve Pump element and sealing arrangements RevB Au-
gust 2014, excel, Wärtsilä internal documentation. Accessed 14.11.2014.
/7/ Logistiikan maailma, Varastointikustannukset 2015. Logistiikan Maailma
web pages. Accessed 27.12015.
http://www.logistiikanmaailma.fi/wiki/Varastointikustannukset
/8/ Krajewski L. J., L. P. Ritzman and M. K. Malhotra, 2010. Operations
Management, Processes and Supply Chains. 9st. Edition. 9; 345-371, 12; 435-468.
New Jersey. Pearson.
/9/ Heizer,J., B. Render. 2014. Operations Management, Sustainability and
Supply Chain Management. 11st. Edition. Kendallville. Pearson.
/10/ Bartels, B, U. Ermel, P. Sandborn and M. G. Pecht. 2012. Strategies to the
Prediction, Mitigation and Management of Product Obsolescence.1st. Edition.
New Jersey. Wiley.
/11/ Carlström K. 2009. Wärtsilä 32 Nozzles and Nozzle Holders. WFI-S
Technical Service, Issue 1.
1(2)
APPENDIX 1. SCO INJECTION PUMP OVERHAUL CALCULATION.
Secret, contains information that can`t be published.

2(2)
APPENDIX 2. Difference between Sealing Sets.
Secret, contains information that can`t be published.


![W32.Blaster 「疾風」 W32.Welchia.Worm] 電腦病毒解毒方 法 電算中心 網路服務組 翁仁芳.](https://static.fdocument.pub/doc/165x107/56649d535503460f94a2f3df/w32blaster-w32welchiaworm-.jpg)

