1 2010 Annual Report 24 March 2010. 2 Financial Highlights Operations Review Business Prospects.
Upload
city-of-norfolkCategory
view
216download
0description

Mid–Year Financial Update
March 2016
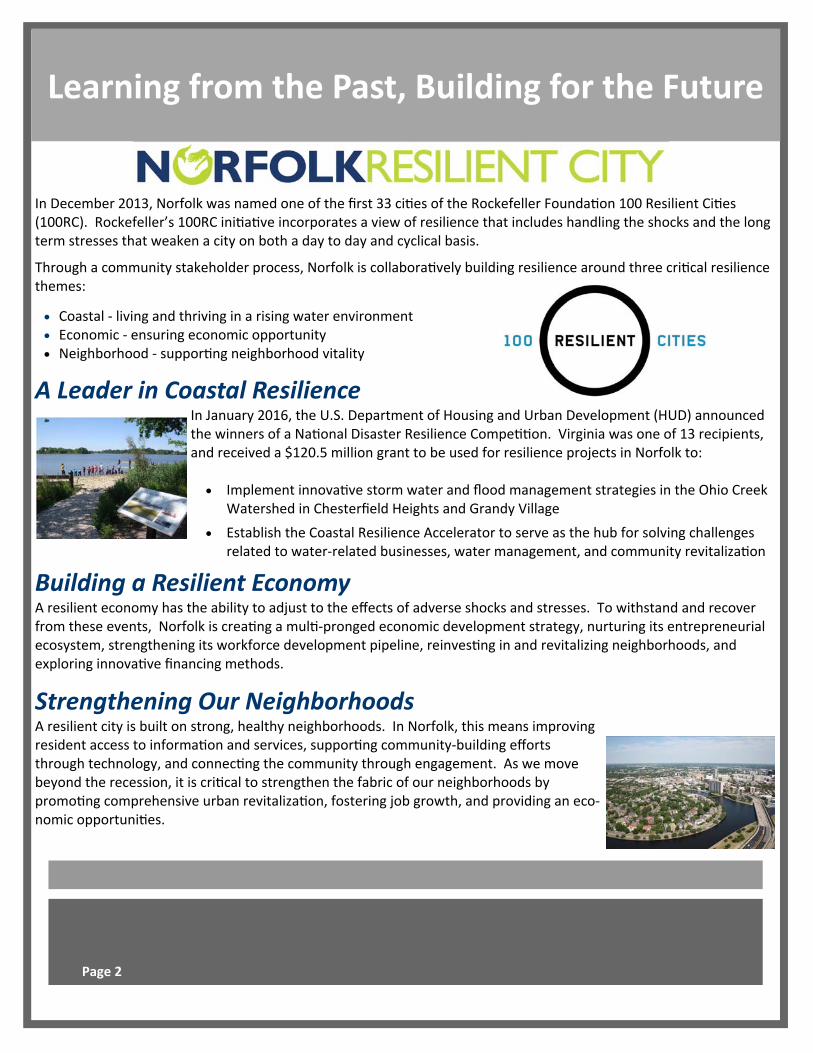
Learning from the Past, Building for the Future
In December 2013, Norfolk was named one of the first 33 ci es of the Rockefeller Founda on 100 Resilient Ci es (100RC). Rockefeller’s 100RC ini a ve incorporates a view of resilience that includes handling the shocks and the long term stresses that weaken a city on both a day to day and cyclical basis.
Through a community stakeholder process, Norfolk is collabora vely building resilience around three cri cal resilience themes:
Coastal ‐ living and thriving in a rising water environment Economic ‐ ensuring economic opportunity Neighborhood ‐ suppor ng neighborhood vitality
A Leader in Coastal Resilience
In January 2016, the U.S. Department of Housing and Urban Development (HUD) announced the winners of a Na onal Disaster Resilience Compe on. Virginia was one of 13 recipients, and received a $120.5 million grant to be used for resilience projects in Norfolk to:
Implement innova ve storm water and flood management strategies in the Ohio Creek Watershed in Chesterfield Heights and Grandy Village
Establish the Coastal Resilience Accelerator to serve as the hub for solving challenges related to water‐related businesses, water management, and community revitaliza on
Building a Resilient Economy A resilient economy has the ability to adjust to the effects of adverse shocks and stresses. To withstand and recover from these events, Norfolk is crea ng a mul ‐pronged economic development strategy, nurturing its entrepreneurial ecosystem, strengthening its workforce development pipeline, reinves ng in and revitalizing neighborhoods, and exploring innova ve financing methods.
Strengthening Our Neighborhoods A resilient city is built on strong, healthy neighborhoods. In Norfolk, this means improving resident access to informa on and services, suppor ng community‐building efforts through technology, and connec ng the community through engagement. As we move beyond the recession, it is cri cal to strengthen the fabric of our neighborhoods by promo ng comprehensive urban revitaliza on, fostering job growth, and providing an eco‐nomic opportuni es.
Page 2
Crea ng the 22nd Century Norfolk
A resilient city must not only cope with adverse shocks and stresses as they occur, but plan for challenges it will face over the course of the next 50 or 100 years. In the fall of 2015, the city launched Norfolk Vision 2100 as part of its broader resiliency strategy. This collabora ve program engages ci zens and other key stakeholders to envision how Norfolk will look in the next century. The city faces a number of unique challenges, including sea level rise, decreased federal spending, the need for con nued economic and residen al development, improvements to public infrastructure, and many others. The Vision 2100 program will result in a plan that catalyzes future decision making.
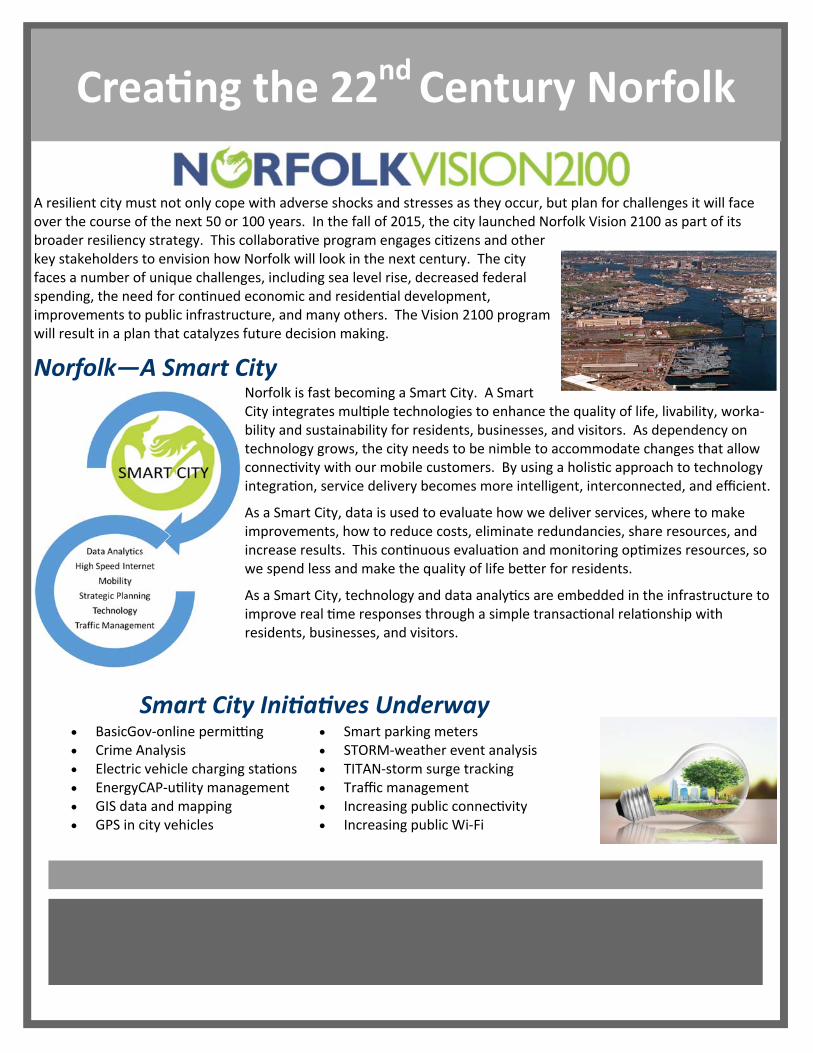
Norfolk—A Smart City Norfolk is fast becoming a Smart City. A Smart City integrates mul ple technologies to enhance the quality of life, livability, worka‐bility and sustainability for residents, businesses, and visitors. As dependency on technology grows, the city needs to be nimble to accommodate changes that allow connec vity with our mobile customers. By using a holis c approach to technology integra on, service delivery becomes more intelligent, interconnected, and efficient.
As a Smart City, data is used to evaluate how we deliver services, where to make improvements, how to reduce costs, eliminate redundancies, share resources, and increase results. This con nuous evalua on and monitoring op mizes resources, so we spend less and make the quality of life be er for residents.
As a Smart City, technology and data analy cs are embedded in the infrastructure to improve real me responses through a simple transac onal rela onship with residents, businesses, and visitors.
BasicGov‐online permi ng Crime Analysis Electric vehicle charging sta ons EnergyCAP‐u lity management GIS data and mapping GPS in city vehicles
Smart parking meters STORM‐weather event analysis TITAN‐storm surge tracking Traffic management Increasing public connec vity Increasing public Wi‐Fi
Smart City Ini a ves Underway
Con nuing Recovery
Commonwealth’s investment in Norfolk
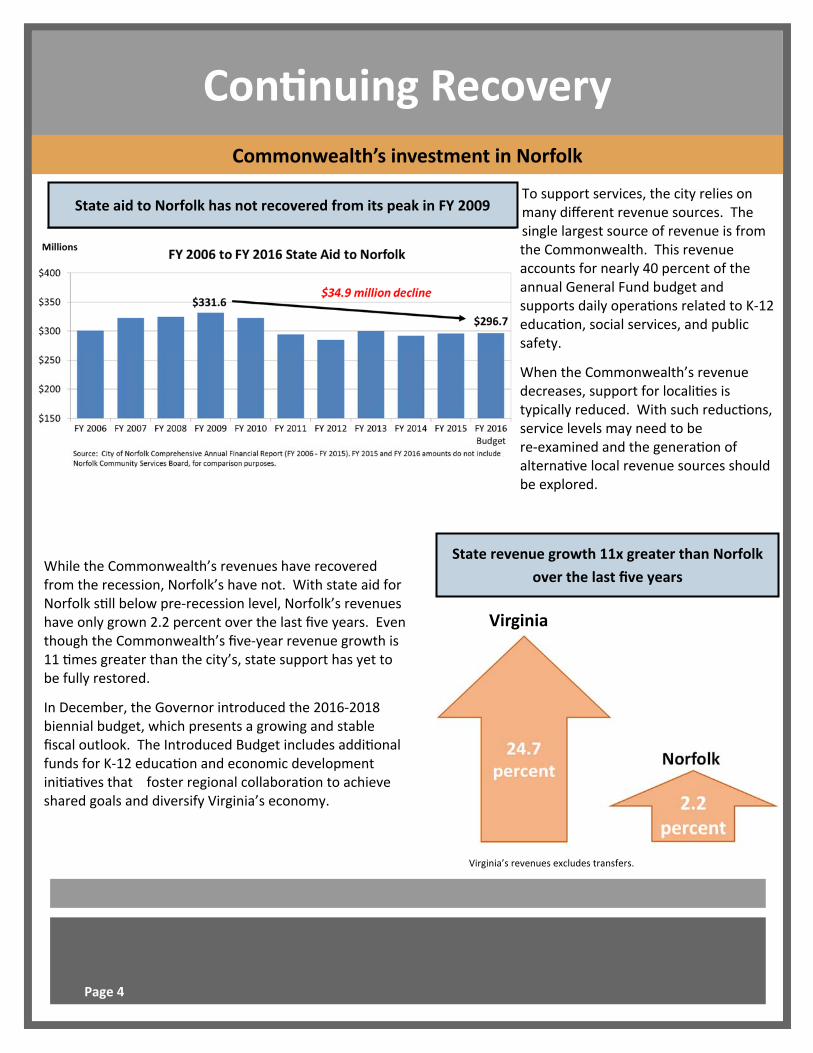
While the Commonwealth’s revenues have recovered from the recession, Norfolk’s have not. With state aid for Norfolk s ll below pre‐recession level, Norfolk’s revenues have only grown 2.2 percent over the last five years. Even though the Commonwealth’s five‐year revenue growth is 11 mes greater than the city’s, state support has yet to be fully restored.
In December, the Governor introduced the 2016‐2018 biennial budget, which presents a growing and stable fiscal outlook. The Introduced Budget includes addi onal funds for K‐12 educa on and economic development ini a ves that foster regional collabora on to achieve shared goals and diversify Virginia’s economy.
State revenue growth 11x greater than Norfolk
over the last five years
To support services, the city relies on many different revenue sources. The single largest source of revenue is from the Commonwealth. This revenue accounts for nearly 40 percent of the annual General Fund budget and supports daily opera ons related to K‐12 educa on, social services, and public safety.
When the Commonwealth’s revenue decreases, support for locali es is typically reduced. With such reduc ons, service levels may need to be re‐examined and the genera on of alterna ve local revenue sources should be explored.
State aid to Norfolk has not recovered from its peak in FY 2009
Virginia
Norfolk
Virginia’s revenues excludes transfers.
Page 4
State budget ac ons have a significant impact on the city; however, the broader economic landscape also impacts the local financial outlook. Key na onal, state, and local economic trends are con nuously monitored because they are closely linked to the performance of the local economy. Some of the key economic trends analyzed include:
Employment data
Outlook of the Commonwealth
Interest rates at which we can borrow
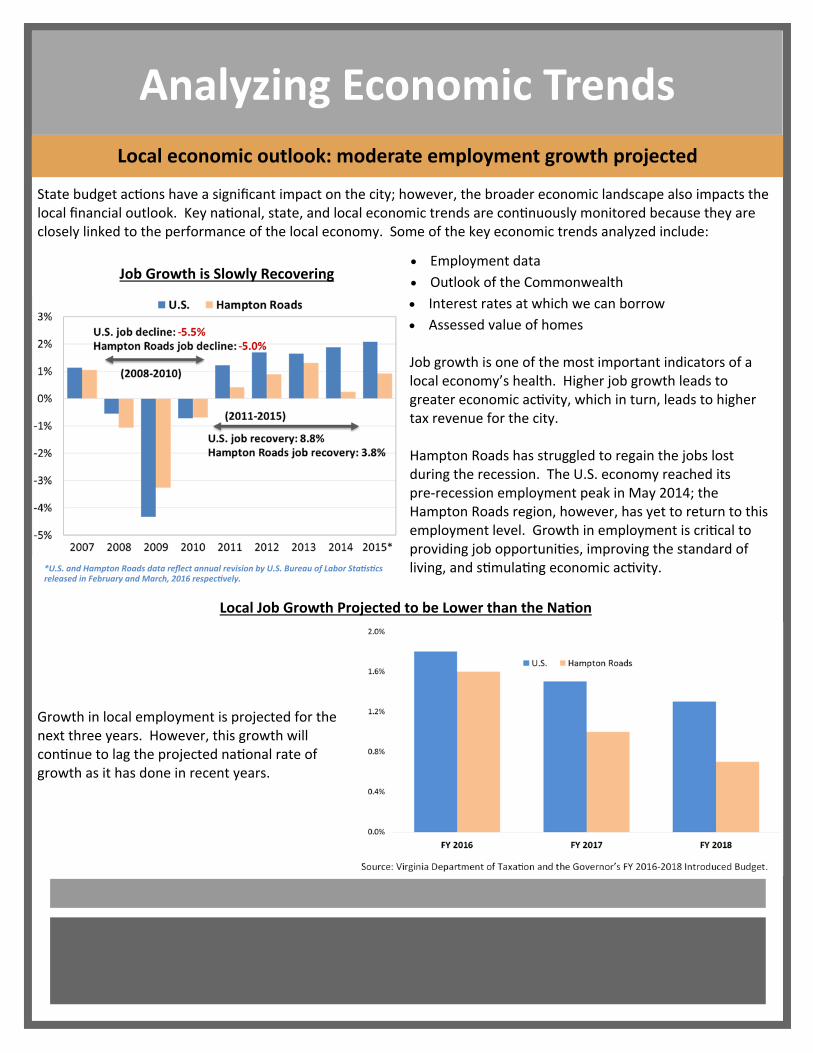
Assessed value of homes Job growth is one of the most important indicators of a local economy’s health. Higher job growth leads to greater economic ac vity, which in turn, leads to higher tax revenue for the city. Hampton Roads has struggled to regain the jobs lost during the recession. The U.S. economy reached its pre‐recession employment peak in May 2014; the Hampton Roads region, however, has yet to return to this employment level. Growth in employment is cri cal to providing job opportuni es, improving the standard of living, and s mula ng economic ac vity.
Growth in local employment is projected for the next three years. However, this growth will con nue to lag the projected na onal rate of growth as it has done in recent years.
Analyzing Economic Trends
Local economic outlook: moderate employment growth projected
Source: Virginia Department of Taxa on and the Governor’s FY 2016‐2018 Introduced Budget.
Job Growth is Slowly Recovering
*U.S. and Hampton Roads data reflect annual revision by U.S. Bureau of Labor Sta s cs released in February and March, 2016 respec vely.
Local Job Growth Projected to be Lower than the Na on

Rebounding Economy Creates Revenue Growth
The ability to generate local revenues was significantly impacted during the Great Recession. Although the local economy is growing at a slower rate rela ve to the Commonwealth and the na on, recovery in locally generated revenues is beginning. This growth is a sign of economic progress.
Revenue growth in sales, meals/hotel, and other local taxes indicate that people are spending more discre onary income on dining out, traveling, shopping, and entertainment.
While the revenue sources above indicate increased local economic ac vity, other key revenue sources are also growing. The modest growth of these revenue sources helps the city con nue to provide core services.
Improving revenues
Consumer spending is on the rise
Key revenues are increasing
Sales Tax Meals/Hotel Tax All Other Local Taxes
Real Estate Tax Other Property Taxes Revenue from the Commonwealth
Page 6
(amounts in millions)
(amounts in millions)

Emerging from the Recession
Local housing market: recovery on track
Trends in the housing market are another key indicator of the health of the local economy. Rising home sale prices and a decreasing foreclosure rate are indicators of an improving economy. Norfolk’s housing market is recovering. Real estate assessments and average home sale prices are rising, crea ng higher home values and homeowner wealth.
For every one percent increase in overall assessed values, the city collects an addi onal $2.0 million in real estate tax, while the average homeowner sees only a $1.95 monthly increase in their tax bill. In fact, the average homeowner today pays $230 a year less now than in FY 2010.
Although overall and residen al assessments have increased, their growth has been below the historical average of four to five percent. The market is returning from double digit growth in FY 2005 ‐ FY 2008, to growth closer to the norm. Despite increasing residen al assessed values, average home sales prices (peak in 2007), and residen al assessed value (peak in 2010) have yet to reach their pre‐recession peaks.
Returning to the norm
Residen al Assessments
Turning the Corner
Note: FY 2017 (preliminary) based on annual reassessment.
Providing Core Services for Less
Despite limited resources, we employ best prac ces, strive for con nuous improvement, and engage our community to help priori ze service delivery.
Community engagement works to increase the extent to which residents become more informed about local issues and par cipate more effec vely in local decision making. For local governments to func on more effec vely, it needs residents to be aware, stay connected, and take ac on.
In Norfolk, community engagement has become a year‐round ac vity. We solicit input to understand what is most important to our residents through:
Budget balancing exercises
City Manager’s listening tour‐looking ahead
Focus groups
Informa on sessions
Mission Possible‐employee engagement
Outreach sessions
Public hearings
Social media
Workshops
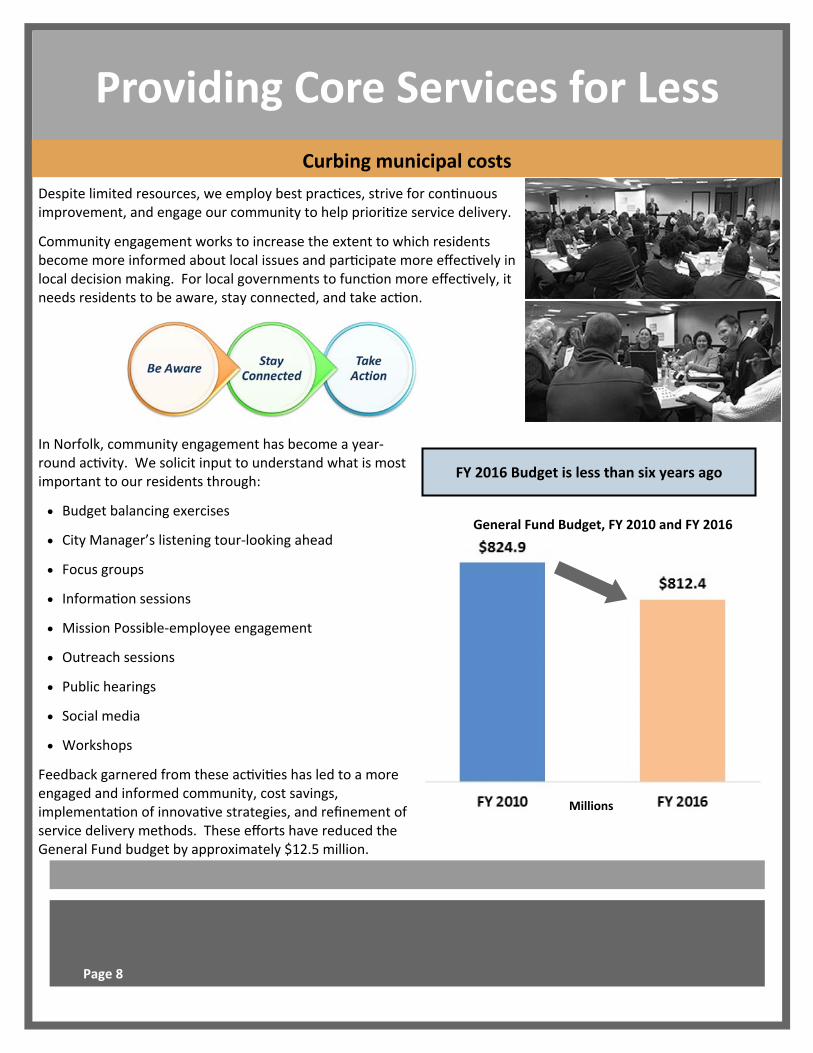
Feedback garnered from these ac vi es has led to a more engaged and informed community, cost savings, implementa on of innova ve strategies, and refinement of service delivery methods. These efforts have reduced the General Fund budget by approximately $12.5 million.
Curbing municipal costs
FY 2016 Budget is less than six years ago
Millions
General Fund Budget, FY 2010 and FY 2016
Page 8
Adap ng and Improving
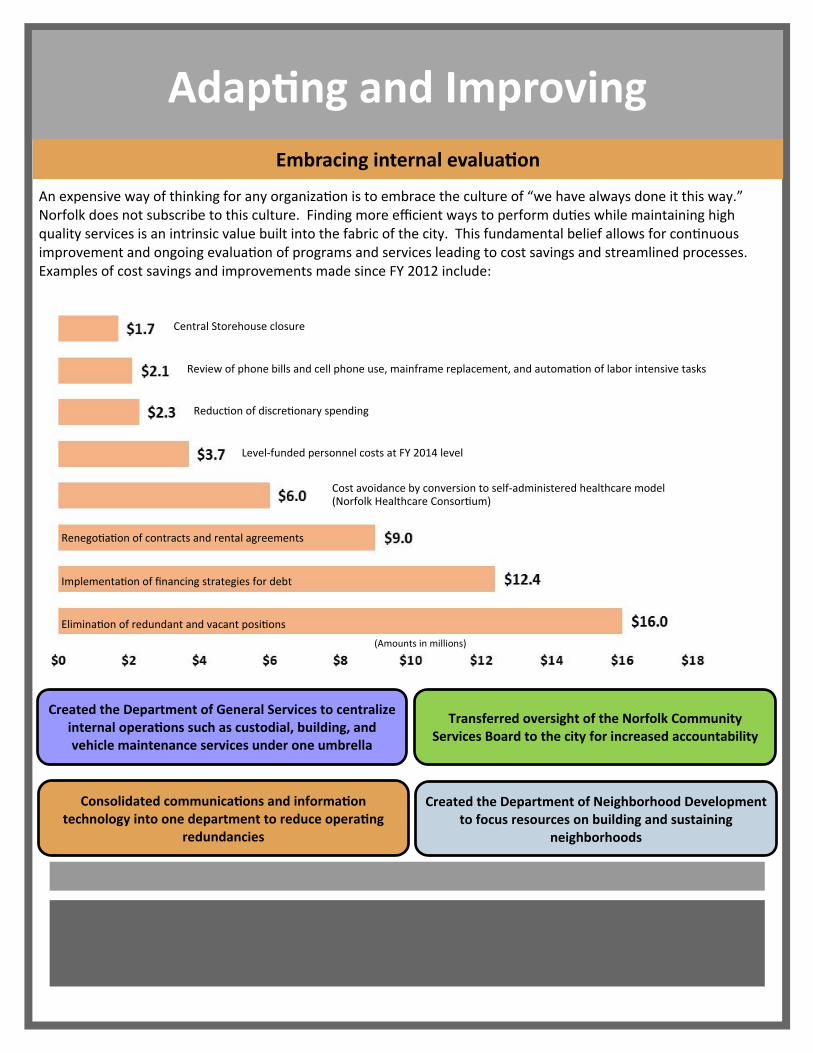
Embracing internal evalua on
Elimina on of redundant and vacant posi ons
Implementa on of financing strategies for debt
Renego a on of contracts and rental agreements
Cost avoidance by conversion to self‐administered healthcare model (Norfolk Healthcare Consor um)
Level‐funded personnel costs at FY 2014 level
Reduc on of discre onary spending
Review of phone bills and cell phone use, mainframe replacement, and automa on of labor intensive tasks
Central Storehouse closure
An expensive way of thinking for any organiza on is to embrace the culture of “we have always done it this way.” Norfolk does not subscribe to this culture. Finding more efficient ways to perform du es while maintaining high quality services is an intrinsic value built into the fabric of the city. This fundamental belief allows for con nuous improvement and ongoing evalua on of programs and services leading to cost savings and streamlined processes. Examples of cost savings and improvements made since FY 2012 include:
Consolidated communica ons and informa on technology into one department to reduce opera ng
redundancies
Transferred oversight of the Norfolk Community Services Board to the city for increased accountability
Created the Department of General Services to centralize internal opera ons such as custodial, building, and vehicle maintenance services under one umbrella
Created the Department of Neighborhood Development to focus resources on building and sustaining
neighborhoods
(Amounts in millions)

Making Sustainable Decisions
FY 2015 year‐end highlights Through responsible financial management, FY 2015 ended with revenues exceeding expenditures. This resulted in a surplus of over $8.0 million. Concurrently, the city:
Achieved a structurally balanced budget, four years ahead of schedule
Fully implemented city‐administered healthcare
Implemented Phase I of the A rac on, Reten on, Mo va on, and Development (ARMD) Ini a ve for employees
Increased support for Norfolk Public Schools
Maintained the real estate tax rate
City Council redirected the surplus to foster economic resilience by bolstering reserves, inves ng in neighborhood projects, and looking towards the future by paying down debt to help to reduce the preliminary FY 2017 budget gap. Reinves ng in the city
Mindful spending and
conserva ve revenue
projec ons resulted in a
surplus over $8.0 million
Page 10
Building our Stability
(amounts in millions)
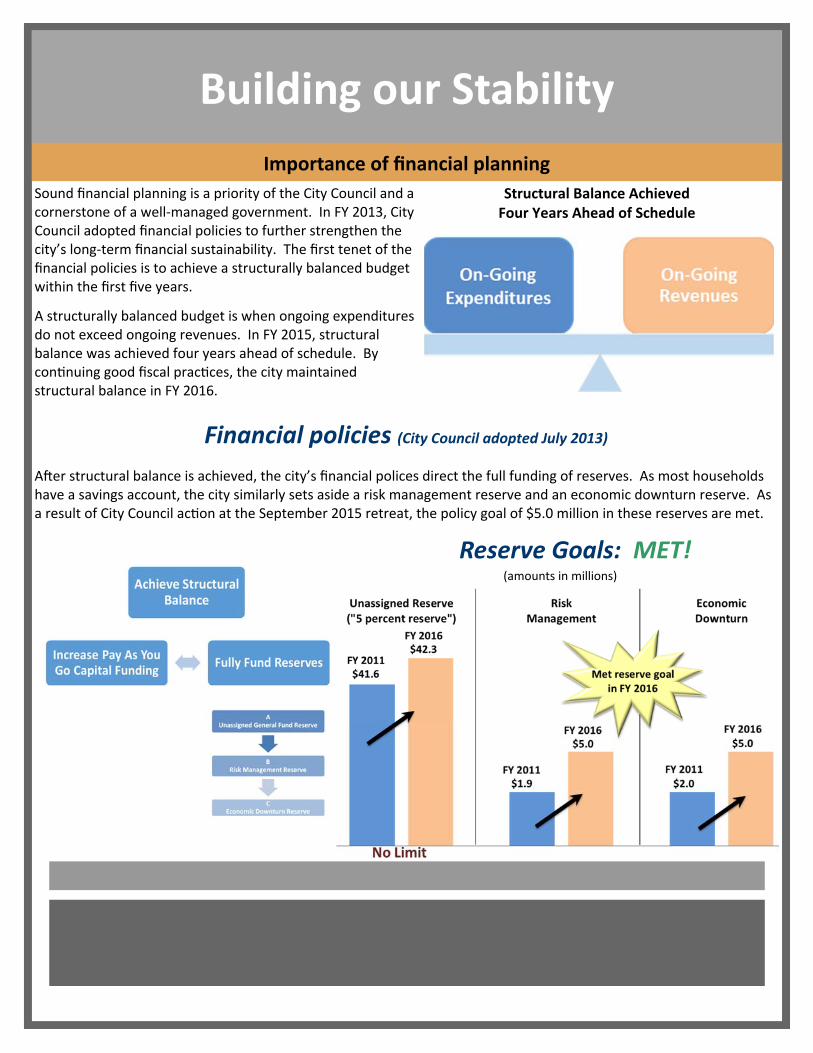
Sound financial planning is a priority of the City Council and a cornerstone of a well‐managed government. In FY 2013, City Council adopted financial policies to further strengthen the city’s long‐term financial sustainability. The first tenet of the financial policies is to achieve a structurally balanced budget within the first five years.
A structurally balanced budget is when ongoing expenditures do not exceed ongoing revenues. In FY 2015, structural balance was achieved four years ahead of schedule. By con nuing good fiscal prac ces, the city maintained structural balance in FY 2016.
A er structural balance is achieved, the city’s financial polices direct the full funding of reserves. As most households have a savings account, the city similarly sets aside a risk management reserve and an economic downturn reserve. As a result of City Council ac on at the September 2015 retreat, the policy goal of $5.0 million in these reserves are met.
Reserve Goals: MET!
Importance of financial planning
Structural Balance Achieved Four Years Ahead of Schedule
Financial policies (City Council adopted July 2013)

Dissec ng the budget
Evalua ng Resources
The FY 2016 General Fund budget totals $812.4 million. While this may seem large, the majority of these funds have restric ons on their use.
Nearly 40 percent or $314.7 million of the budget is dedicated to Norfolk Public Schools. Another 38 percent or $307.2 million is earmarked by state or federal regula ons for specific uses, for the repayment of city debt, public transporta on (Hampton Roads Transit), police, fire, sheriff and the city jail. The final two percent is used to support remaining employee healthcare and re rement. This amounts to 79 percent or approximately $640.6 million of the total budget that is designated.
The remaining 21 percent or $171.8 million is available for other flexible uses. While the use of these funds are not legally restricted, they are used to pay for core city services. These services include: libraries, recrea on centers, parks, electricity, fuel, water, and technology. Further, within the $171.8 million, 49 percent or $84.7 million supports personnel expenses such as salaries.
Preliminary FY 2016 year‐end es mate
The mid‐year budget review provides an assessment of the city’s budget condi on in the current year based on actual performance during the first six months. Throughout the year, revenue collec ons and expenditures are monitored. As of January 2016, projected revenues are tracking and expected to meet budget, while expenditures are an cipated to be within 0.5 percent of the budget. While a slight surplus is currently projected for FY 2016 year‐end, fiscal discipline will s ll be encouraged to mi gate any unplanned events.
Dedicated Uses $640.6
79%
FY 2016 Approved General Fund Budget
Page 12
FY 2016 General Fund Budget ‐ $812.4 Million (amounts in million)
An cipa ng Challenges
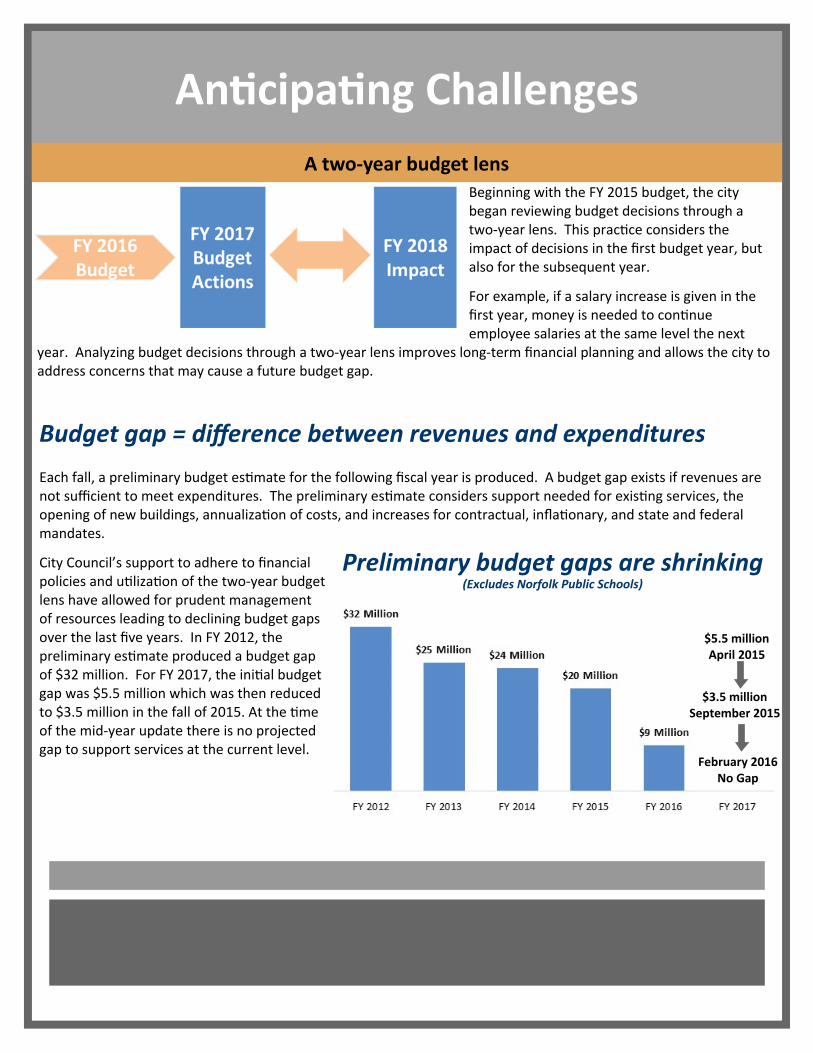
A two‐year budget lens Beginning with the FY 2015 budget, the city began reviewing budget decisions through a two‐year lens. This prac ce considers the impact of decisions in the first budget year, but also for the subsequent year.
For example, if a salary increase is given in the first year, money is needed to con nue employee salaries at the same level the next
year. Analyzing budget decisions through a two‐year lens improves long‐term financial planning and allows the city to address concerns that may cause a future budget gap.
Budget gap = difference between revenues and expenditures
Each fall, a preliminary budget es mate for the following fiscal year is produced. A budget gap exists if revenues are not sufficient to meet expenditures. The preliminary es mate considers support needed for exis ng services, the opening of new buildings, annualiza on of costs, and increases for contractual, infla onary, and state and federal mandates.
City Council’s support to adhere to financial policies and u liza on of the two‐year budget lens have allowed for prudent management of resources leading to declining budget gaps over the last five years. In FY 2012, the preliminary es mate produced a budget gap of $32 million. For FY 2017, the ini al budget gap was $5.5 million which was then reduced to $3.5 million in the fall of 2015. At the me of the mid‐year update there is no projected gap to support services at the current level.
$5.5 million April 2015
$3.5 million September 2015
February 2016 No Gap
Preliminary budget gaps are shrinking (Excludes Norfolk Public Schools)

Laying the Budget Founda on
Fiscal outlook—Some assembly required
As the next fiscal year’s budget is developed, base budget costs (meaning what it costs to maintain the current level) are established as the first step. Second, es mates are refined for healthcare and re rement, infla on, contractual, and state and federal mandated increases, any change in debt service payments, and support for new facili es coming on‐line. At this point of budget development, money needed for new ini a ves, enhancement of exis ng services, or new salary increases are not included.
What it costs to maintain the same level next fiscal year
Looking ahead to the next five to ten years
Recent economic data and local revenue collec ons show that ci es are beginning to move beyond the effects of the recession; Norfolk is as well. For financial planning, it is important to evaluate if those trends will con nue. The financial outlook presented during the mid‐year update is our best analy cal es mate of the financial and economic climate ahead.
The annual mid‐year update uses a data‐driven approach analyzing recent history, the progress of the current fiscal year, and the projected road ahead (FY 2017 and beyond). Na onal and state economic trends are factored into the analysis. In addi on, input from city departments on future costs are included.
Benefits (healthcare/re rement)‐$3.9 million
FY 2017 Base Budget
Growth Over FY 2016
$14.0 million
Annualiza on of salaries‐$2.4 million
Debt Payments‐$4.0 million
New facili es‐$1.3 million
Net all other‐$2.4 million
Page 14
Looking Ahead
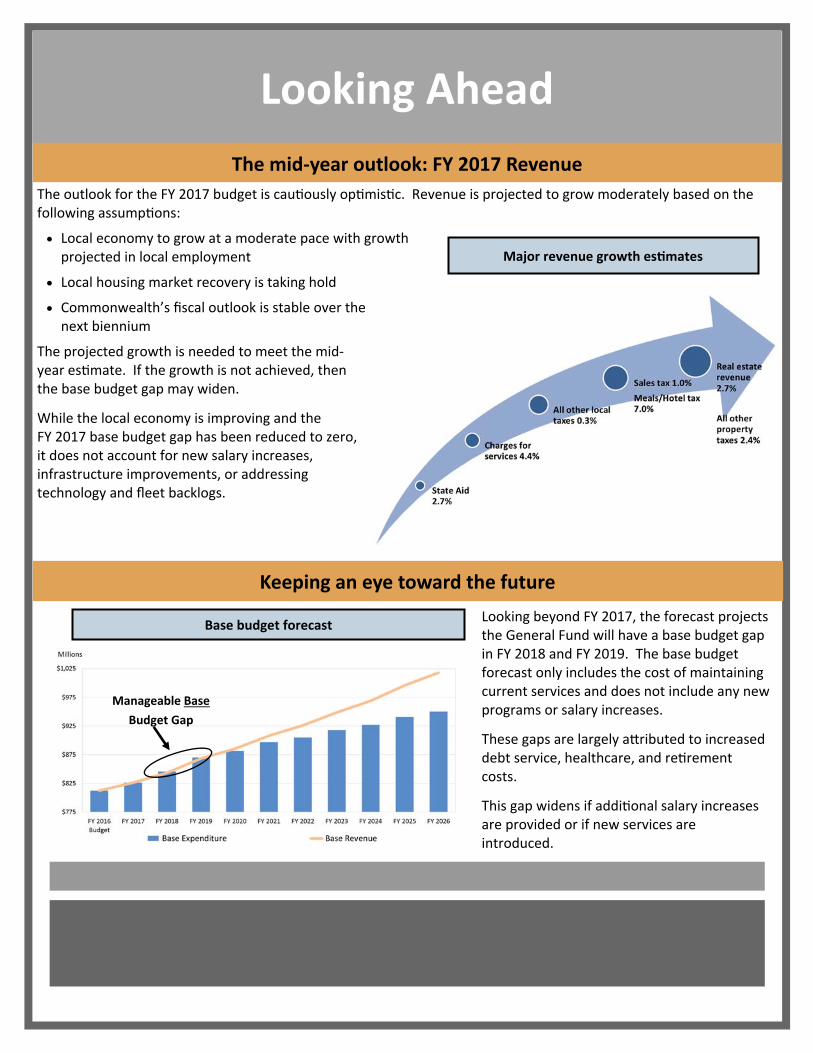
The mid‐year outlook: FY 2017 Revenue
Keeping an eye toward the future
The outlook for the FY 2017 budget is cau ously op mis c. Revenue is projected to grow moderately based on the following assump ons:
Local economy to grow at a moderate pace with growth projected in local employment
Local housing market recovery is taking hold
Commonwealth’s fiscal outlook is stable over the next biennium
The projected growth is needed to meet the mid‐year es mate. If the growth is not achieved, then the base budget gap may widen.
While the local economy is improving and the FY 2017 base budget gap has been reduced to zero, it does not account for new salary increases, infrastructure improvements, or addressing technology and fleet backlogs.
Major revenue growth es mates
Looking beyond FY 2017, the forecast projects the General Fund will have a base budget gap in FY 2018 and FY 2019. The base budget forecast only includes the cost of maintaining current services and does not include any new programs or salary increases.
These gaps are largely a ributed to increased debt service, healthcare, and re rement costs.
This gap widens if addi onal salary increases are provided or if new services are introduced.
Base budget forecast
Manageable Base
Budget Gap

Healthcare and Re rement
Providing Excep onal Benefits
Healthcare Providing healthcare is a major cost driver. The total cost of providing healthcare for employees and their families is over $33.3 million annually. Of that, the city contributes almost 79.4% or $26.5 million. Typically, the annual increase in these costs surpasses the annual increase in the Consumer Price Index (CPI).
In an cipa on of the Affordable Care Act (ACA) implementa on and the associated costs, the Norfolk Healthcare Consor um (City of Norfolk, Norfolk Public Schools, and the Norfolk Redevelopment and Housing Authority) transi oned from a fully insured to a self‐
administered model in FY 2015. City Council’s approval of this transi on avoided over $6.0 million in cost increases. The next major component of the ACA implementa on is the excise tax (Cadillac tax) on high cost health plans. This tax is scheduled to go in effect in 2020 and may result in a substan al cost increase.
Re rement Another major cost driver is re rement. Re rement benefits are paid from the re rement system that is administered by a board of trustees and monitored separately from other city funds. A funded status of 80 percent or higher is considered to be a financially sound system. As of June 30, 2015, the Norfolk Employees’ Re rement System was 84.8 percent funded, which is currently higher than the Virginia Re rement System (VRS).
In FY 2014 the implementa on of new accoun ng rules required a change in how re rement plan benefits are treated. These new rules require cost of living adjustments (COLAs) that are given year a er year to be considered a permanent annual benefit. This means that ad hoc COLAs can now be considered a permanent plan feature if provided in a regular pa ern. If a one percent COLA is provided every year, it will also be considered permanent. Providing either type of COLA, will cost an addi onal $1.6 million to $9.1 million for the General Fund and a decrease to the funded status.
As a result of these new accoun ng rules, in FY 2015 and FY 2016 a $300 bonus was provided to the most financially vulnerable re rees who invested at least 15 years of service (the same me period required to qualify for re ree healthcare) with the city. This equated to a 2.1 percent bonus for the average eligible re ree.
Employer costs con nue to increase
Page 16

Fostering an Engaged Workforce
A rac on, Reten on, Mo va on, and Development
Phase I (FY 2015) Phase II (FY 2016)
Living wage and market adjustments
Two percent General Wage Increase (GWI) for general and cons tu onal employees
Step increase for sworn Police, Fire, and Sheriff employees
One‐ me $300 supplement for qualified re rees
Living wage and market adjustments
Two percent GWI for general and cons tu onal employees
Three percent GWI for general employees in the lowest eight pay grades
Two percent GWI for temporary employees
Step increase for sworn Police, Fire, and Sheriff employees
One‐ me $300 supplement for qualified re rees
To be an employer of choice, the ARMD Ini a ve was implemented in FY 2015. This three‐year plan is dedicated to a rac ng and retaining quality employees by offering a compe ve total compensa on package. The ARMD Ini a ve also supports professional development through programs such as Master Police and Firefighter, tui on reimbursement, and the Supervisor’s Leadership Academy.
These programs are just a few examples of City Council’s commitment to Team Norfolk. The table below details some of the ac ons included in Phases I and II of the ARMD Ini a ve.
Na onally recognized employees
Dedicated employees with innova ve ideas are crucial to the city’s progress. Fleet Manager, Facundo Tassara, and Superintendent of Waste Management, Harvey Howard, are just two examples among the nearly 5,000 members of Team Norfolk who met that
challenge.
Facundo was named one of the “Top 20 under 40” government fleet professionals by Government Fleet Magazine. In FY 2015, Facundo was instrumental in achieving the city’s first recogni on as one of the “100 Best Fleets” in North America and pioneered the city’s first fleet of Compressed Natural Gas (CNG) vehicles.
Harvey was named Professional Manager of the Year‐Solid Waste by the American Public Works Associa on. He has been instrumental in substan ally reducing costs and customer complaints. Harvey also helped pioneer the use of GPS in waste management vehicles to op mize routes and streamline pick up services.
Facundo Tassara
Fleet Manager, 2016

Responsibly Financing Infrastructure
Debt Service: A major budget driver
The construc on of buildings, acquisi on of property, and repairs and improvements to roadways are expensive and cannot be paid for all at once. The city uses various methods to pay for these investments, such as cash, a line of credit, and the issuance of bonds. The bonds are typically repaid over a 20‐year period. Debt service is the repayment of the principal and interest on the bond financing. These investments are financed on a cash flow basis. As a result, projects are in various stages of repayment because new projects are authorized every year. Even though debt payments are completed for a project authorized years ago, it
does not significantly add capacity for new debt. This is because each year a new layer of projects are authorized and the amount of debt that rolls off is less than the amount of new authoriza on. Generally, debt is paid off in a level principal structure. This means that if a $20 million project is financed for 20 years, $1.0 million in principal is repaid each year. The interest payment on this project is higher in the beginning, but the total cost of financing is less than if the combined principal and interest payments were the same each year (like in a tradi onal mortgage payment structure).
Debt payments for a $20 million project
Page 18
Compared to the mortgage method, the city pays less interest over 20 years because more principal is paid during the first 10 years. The total cost would be higher using the mortgage method, because more interest is accrued while the ini al payments are lower.
Paying Off a $20 Million Project with Equal Principal Method Creates a Savings

Providing for Schools
Inves ng in new schools
Norfolk Public Schools (NPS) plays an integral role in the makeup of the city.
In Virginia, public school divisions are fiscally dependent on the local government. As a fiscally dependent school division, NPS does not levy taxes or issue debt. All funds are appropriated to NPS by City Council, which has authority to levy tax and incur debt.
Support for public schools is a shared cost between the state and the locality. During the recession, the state struggled to maintain support for K‐12 educa on. As such, the city back‐filled a por on of the revenue loss. While state funding is formula driven, the city provided funds well above the mandated required local effort. From FY 2011 to FY 2016, the city increased support for NPS by $12.2 million. This was three mes more than the Commonwealth’s increase of $4.0 million.
In addi on to providing opera ng money for NPS, the city provides capital funding to address the maintenance, renova on, and construc on for over 50 NPS facili es. In FY 2014, the city raised the real estate tax rate by four cents; City Council devoted two cents to the Construc on, Technology, and Infrastructure (CTI) program. This program was used to accelerate funding for school construc on, and address technology and infrastructure needs.
With the assistance of this dedicated revenue source, the city is construc ng five new schools. The projected cost of the five new schools, in addi on to the already completed Crossroads K‐8 school, is a combined $151.3 million. This financial commitment will be repaid over the next 20 years.
Constructed
Construc on Started
Planned
Suppor ng and strengthening our schools
City support for NPS has outpaced the Commonwealth
$151.3 Million Largest one‐ me school
investment ever
Ensuring On‐Going Stability
The road ahead
The mid‐year outlook projects a stable economic and fiscal environment ahead. The Commonwealth’s recovery is con nuing, the local housing market is emerging from the recession, and modest local employment growth is projected. However, as with any projec on, there are risks as unan cipated events are difficult to predict. These events may include:
Changes in the na onal or state economic outlook
Changes to state or federal support
Impact of a unplanned re ree COLA adjustments
Increased interest rates for capital financing
Outcome of the ACA excise tax and rising healthcare costs
Re rement investment returns below assumed rate
Other unforeseen events
The city is accountable in its commitment to the residents and businesses of Norfolk for the use of public funds to ensure adequate funding for services, public facili es, and infrastructure necessary to meet present and future needs. The financial policies implemented by City Council and sound financial management have strengthened the city’s planning for long‐term needs and financial sustainability.
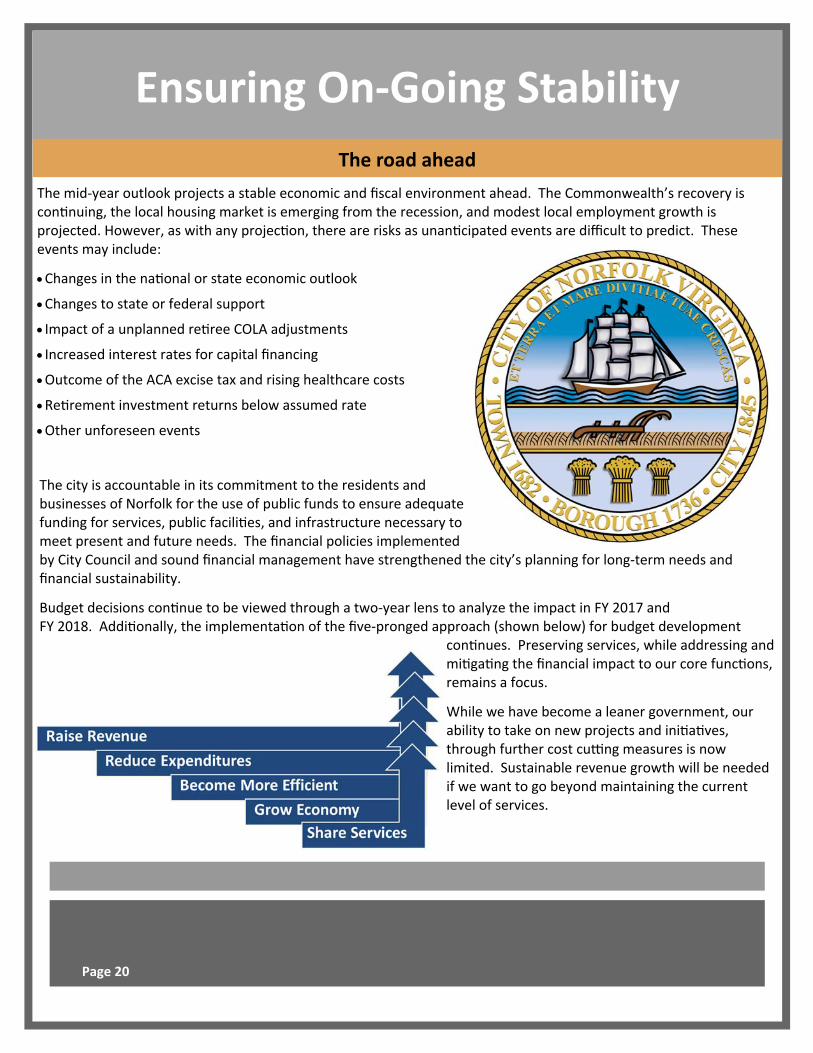
Budget decisions con nue to be viewed through a two‐year lens to analyze the impact in FY 2017 and FY 2018. Addi onally, the implementa on of the five‐pronged approach (shown below) for budget development
con nues. Preserving services, while addressing and mi ga ng the financial impact to our core func ons, remains a focus.
While we have become a leaner government, our ability to take on new projects and ini a ves, through further cost cu ng measures is now limited. Sustainable revenue growth will be needed if we want to go beyond maintaining the current level of services.
Page 20