Methods for determination of the accuracy of surgical...
110
UNIVERSITATIS OULUENSIS ACTA C TECHNICA OULU 2012 C 427 Tapani Koivukangas METHODS FOR DETERMINATION OF THE ACCURACY OF SURGICAL GUIDANCE DEVICES A STUDY IN THE REGION OF NEUROSURGICAL INTEREST UNIVERSITY OF OULU GRADUATE SCHOOL; UNIVERSITY OF OULU, FACULTY OF TECHNOLOGY, DEPARTMENT OF MECHANICAL ENGINEERING; FACULTY OF MEDICINE, INSTITUTE OF CLINICAL MEDICINE, DEPARTMENT OF NEUROSURGERY C 427 ACTA Tapani Koivukangas
Transcript of Methods for determination of the accuracy of surgical...
ABCDEFG
UNIVERS ITY OF OULU P.O.B . 7500 F I -90014 UNIVERS ITY OF OULU F INLAND
A C T A U N I V E R S I T A T I S O U L U E N S I S
S E R I E S E D I T O R S
SCIENTIAE RERUM NATURALIUM
HUMANIORA
TECHNICA
MEDICA
SCIENTIAE RERUM SOCIALIUM
SCRIPTA ACADEMICA
OECONOMICA
EDITOR IN CHIEF
PUBLICATIONS EDITOR
Senior Assistant Jorma Arhippainen
Lecturer Santeri Palviainen
Professor Hannu Heusala
Professor Olli Vuolteenaho
Senior Researcher Eila Estola
Director Sinikka Eskelinen
Professor Jari Juga
Professor Olli Vuolteenaho
Publications Editor Kirsti Nurkkala
ISBN 978-951-42-9903-2 (Paperback)ISBN 978-951-42-9904-9 (PDF)ISSN 0355-3213 (Print)ISSN 1796-2226 (Online)
U N I V E R S I TAT I S O U L U E N S I SACTAC
TECHNICA
U N I V E R S I TAT I S O U L U E N S I SACTAC
TECHNICA
OULU 2012
C 427
Tapani Koivukangas
METHODS FOR DETERMINATION OFTHE ACCURACY OF SURGICAL GUIDANCE DEVICESA STUDY IN THE REGION OF NEUROSURGICAL INTEREST
UNIVERSITY OF OULU GRADUATE SCHOOL;UNIVERSITY OF OULU,FACULTY OF TECHNOLOGY, DEPARTMENT OF MECHANICAL ENGINEERING;FACULTY OF MEDICINE, INSTITUTE OF CLINICAL MEDICINE, DEPARTMENT OF NEUROSURGERY
C 427
ACTA
Tapani Koivukangas
C427etukansi.kesken.fm Page 1 Thursday, August 16, 2012 11:41 AM

A C T A U N I V E R S I T A T I S O U L U E N S I SC Te c h n i c a 4 2 7
TAPANI KOIVUKANGAS
METHODS FOR DETERMINATIONOF THE ACCURACY OF SURGICAL GUIDANCE DEVICESA study in the region of neurosurgical interest
Academic dissertation to be presented with the assentof the Doctoral Training Committee of Technologyand Natural Sciences of the University of Oulu forpublic defence in OP-sali (Auditorium L10), Linnanmaa,on 21 September 2012, at 12 noon
UNIVERSITY OF OULU, OULU 2012

Copyright © 2012Acta Univ. Oul. C 427, 2012
Supervised byProfessor Kalervo Nevala
Reviewed byDoctor Erkki VahalaDoctor Jani Virtanen
ISBN 978-951-42-9903-2 (Paperback)ISBN 978-951-42-9904-9 (PDF)
ISSN 0355-3213 (Printed)ISSN 1796-2226 (Online)
Cover DesignRaimo Ahonen
JUVENES PRINTTAMPERE 2012
Koivukangas, Tapani, Methods for determination of the accuracy of surgicalguidance devices. A study in the region of neurosurgical interestUniversity of Oulu Graduate School; University of Oulu, Faculty of Technology, Department ofMechanical Engineering; Faculty of Medicine, Institute of Clinical Medicine, Department ofNeurosurgery, P.O. Box 5000, FI-90014 University of Oulu, FinlandActa Univ. Oul. C 427, 2012Oulu, Finland
Abstract
Minimally invasive surgery (MIS) techniques have seen rapid growth as methods for improvedoperational procedures. The main technology of MIS is based on image guided surgery (IGS)devices, namely surgical navigators, surgical robotics and image scanners. With their widespreaduse in various fields of surgery, methods and tools that may be used routinely in the hospital settingfor “real world” assessment of the accuracy of these devices are lacking.
In this thesis the concept of accuracy testing was developed to meet the needs of qualityassurance of navigators and robots in a hospital environment. Thus, accuracy was defined as thedifference between actual and measured distances from an origin, also including determination ofdirectional accuracy within a specific volume. Two precision engineered accuracy assessmentphantoms with assessment protocols were developed as advanced materials and methods for thecommunity. The phantoms were designed to include a common region of surgical interest (ROSI)that was determined to roughly mimic the size of the human head. These tools and methods wereutilized in accuracy assessment of two commercial navigators, both enabling the two most widelyused tracking modalities, namely the optical tracking system (OTS) and the electromagnetictracking system (EMTS). Also a study of the accuracy and repeatability of a prototype surgicalinteractive robot (SIRO) was done. Finally, the phantoms were utilized in spatial accuracyassessment of a commercial surgical 3D CT scanner, the O-Arm.
The experimental results indicate that the proposed definitions, tools and methods fulfill therequirements of quality assurance of IGS devices in the hospital setting. The OTS and EMTStracking modalities were nearly identical in overall accuracy but had unique error trends. Also, theaccuracy of the prototype robot SIRO was in the range recommended in the IGS community.Finally, the image quality of the O-Arm could be analyzed using the developed phantoms. Basedon the accuracy assessment results, suggestions were made when setting up each IGS device forsurgical procedures and for new applications in minimally invasive surgery.
Keywords: accuracy assessment phantom, accuracy assessment protocol, image-guidedsurgery, medical imaging, region of surgical interest (ROSI), surgical navigation,surgical robotics


Koivukangas, Tapani, Kirurgisten paikannuslaitteiden tarkkuudenmääritys-menetelmiä. Tutkimus neurokirurgisessa kohdealueessaOulun yliopiston tutkijakoulu; Oulun yliopisto, Teknillinen tiedekunta, Konetekniikan osasto;Lääketieteellinen tiedekunta, Kliinisen lääketieteen laitos, Neurokirurgia, PL 5000, 90014 OulunyliopistoActa Univ. Oul. C 427, 2012Oulu
Tiivistelmä
Mini-invasiivisen eli täsmäkirurgian tekniikoita ja teknologioita on alettu hyödyntää viime aikoi-na yhä enemmän. Tavoitteena on ollut parantaa kirurgisten operaatioiden tarkkuutta ja turvalli-suutta. Täsmäkirurgiassa käytetyt teknologiat pohjautuvat kuvaohjattuihin kirurgisiin paikannus-laitteisiin. Kuvaohjattuihin laitteisiin kuuluvat navigaattorit, kirurgiset robotit ja kuvantalaitteet.Näiden laitteistojen kehittyminen on mahdollistanut tekniikoiden hyödyntämisen monialaisessakirurgiassa. Paikannuslaitteistojen ja robottien yleistyminen on kuitenkin nostanut sairaaloissaesiin yleisen ongelman paikannustarkkuuden määrittämisessä käytännön olosuhteissa.
Tässä väitöskirjassa esitetään kirurgisten yksiköiden käyttöön menetelmä sekä kaksi uuttafantomia ja protokollaa käytössä olevien paikannuslaitteistojen tarkkuuden määrittämiseen. Fan-tomit suunniteltiin sisältämään ennalta määritetty kirurginen kohdealue, mikä rajattiin käsittä-mään ihmisen kallon tilavuus. Fantomeita ja protokollaa hyödynnettiin kahden kaupallisen pai-kannuslaitteen tarkkuuden määrityksessä. Navigaattorit käyttivät optiseen ja elektromagneetti-seen paikannukseen perustuvaa tekniikkaa. Lisäksi työssä kehitetyillä menetelmillä tutkittiinprototyyppivaiheessa olevan kirurgisen robotin paikannus- ja toistotarkkuutta sekä tietokoneto-mografialaitteen O-kaaren kuvan tarkkuuden määritystä.
Kokeellisten tulosten perusteella työssä kehitetyt fantomit ja protokollat ovat luotettavia jatarkkoja menetelmiä kirurgisten paikannuslaitteistojen tarkkuuden määrittämiseen sairaalaolois-sa. Kirurgisten navigaattoreiden tarkkuuden määritystulokset osoittivat optisen ja elektromag-neettisen paikannustekniikan olevan lähes yhtä tarkkoja. Prototyyppirobotin tarkkuus oli tulos-ten perusteella kirjallisuudessa esitettyjen suosituksien mukainen. Lisäksi O-kaaren kuvanlaatuavoitiin tutkia kehitetyillä fantomeilla. Tarkkuudenmääritystulosten perusteella työssä ehdotetaanmenetelmiä laitteistojen optimaalisesta käytöstä leikkaussalissa sekä laajennetaan niiden käyttö-mahdollisuuksia. Tuloksia voidaan hyödyntää myös paikannuslaitteistojen kehittämistyössä.
Asiasanat: kirurginen kohdealue, kirurginen navigointi, kirurginen robotiikka,kuvaohjattu kirurgia, lääketieteellinen kuvantaminen, tarkkuudenmääritysfantomi,tarkkuudenmääritysprotokolla


To my family

8

9
Acknowledgments
This research work was carried out at the Departments of Neurosurgery and
Mechanical Engineering, University of Oulu, and the Neurosurgical Research
Unit, Oulu University Hospital, during 2008–2011 and completed in 2012.
I wish to express my warmest thanks to my supervisor, Professor Kalervo
Nevala, D.Sc. (Tech), for his valuable support and advice in the process of this
research and my doctoral studies in the field of mechanical engineering.
My sincerest thanks are due to hospital physicist Jani Katisko, Ph.D., from
the Department of Neurosurgery and the Neurosurgical Research Unit for his
invaluable help and advice throughout this entire project. His guidance especially
in the designing of the phantoms and in assessing the accuracies of the surgical
guidance devices with the phantoms proved indispensable.
The research sites of this work have pioneered intra-operative ultrasound
imaging, neuronavigation and intraoperative MRI. I am grateful to the people
who have been involved in this work and the staff of the Research Unit for
providing the tools and facilities for this thesis. I wish to thank Senior Lecturer
Yrjö Louhisalmi, Lic.Sc. (Tech), and Tomi Makkonen, M.Sc., from the
Department of Mechanical Engineering, for their support in this research and in
article preparation.
My thesis reviewers, Erkki Vahala, Ph.D., and Jani Virtanen, Ph.D., are also
thanked for their valuable advice and guidance in finalizing this thesis.
My warmest thanks are due to my parents, my father, Professor of
Neurosurgery John Koivukangas, M.D., Ph.D., and my mother, Docent of Health
Economics Pirjo Koivukangas, Ph.D. (Econ), for their advice in this project and
throughout my studies at the University of Oulu and the University of Minnesota
in Minneapolis, USA. Unnoticeably they provided me with the basis for research
especially in the field of biomedical engineering by taking me together with my
siblings along on their many conference and research trips abroad since early
childhood.
My siblings and friends are also warmly thanked for their continual support
and interest in this research work.
Also my colleagues at Lewel Group Finland Oy, especially Mr. Jukka Kangas,
CEO, and Kari Auranaho, President, are thanked in particular for providing me
with necessary time for completing this thesis and for providing me with an
inspiring work environment in the development of medical devices.

10
I am grateful to the Graduate School of Concurrent Mechanical Engineering,
Academy of Finland, University of Oulu Graduate School, and University of
Oulu Research and Innovation Services for financial support in finishing this
thesis work. This research work was also financially supported by the following
foundations: The Finnish Cultural Foundation, Emil Aaltonen Foundation,
Finnish Foundation for Technology Promotion, Finnish Society of Electronics
Engineers, Elektronikkainsinöörien Seura ry and the Riitta ja Jorma J. Takasen
säätiö.
Most importantly I wish to thank my dear wife, Minna, and my two sons,
Gabriel and Rudolf for their continual support for my work and studies and also
for providing me the most important aspects of life. Their understanding on
daddy’s long work days, short holidays and necessary conference trips away from
home has been appreciated.
Oulu, 21.9.2012 Tapani Koivukangas
11
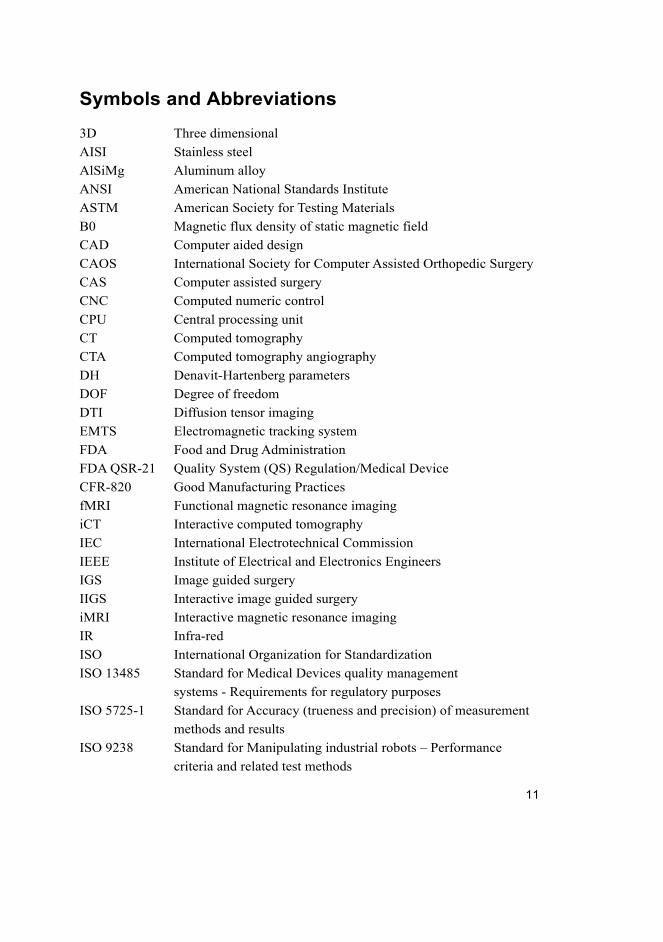
Symbols and Abbreviations
3D Three dimensional
AISI Stainless steel
AlSiMg Aluminum alloy
ANSI American National Standards Institute
ASTM American Society for Testing Materials
B0 Magnetic flux density of static magnetic field
CAD Computer aided design
CAOS International Society for Computer Assisted Orthopedic Surgery
CAS Computer assisted surgery
CNC Computed numeric control
CPU Central processing unit
CT Computed tomography
CTA Computed tomography angiography
DH Denavit-Hartenberg parameters
DOF Degree of freedom
DTI Diffusion tensor imaging
EMTS Electromagnetic tracking system
FDA Food and Drug Administration
FDA QSR-21 Quality System (QS) Regulation/Medical Device
CFR-820 Good Manufacturing Practices
fMRI Functional magnetic resonance imaging
iCT Interactive computed tomography
IEC International Electrotechnical Commission
IEEE Institute of Electrical and Electronics Engineers
IGS Image guided surgery
IIGS Interactive image guided surgery
iMRI Interactive magnetic resonance imaging
IR Infra-red
ISO International Organization for Standardization
ISO 13485 Standard for Medical Devices quality management
systems - Requirements for regulatory purposes
ISO 5725-1 Standard for Accuracy (trueness and precision) of measurement
methods and results
ISO 9238 Standard for Manipulating industrial robots – Performance
criteria and related test methods
12
kHz kilohertz
kVp peak kilo-voltage
LED Light emitting diode
mAs milliampere second
MAUDE The Manufacturer and User Facility Experience Database,
an online database of the FDA
MIS Minimally invasive surgery
MR Magnetic resonance
MRA Magnetic resonance angiography
MRI Magnetic resonance imaging
MRS Magnetic resonance spectroscopy
mT millitesla
NBS Navigated brain stimulation
NDI Northern Digital Inc., Waterloo, ON, Canada
OTS Optical tracking system
PET Positron emission tomography
PMMA Thermoplastic – polymethylmethacrylate
PT Patient tracker
PubMed A database for biomedical literature, produced by the National
Library of Medicine, USA
RF Radio frequency
RMS Root mean square
ROSI Region of surgical interest
SIRO Surgical interactive robot developed into MRI
SPECT Single photon emission computed tomography
T Tesla
TMS Transcranial magnetic stimulation
TOF Time-of-flight
X-Ray Electromagnetic radiation
Symbols
ϵ Root mean square error (RMS) mm
σ Standard Deviation mm
µ Variance mm
95% CI Confidence interval of 95% mm
Eij Error at each corresponding accuracy assessment point mm
EMAX Maximum error mm
13
EMEAN Mean error mm
FLE Fiducial localization error mm
FRE Fiducial registration error mm
SD Standard deviation mm
TRE Target registration error mm
Xij Error of X-component at each accuracy assessment point mm
Yij Error of Y-component at each accuracy assessment point mm
Zij Error of Z-component at each accuracy assessment point mm
Trademarks
StealthStation Treon plus, StealthStation S7 and O-arm are registered trademarks
of Medtronic Navigation Inc., Louisville, CO, USA.

14

15
Contents
Abstract Tiivistelmä Acknowledgments 9
Symbols and Abbreviations 11
Contents 15
1 Introduction 17
1.1 Background ............................................................................................. 17
1.2 Research problem and objectives ............................................................ 19
1.3 Research scope and approach .................................................................. 21
1.4 Contribution ............................................................................................ 21
2 Review of the literature 23
2.1 Surgical guidance devices in IGS ............................................................ 23
2.1.1 General definitions of surgical guidance devices ......................... 23
2.1.2 Surgical navigation ....................................................................... 24
2.1.3 Surgical robotics ........................................................................... 32
2.1.4 Medical imagers ........................................................................... 37
2.2 Accuracy assessment of surgical guidance devices ................................ 39
2.2.1 Definition of accuracy of surgical guidance devices .................... 39
2.2.2 Accuracy assessment of surgical guidance devices ...................... 46
2.2.3 Instrument tracking error theory ................................................... 50
3 Development of advanced materials and methods based on
statistical formulation for the region of surgical interest 53
3.1 Accuracy assessment tools ...................................................................... 53
3.2 Accuracy assessment analysis ................................................................. 58
4 Results of accuracy assessment 63
4.1 Accuracy assessment of OTS .................................................................. 63
4.2 Accuracy assessment of EMTS ............................................................... 70
4.3 Comparison of the OTS and EMTS ........................................................ 74
4.4 Accuracy assessment of the SIRO .......................................................... 75
4.5 Spatial accuracy results of the O-Arm .................................................... 80
4.6 Summary of the research contributions ................................................... 86
5 Discussion 87
5.1 Accuracy assessment tools and methods for periodic testing of
IGS devices ............................................................................................. 87
5.2 Accuracy assessment of surgical navigators ........................................... 89

16
5.3 Accuracy assessment of the SIRO .......................................................... 91
5.4 Spatial accuracy of the O-Arm ................................................................ 94
6 Conclusions 95
References 99
17
1 Introduction
1.1 Background
Minimally invasive surgery (MIS) has been developed especially during the last
20 years for use in the operating room. It is largely based on navigation, that is, it
uses virtual imaging data registered to the patient to guide surgical procedures
(Howe & Matsuoka 1999, Zoppi et al. 2010, Stiehl et al. 2007, West & Maurer Jr.
2004).
The technological advance of computers and surgical planning has rapidly
increased the routine use of surgical guidance devices. Especially the period of
last few decades has been an era of major breakthrough inventions for safer
operations. Image guided surgery (IGS) is now a routinely used technique in
operations linking image data to the patient anatomy or, in the case of endoscopic
devices, following visual images displayed by these instruments.
Surgical guidance devices covered in this thesis are navigational tracking
systems, robots and an imaging scanner. The main advantage reached with these
surgical guidance devices is that the surgeon can perform operations closer to
sensitive structures in the patient. Also the incisions can be minimized and
tailored to the operation zone. This has led to more error-free operations and to
shorter postoperative recovery times (Alexander et al. 1995, Knappe et al. 2003,
Koivukangas et al. 1993, Simon 1997, Russell & Joskowicz 2009). The
adaptation of these surgical navigational techniques to operations has also led to
the concept of image guided surgery (IGS). IGS is usually based on preoperative
image data sets (Knappe et al. 2003) meaning that the surgeon has to account for
changes that occur during operation. To make these errors smaller another method
has also been developed. This method is called IIGS (Interactive Image Guided
Surgery) (Beaulieu et al. 2008). This technique is otherwise similar to IGS, but
during operation new images of the patient are taken as many times as necessary
(Knappe et al. 2003). With IIGS, the survival rates have been reported to increase
significantly (Hill et.al. 2000, Hosoda et al. 2011, Kubben et al. 2011, McGirt et
al. 2009, Nimsky 2011, Sanai & Berger 2008).
Prior to the adoption of IGS, operations were performed with the aid of pre-
operative images on a light box viewer or computer screen for finding the
disorders in human anatomy. The first major discovery in medical imaging was
the research done by Wilhelm Conrad Röntgen on November 8, 1895, when he
18
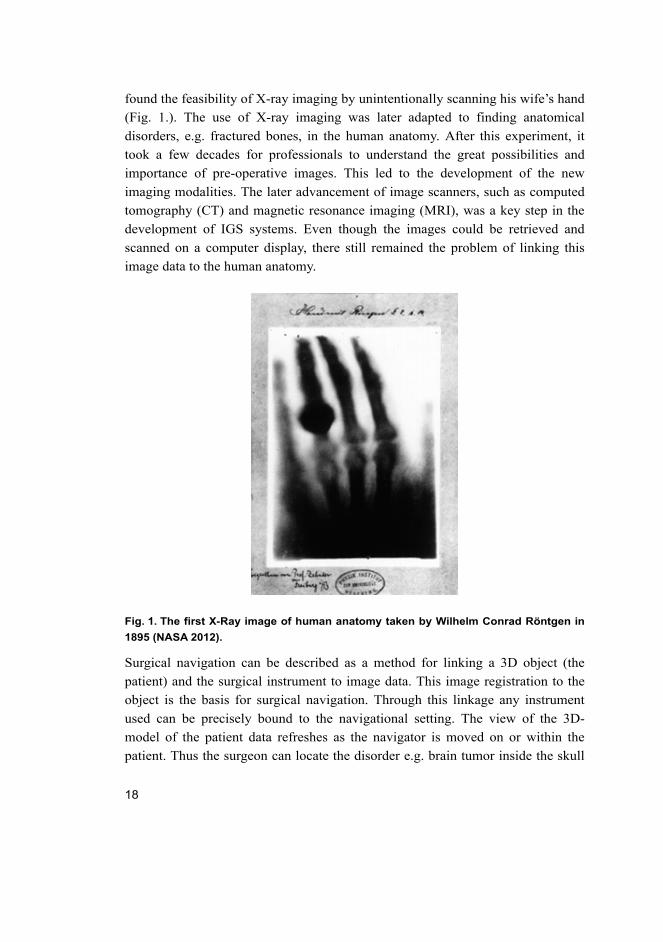
found the feasibility of X-ray imaging by unintentionally scanning his wife’s hand
(Fig. 1.). The use of X-ray imaging was later adapted to finding anatomical
disorders, e.g. fractured bones, in the human anatomy. After this experiment, it
took a few decades for professionals to understand the great possibilities and
importance of pre-operative images. This led to the development of the new
imaging modalities. The later advancement of image scanners, such as computed
tomography (CT) and magnetic resonance imaging (MRI), was a key step in the
development of IGS systems. Even though the images could be retrieved and
scanned on a computer display, there still remained the problem of linking this
image data to the human anatomy.
Fig. 1. The first X-Ray image of human anatomy taken by Wilhelm Conrad Röntgen in
1895 (NASA 2012).
Surgical navigation can be described as a method for linking a 3D object (the
patient) and the surgical instrument to image data. This image registration to the
object is the basis for surgical navigation. Through this linkage any instrument
used can be precisely bound to the navigational setting. The view of the 3D-
model of the patient data refreshes as the navigator is moved on or within the
patient. Thus the surgeon can locate the disorder e.g. brain tumor inside the skull
19
before opening the head. This has been a great achievement, e.g., in patient
operations. For example in tumor removing operations, the size of the surgical
opening has often diminished from the size of a fist to the size of a fingertip
(Fischer 2005, Knappe et al. 2003, Wiles et al. 2004).
As the use of surgical guidance devices rapidly increased, a variety of
technologies enabling this procedure were developed (Grunert et al. 2003,
Kwartowitz et al. 2006, Simon 1997). These guidance devices may be divided to
three main categories, namely surgical navigators, surgical robots, and medical
imagers.
Surgical navigators are classified by their instrument tracking system. The
basis for current surgical navigators has been the classical stereotactic frame
(Grunert et al. 2003). Navigators based on mechatronic digitizers were the first
devices that were used for operation guidance (Watanabe et al. 1987,
Koivukangas et al. 1993). Since then navigators based on the electromagnetic
tracking system (EMTS) and the optical tracking system (OTS) have been
adopted as the main tracking modalities.
Surgical robots are categorized using a functional classification and
technological classification depending on the nature of the manipulator. The
functional classification includes the following three classes: dexterity
enhancement, precision localization and precision manipulation. The
technological classification is divided into the following three aspects:
autonomous, supervisory and teleoperated (Madhavan et al. 2002).
Modern volumetric surgical imaging for IGS is primarily based on three
imaging techniques, CT (computed tomography), MRI (magnetic resonance
imaging) and US (ultrasound). These imaging modalities have complementary
rather than competing features (Alakuijala 2001, Chen & Pelizzari 1995). CT
clearly shows skeletal anatomy, while MRI and US provide information on the
soft tissues (Katisko 2012).
Quality regulations such as the ISO 13485 and FDA QSR-21CFR-820
together with local and international laws have been set for the medical device
industry. New medical devices undergo extensive testing and approval processes
before the use of these devices is actually approved for the market.
1.2 Research problem and objectives
Because of the large variation in guidance device technologies and applications,
manufacturers have not agreed on standardized methods for accuracy assessment
20
of surgical guidance devices (Clarke et al. 2008, Haidegger et al. 2010, Kroneif et
al. 2011, Stiehl et al. 2007, West & Maurer Jr. 2004, Wiles et al. 2004). Research
on accuracy analysis and standardization has been called for by international
groups and standardization organizations (Stiehl et al. 2007, Wiles et al. 2004).
Some accuracy assessment methods can be found in the literature, but they all
have their own protocols and accuracy assessment tools for unique applications.
Thus, the accuracies between the systems with these results are not directly
comparable. Earlier studies related to this topic concentrated on the accuracies of
these devices in general, providing information on the devices in the laboratory
environment. The most relevant standard for the purpose of accuracy assessment
of IGS devices was just recently published by the ASTM (American Society for
Testing Materials) in January 2011 (ASTM 2011). Since the standard was focused
on orthopedic procedures, there remain open questions for applying it to other
fields, e.g. neurosurgical procedures, and to scanners, such as the O-Arm
(Medtronic Inc., Louisville, CO, USA). Also, ASTM realized that their
standardization protocol is preliminary and leaves open the questions of phantom
design. Their assessment protocol is similar to that of the present study, which
was started in 2008.
Also, based on the extensive development and accuracy testing of several
surgical navigation methods at the Department of Neurosurgery, University of
Oulu, the need for in-hospital accuracy assessment tools and methods was
realized as each phase of development since the early 1990’s required customized
accuracy assessment methods.
This thesis concentrates on the technical accuracy assessment of surgical
guidance devices in detail. It gathers information on the accuracies of the optical
tracking system (OTS) and electromagnetic tracking system (EMTS) and the
image quality of the O-arm. Also the development and testing of an MRI
compatible robot is discussed. This thesis presents the tools and methods for
universal accuracy assessment that can be applied for all surgical guidance
devices enabling IGS.
IGS involves the following possible error sources: (Alakuijala 2001, Grunert
et al. 2003)
1. Technical accuracy
2. Registration accuracy
3. Application accuracy.
21
Since this thesis concentrated on the technical accuracy of IGS devices, and
registration accuracy dependence of the imager, specific objectives for this thesis
were (1) to design an accuracy assessment phantom with enough test points for
assessing the accuracies of the IGS guidance devices applied to the region of
surgical interest (ROSI) and manufactured using imaging scanner compatible
materials; (2) to design a technical accuracy assessment protocol according to
which the devices are tested; (3) to analyze the technical accuracies of the optical
tracking system (OTS), electromagnetic tracking system (EMTS), and a surgical
robot that was developed in a joint research project between the Technical
Research Center of Finland (VTT) and the University of Oulu (Heikkilä et al.
2012, Koivukangas et al. 2012, Virtanen 2006); and (4) to use the developed
phantoms to detect the spatial accuracy of a commercial surgical 3D CT scanner,
the O-arm.
1.3 Research scope and approach
This thesis addresses the issues regarding the different terminologies, definitions,
validation methods and analysis of accuracy by evaluating the used surgical
guidance devices with the developed accuracy assessment phantoms and
protocols. The results are also presented in a uniform manner providing the means
for quick and comprehensive comparison between the different IGS devices.
To address the objectives set for this thesis, the problems were approached by
determining the region of surgical interest (ROSI) for which accuracy assessment
phantoms and protocols were developed, and by investigating the accuracy
patterns and trends using these tools and methods. This was done by analyzing the
collected data from the devices and presenting the results in 3D-surfaces,
histograms, sequence plots and directional analysis. Two special accuracy
assessment phantoms and protocols for this purpose were designed and developed.
The phantoms consisted of three levels and 147 accuracy assessment points each.
The analyzed data was collected during 2008–2011 in various experimental
settings.
1.4 Contribution
This thesis presents methods for accuracy assessment of surgical guidance
devices based on experiences with the advanced methods using two special
phantoms and accuracy assessment protocols developed for this purpose
22
(Koivukangas et al. 2009, Koivukangas & Katisko 2010). The motivation of this
study was to find a way to periodically verify, in the real-world hospital setting,
the technical accuracy of surgical navigators and surgical robots in the region of
surgical interest (ROSI). Specifically, the geometrical relation between the camera
pair of OTS navigators and the scene was determined.
Two commercial navigators and a prototype surgical robot were used as the
surgical guidance devices assessed using the presented methods and tools. The
study showed the localization error trend of the assessed surgical navigators and
prototype surgical robot, and the direction in which the error tended to be highest.
Finally, a study of the spatial accuracy of a commercial CT scanner was
conducted utilizing the developed phantoms.
These results are important when setting up the operating room (OR) for
operations involving IGS devices. The accuracy assessment protocol together
with the phantom also proved to be a suitable way for periodic accuracy analysis
of the studied devices in the hospital setting.
The author of this thesis was primarily responsible for designing the accuracy
assessment phantoms and protocols and for the accuracy analysis. The author was
also a researcher in the robot project (SIRO), to which the technical accuracy
assessment methods were applied (Koivukangas et al. 2012).
23
2 Review of the literature
“Medicine is a science of uncertainty and an art of probability.”
Sir William Osler, Canadian physician
This chapter introduces the basis of the thesis with state-of-the-art devices and
methods. Section 2.1 is a general overview of image guided surgery devices.
Section 2.2 concentrates on the accuracy assessment of surgical guidance devices.
2.1 Surgical guidance devices in IGS
This section deals with the basic equipment in surgical guidance devices, the
phenomena behind the techniques, a comparison of the accuracies and the use of
the systems as defined in the literature. Section 2.1.2 deals with surgical
navigators and Section 2.1.3 with MRI compatible surgical robots in use today.
Finally, Section 2.1.4 introduces the commonly used imaging scanners.
2.1.1 General definitions of surgical guidance devices
Surgical navigators and robots are considered as surgical guidance devices for
image guided surgery (IGS) in this thesis. The use of these devices has seen rapid
growth in users among surgeons. Surgical navigation can be described as a
method of linking image data to a 3D object (the patient) and the surgical
instrument. This image registration to the object is the basis for surgical
navigation. Through this linkage the instrument used can be precisely bound to
the navigational setting. The view of the 3D-model of the patient images refreshes
as the navigator is used in the patient. The surgeon can locate the disorder, e.g.,
brain tumor inside the skull even before opening the head. This has been a great
achievement in patient operations. For example, in tumor removing operations,
the size of the surgical opening has often diminished from the size of a fist to the
size of a fingertip (Fischer 2005, Knappe et al. 2003, Wiles et al. 2004).
The classification of surgical guidance devices studied in this thesis consists
of three main categories:
24
1. Surgical navigators, which are classified by their method of determining the
position of the instrument in space.
2. Surgical robots, which are categorized by their functional and technological
classification.
3. Medical imagers, which are classified by the physics behind image scanning.
The development and integration of other operating room equipment, especially
the surgical microscope (Adams et al. 1996) and imaging systems including
ultrasound (Galloway et al. 1993, Koivukangas 1984) will also affect the choice
of IGS localization modality (Alakuijala 2001).
2.1.2 Surgical navigation
Surgical navigators are also called frameless navigation systems. This term is
adopted from earlier localization technologies, especially stereotaxic localization,
that uses a frame with position guides. The idea behind frameless IGS is to see the
tip or axis of the navigated instrument in the corresponding image data without
the need for a stereotactic frame for calculation (Grunert et al. 2003, West &
Maurer 2004). The purpose of surgical navigators in intraoperative use is to
provide the surgeon with real-time information on the location of the surgical
tools with respect to the anatomy during surgery. The goal is to improve the
surgeon’s hand/eye coordination in the region of surgical interest (ROSI), thus
improving the accuracy of surgical operations (Russell & Joskowicz 2009). The
basic components of surgical navigation systems are (after Russell & Joskowicz
2009, Schneberger 2004):
1. A real-time tracking system that follows the surgical instruments with respect
to the patient images
2. Surgical tools and reference frames that enable the tracking
3. Displays that show the intraoperative situation
4. A computer system that integrates the information.
Navigation uses images that are be based on the surgical procedure. The images
are transferred preoperatively in most cases, but as mentioned earlier, in the case
of IIGS new image data may be taken intraoperatively (Galloway et al. 1993,
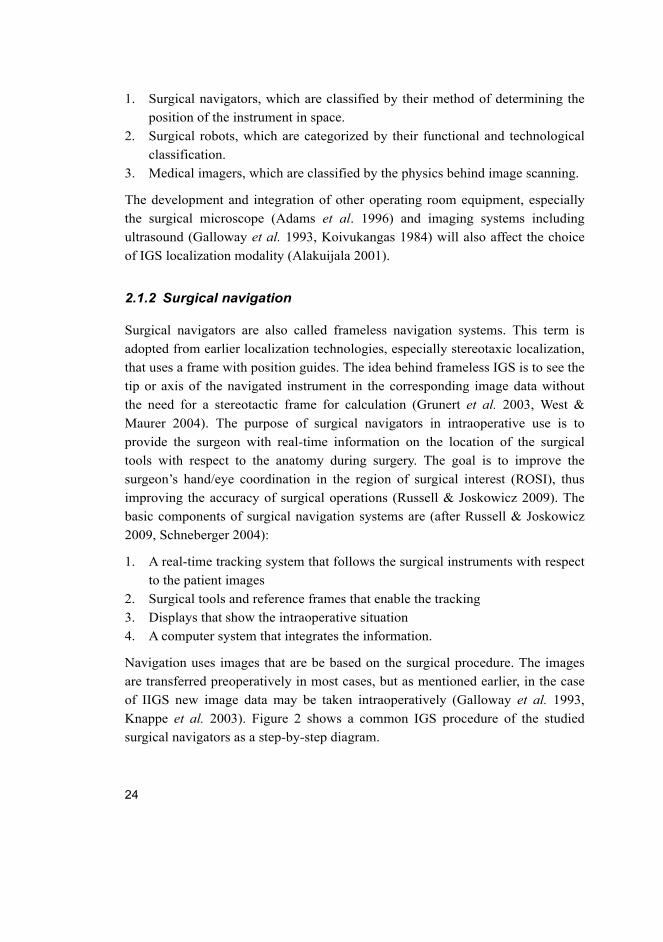
Knappe et al. 2003). Figure 2 shows a common IGS procedure of the studied
surgical navigators as a step-by-step diagram.
25
Fig. 2. The procedure of surgical navigation.
26
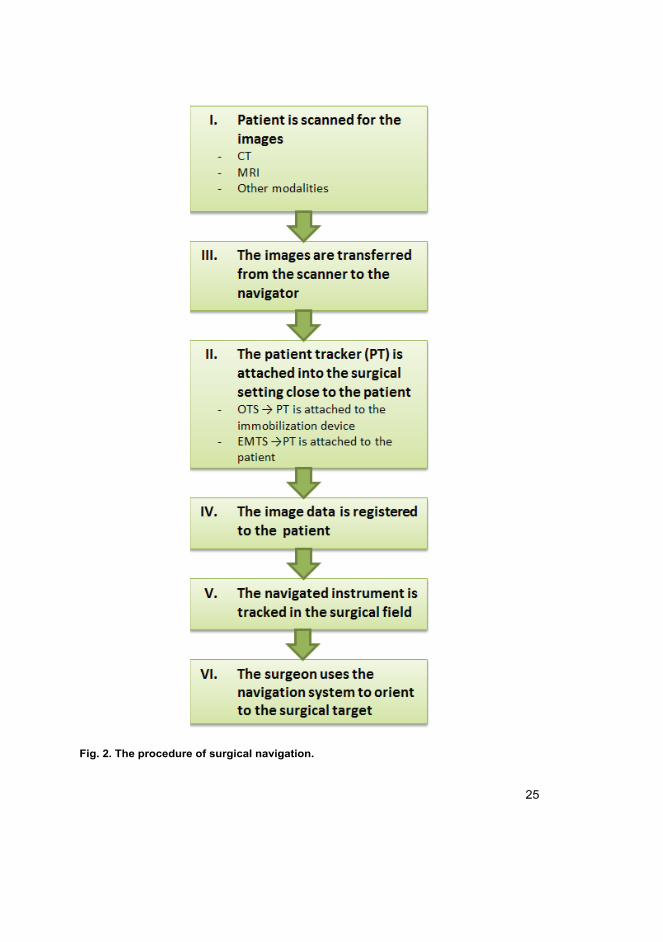
Navigators are classified by the nature of the tracking system. The optical
tracking system is the most commonly used tracking modality (Fischer 2005,
Schneider & Stevens 2008, Birkenfeller et al. 2008). In IGS it has become the
method of choice for a variety of surgical procedures (Chung et al. 2004). The
OTS consists of a receiver unit with two or more cameras and markers that are
calibrated to the system. In the IR-based OTS technique, the infrared cameras are
set to follow IR reflections from passive or IR emission from active markers on
the instruments and the patient tracker (PT). An optical band-pass filter is set to
eliminate all ambient light of other wavelengths, thus making identification of the
markers reliably simple. As the distance between the markers and the cameras
changes with respect to the PT, the place and the orientation of the instrument
with respect to the patient is calculated and shown on the display. Usually the PT
with the markers is attached to the patient directly or via the head holder, thus
immobilizing the reference system (Chung et al. 2004, Katisko 2012, Taylor &
Kazanzides 2007, West & Maurer Jr. 2004). This procedure is presented in Figure
3 (After Taylor & Kazanzides 2007).
Fig. 3. Surgical navigation procedure setup.

27
A typical camera model with two infra-red cameras is illustrated in Figure 4. This
figure shows the dependence on the camera placement of the area that the camera
views cover. The larger the intersecting view area, the larger the working area and
thus the more accurately the used instrument´s movements may be followed using
the markers. The image also shows the dependence between the two camera
coordinate systems and the working volume. In the Figure, ‘a’ and ‘b’ represent
the cameras’ first nodal points to their common viewing center and ‘α’ represents
the angle between the cameras. The camera model is presented in Cartesian
coordinates in such a way that the y-axes are coincident with the optical axes
representing the longitudinal distance from the camera to the navigated objects; x-
axes represent the lateral components in the camera coordinate systems. Z-axes
represent the view up vectors and thus the vertical parameters in the accuracy
assessment analysis.
Fig. 4. A typical camera model of the OTS with two IR cameras (After Madritsch 1996).
28
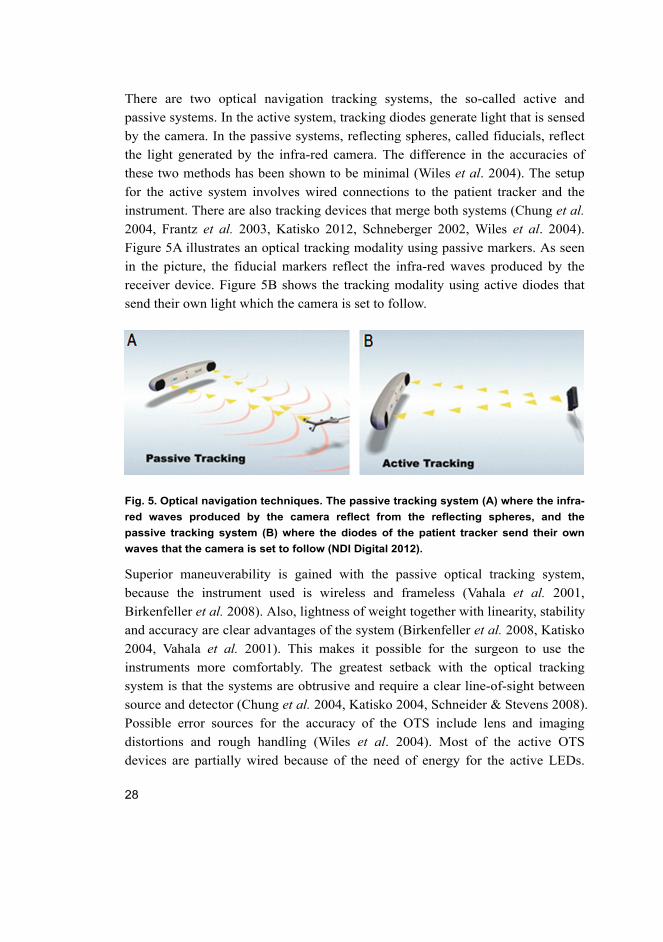
There are two optical navigation tracking systems, the so-called active and
passive systems. In the active system, tracking diodes generate light that is sensed
by the camera. In the passive systems, reflecting spheres, called fiducials, reflect
the light generated by the infra-red camera. The difference in the accuracies of
these two methods has been shown to be minimal (Wiles et al. 2004). The setup
for the active system involves wired connections to the patient tracker and the
instrument. There are also tracking devices that merge both systems (Chung et al.
2004, Frantz et al. 2003, Katisko 2012, Schneberger 2002, Wiles et al. 2004).
Figure 5A illustrates an optical tracking modality using passive markers. As seen
in the picture, the fiducial markers reflect the infra-red waves produced by the
receiver device. Figure 5B shows the tracking modality using active diodes that
send their own light which the camera is set to follow.
Fig. 5. Optical navigation techniques. The passive tracking system (A) where the infra-
red waves produced by the camera reflect from the reflecting spheres, and the
passive tracking system (B) where the diodes of the patient tracker send their own
waves that the camera is set to follow (NDI Digital 2012).
Superior maneuverability is gained with the passive optical tracking system,
because the instrument used is wireless and frameless (Vahala et al. 2001,
Birkenfeller et al. 2008). Also, lightness of weight together with linearity, stability
and accuracy are clear advantages of the system (Birkenfeller et al. 2008, Katisko
2004, Vahala et al. 2001). This makes it possible for the surgeon to use the
instruments more comfortably. The greatest setback with the optical tracking
system is that the systems are obtrusive and require a clear line-of-sight between
source and detector (Chung et al. 2004, Katisko 2004, Schneider & Stevens 2008).
Possible error sources for the accuracy of the OTS include lens and imaging
distortions and rough handling (Wiles et al. 2004). Most of the active OTS
devices are partially wired because of the need of energy for the active LEDs.
29
Exceptions to the common active OTSs are the navigators by Stryker Inc.
(Kalamazoo, MI, USA). The Stryker navigators, while being active, are wireless.
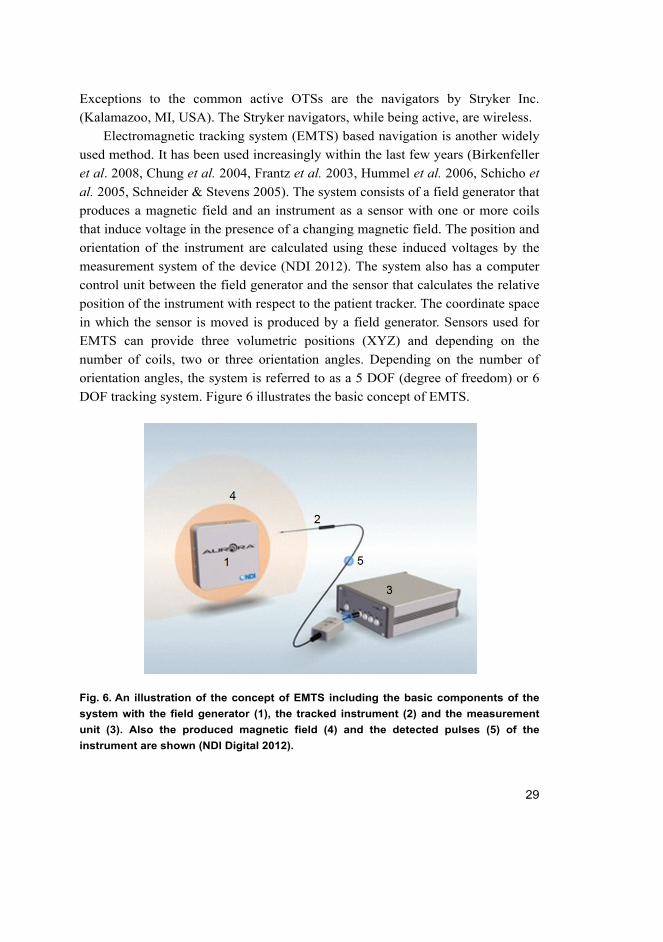
Electromagnetic tracking system (EMTS) based navigation is another widely
used method. It has been used increasingly within the last few years (Birkenfeller
et al. 2008, Chung et al. 2004, Frantz et al. 2003, Hummel et al. 2006, Schicho et
al. 2005, Schneider & Stevens 2005). The system consists of a field generator that
produces a magnetic field and an instrument as a sensor with one or more coils
that induce voltage in the presence of a changing magnetic field. The position and
orientation of the instrument are calculated using these induced voltages by the
measurement system of the device (NDI 2012). The system also has a computer
control unit between the field generator and the sensor that calculates the relative
position of the instrument with respect to the patient tracker. The coordinate space
in which the sensor is moved is produced by a field generator. Sensors used for
EMTS can provide three volumetric positions (XYZ) and depending on the
number of coils, two or three orientation angles. Depending on the number of
orientation angles, the system is referred to as a 5 DOF (degree of freedom) or 6
DOF tracking system. Figure 6 illustrates the basic concept of EMTS.
Fig. 6. An illustration of the concept of EMTS including the basic components of the
system with the field generator (1), the tracked instrument (2) and the measurement
unit (3). Also the produced magnetic field (4) and the detected pulses (5) of the
instrument are shown (NDI Digital 2012).
30
The greatest advantage reached with EMTS is that it does not require a clear line-
of-sight between the field generator and the sensor (Birkenfeller et al. 2008,
Chung et al. 2004, Frantz et al. 2003, Schicho et al. 2005, Schneider & Stevens
2005). Another advantage over the OTS is that since the sensing coils are close to
the tip of the tracked instrument, and thus closer to the point of interest, tracking
inside the human body with a flexible instrument is made possible. The
disadvantage with EMTS is that it is sensitive to errors especially with objects
consisting of metals in the presence of the magnetic field and thus very
challenging to make MRI compatible (Birkenfeller et al. 2008, Frantz et al. 2003,
Schicho et al. 2005). This limits the widespread use of EMTS in surgical
procedures. Miniaturization of the sensor coils has produced more applications to
IGS in recent years (Birkenfeller et al. 2008, Hummel et al. 2006).
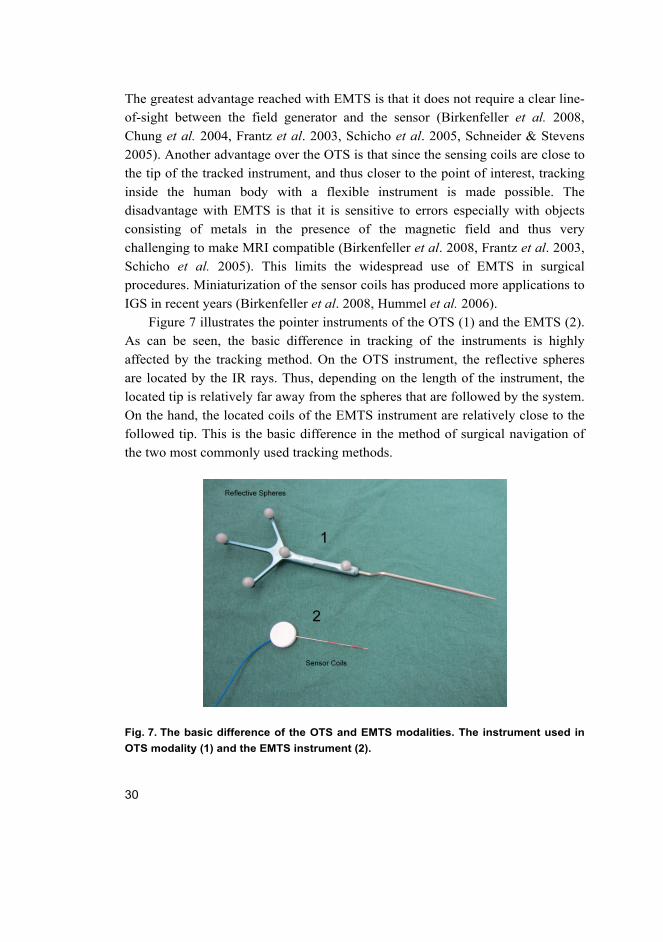
Figure 7 illustrates the pointer instruments of the OTS (1) and the EMTS (2).
As can be seen, the basic difference in tracking of the instruments is highly
affected by the tracking method. On the OTS instrument, the reflective spheres
are located by the IR rays. Thus, depending on the length of the instrument, the
located tip is relatively far away from the spheres that are followed by the system.
On the hand, the located coils of the EMTS instrument are relatively close to the
followed tip. This is the basic difference in the method of surgical navigation of
the two most commonly used tracking methods.
Fig. 7. The basic difference of the OTS and EMTS modalities. The instrument used in
OTS modality (1) and the EMTS instrument (2).
31
The mechatronic tracking system is based on the so-called mechanical digitizer.
The system consists of rigid segments and sensor encoded joints that are usually
optical encoders or potentiometers. The sensors are calibrated so that the
movement of the digitizer is sensed by the angular displacement of the segments
(Watanabe et al. 1987, Koivukangas et al. 1993). The position of the base of the
arm is rigid and known. As the instrument attached to the device is moved, the
sensors detect the movement and thus, using forward kinematics, the location of
the instrument tip (Watanabe et al. 1987) or the angular displacement and location
of the instrument axis (Koivukangas et al. 1993) is known with respect to the base
frame of the arm. This information is then graphically displayed on reformatted
planar images.
The main advantages gained using the mechanical digitizer are accuracy with
an error of 0.1–2.5 mm and no line-of-sight restriction. This makes it possible to
navigate the object to the extent of the length of the arm (Schiffbauer 1997). The
main setback with these systems is that they are relatively clumsy and heavy
(Schiffbauer 1997). This type of tracking is the basis of most of the current
surgical robots (Cleary & Nguyen 2001, Virtanen 2006). One of the newest is the
MR-compatible robot prototyped at the Department of Mechanical Engineering,
University of Oulu (Heikkilä et al. 2012, Koivukangas et al. 2012, Virtanen 2006).
Acoustic tracking typically uses a device that is based on ultrasound (US). It
is the least used of the tracking systems. The frequencies for range detection are
above the human hearing threshold at around 20 kHz. The simplest US device
uses a pair of transmitter/receivers coupled to obtain distance measurement. For a
3D location the modality needs a system of three transmitters and one receiver or
a system of one transmitter and three receivers (Birkenfeller et al. 2008, Hummel
et al. 2006, Roberts et al. 1986, Wood et al. 2005). Acoustic tracking is based on
either Time of Flight (TOF) or Phase Coherence technique for orientation and
displacement determination. TOF technique uses a process of triangulation of the
known speed of sound through the medium, the reflection delay and the distance
difference of the receivers. The Phase Coherence technique measures the phase
difference of the receiver and transmitter pulses (Wells 1977).
32
2.1.3 Surgical robotics
“I can’t define a robot, but I know one when I see one.”
Joseph Engelberger, pioneer in industrial robotics
General overview
Surgical robotics is a field that has improved rapidly within the last 30 years
(Heikkilä et al. 2012, Kwartowitz et al. 2006, Madhavan et al. 2002, Virtanen
2006). Within the last two decades a number of successful robotic systems have
been adopted into surgical use (Haidegger et al. 2010, Heikkilä et al. 2012, Howe
& Matsuoka 1999, MaRS 2010, Shiakolas et al. 2002, Virtanen 2006). In fact,
medical robotics is the fastest growing segment in the robotics industry today
(MaRS 2010). One reason for the rapid progression of robotics to surgical
applications is the large technology base that has been developed in robotics
research in the past three decades (Craig 1989, Khatib 1992).
Originally surgical robots were designed to perform simple tasks in ordinary
operating rooms such as holding instruments and guiding them into correct
positions. Robotics Institute of America has defined a robot as a re-programmable,
multi-functional manipulator designed to move material, parts, tools, or
specialized devices through various programmable motions for the performance
of a variety of tasks (Madhavan et al. 2002). Another definition of a robot by
Webster’s Dictionary is “an automatic device that performs functions normally
ascribed to humans or a machine in the form of a human.” In the beginning of
robotics, the applications were for industrial use in the late 1950’s and early
1960’s. The robots were then adapted to other fields and most recently also to the
medical device industry.
The development of robotics for surgery has experienced three main
advancement waves (Madhavan et al. 2002). At the outset in the mid 1980’s, the
robots were modified from industrial robots for simple assistive manipulators.
Then, at the end of 1980’s new robotic applications and technologies were
developed purely for the intention and needs of surgical procedures. Finally, the
most recent advances in surgical robotics date back to the late 1990’s as the robots
were actually performing surgical procedures. The first published robot assisted
closed chest bypass on the human heart was performed by surgeons at the London
33
Health Sciences Centre’s University campus in London, UK, in 1999 (Madhavan
et al. 2002).
The differences in human anatomy and machine characteristics are a way to
understand the advantages of using robots in surgery. The improvement of
robotics has led to unique capabilities for which the surgical robots may be used.
The main differences between the human and a machine are accuracy, precision
and repeatability to perform identical tasks (Alakuijala 2001, Ng et al.1993,
Howe & Matsuoka 1999). Another difference in the characteristics is that
specialized manipulator design allows the robots to work through incisions that
may be much smaller than those that a human would need. The robots used for
IGS can accurately guide instruments deep in the human anatomy without causing
harm to the body (Howe & Matsuoka 1999, Riviere et al. 1997). Robots may also
be used for reducing the surgeon’s involuntary hand movement during surgery
(Riviere et al. 1997) and to improve manual accuracy (Alakuijala 2001, Howe &
Matsuoka 1999, Kwartowitz et al. 2006, Riviere & Khosla 1997). The goal for
the use of surgical robotics is to complement and enhance the surgeon’s skills in
IGS operations, but also to always leave them in control and never to replace
them (Russell & Joskowicz 2009). “Surgical procedures need surgical robots –
industrial robots could be hazardous” (Drake et al. 1991).
Surgical robots are categorized into functional and technological
classifications by the nature of the manipulator (Madhavan et al. 2002). The
functional classification includes the following three classes: (After Madhavan et
al. 2002)
– Dexterity enhancement
The robots are controlled by a surgeon during surgery and are thus considered
as slave manipulators. These types of robots may be controlled from a remote
location
– Precision localization
The robots precisely locate a predetermined surgical target, for example, by
using pre-operative images
– Precision manipulation
The robots perform preoperatively programmed functions instead of
surgeon’s direct control.
The technological classification is divided into the following key aspects: (After
Madhavan et al. 2002)
34
– Autonomous
Robot control is based on preoperatively programmed plans and image data
– Supervisory
The robotic system guides the surgeon to accurately perform the operation
– Teleoperated
The robots may be controlled from a location geographically remote from the
operating room.
The surgical robots may be designed and controlled under these classifications.
The objectives for all surgical robotic systems are to provide better quality
operations and to perform the tasks programmed accurately and safely. Some of
the more specific objectives are minimal invasiveness and finer control.
As the imaging modalities have improved, so also the use of surgical robotics
has been made more acceptable and the system control more accurate especially
when preoperative or intraoperative images are used (Virtanen 2006).
The development of surgical robots for operational means is a potential
growth area for image-guided treatment procedures. Even with the finest design
and accuracy, the use of a robot for replacing a surgeon is highly unlikely to
happen. Instead, the robots may be designed to serve as tools for some phases in a
surgical procedure (Alakuijala 2001). Since robotic manipulators are able to do
small, precise maneuvers, surgical robotic systems are a good match for MIS
procedures (Kwartowitz et al. 2006).
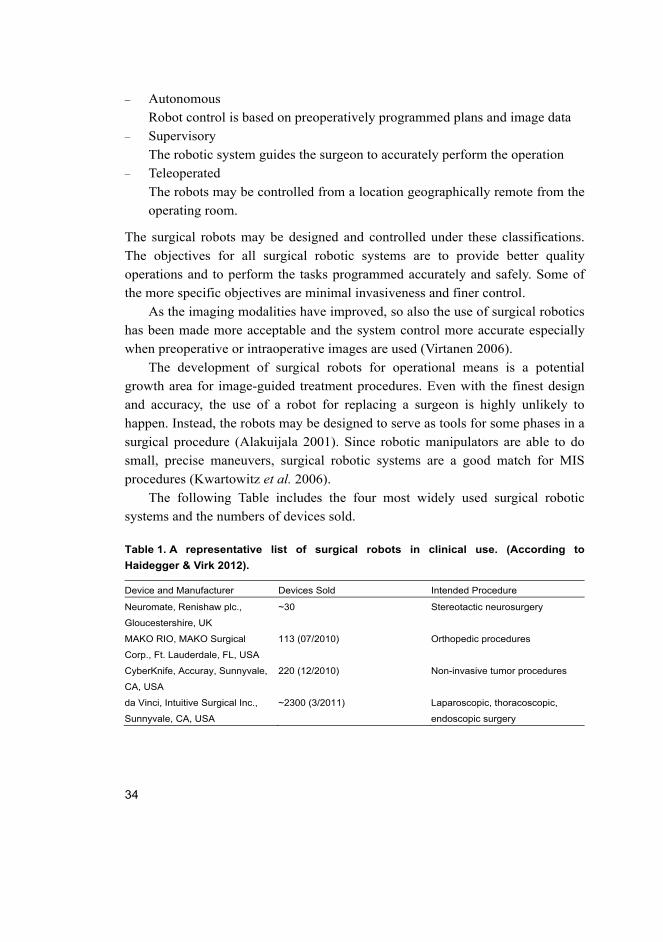
The following Table includes the four most widely used surgical robotic
systems and the numbers of devices sold.
Table 1. A representative list of surgical robots in clinical use. (According to
Haidegger & Virk 2012).
Device and Manufacturer Devices Sold Intended Procedure
Neuromate, Renishaw plc.,
Gloucestershire, UK
~30 Stereotactic neurosurgery
MAKO RIO, MAKO Surgical
Corp., Ft. Lauderdale, FL, USA
113 (07/2010) Orthopedic procedures
CyberKnife, Accuray, Sunnyvale,
CA, USA
220 (12/2010) Non-invasive tumor procedures
da Vinci, Intuitive Surgical Inc.,
Sunnyvale, CA, USA
~2300 (3/2011) Laparoscopic, thoracoscopic,
endoscopic surgery
35
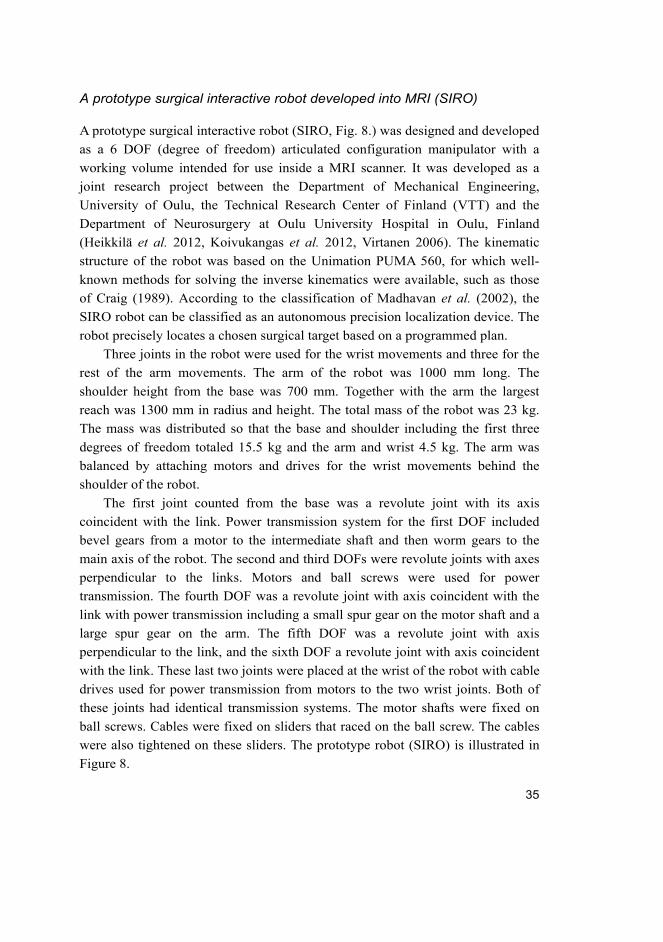
A prototype surgical interactive robot developed into MRI (SIRO)
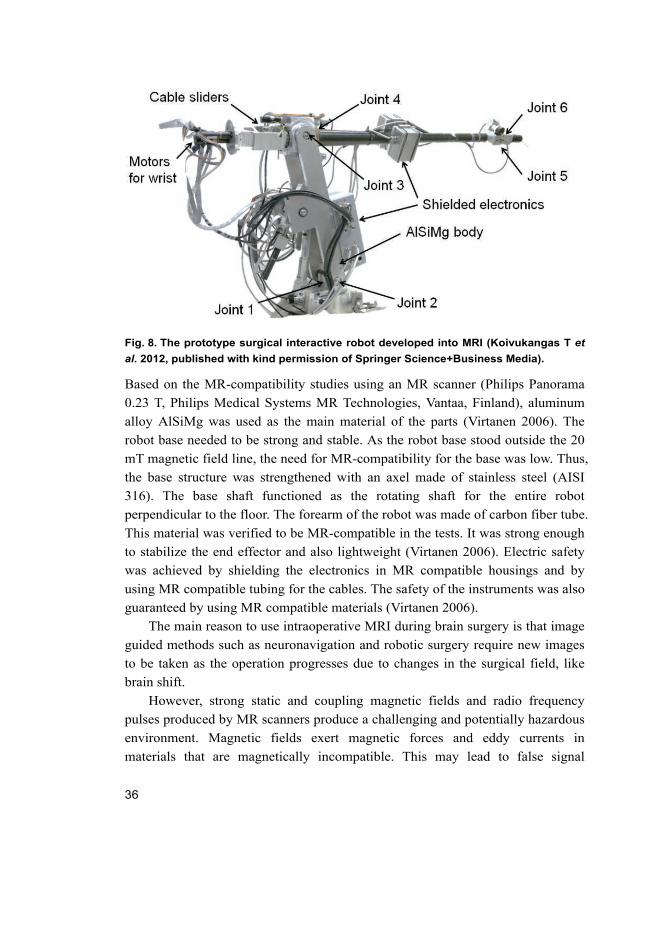
A prototype surgical interactive robot (SIRO, Fig. 8.) was designed and developed
as a 6 DOF (degree of freedom) articulated configuration manipulator with a
working volume intended for use inside a MRI scanner. It was developed as a
joint research project between the Department of Mechanical Engineering,
University of Oulu, the Technical Research Center of Finland (VTT) and the
Department of Neurosurgery at Oulu University Hospital in Oulu, Finland
(Heikkilä et al. 2012, Koivukangas et al. 2012, Virtanen 2006). The kinematic
structure of the robot was based on the Unimation PUMA 560, for which well-
known methods for solving the inverse kinematics were available, such as those
of Craig (1989). According to the classification of Madhavan et al. (2002), the
SIRO robot can be classified as an autonomous precision localization device. The
robot precisely locates a chosen surgical target based on a programmed plan.
Three joints in the robot were used for the wrist movements and three for the
rest of the arm movements. The arm of the robot was 1000 mm long. The
shoulder height from the base was 700 mm. Together with the arm the largest
reach was 1300 mm in radius and height. The total mass of the robot was 23 kg.
The mass was distributed so that the base and shoulder including the first three
degrees of freedom totaled 15.5 kg and the arm and wrist 4.5 kg. The arm was
balanced by attaching motors and drives for the wrist movements behind the
shoulder of the robot.
The first joint counted from the base was a revolute joint with its axis
coincident with the link. Power transmission system for the first DOF included
bevel gears from a motor to the intermediate shaft and then worm gears to the
main axis of the robot. The second and third DOFs were revolute joints with axes
perpendicular to the links. Motors and ball screws were used for power
transmission. The fourth DOF was a revolute joint with axis coincident with the
link with power transmission including a small spur gear on the motor shaft and a
large spur gear on the arm. The fifth DOF was a revolute joint with axis
perpendicular to the link, and the sixth DOF a revolute joint with axis coincident
with the link. These last two joints were placed at the wrist of the robot with cable
drives used for power transmission from motors to the two wrist joints. Both of
these joints had identical transmission systems. The motor shafts were fixed on
ball screws. Cables were fixed on sliders that raced on the ball screw. The cables
were also tightened on these sliders. The prototype robot (SIRO) is illustrated in
Figure 8.
36
Fig. 8. The prototype surgical interactive robot developed into MRI (Koivukangas T et al. 2012, published with kind permission of Springer Science+Business Media).
Based on the MR-compatibility studies using an MR scanner (Philips Panorama
0.23 T, Philips Medical Systems MR Technologies, Vantaa, Finland), aluminum
alloy AlSiMg was used as the main material of the parts (Virtanen 2006). The
robot base needed to be strong and stable. As the robot base stood outside the 20
mT magnetic field line, the need for MR-compatibility for the base was low. Thus,
the base structure was strengthened with an axel made of stainless steel (AISI
316). The base shaft functioned as the rotating shaft for the entire robot
perpendicular to the floor. The forearm of the robot was made of carbon fiber tube.
This material was verified to be MR-compatible in the tests. It was strong enough
to stabilize the end effector and also lightweight (Virtanen 2006). Electric safety
was achieved by shielding the electronics in MR compatible housings and by
using MR compatible tubing for the cables. The safety of the instruments was also
guaranteed by using MR compatible materials (Virtanen 2006).
The main reason to use intraoperative MRI during brain surgery is that image
guided methods such as neuronavigation and robotic surgery require new images
to be taken as the operation progresses due to changes in the surgical field, like
brain shift.
However, strong static and coupling magnetic fields and radio frequency
pulses produced by MR scanners produce a challenging and potentially hazardous
environment. Magnetic fields exert magnetic forces and eddy currents in
materials that are magnetically incompatible. This may lead to false signal
37
information, uncertainties in actuator control and dangerous forces acting on the
robot (Madhavan et al. 2002, Schenck 1996). From the point of view of
electromagnetic behavior and material technology, the solutions from
conventional robotics are not applicable as such. In addition, there are also
challenges from the conventional robotics point of view: the working space is
very limited, there is limited access to this space, and results of intraoperative MR
imaging need to be integrated to the work.
There has been active development of MRI compatible robotics, e.g., for
biopsies of brain (Masamune et al. 1995), breast (Larson B et al. 2004) and
prostate (Susil et al. 2003) lesions. Robots have also been under development for
specific types of working space depending on the design of the MR scanner
(Chinzei & Miller 2001, Tsekos et al. 2005). In addition, development towards a
general purpose device for use within the MR scanner has been reported (Tsekos
et al. 2008). Still, technology remains at the development phase involving
prototypes few of which have been tested in clinical conditions (Gassert et al.
2008, Sutherland et al. 2008).
2.1.4 Medical imagers
Medical imaging has become a vital component of a wide range of medical
applications (Hill et al. 2000). For IGS procedures, medical images are the main
source of information (Taylor & Kazanzides 2007). Thus the advancement of the
image scanners was a key step in the development of IGS systems. As imaging
technologies have improved, they have been adapted from clinical diagnostic
settings to preoperative surgery planning and intraoperative surgical procedures.
Especially the preoperative images are used commonly for several purposes.
In pre-surgical planning, the images are necessary data. Pre-surgical planning
is a key step in (I) understanding the patient’s anatomy and the patient’s disease,
and (II) developing the desired surgical procedure path and treatment approach.
The pre-surgical images are also used as the basic data in the actual IGS
procedure. The use of imaging technologies has improved the quality of patient
treatment significantly (Hill et al. 2000, Hosoda et al. 2011, Kubben et al. 2011,
McGirt et al. 2009, Nimsky 2011, Sanai & Berger 2008).
Since IGS procedures rely largely on image data, it needs to be of high-
quality to provide excellent differentiation between normal and abnormal tissues
especially in preoperative planning. In the actual IGS guided procedure, the
38
image data also needs to provide accurate representation of the patient (Holmes
III et al. 2008).
The imaging modalities are divided into two main categories: anatomical and
functional-metabolic.
– Anatomical modalities, i.e., depicting primarily morphology, include the most
commonly used techniques such as X-ray, CT, US and MRI. Some of the
techniques have been developed further for new applications. Such modalities
are for example: CTA (computed tomography angiography), DTI (diffusion
tensor imaging), MRA (magnetic resonance angiography) and MRS
(magnetic resonance spectroscopy).
– Functional or metabolic modalities, i.e., depicting primarily information on
the function or metabolism of the underlying anatomy, include fMRI
(functional magnetic resonance imaging), PET (positron emission
tomography), SPECT (single photon emission computed tomography) and
TMS (transcranial magnetic stimulation). Also a wide range of other
techniques can be named under functional modalities.
The most often used imaging methods are computed tomography (CT) and
magnetic resonance imaging (MRI) (Grunert et al. 2003). CT imaging is based on
the absorbance of X-rays in the object. Thus, it is mostly used for generating a 3D
image volume of patient tissue densities. CT imaging is a common imaging
modality especially for spinal orthopedic procedures, skeletal anatomy in general,
and with injected contrast material also vascular structure visualization (Holmes
III et al. 2008, Goldman 2007, Zannoni et al. 1997). In preoperative planning, CT
images have been reported to be used in nearly all disciplines of interventional
procedures (Holmes III et al. 2008). These disciplines include cardiology (Budoff
et al. 2006), neurosurgery (Haydel et al. 2000), radiation oncology (Lattanzi et al.
2004, Spencer 2001) and orthopedic surgery (Lattanzi et al. 2004). MR imaging
is based on the spin effect of the hydrogen atom and thus it is mostly used for soft
tissue imaging, e.g., brain imaging (Hendee & Morgan 1984). The basic
phenomenon of MRI is utilized in human anatomy imaging by measuring the
emission of RF energy within the varying magnetic field (Holmes III et al. 2008,
Katisko 2012, Schenck 1996).
Specifically, the intraoperative 3D CT scanning system that was studied in
this thesis, the O-arm (Medtronic Navigation Inc., Louisville, CO, USA) is a
surgical, mobile 2D/3D x-ray imaging system optimized for spinal and orthopedic
surgery. Scanning is based on a flat panel detector and cone-beam technology
39
producing 196 slices in 13 seconds in the standard mode. Pixel size is 0.415 ×
0.415 mm with a slice thickness of 0.833 mm. The size of the scanned cylindrical
3D volume is 21 cm × 16 cm (diameter × length).
2.2 Accuracy assessment of surgical guidance devices
This section reviews the definitions of accuracy and the assessment of the
accuracy of surgical guidance devices, concluding with the theory of instrument
tracking error applied in this thesis.
2.2.1 Definition of accuracy of surgical guidance devices
“Accuracy: An unmeasurable quantity that everyone has a number for,
nobody knows how they got it, and everyone wants more of.”
Neil Gossip & Richard Hu
As the use of surgical guidance devices and robotics has seen an increase in
minimally invasive surgery (MIS) (Howe & Matsuoka 1999, Stiehl et al. 2011,
Zoppi et al. 2010), also the need for the accuracy assessment of the IGS systems
has been realized. In present operating rooms standard procedures for assuring
safety have been adopted and standardized to most disciplines of medicine and
engineering. Today, organizations such as the International Organization for
Standardization (ISO) and the International Electrotechnical Commission (IEC) in
Europe, and the Institute of Electrical and Electronics Engineers (IEEE), the
American National Standards Institute (ANSI) and the American Society for
Testing Materials (ASTM) are among major organizations involved in setting
standards also for medical equipment. Since IGS crosses the disciplines of
electrical engineering, computer science, mechanical engineering and metrology
and the research is conducted transnationally, there is a lack of unified standards
for the accuracy assessment of surgical guidance devices.
When assessing the accuracy of surgical guidance devices, it is important to
define the terms “accuracy”, “precision” and “bias”. Also, it is important to
broaden the definition of these terms when applied to different devices and
applications of the guidance devices such as surgical navigators and surgical
robots. Accuracy in the current literature of surgical devices reflects different
attributes of a particular measurement. It may mean the standard deviation of a
number of measurements from a fixed object or it may relate to the closeness of

40
an instrument’s mean value compared to the known position. The most often used
standard in validating the accuracy of surgical guidance devices are the ISO 5725-
1:1994 “Accuracy (trueness and precision) of measurement methods and results”
(ISO 5725) and the ISO 9238 “Manipulating industrial robots – Performance
criteria and related test methods” (ISO 9238), which define accuracy as the
closeness of agreement between a test result and the accepted reference value.
Repeatability is an accuracy analysis method for robots. Repeatability is
defined as the ability of the robot to perform the planned motion and finish at the
same point. This term reflects the precision of the machine, but not the accuracy
of the system (Stiehl et al. 2007). Precision is a term defining a number of
measurements whose standard deviation is relatively small, although the mean of
these measurements is not necessarily close to the true value. Bias is the number
indicating the difference of the true value and the precision value. Thus, if the
mean of the precision corresponds to the true value, the system is unbiased.
Figure 9 illustrates the differences in the terms accuracy and precision. On the
first image on the left, the points are scattered on the edge of the target. Thus, the
system is neither accurate nor precise. On the second image the points are well
grouped on the outer edge of the target. This shows that the system is precise but
not accurate. On the third image, the points are accurately close to the center of
the target, but there is high scatter between the points. The system is thus accurate
but not precise. On the last image the points are grouped well in the center of the
target. This system is accurate and precise. This Figure set illustrates the basic
principles of accuracy assessment of surgical guidance devices.
Fig. 9. An illustration of the different aspects of accuracy terms used in IGS.
For surgical navigators, only the absolute position accuracy is considered relevant.
In surgical robotics also repeatability is considered as a main application accuracy
indicator (Mooring & Pack 1986). For robots in general, usually the repeatability
is higher than the absolute position accuracy.
41
In surgical navigation and robotics, the term “accuracy” needs to be divided
into three types of accuracies with the following arrangement: (Alakuijala 2001,
Grunert et al. 2003, Haidegger et al. 2010)
1. Technical accuracy (typically 0.1–0.6 mm)
2. Registration accuracy (typically 0.2–3 mm)
3. Application accuracy (typically 0.6–10 mm).
Technical accuracy indicates the reliability of the navigational device’s own
placement definition. It applies to the surgical guidance device’s mechanical
accuracy and describes the average error of the given component in operational
use (Grunert et al. 2003). Technical accuracy takes into account also the random
errors such as mechanical and electrical compliances, friction and hardware
problems, and inadequate control that may all result in lower technical accuracy.
Technical accuracy is thus highly affected by the mechanical quality of the used
devices. These errors and limitations are the compliances of the overall accuracy
that may be improved by engineers before using the devices for surgical
procedures. For these reasons, the technical accuracy of the navigational devices
should be higher than the registration accuracy (Grunert et al. 2003).
Registration accuracy is related to the coordinate transformation of the object
to the navigator image set. Registration accuracy is highly affected by the
technical accuracy of the device together with imaging device restrictions, the
type and form of markers used, displacement of the markers and determination of
the center of the markers. The accuracy is also affected by the resolution of the
used medical images, movement of the patient in the scanner gantry, the type of
imaging method used and the slice thickness of the image data. These are aspects
that should be taken into account when setting up the operational procedure. By
using the correct imaging parameters and by choosing the applicable registration
technique, the registration errors may be decreased (Grunert et al. 2003, Stiehl et
al. 2007).
Image artefacts can affect the diagnostic quality by decreasing the spatial
accuracy making them useless for diagnosis and thus for use in IGS procedures
(Barrett & Keat 2004, Erasmus et al. 2004). It is necessary to understand possible
causes for image artefact and also to have useful tools for inspecting the spatial
accuracy. Image artefact is a term applied to any systematic difference between
the images and the scanned object; some affect the diagnostic quality and some
may be confused with pathology (Barrett & Keat 2004, Erasmus et al. 2004). The
origin of different artefact of CT imaging may be categorized into: (I) physics-
42
based resulting from the physical process in the acquisition of CT data, (II)
patient-based artefact including patient movement and metallic objects in the
patient or in the close proximity, (III) scanner-based artefact resulting from the
imperfections in the scanner, and (IV) helical, multi-section and cone beam
artefact produced by image processing (Barrett & Keat 2004). Magnetic
resonance imaging (MRI) may also be affected by a number of different artefacts.
In particular, MRI is sensitive to spatial inaccuracies. The inaccuracy may
originate from the structure of the object, eddy currents in conductive objects and
scanner structures and other susceptibility issues of the scanned object caused by
air-tissue interface and water-fat interface (chemical artefact) (Schenk 1996).
MR artefacts are classified as (I) sequence artefact, (II) reconstruction
algorithm artefact, (III) field artefact and (IV) noise artefact. All of these four
main artefact sources originate either from the device hardware or from the
patient or as a total sum of both (Bellon et al.1986). Most common artefacts are
radiofrequency (RF) related, external magnetic field related and gradient field
related. Other artefacts include surface coil, bounce point and asymmetrical
brightness artefacts. External magnetic field (B0) inhomogeneity artefacts occur
when an object is brought inside the scanner. The result of B0 artefact is seen as
different tissues mismapping in the images. This is caused by the difference in the
magnetic field and the object homogeneity (Erasmus et al. 2004).
Application accuracy includes the overall error of the entire procedure. This
accounts for the technical accuracy of the device and the registration accuracy. It
shows how reliably the pointer tip of guidance device in physical space
corresponds to the anatomic position in the medical images during an operation.
It answers also to the loss of correspondence between the images and the
anatomical structure during procedures. Application accuracy limitations are due
to technical inaccuracy, registration inaccuracy, and deformations in the anatomy
of the patient during operation, such as brain shift. Application accuracy is the
most unpredictable type of accuracy in guidance device aided procedures. For
improving the application accuracy, while using more accurate guidance devices,
medical imagers and registration techniques, other techniques have been
introduced. A model updating method based on gravity-induced brain deformation
was introduced by Miga and co-workers (Miga et al. 1997). The experiments
showed that the error accounted for by brain-shift was improved from 5.7 mm to
1.2 mm. One of the more recent operational techniques is to use intraoperative
MRI, CT or US images and replace or match these images with the pre-operative
data sets (Koivukangas et al. 1993, Mösges & Schlöndorff 1998). This helps to
43
take into account the deformations in the anatomical structures and thus provides
more accurate locations of the structures to be removed and the locations of the
critical anatomical structures surrounding the disorder (Grunert et al. 2003).
A special case of OTS guided interventional procedure has been introduced
by Ruohonen & Karhu (2010). The OTS was used as a guidance device for
transcranial magnetic stimulation, the Nexstim eXimia NBS system (Nexstim Oy,
Helsinki, Finland). They reached a total application accuracy of the system of 5.7
mm. In the experiment, they found that the OTS accuracy was 1.6 mm.
Widmann et al. (2012) have also recently written a comprehensive review
article based on a PubMed literature search from 1995–2010 regarding
application accuracy of IGS devices. Mean total errors ranged between 4.4–5.4
mm for brain biopsies and 2.0–3.2 mm for depth electrode placements. However,
application accuracy is outside of the scope of the present study which centered
on technical accuracy. The latter must be assured as one of the physical bases of
application accuracy.
In accuracy assessment of surgical guidance devices, technical accuracy is the
segment of accuracy that can be improved solely by better equipment. By
developing devices that have higher standard components and more confident
operation, the accuracy of the device may be improved dramatically. Technical
accuracy is also possible to be assessed and improved before the actual operation.
Registration accuracy may be improved by correct imaging modality and optimal
imaging parameters. Also the decision of registration technique affects the overall
accuracy. The acceptable range of error and tolerable accuracy of a device
depends on the procedures for which surgical guidance devices are used
(Alakuijala 2001). The tolerable error range is naturally affected by the surgical
scene and possible devices and instruments used. For example, if the
neurosurgeon has a clear view of the operation zone and the object operated, the
need for accuracy of the guidance devices is lower than in the case of an object
deep in the brain. Also, if endoscopic cameras are used, the accuracy requirement
may be considered to be lower. Thus, it is unnecessary to give a number for
accepted application accuracy in millimeters. However, the accuracy of the
devices is intended to be improved and maintained in general. To improve the
accuracy of the surgical guidance devices and thus make the IGS procedures safer,
Nolte and coworkers have listed usability requirements for a position sensing and
tracking device (Alakuijala 2001, after Nolte et al. 1994):

44
1. Established surgical procedures should be principally preserved
2. The existing surgical tool set should remain the same
3. The system's technical accuracy should be at least one order of magnitude
better than the desired overall accuracy
4. The positioning system should be fast enough to allow real-time instrument
control and visualization in the medical image.
These are basic rules under which the IGS will remain under high standards and
the operation will remain safe. The rules also state the most important factors that
define the accuracy of surgical guidance devices. In general 3–5 mm RMS
accuracies for indirect IGS are considered acceptable, but for IG neurosurgery the
recommendation is 2 mm. For direct IGS assisted with a robot, the
recommendation for the RMS accuracy is less than one millimeter (Grunert et al.
2003).
In the current literature and publications of accuracy assessment for IGS
systems, there is a wide variety of experimental result analyses. This was realized
already at the CAOS International Society annual meeting held in Chicago in
2004 where a group of leading engineers and physicians began the process of
writing standardization guidelines (Clarke et al. 2008, Haidegger et al. 2010,
Kroneif et al. 2011, Stiehl et al. 2007, Wiles et al. 2004). International
organizations such as the American Society for Testing and Materials (ASTM)
and other international organizations are making efforts on standardizing IGS
devices accuracy assessment (Haidegger et al. 2010, Kroneif et al. 2011, Stiehl et
al. 2007, Zoppi et al. 2010). As a result of the CAOS annual meeting in Chicago,
ASTM initiated a standards committee (ASTM F04.05) in 2004 under the title
“Standards Practice for Measurement of Positional Accuracy of Computer
Assisted Surgical Systems (CAOS)” with the goal of developing an international
standard for metrology, validation and performance of CAOS systems (Clarke et
al. 2008, Haidegger et al. 2010, Stiehl et al. 2007). In 2007 ASTM F04.05, a
committee initiated by the ASTM for standardizing positional accuracy of
computer assisted orthopedic surgical systems (CAOS), defined and developed a
draft generic measurement board. Later, multi-institutional technical committees
have presented white papers and articles calling for tools for standardizing many
applications and areas of IGS and CAS (Chiao et al. 2008, Haidegger et al. 2010,
Kazanzides 2006, Kroneif et al. 2011). The first draft, presented in 2007, deals
with the localizer functions of navigation systems of OTS, EMTS and mechanical
digitizers.
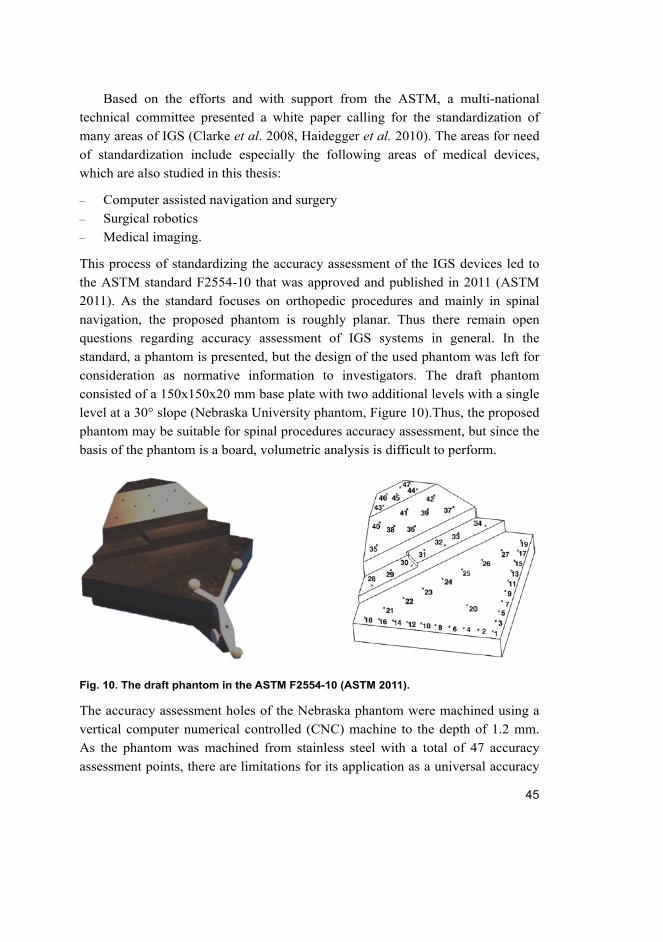
45
Based on the efforts and with support from the ASTM, a multi-national
technical committee presented a white paper calling for the standardization of
many areas of IGS (Clarke et al. 2008, Haidegger et al. 2010). The areas for need
of standardization include especially the following areas of medical devices,
which are also studied in this thesis:
– Computer assisted navigation and surgery
– Surgical robotics
– Medical imaging.
This process of standardizing the accuracy assessment of the IGS devices led to
the ASTM standard F2554-10 that was approved and published in 2011 (ASTM
2011). As the standard focuses on orthopedic procedures and mainly in spinal
navigation, the proposed phantom is roughly planar. Thus there remain open
questions regarding accuracy assessment of IGS systems in general. In the
standard, a phantom is presented, but the design of the used phantom was left for
consideration as normative information to investigators. The draft phantom
consisted of a 150x150x20 mm base plate with two additional levels with a single
level at a 30° slope (Nebraska University phantom, Figure 10).Thus, the proposed
phantom may be suitable for spinal procedures accuracy assessment, but since the
basis of the phantom is a board, volumetric analysis is difficult to perform.
Fig. 10. The draft phantom in the ASTM F2554-10 (ASTM 2011).
The accuracy assessment holes of the Nebraska phantom were machined using a
vertical computer numerical controlled (CNC) machine to the depth of 1.2 mm.
As the phantom was machined from stainless steel with a total of 47 accuracy
assessment points, there are limitations for its application as a universal accuracy
46
assessment tool for IGS devices. The phantom cannot be used for comprehensive
volume or depth analysis due to the limited spatial arrangement of the holes. Also,
the material chosen, namely stainless steel is not ideal for assessing the accuracy
of medical imagers.
In this thesis, the ISO 5725-1 standard is applied for the accuracy analysis of
surgical navigators and these standards together with ISO 9238 for the accuracy
assessment of the prototype surgical robot. Accuracy relates to the terms absolute
position accuracy and repeatability. Absolute position accuracy is a measure of
the device’s pointer tip in space with respect to the calculated coordinates and is
defined as the qualitative assessment of the measured value to the true measured
value. Thus, the use of a verified phantom with known coordinates for accuracy
assessment is accepted as a method of verification of the overall accuracy analysis.
The ASTM F2554-10 was used as a comparative tool in the analysis of the
presented methods.
2.2.2 Accuracy assessment of surgical guidance devices
Accuracy assessment of medical devices has been a vital part of the product
development of surgical guidance devices. The accuracy of the used surgical
guidance device during operations has to be verified. The surgeon needs to know
if the navigator is still as accurate as when the device was built or how much the
accuracy has decreased and in which direction, i.e. horizontal or vertical. This
gives the surgeon a more comfortable state of mind and makes the operation safer.
To address this issue surgical navigator companies give a range of error in which
the navigator operates (Frantz et al. 2003, Wiles et al. 2004). To make the
understanding of the accuracy of the surgical guidance devices even better,
accuracy assessment phantoms and protocols for special purposes have been
developed. (ASTM 2011, Clarke et al. 2008, Linte et al. 2010, Masood et al. 2002,
Moretti et al. 2000, Yamura et al. 2005). A phantom is an object used for a variety
of purposes to replace a human in the development of new techniques and
methods in the medical and surgical field. All of the above errors can be solved
with more precise manufacturing and better understanding of mechanics and
software. For this reason, a variety of phantoms as presented in the current
literature have been developed to better understand the error caused by the
navigational modalities and thus help improve the performance of future surgical
navigators. If the surgeon and the technical staff know the error caused by the
47
navigational device, they can take this into account when performing an operation,
giving a better basis for successful surgery.
The devices are calibrated before they enter the market. When the navigator
leaves the factory, the accuracy is tested and assessed by the navigational device
company e.g. BrainLab GMB (Munich, Germany), Medtronic Inc. (Louisville,
CO, USA) and Stryker Inc. (Kalamazoo, MI, USA). The navigator’s accuracy can
be degraded due to many factors while in use in the hospital. For example rough
handling may decrease the accuracy (Wiles et al. 2004). Thus a post-industrial
phantom and an accuracy assessment protocol are needed (ASTM 2011,
Haidegger et al. 2010, Stiehl et al. 2007, Wiles et al. 2004). Recent issues
presented also in the MAUDE database with accuracy errors encountered in the
routine use of surgical guidance devices serve to emphasize the need for periodic
accuracy assessment of these devices as a part of quality assurance (MAUDE
2012). The MAUDE database is an online portal of the FDA, where all medical
device users and manufacturers post errors encountered with medical devices.
When browsing the database for injuries caused by stereotactic guidance devices,
which in this database search are navigators and robots, a total of 203 cases can
be found within the last five years. All of these error cases were encountered
during a surgical procedure.
Stiehl et al. (2007) and Heidegger et al. (2010) have addressed the issue of
the different accuracy analysis methods and results. They listed two significant
issues regarding the analysis found in the literature. According to their review,
there is serious lack of consistency both in terminology and validation methods
used in the statistical measurements of the accuracies of the guidance devices.
Wiles et al. (2004) also discussed the difficulty in comparing different accuracy
assessment results, and claimed that a large variety of spatial measurement
technologies and expected applications was the reason why manufacturers have
not agreed on standardized methods for surgical guidance device accuracy
assessment. They also suggested that users of these surgical navigators should
periodically check the accuracies and called for development of user oriented and
developed accuracy assessment tools and protocols for ‘real world’ use (Wiles et
al. 2004).
In the field of IGS, a variety of accuracy assessment phantoms and protocols
has been presented. As stated in the Introduction (Section 1.2), even though an
early stage standardized method and tool for periodic assessment for these
guidance devices was recently published, a number of open questions remain
unanswered. The ASTM F2554 standard focused on orthopedic procedures and
48
thus a lack of common standardization has led to a variety of accuracy assessment
analysis and different aspects of results have been published.
Wiles et al. have presented methods for assessing the accuracy of the
commercial OTS, the NDI Polaris (NDI Medical, Waterloo, ON, Canada) (Wiles
et al. 2004). They covered aspects regarding the entire volume covered by the
optical camera pair. Their study also contained comparison between the so-called
active and passive optical tracking. They found that the accuracy of OTS does not
depend on the tracking method. In their experiment the mean accuracy of an OTS
was 0.255 mm and the RMS error was 0.193 mm, with standard deviation (SD) of
0.167 mm. 95% CI was found to be 0.451 mm. The presented study was highly
industrial and involved special accuracy assessment equipment that does not
necessarily suit the analysis done in a hospital setting. Instead, the analysis was
done in the factory and thus the methods were limited to analysis involving
laboratory and experts in accuracy assessment. Other research groups have also
assessed the accuracy of different navigators using the OTS in laboratory
experiments. Hassfeld & Mühligh reported a mean accuracy of 0.8 mm with 0.8
mm SD (Hassfeld & Mühlig 2000). Mascott (2005) analyzed the application
accuracy of an OTS during routine surgical procedures and published a mean
error of 1.4 mm with 0.8 mm SD. Ringel et al. (2009) have also reported an
accuracy of 0.7 mm as the mean target point deviation using the VarioGuide
(BrainLAB, Feldkirchen, Germany). Wittmann et al. (2011) reported an accuracy
of the Navigation Panel Unit (NPU) (Karl Storz GmbH & Co, KG, Tuttlingen,
Germany) in the surgical scene at 1.44 mm with SD of 0.09 mm and in ideal
conditions at 0.63 mm with SD 0.035 mm. Simon (1997) and Alakuijala (2001)
compared the difference between the different tracking methods, finding the
accuracy of the OTS to be in the range of 0.1–0.5 mm depending on the accuracy
assessment method.
The other widely used tracking method is EMTS as presented in Section 2.1.2
in this thesis. In the literature there are some studies of analysis done for this
tracking, but as with the OTS, no single standardized method has been presented.
Thus the analysis results are not totally comparable but they give a range in which
the accuracy has been reported. Frantz et al. from the NDI covered the analysis in
detail containing different methods presented in the literature. They published the
accuracy of the EMTS to be within 1.1 mm (Frantz et al. 2003). Hummel (2006)
reported the EMTS mean accuracy to be 0.17 mm with 0.19 mm SD. Schneider &
Stevens (2011) found a mean accuracy of 0.46 mm (-1.03 mm) for the EMTS.
Mascott (2005) compared the application accuracies of the OTS and the EMTS in
49
his paper and found the accuracy of the EMTS to be 1.4 mm with 0.6 mm SD. In
a recent study, de Lambert et al. (2012) also reported a mean error of 1.3 mm
using the Aurora Magnetic Tracking System (NDI Digital Inc., ON, Canada). In
the comparison tables of Simon and Alakuijala, the accuracy of the EMTS was
shown to vary within 1 to 5 mm. Accuracies of the other modalities in the field of
IGS have been reported to be in the range of 1 mm for acoustic tracking and 0.1
to 2.5 mm for mechanical arm based navigators (Alakuijala 2001, Simon 1997).
Earlier research results on the accuracy analysis of commercial robots have
been published (Grunert et al. 2003, Drake et al. 1993, Kwartowitz et al. 2006).
Haidegger et al. (2010) collected the accuracy analyses of the most widely used
commercial robots (The Puma 200, the ROBODOC, the NeuroMate and the da
Vinci) with the following results: technical accuracy had been reported in the
range of 0.5–1.35 mm with a repeatability of 0.05–0.15 mm. Ringel et al. (2012)
published a study comparing the accuracy of placement of lumbar and sacral
pedicle screws using the SpineAssist robot and conventional freehand screw
implantation. The results showed that in fact in this special case, the freehand
implantation was superior compared to the robot assisted procedure. They showed
that in 93% of cases freehand implantation was within the desired accuracy range
while the range was achieved in 85% of the cases when assisted by the robot. This
is a study that clearly shows that the use of robots in particular should be
evaluated and the accuracy of the systems assessed.
The total number of MIS procedures worldwide has been estimated at 3
million cases annually (MaRS 2010). The use of the presented IGS devices has a
share of 6% of the total number. Thus, roughly 180 000 procedures are guided
using these devices annually and the use of these devices is clearly increasing
(MaRS 2010).
As can be seen in the reports on accuracy analysis in the literature, there is a
range of accuracy analysis methods and thus deviation in the results. The fact that
there are no standardized methods for accuracy assessment of surgical guidance
devices and navigators in detail has led to broad definitions and analysis methods
for surgical guidance device accuracy assessment. The aspects regarding the
importance of assessing the accuracy of surgical guidance devices have been
published by many international research groups (Clarke et al. 2008, Haidegger et
al. 2010, Kroneif et al. 2011, Stiehl et al. 2007, Wiles et al. 2004).
This thesis addresses the issues regarding the different terminologies,
validation methods and results analysis by evaluating the used surgical guidance
devices using the same accuracy assessment phantoms and protocols. The results
50
are also presented in a uniform manner providing tools for quick and
comprehensive comparison between the different IGS devices.
2.2.3 Instrument tracking error theory
Instrument tracking error is an important component of IGS systems and the focus
of this thesis. The main source of this error lies in the technical accuracy of the
system. Depending on the used IGS system, instrument tracking error may be
derived from the localization of fiducial markers (OTS), the localization of the
coils (EMTS), or the kinematic construction of the device (surgical robots). The
common subject with these IGS systems is that the tip or axis of the used
instrument is mapped in space with respect to the object tracked. The used
instrument is calibrated to the object using registration techniques.
The instrument tracking error has been divided into three main categories
(Fitzpatrick et al. 1998, Haidegger et al. 2010, West & Maurer 2004):
1. Fiducial Localization Error (FLE)
– FLE is the error resulting from the misalignment of the fiducial positions.
FLE is the calculated distance between the true positions of the fiducials
and the measured positions. FLE gives the localization error in the
precise point within the fiducial. The FLE may be calculated using (1).
1 1
1( , ),
Trial Fiducialn n
l jTrial Fiducial
FLE i jn n
(1)
where ε is the error measured at each fiducial.
2. Fiducial Registration Error (FRE)
– FRE is a commonly used fiducial marker localization error. This is the
number that most of the IGS devices return after the registration of the
object to the reference coordinate system. In the ideal case, the FRE
equals zero and the connection between the FRE and FLE has been
shown to follow (2) (Fitzpatrick et al. 1998):
211 ,
2FRE FLE
n
(2)
where n is the number of fiducials used during the registration.

51
3. Target Registration Error (TRE)
– TRE is the error of misalignment of the fiducials that results from the
registration error. The TRE may be calculated using (3):
2 23
22
1
11 ,
3k
k k
FLE dTRE r
n f
(3)
where n is the number of fiducial markers, dk is the distance of the target, and fk is
the RMS distance of the fiducials from the principal axis k.

52
53
3 Development of advanced materials and methods based on statistical formulation for the region of surgical interest
In this section, the advanced accuracy assessment phantoms and protocols
developed in the present work are introduced as methods and tools for periodic
“real world” analysis of surgical guidance devices in the region of surgical
interest (ROSI). The tools and methods for accuracy assessment were utilized in
all of the present experiments. The process of development was begun already in
2008 when the need for these types of accuracy assessment tools was realized.
The purpose of the phantoms was to function as tools for assessing the
accuracies of surgical guidance devices, namely neuronavigators using OTS and
EMTS and a surgical robot. Due to the routine use of the guidance devices and
possible rough handling, the accuracy of the devices can decrease over time. To
periodically check the accuracy, a model with accurately machined accuracy
assessment points was needed. Together with material selection, the main
criterion given for the phantom was the need to provide more than one surface for
measurement points in the ROSI. The solution for these criteria was a phantom
designed to have three separate levels with accurately machined beveled
calibration holes to render a sufficient volume for testing and to make the
phantom volume easily accessible. The levels also needed to be easily
disassembled to reach the calibration holes on the lower levels. The first task in
the development process was to determine the volume of the ROSI. The
approximate size of the human head was chosen as the volume for the ROSI.
3.1 Accuracy assessment tools
The accuracy assessment tools included two phantoms and protocols. The
developed phantoms and protocols are a response to the suggestion by industry
for “real world” methods for routine hospital use (Stiehl et al. 2007, Wiles et al.
2003).
Accuracy assessment phantoms
The design process of the first phantom started with understanding of the MR
imaging principles and scanner system architecture. In navigation the most
54
commonly used MR image protocol is the 3D-T1 weighted sequence (Katisko
2012). This method shows liquid in gray and acrylic material in black. For this
reason the first phantom (Phantom I) needed to be filled as completely as possible
with liquid to discriminate between liquid and plastic. The result was to design
separate levels containing calibration pegs so that these pegs were visible in black
against the gray background of the liquid. The second phantom (Phantom II) had
similar criteria, but as this phantom was intended for CT imaging, there was no
need for liquid use. Thus, the phantom was designed so that the accuracy
assessment points were machined directly on the surface of 40 mm thick accuracy
assessment levels.
Acrylic plastic (PMMA - polymethylmethacrylate) was used as the material
for both phantoms. PMMA has been used for a variety of products since the
1930’s. It is an amorphous thermoplastic, which can be used as a replacement for
glass. PMMA has eight times greater shock resistance than glass. PMMA is easily
machined and has very strong weather resistance. The temperature range in which
PMMA can be used without deformation is -40ºC to +70ºC (MatWeb 2012).
Since the linear coefficient of thermal expansion of PMMA at -30 to 30°C is
6*10-5/°C (ASM International 1988), the deformation of the phantoms in
controlled experimental testing is marginal. PMMA has very good environmental
characteristics and only strong acids and esters may cause deformation (ASM
International 1988). PMMA has also been shown to cause hardly noticeable
image abnormality on either spin-echo or gradient-echo MR imaging (Schenck
1996). It has also been commonly used for CT image artefact studies (Barrett &
Keat 2004). To prevent possible deformation issues, the phantoms should be
stored in dry and clean premises.
Both phantoms were machined using a NC-machine (Yasda Precision,
Okayama, Japan) at the University of Oulu Mechanics Laboratory (Phantom I)
and at a commercial machining company (KL Mechanics, Kempele, Finland;
Phantom II). The phantom levels contained beveled holes industrially machined
with a verified ±0.015 mm displacement error and used as the accuracy
assessment points. The displacement errors of the accuracy assessment points of
the phantoms were verified by Oulu PMC (Oulu, Finland), a company
specializing in 3D accuracy analysis, using the Mitutoyo Strato 9166 (Mitutoyo
Corp., Kawasaki, Japan) coordinate measuring machine (CMM).
The points were machined identically forming a 7x7 matrix giving 49
accuracy assessment points on each level. The total volume approximated the
dimensions of the human head which was chosen as the ROSI target volume.
55
Specifically, the first phantom (Phantom I, Fig. 11, left) was designed as a
tool with three 10 mm thick levels on which were placed 6 mm diameter accuracy
assessment pegs on top of which the beveled holes were machined. As this
phantom would later also be used to assess the image quality of the MRI scanner,
the phantom was designed so that it could be placed inside a container that could
be filled with liquid. As the basic principle of MR imaging is based on the spin
effect of the proton of the hydrogen atom (Hendee W & Morgan C 1984), the
phantom was designed so that as much liquid as possible could be added into the
container with the phantom for image scanning. The use of pegs made it possible
to fill the container with enough liquid to make the accuracy assessment points
visible in the image data sets. In the experiments regular tap water with dish
washing solvent (Sodium Laureth Sulphate, CH3(CH2)10CH2(OCH2CH2)nOSO3
Na) was used as the liquid. Water can be used as a substitute liquid for human
tissue, as both materials are similarly MRI compatible and produce hardly
noticeable torques or forces; negligible image distortion occurs even close to the
imaged region in the human anatomy (Schenck 1996). Human tissue is also
considered to have the same MR susceptibility parameters as water. The
dependence of water susceptibility and temperature has been shown to be
marginal in controlled conditions and thus no real image degradation will be
detected (Schenck 1996). The assessment points were machined at 22 mm
intervals in lateral and longitudinal directions in planes set at 50 mm intervals
vertically. This gave the phantom an accuracy assessment volume of
132x132x100 mm3 (Koivukangas et al. 2009).
The second phantom (Phantom II, Fig. 11, right) was designed as a tool
containing levels of 40 mm thickness on which the accuracy assessment points
were machined directly. This phantom would also be used for image quality
assessment of CT scanners. As the basic principle of CT imaging is based on X-
ray being absorbed by the object (Goldman 2007), the phantom was designed to
have suitable material for making the accuracy assessment points visible on the
image data. The accuracy assessment points were machined at 20 mm intervals in
lateral and longitudinal directions in planes set at 50 mm intervals vertically,
giving a total accuracy assessment volume of 120x120x100 mm3 (Koivukangas &
Katisko 2010).
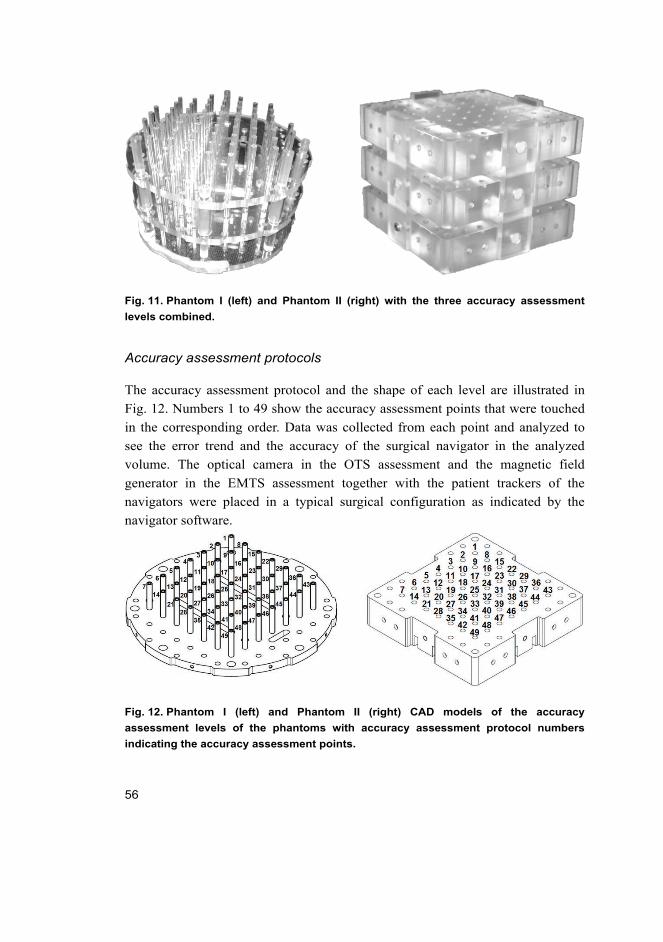
56
Fig. 11. Phantom I (left) and Phantom II (right) with the three accuracy assessment
levels combined.
Accuracy assessment protocols
The accuracy assessment protocol and the shape of each level are illustrated in
Fig. 12. Numbers 1 to 49 show the accuracy assessment points that were touched
in the corresponding order. Data was collected from each point and analyzed to
see the error trend and the accuracy of the surgical navigator in the analyzed
volume. The optical camera in the OTS assessment and the magnetic field
generator in the EMTS assessment together with the patient trackers of the
navigators were placed in a typical surgical configuration as indicated by the
navigator software.
Fig. 12. Phantom I (left) and Phantom II (right) CAD models of the accuracy
assessment levels of the phantoms with accuracy assessment protocol numbers
indicating the accuracy assessment points.
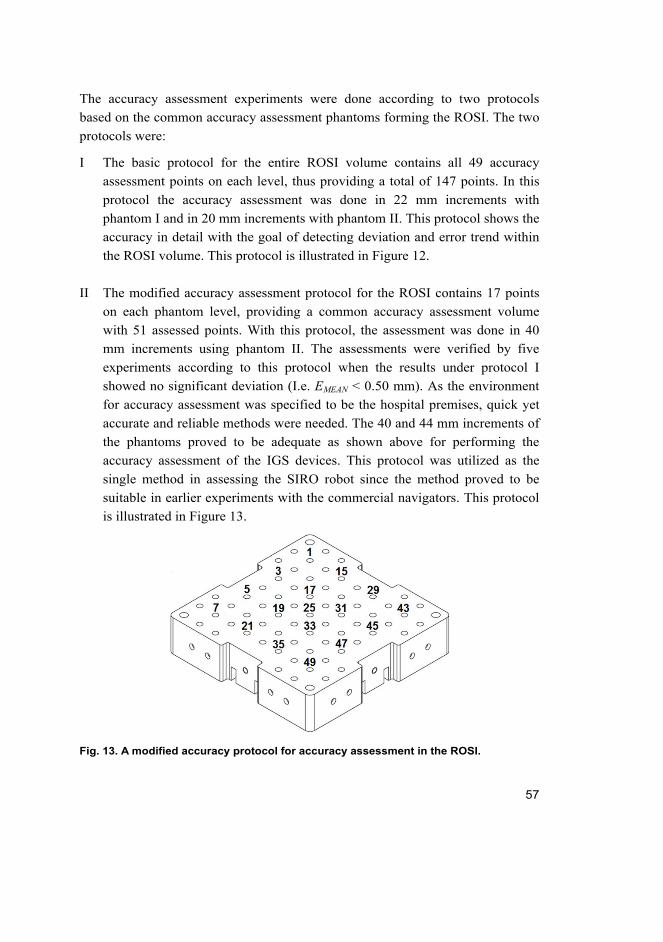
57
The accuracy assessment experiments were done according to two protocols
based on the common accuracy assessment phantoms forming the ROSI. The two
protocols were:
I The basic protocol for the entire ROSI volume contains all 49 accuracy
assessment points on each level, thus providing a total of 147 points. In this
protocol the accuracy assessment was done in 22 mm increments with
phantom I and in 20 mm increments with phantom II. This protocol shows the
accuracy in detail with the goal of detecting deviation and error trend within
the ROSI volume. This protocol is illustrated in Figure 12.
II The modified accuracy assessment protocol for the ROSI contains 17 points
on each phantom level, providing a common accuracy assessment volume
with 51 assessed points. With this protocol, the assessment was done in 40
mm increments using phantom II. The assessments were verified by five
experiments according to this protocol when the results under protocol I
showed no significant deviation (I.e. EMEAN < 0.50 mm). As the environment
for accuracy assessment was specified to be the hospital premises, quick yet
accurate and reliable methods were needed. The 40 and 44 mm increments of
the phantoms proved to be adequate as shown above for performing the
accuracy assessment of the IGS devices. This protocol was utilized as the
single method in assessing the SIRO robot since the method proved to be
suitable in earlier experiments with the commercial navigators. This protocol
is illustrated in Figure 13.
Fig. 13. A modified accuracy protocol for accuracy assessment in the ROSI.
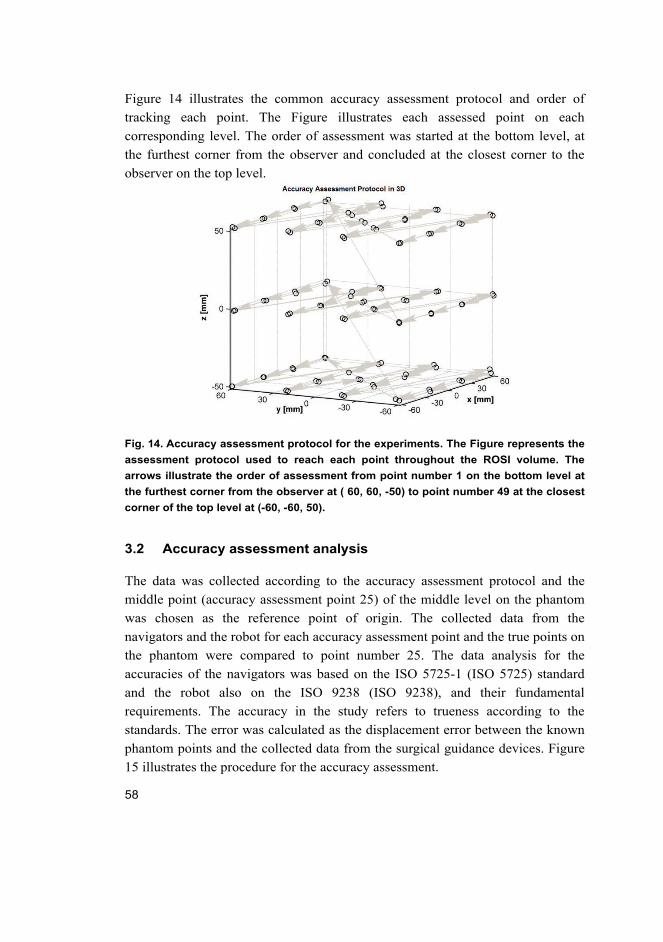
58
Figure 14 illustrates the common accuracy assessment protocol and order of
tracking each point. The Figure illustrates each assessed point on each
corresponding level. The order of assessment was started at the bottom level, at
the furthest corner from the observer and concluded at the closest corner to the
observer on the top level.
Fig. 14. Accuracy assessment protocol for the experiments. The Figure represents the
assessment protocol used to reach each point throughout the ROSI volume. The
arrows illustrate the order of assessment from point number 1 on the bottom level at
the furthest corner from the observer at ( 60, 60, -50) to point number 49 at the closest
corner of the top level at (-60, -60, 50).
3.2 Accuracy assessment analysis
The data was collected according to the accuracy assessment protocol and the
middle point (accuracy assessment point 25) of the middle level on the phantom
was chosen as the reference point of origin. The collected data from the
navigators and the robot for each accuracy assessment point and the true points on
the phantom were compared to point number 25. The data analysis for the
accuracies of the navigators was based on the ISO 5725-1 (ISO 5725) standard
and the robot also on the ISO 9238 (ISO 9238), and their fundamental
requirements. The accuracy in the study refers to trueness according to the
standards. The error was calculated as the displacement error between the known
phantom points and the collected data from the surgical guidance devices. Figure
15 illustrates the procedure for the accuracy assessment.
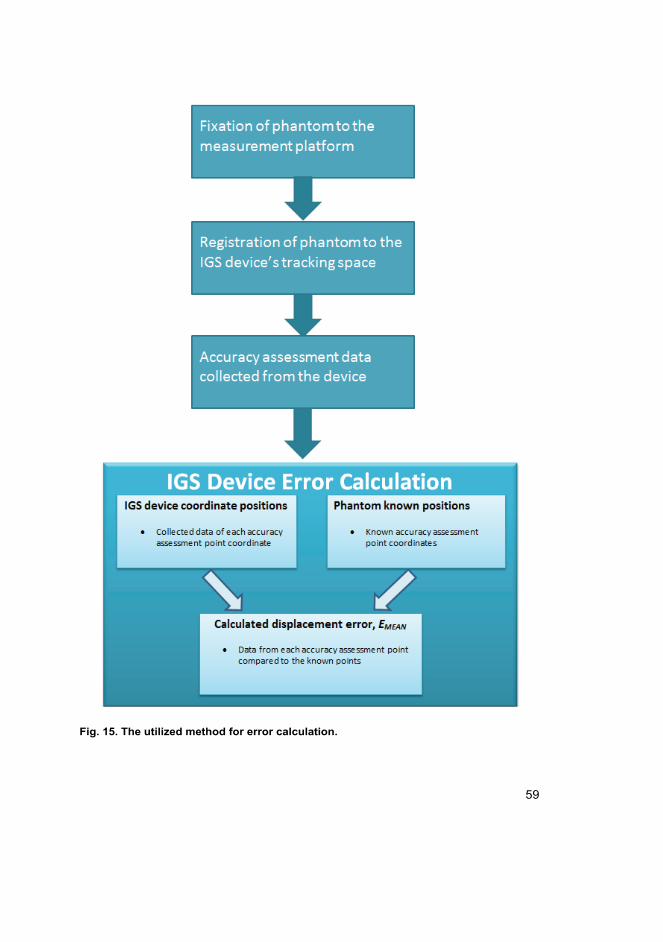
59
Fig. 15. The utilized method for error calculation.
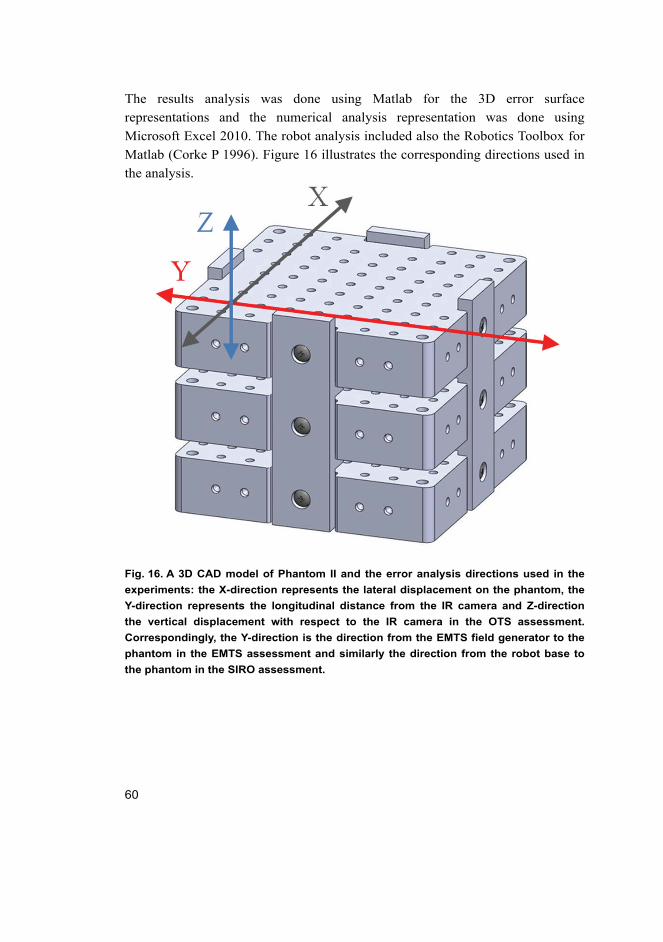
60
The results analysis was done using Matlab for the 3D error surface
representations and the numerical analysis representation was done using
Microsoft Excel 2010. The robot analysis included also the Robotics Toolbox for
Matlab (Corke P 1996). Figure 16 illustrates the corresponding directions used in
the analysis.
Fig. 16. A 3D CAD model of Phantom II and the error analysis directions used in the
experiments: the X-direction represents the lateral displacement on the phantom, the
Y-direction represents the longitudinal distance from the IR camera and Z-direction
the vertical displacement with respect to the IR camera in the OTS assessment.
Correspondingly, the Y-direction is the direction from the EMTS field generator to the
phantom in the EMTS assessment and similarly the direction from the robot base to
the phantom in the SIRO assessment.
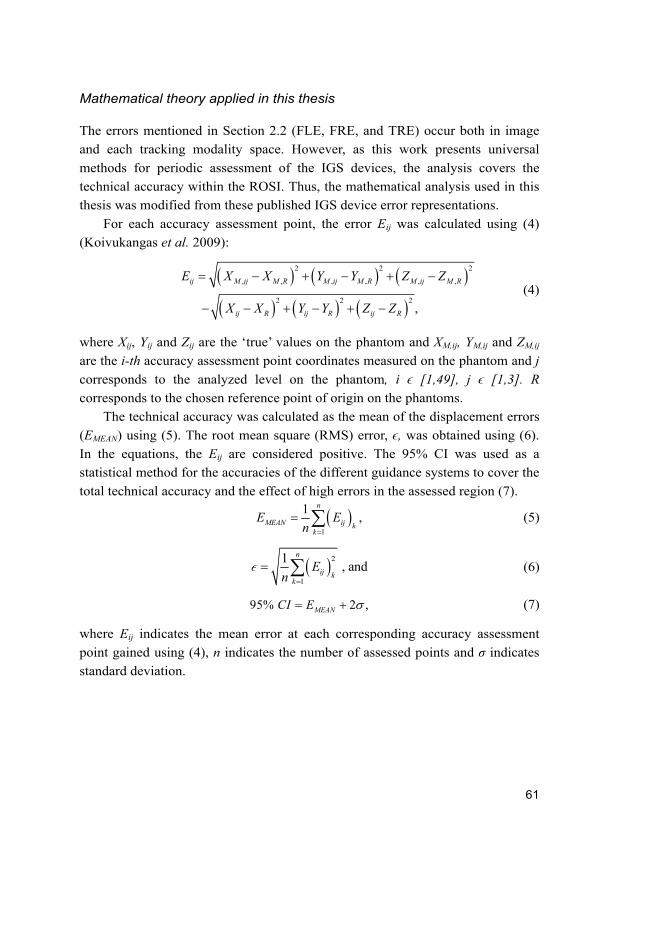
61
Mathematical theory applied in this thesis
The errors mentioned in Section 2.2 (FLE, FRE, and TRE) occur both in image
and each tracking modality space. However, as this work presents universal
methods for periodic assessment of the IGS devices, the analysis covers the
technical accuracy within the ROSI. Thus, the mathematical analysis used in this
thesis was modified from these published IGS device error representations.
For each accuracy assessment point, the error Eij was calculated using (4)
(Koivukangas et al. 2009):
2 2 2
, , , , , ,
2 2 2 ,
ij M ij M R M ij M R M ij M R
ij R ij R ij R
E X X Y Y Z Z
X X Y Y Z Z
(4)
where Xij, Yij and Zij are the ‘true’ values on the phantom and XM,ij, YM,ij and ZM,ij
are the i-th accuracy assessment point coordinates measured on the phantom and j
corresponds to the analyzed level on the phantom, i ϵ [1,49], j ϵ [1,3]. R
corresponds to the chosen reference point of origin on the phantoms.
The technical accuracy was calculated as the mean of the displacement errors
(EMEAN) using (5). The root mean square (RMS) error, ϵ, was obtained using (6).
In the equations, the Eij are considered positive. The 95% CI was used as a
statistical method for the accuracies of the different guidance systems to cover the
total technical accuracy and the effect of high errors in the assessed region (7).
1
1,
n
MEAN ij kk
E En
(5)
2
1
1, and
n
ij kk
En
(6)
95% 2 ,MEANCI E (7)
where Eij indicates the mean error at each corresponding accuracy assessment
point gained using (4), n indicates the number of assessed points and σ indicates
standard deviation.

62
63
4 Results of accuracy assessment
In this chapter, the developed tools and methods are utilized in accuracy
assessment of the IGS devices. Section 4.1 concentrates on optical tracking
system (OTS) accuracy analysis with the error trends and possible sources for this
phenomenon. Section 4.2 contains the accuracy assessment of the electromagnetic
tracking system (EMTS). Section 4.3 presents a comparison study of the OTS and
the EMTS modalities. Section 4.4 shows the results of accuracy analysis of the
surgical robot (SIRO). Finally, Section 4.5 is a study of the spatial accuracy of a
surgical 3D CT scanner within the common ROSI.
Section 2.2.2 presented the different accuracy assessment methods and accuracy
results for the surgical guidance devices that have been published. This has
resulted in a comprehensive, but also complicated description of the accuracy of
the devices. Depending on the setting and analysis methods, the results of similar
cases vary extensively. Chapter 3 introduced the present tools and methods for
quick and reliable accuracy assessment of surgical guidance devices in the
hospital setting. They were used to analyze the technical accuracies of the devices
in a uniform manner, so the results are comparable and adequate.
4.1 Accuracy assessment of OTS
This section concentrates on the OTS accuracy assessment of two commercial
surgical navigators. The navigators used were the StealthStation Treon plus (Fig.
17) and the StealthStation S7, both manufactured by Medtronic Inc. (Louisville,
CO, USA). The analysis was done using both of the designed phantoms for a
comprehensive evaluation of the accuracies. The data was collected from both
navigators as the position of the tip of the instrument in x, y and z directions. The
results were collected and analyzed in four separate OTS experiment sets and then
combined to see the trends of error:
Experiment 1: StealthStation Treon plus –navigator with phantom I
Experiment 2: StealthStation Treon plus –navigator with phantom II
Experiment 3: StealthStation S7 –navigator with phantom I
Experiment 4: StealthStation S7 –navigator with phantom II.
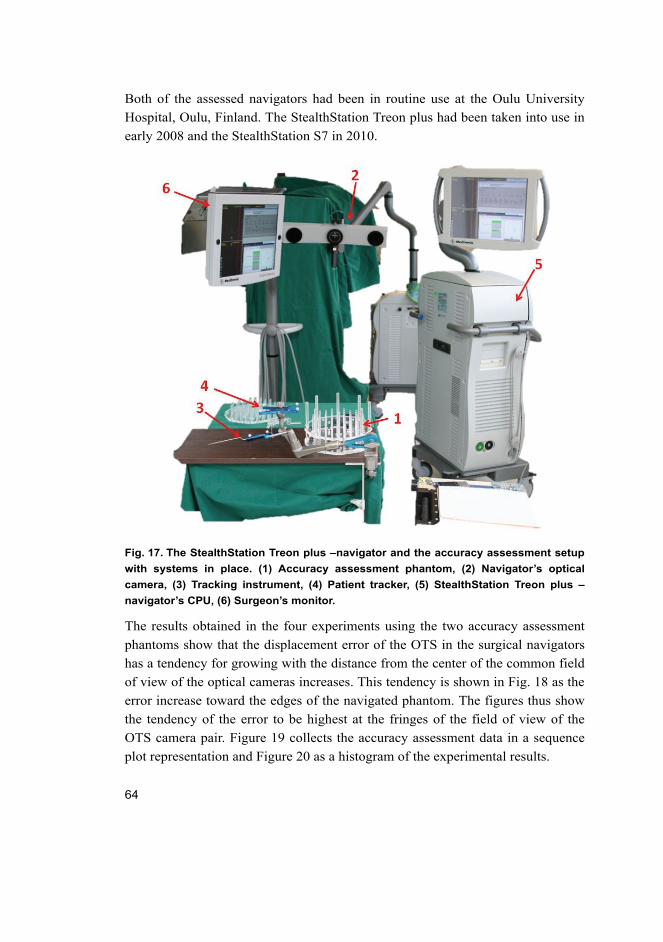
64
Both of the assessed navigators had been in routine use at the Oulu University
Hospital, Oulu, Finland. The StealthStation Treon plus had been taken into use in
early 2008 and the StealthStation S7 in 2010.
Fig. 17. The StealthStation Treon plus –navigator and the accuracy assessment setup
with systems in place. (1) Accuracy assessment phantom, (2) Navigator’s optical
camera, (3) Tracking instrument, (4) Patient tracker, (5) StealthStation Treon plus –
navigator’s CPU, (6) Surgeon’s monitor.
The results obtained in the four experiments using the two accuracy assessment
phantoms show that the displacement error of the OTS in the surgical navigators
has a tendency for growing with the distance from the center of the common field
of view of the optical cameras increases. This tendency is shown in Fig. 18 as the
error increase toward the edges of the navigated phantom. The figures thus show
the tendency of the error to be highest at the fringes of the field of view of the
OTS camera pair. Figure 19 collects the accuracy assessment data in a sequence
plot representation and Figure 20 as a histogram of the experimental results.
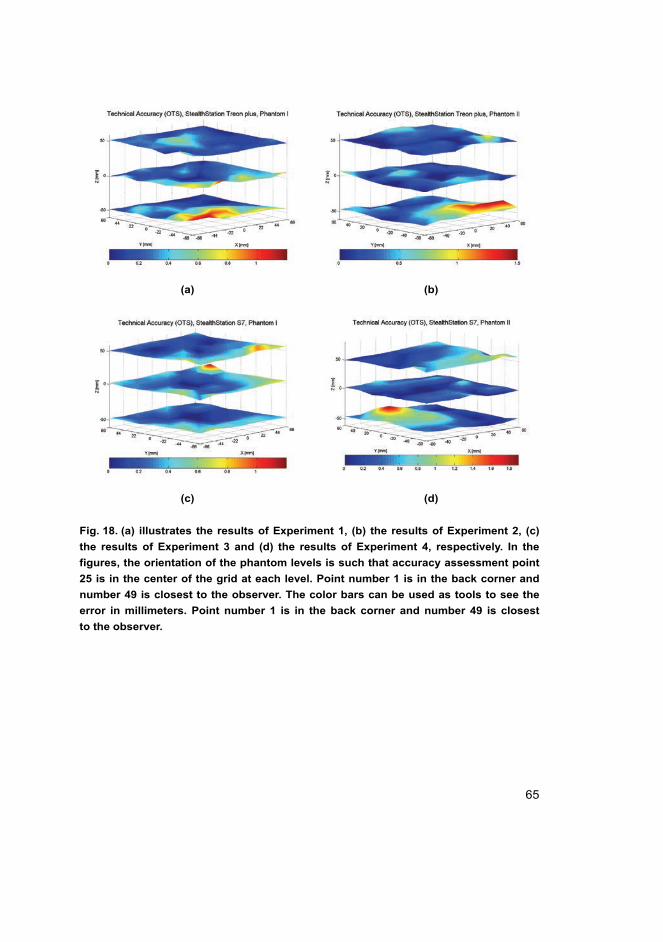
65
(a) (b)
(c) (d)
Fig. 18. (a) illustrates the results of Experiment 1, (b) the results of Experiment 2, (c)
the results of Experiment 3 and (d) the results of Experiment 4, respectively. In the
figures, the orientation of the phantom levels is such that accuracy assessment point
25 is in the center of the grid at each level. Point number 1 is in the back corner and
number 49 is closest to the observer. The color bars can be used as tools to see the
error in millimeters. Point number 1 is in the back corner and number 49 is closest
to the observer.
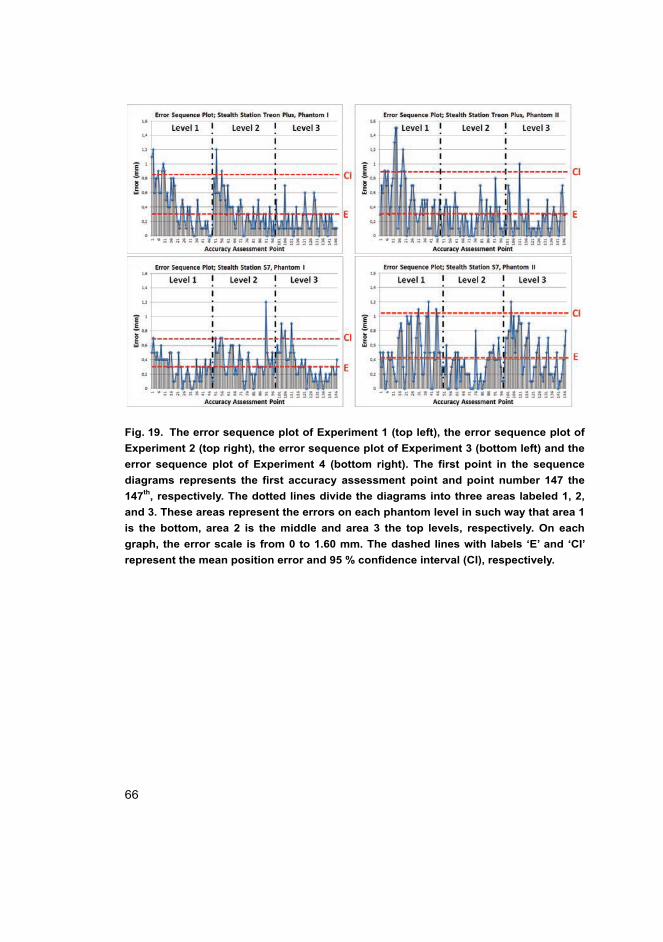
66
Fig. 19. The error sequence plot of Experiment 1 (top left), the error sequence plot of
Experiment 2 (top right), the error sequence plot of Experiment 3 (bottom left) and the
error sequence plot of Experiment 4 (bottom right). The first point in the sequence
diagrams represents the first accuracy assessment point and point number 147 the
147th, respectively. The dotted lines divide the diagrams into three areas labeled 1, 2,
and 3. These areas represent the errors on each phantom level in such way that area 1
is the bottom, area 2 is the middle and area 3 the top levels, respectively. On each
graph, the error scale is from 0 to 1.60 mm. The dashed lines with labels ‘E’ and ‘CI’
represent the mean position error and 95 % confidence interval (CI), respectively.
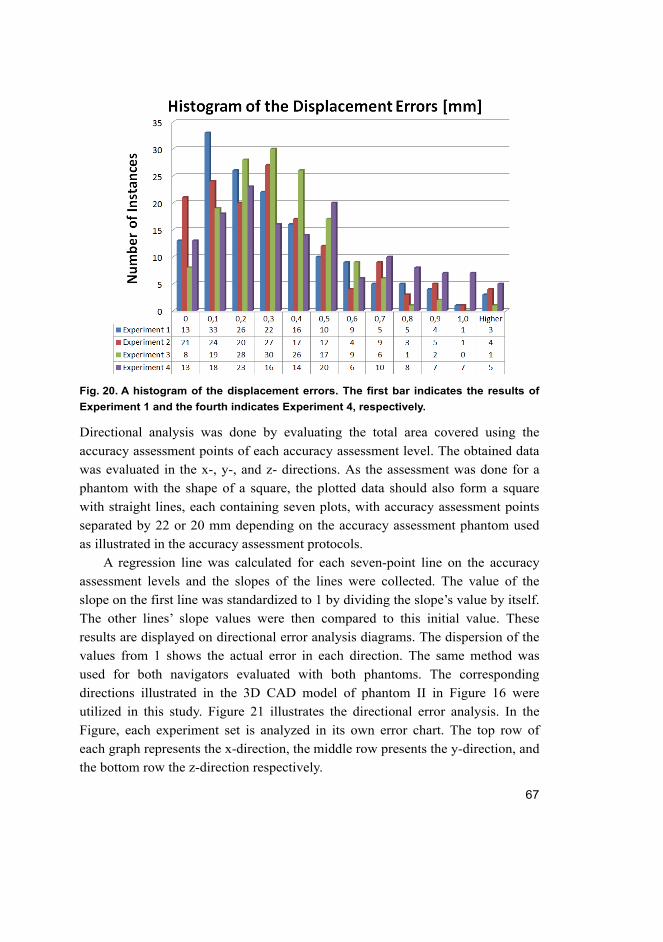
67
Fig. 20. A histogram of the displacement errors. The first bar indicates the results of
Experiment 1 and the fourth indicates Experiment 4, respectively.
Directional analysis was done by evaluating the total area covered using the
accuracy assessment points of each accuracy assessment level. The obtained data
was evaluated in the x-, y-, and z- directions. As the assessment was done for a
phantom with the shape of a square, the plotted data should also form a square
with straight lines, each containing seven plots, with accuracy assessment points
separated by 22 or 20 mm depending on the accuracy assessment phantom used
as illustrated in the accuracy assessment protocols.
A regression line was calculated for each seven-point line on the accuracy
assessment levels and the slopes of the lines were collected. The value of the
slope on the first line was standardized to 1 by dividing the slope’s value by itself.
The other lines’ slope values were then compared to this initial value. These
results are displayed on directional error analysis diagrams. The dispersion of the
values from 1 shows the actual error in each direction. The same method was
used for both navigators evaluated with both phantoms. The corresponding
directions illustrated in the 3D CAD model of phantom II in Figure 16 were
utilized in this study. Figure 21 illustrates the directional error analysis. In the
Figure, each experiment set is analyzed in its own error chart. The top row of
each graph represents the x-direction, the middle row presents the y-direction, and
the bottom row the z-direction respectively.
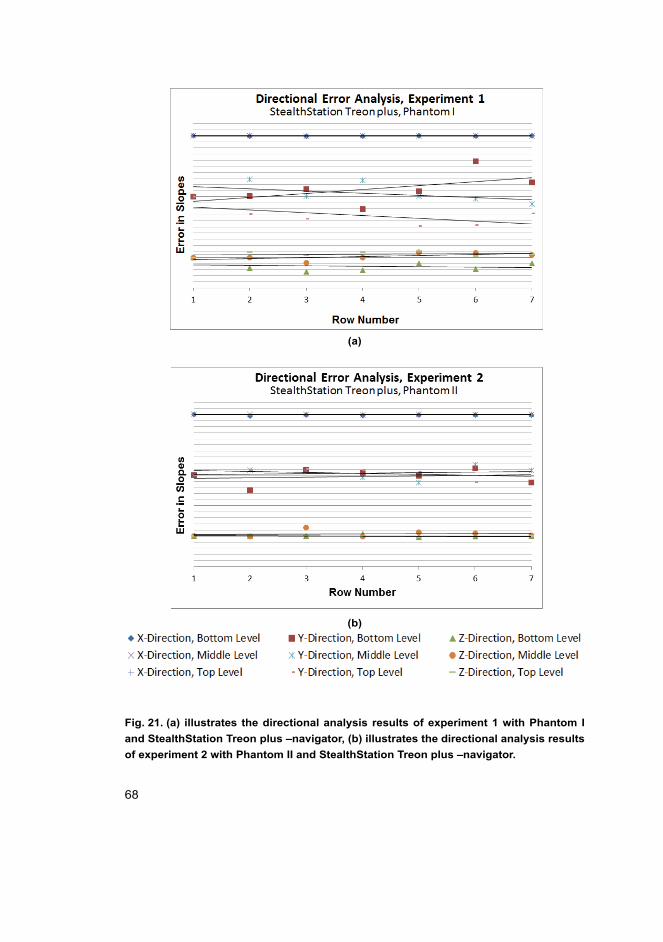
68
(a)
(b)
Fig. 21. (a) illustrates the directional analysis results of experiment 1 with Phantom I
and StealthStation Treon plus –navigator, (b) illustrates the directional analysis results
of experiment 2 with Phantom II and StealthStation Treon plus –navigator.
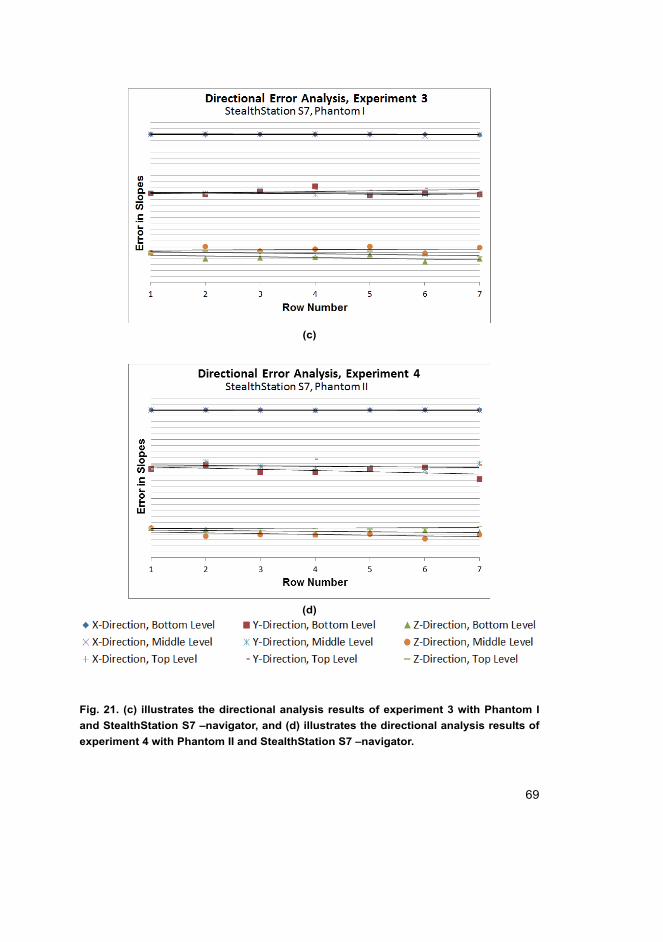
69
(c)
(d)
Fig. 21. (c) illustrates the directional analysis results of experiment 3 with Phantom I
and StealthStation S7 –navigator, and (d) illustrates the directional analysis results of
experiment 4 with Phantom II and StealthStation S7 –navigator.
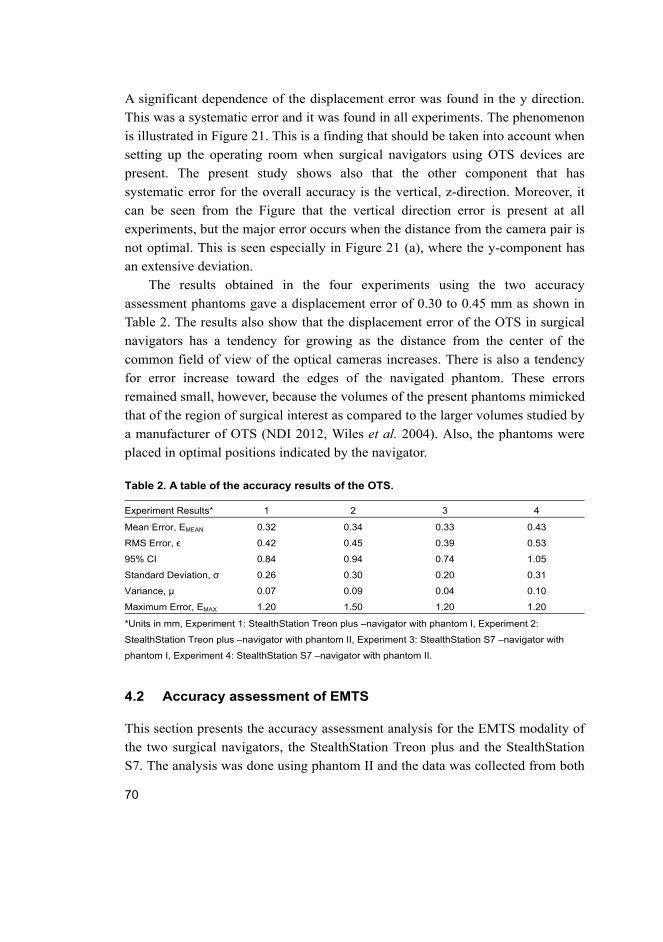
70
A significant dependence of the displacement error was found in the y direction.
This was a systematic error and it was found in all experiments. The phenomenon
is illustrated in Figure 21. This is a finding that should be taken into account when
setting up the operating room when surgical navigators using OTS devices are
present. The present study shows also that the other component that has
systematic error for the overall accuracy is the vertical, z-direction. Moreover, it
can be seen from the Figure that the vertical direction error is present at all
experiments, but the major error occurs when the distance from the camera pair is
not optimal. This is seen especially in Figure 21 (a), where the y-component has
an extensive deviation.
The results obtained in the four experiments using the two accuracy
assessment phantoms gave a displacement error of 0.30 to 0.45 mm as shown in
Table 2. The results also show that the displacement error of the OTS in surgical
navigators has a tendency for growing as the distance from the center of the
common field of view of the optical cameras increases. There is also a tendency
for error increase toward the edges of the navigated phantom. These errors
remained small, however, because the volumes of the present phantoms mimicked
that of the region of surgical interest as compared to the larger volumes studied by
a manufacturer of OTS (NDI 2012, Wiles et al. 2004). Also, the phantoms were
placed in optimal positions indicated by the navigator.
Table 2. A table of the accuracy results of the OTS.
Experiment Results* 1 2 3 4
Mean Error, EMEAN 0.32 0.34 0.33 0.43
RMS Error, ϵ 0.42 0.45 0.39 0.53
95% CI 0.84 0.94 0.74 1.05
Standard Deviation, σ 0.26 0.30 0.20 0.31
Variance, µ 0.07 0.09 0.04 0.10
Maximum Error, EMAX 1.20 1.50 1.20 1.20
*Units in mm, Experiment 1: StealthStation Treon plus –navigator with phantom I, Experiment 2:
StealthStation Treon plus –navigator with phantom II, Experiment 3: StealthStation S7 –navigator with
phantom I, Experiment 4: StealthStation S7 –navigator with phantom II.
4.2 Accuracy assessment of EMTS
This section presents the accuracy assessment analysis for the EMTS modality of
the two surgical navigators, the StealthStation Treon plus and the StealthStation
S7. The analysis was done using phantom II and the data was collected from both

71
navigators as the position of the tip of the instrument in x, y and z directions
(Figure 22).
Fig. 22. Accuracy assessment setup of the Stealth Station S7 EMTS modality. (1) EMTS
field generator, (2) Patient tracker, (3) tracking instrument, (4) accuracy assessment
phantom.
The results obtained in the EMTS experiments show that the displacement error
was quite scattered. This noticeable tendency is seen clearly in the 3D
representations (Fig. 23) and in the histogram (Fig. 24). It is also seen that there
are more relatively high outlier errors especially with the StealthStation Treon
plus experiments with the EMTS at the furthest edges of the ROSI (Fig. 23, top).
The reason for this phenomenon is that the furthest accuracy assessment points
are located in the outmost range for the EMTS field generator and the produced
magnetic field does not have enough strength for sensing the coils on the
instrument. This furthest range of approximately 35 cm from the field generator
should thus be avoided when performing IGS operations with the present EMTS.
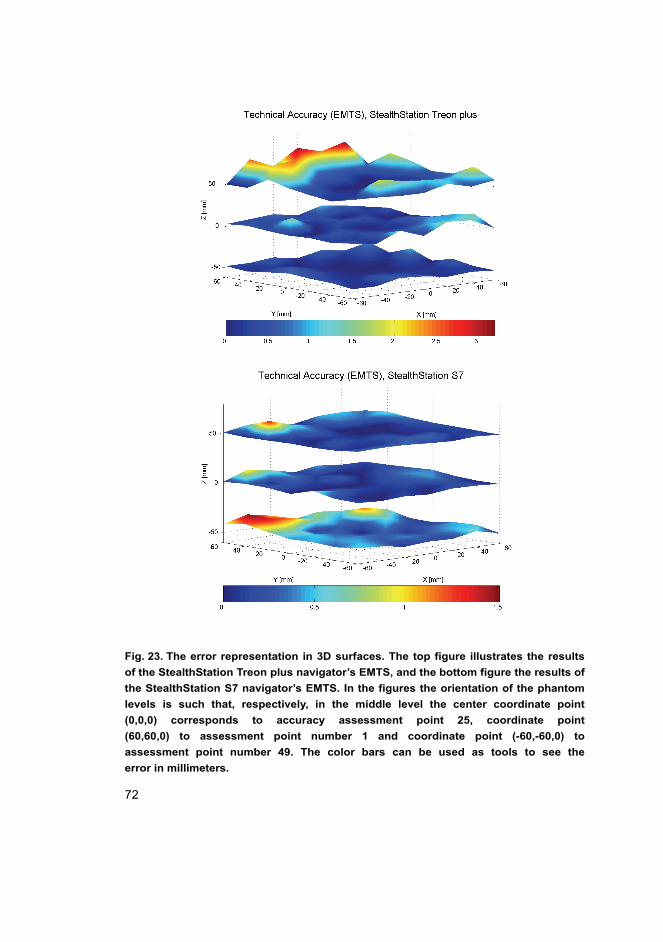
72
Fig. 23. The error representation in 3D surfaces. The top figure illustrates the results
of the StealthStation Treon plus navigator’s EMTS, and the bottom figure the results of
the StealthStation S7 navigator’s EMTS. In the figures the orientation of the phantom
levels is such that, respectively, in the middle level the center coordinate point
(0,0,0) corresponds to accuracy assessment point 25, coordinate point
(60,60,0) to assessment point number 1 and coordinate point (-60,-60,0) to
assessment point number 49. The color bars can be used as tools to see the
error in millimeters.
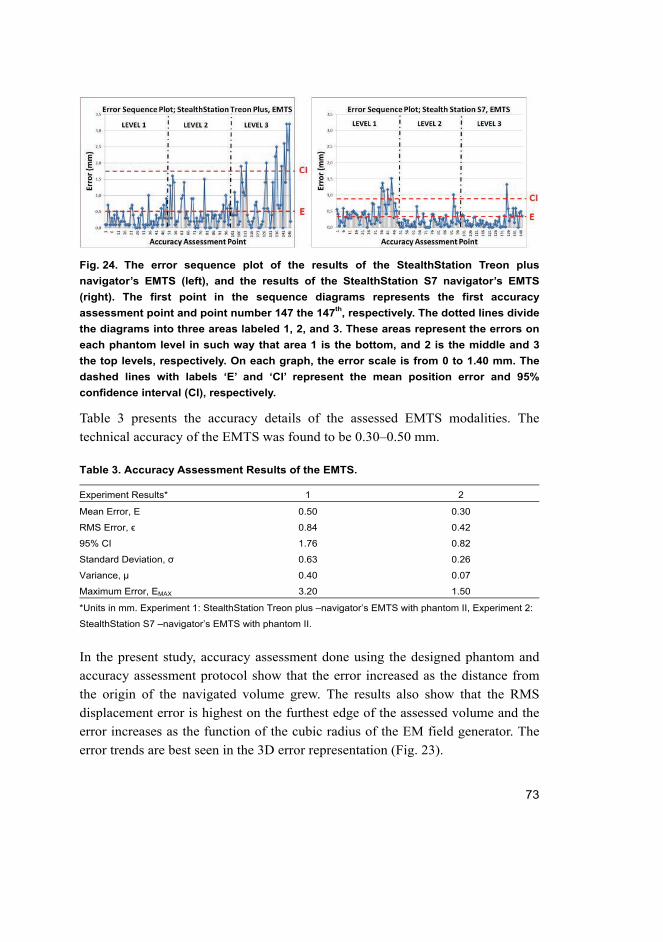
73
Fig. 24. The error sequence plot of the results of the StealthStation Treon plus
navigator’s EMTS (left), and the results of the StealthStation S7 navigator’s EMTS
(right). The first point in the sequence diagrams represents the first accuracy
assessment point and point number 147 the 147th, respectively. The dotted lines divide
the diagrams into three areas labeled 1, 2, and 3. These areas represent the errors on
each phantom level in such way that area 1 is the bottom, and 2 is the middle and 3
the top levels, respectively. On each graph, the error scale is from 0 to 1.40 mm. The
dashed lines with labels ‘E’ and ‘CI’ represent the mean position error and 95%
confidence interval (CI), respectively.
Table 3 presents the accuracy details of the assessed EMTS modalities. The
technical accuracy of the EMTS was found to be 0.30–0.50 mm.
Table 3. Accuracy Assessment Results of the EMTS.
Experiment Results* 1 2
Mean Error, E 0.50 0.30
RMS Error, ϵ 0.84 0.42
95% CI 1.76 0.82
Standard Deviation, σ 0.63 0.26
Variance, µ 0.40 0.07
Maximum Error, EMAX 3.20 1.50
*Units in mm. Experiment 1: StealthStation Treon plus –navigator’s EMTS with phantom II, Experiment 2:
StealthStation S7 –navigator’s EMTS with phantom II.
In the present study, accuracy assessment done using the designed phantom and
accuracy assessment protocol show that the error increased as the distance from
the origin of the navigated volume grew. The results also show that the RMS
displacement error is highest on the furthest edge of the assessed volume and the
error increases as the function of the cubic radius of the EM field generator. The
error trends are best seen in the 3D error representation (Fig. 23).
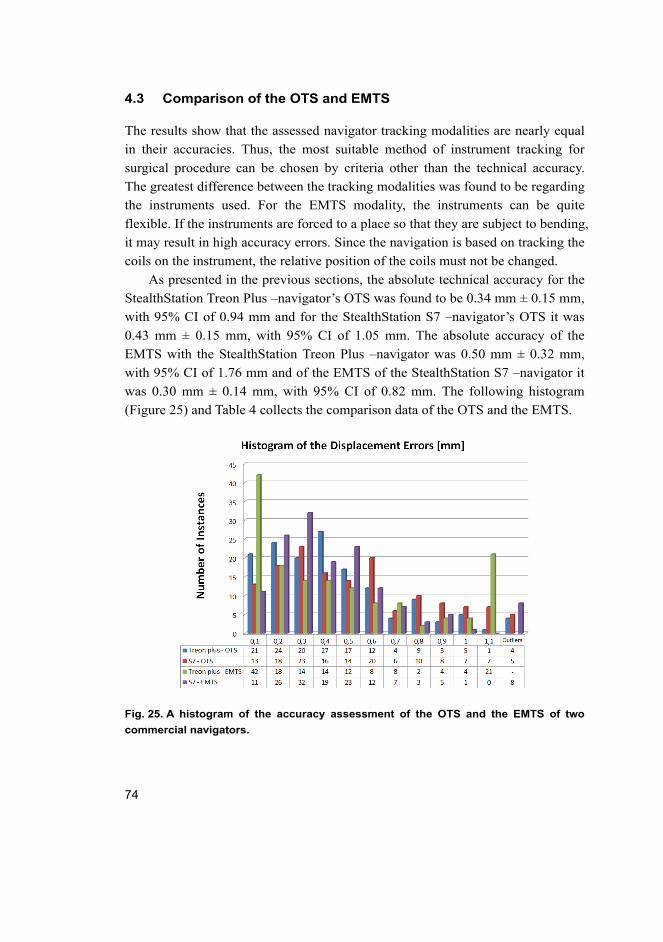
74
4.3 Comparison of the OTS and EMTS
The results show that the assessed navigator tracking modalities are nearly equal
in their accuracies. Thus, the most suitable method of instrument tracking for
surgical procedure can be chosen by criteria other than the technical accuracy.
The greatest difference between the tracking modalities was found to be regarding
the instruments used. For the EMTS modality, the instruments can be quite
flexible. If the instruments are forced to a place so that they are subject to bending,
it may result in high accuracy errors. Since the navigation is based on tracking the
coils on the instrument, the relative position of the coils must not be changed.
As presented in the previous sections, the absolute technical accuracy for the
StealthStation Treon Plus –navigator’s OTS was found to be 0.34 mm ± 0.15 mm,
with 95% CI of 0.94 mm and for the StealthStation S7 –navigator’s OTS it was
0.43 mm ± 0.15 mm, with 95% CI of 1.05 mm. The absolute accuracy of the
EMTS with the StealthStation Treon Plus –navigator was 0.50 mm ± 0.32 mm,
with 95% CI of 1.76 mm and of the EMTS of the StealthStation S7 –navigator it
was 0.30 mm ± 0.14 mm, with 95% CI of 0.82 mm. The following histogram
(Figure 25) and Table 4 collects the comparison data of the OTS and the EMTS.
Fig. 25. A histogram of the accuracy assessment of the OTS and the EMTS of two
commercial navigators.
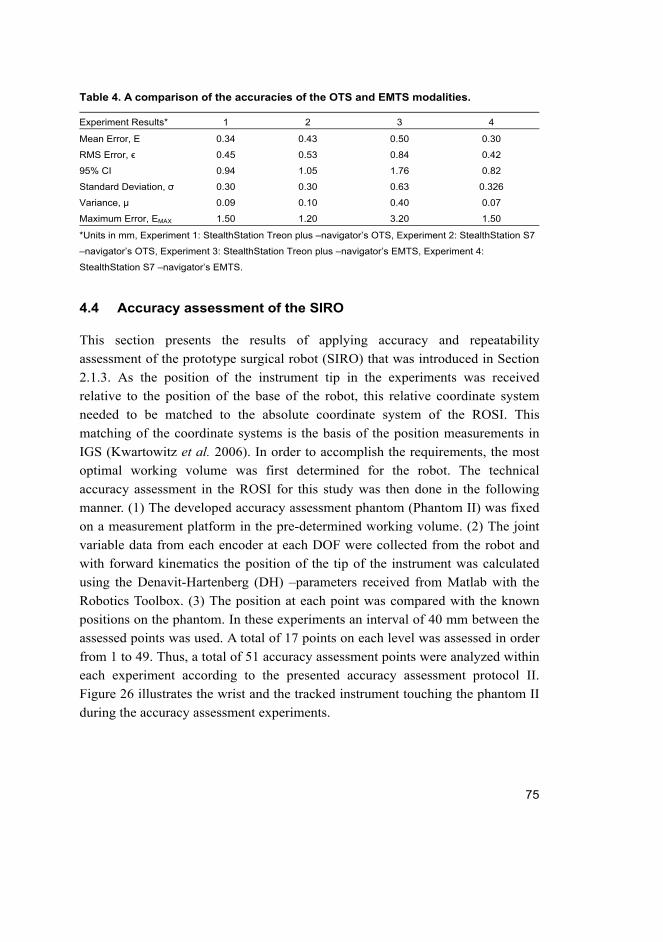
75
Table 4. A comparison of the accuracies of the OTS and EMTS modalities.
Experiment Results* 1 2 3 4
Mean Error, E 0.34 0.43 0.50 0.30
RMS Error, ϵ 0.45 0.53 0.84 0.42
95% CI 0.94 1.05 1.76 0.82
Standard Deviation, σ 0.30 0.30 0.63 0.326
Variance, µ 0.09 0.10 0.40 0.07
Maximum Error, EMAX 1.50 1.20 3.20 1.50
*Units in mm, Experiment 1: StealthStation Treon plus –navigator’s OTS, Experiment 2: StealthStation S7
–navigator’s OTS, Experiment 3: StealthStation Treon plus –navigator’s EMTS, Experiment 4:
StealthStation S7 –navigator’s EMTS.
4.4 Accuracy assessment of the SIRO
This section presents the results of applying accuracy and repeatability
assessment of the prototype surgical robot (SIRO) that was introduced in Section
2.1.3. As the position of the instrument tip in the experiments was received
relative to the position of the base of the robot, this relative coordinate system
needed to be matched to the absolute coordinate system of the ROSI. This
matching of the coordinate systems is the basis of the position measurements in
IGS (Kwartowitz et al. 2006). In order to accomplish the requirements, the most
optimal working volume was first determined for the robot. The technical
accuracy assessment in the ROSI for this study was then done in the following
manner. (1) The developed accuracy assessment phantom (Phantom II) was fixed
on a measurement platform in the pre-determined working volume. (2) The joint
variable data from each encoder at each DOF were collected from the robot and
with forward kinematics the position of the tip of the instrument was calculated
using the Denavit-Hartenberg (DH) –parameters received from Matlab with the
Robotics Toolbox. (3) The position at each point was compared with the known
positions on the phantom. In these experiments an interval of 40 mm between the
assessed points was used. A total of 17 points on each level was assessed in order
from 1 to 49. Thus, a total of 51 accuracy assessment points were analyzed within
each experiment according to the presented accuracy assessment protocol II.
Figure 26 illustrates the wrist and the tracked instrument touching the phantom II
during the accuracy assessment experiments.
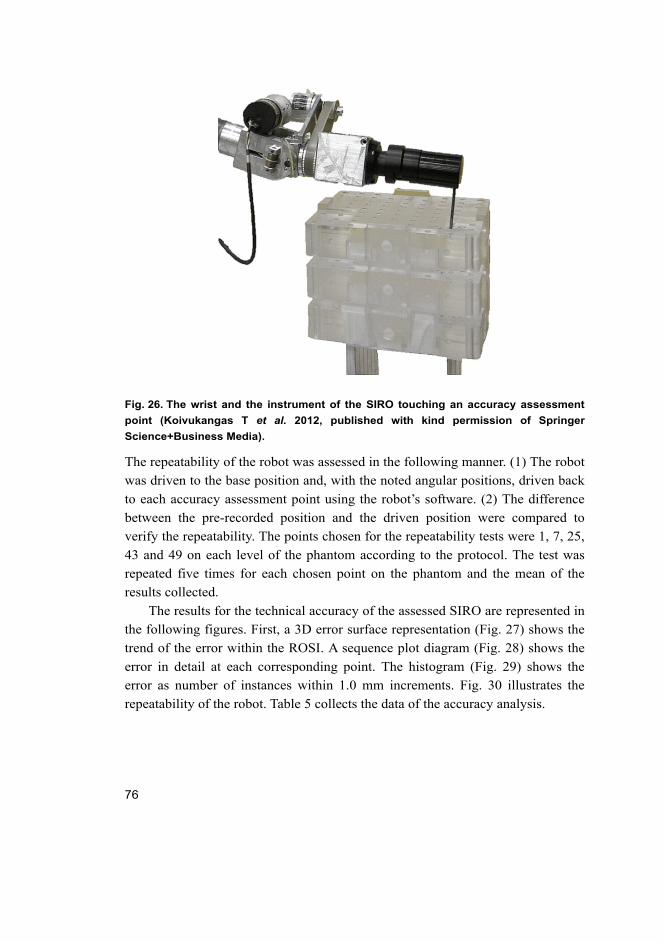
76
Fig. 26. The wrist and the instrument of the SIRO touching an accuracy assessment
point (Koivukangas T et al. 2012, published with kind permission of Springer
Science+Business Media).
The repeatability of the robot was assessed in the following manner. (1) The robot
was driven to the base position and, with the noted angular positions, driven back
to each accuracy assessment point using the robot’s software. (2) The difference
between the pre-recorded position and the driven position were compared to
verify the repeatability. The points chosen for the repeatability tests were 1, 7, 25,
43 and 49 on each level of the phantom according to the protocol. The test was
repeated five times for each chosen point on the phantom and the mean of the
results collected.
The results for the technical accuracy of the assessed SIRO are represented in
the following figures. First, a 3D error surface representation (Fig. 27) shows the
trend of the error within the ROSI. A sequence plot diagram (Fig. 28) shows the
error in detail at each corresponding point. The histogram (Fig. 29) shows the
error as number of instances within 1.0 mm increments. Fig. 30 illustrates the
repeatability of the robot. Table 5 collects the data of the accuracy analysis.
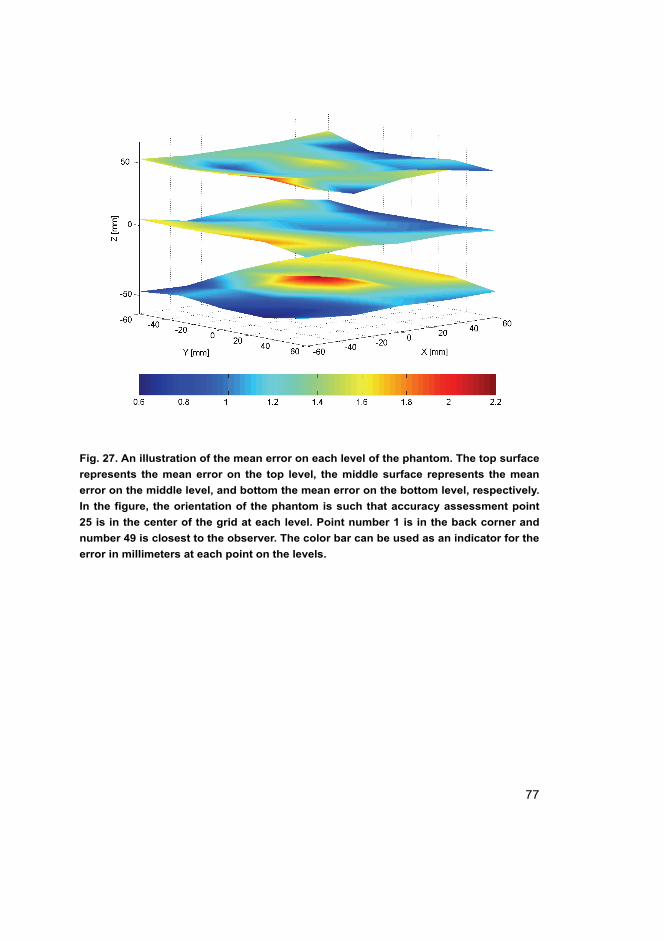
77
Fig. 27. An illustration of the mean error on each level of the phantom. The top surface
represents the mean error on the top level, the middle surface represents the mean
error on the middle level, and bottom the mean error on the bottom level, respectively.
In the figure, the orientation of the phantom is such that accuracy assessment point
25 is in the center of the grid at each level. Point number 1 is in the back corner and
number 49 is closest to the observer. The color bar can be used as an indicator for the
error in millimeters at each point on the levels.
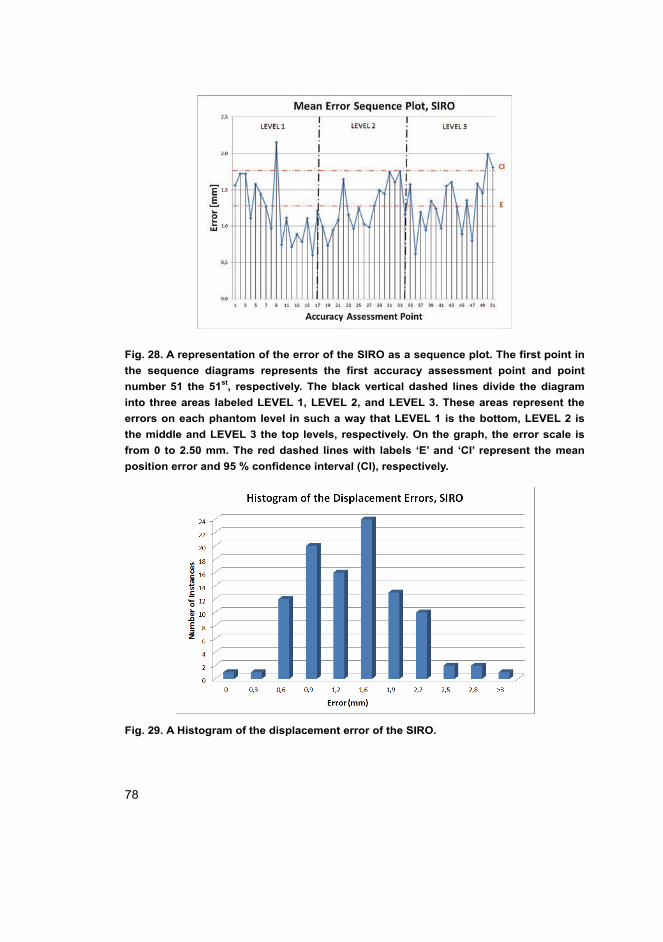
78
Fig. 28. A representation of the error of the SIRO as a sequence plot. The first point in
the sequence diagrams represents the first accuracy assessment point and point
number 51 the 51st, respectively. The black vertical dashed lines divide the diagram
into three areas labeled LEVEL 1, LEVEL 2, and LEVEL 3. These areas represent the
errors on each phantom level in such a way that LEVEL 1 is the bottom, LEVEL 2 is
the middle and LEVEL 3 the top levels, respectively. On the graph, the error scale is
from 0 to 2.50 mm. The red dashed lines with labels ‘E’ and ‘CI’ represent the mean
position error and 95 % confidence interval (CI), respectively.
Fig. 29. A Histogram of the displacement error of the SIRO.
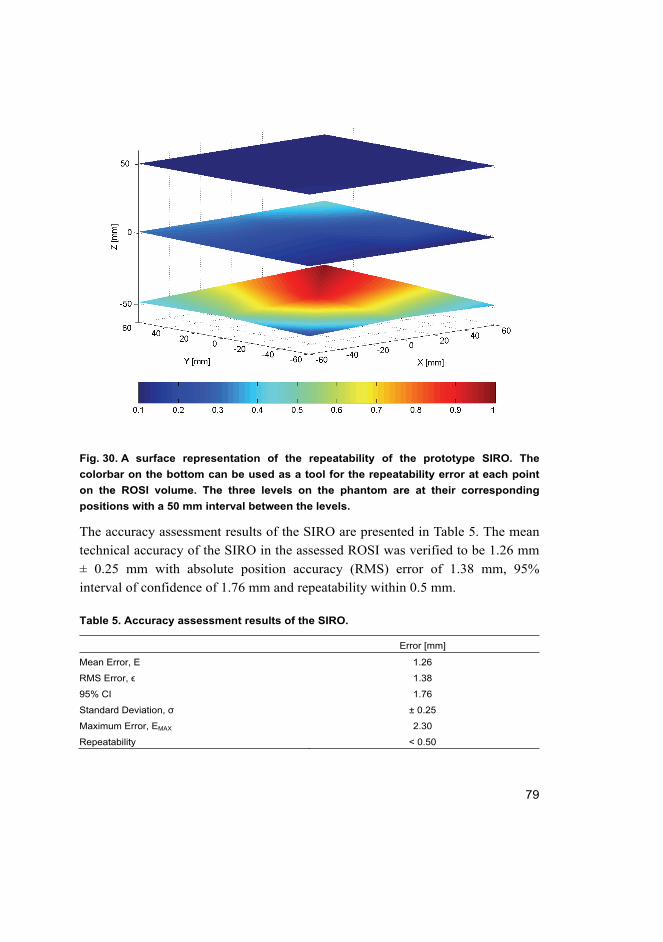
79
Fig. 30. A surface representation of the repeatability of the prototype SIRO. The
colorbar on the bottom can be used as a tool for the repeatability error at each point
on the ROSI volume. The three levels on the phantom are at their corresponding
positions with a 50 mm interval between the levels.
The accuracy assessment results of the SIRO are presented in Table 5. The mean
technical accuracy of the SIRO in the assessed ROSI was verified to be 1.26 mm
± 0.25 mm with absolute position accuracy (RMS) error of 1.38 mm, 95%
interval of confidence of 1.76 mm and repeatability within 0.5 mm.
Table 5. Accuracy assessment results of the SIRO.
Error [mm]
Mean Error, E 1.26
RMS Error, ϵ 1.38
95% CI 1.76
Standard Deviation, σ ± 0.25
Maximum Error, EMAX 2.30
Repeatability < 0.50
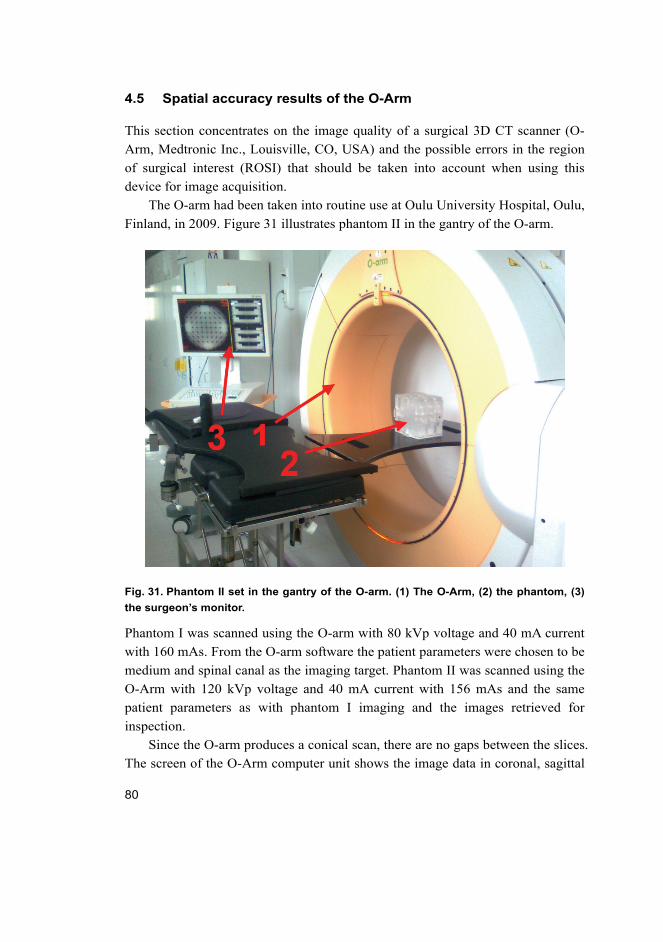
80
4.5 Spatial accuracy results of the O-Arm
This section concentrates on the image quality of a surgical 3D CT scanner (O-
Arm, Medtronic Inc., Louisville, CO, USA) and the possible errors in the region
of surgical interest (ROSI) that should be taken into account when using this
device for image acquisition.
The O-arm had been taken into routine use at Oulu University Hospital, Oulu,
Finland, in 2009. Figure 31 illustrates phantom II in the gantry of the O-arm.
Fig. 31. Phantom II set in the gantry of the O-arm. (1) The O-Arm, (2) the phantom, (3)
the surgeon’s monitor.
Phantom I was scanned using the O-arm with 80 kVp voltage and 40 mA current
with 160 mAs. From the O-arm software the patient parameters were chosen to be
medium and spinal canal as the imaging target. Phantom II was scanned using the
O-Arm with 120 kVp voltage and 40 mA current with 156 mAs and the same
patient parameters as with phantom I imaging and the images retrieved for
inspection.
Since the O-arm produces a conical scan, there are no gaps between the slices.
The screen of the O-Arm computer unit shows the image data in coronal, sagittal

81
and axial views (Fig. 31). The view on the screen may be frozen so that as any of
the views is scanned, the other views refresh simultaneously. This made it
possible to perform the image quality assurance in the following manner:
Phantom I
I The image data was collected using the O-arm, and screenshots of the image
data were saved to the scanner’s database. A screenshot was taken at
approximately 25 mm intervals containing the tips of the calibration pegs and
the middle layer of the calibration levels giving a total of nine slices from the
phantom.
II Visual detection of the accuracy of the images
The images were inspected by connecting lines from each corner of the
calibration pegs on each image layer (Fig. 32). The angles of the connection
lines were calculated (Fig. 34) and the results collected.
The screenshot images were combined in layers so that the bottom level was
made red and the upper layers slightly transparent (Figures 32 and 33). Thus,
the position of the accuracy assessment pegs could be seen with respect to the
upper layers. Also the connection lines on the outer edges were visible and
the difference in the positions could be verified by visual inspection.
By visual inspection, we can see that the image quality of the ascertained area in
the ROSI volume seems to have no noticeable distortion or image artefact using
the parameters for phantom I. The connection lines’ perpendicular angles were at
90 ± 0.5 degrees proving that there is no cone-beam artefact or image distortion
on the outer area of the ROSI volume from the center of each phantom level.
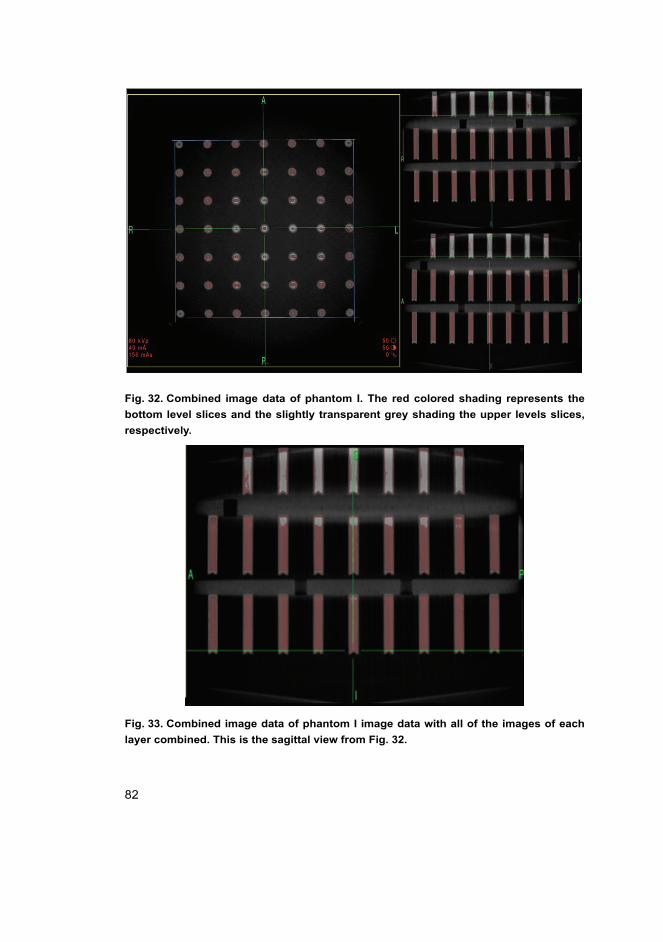
82
Fig. 32. Combined image data of phantom I. The red colored shading represents the
bottom level slices and the slightly transparent grey shading the upper levels slices,
respectively.
Fig. 33. Combined image data of phantom I image data with all of the images of each
layer combined. This is the sagittal view from Fig. 32.
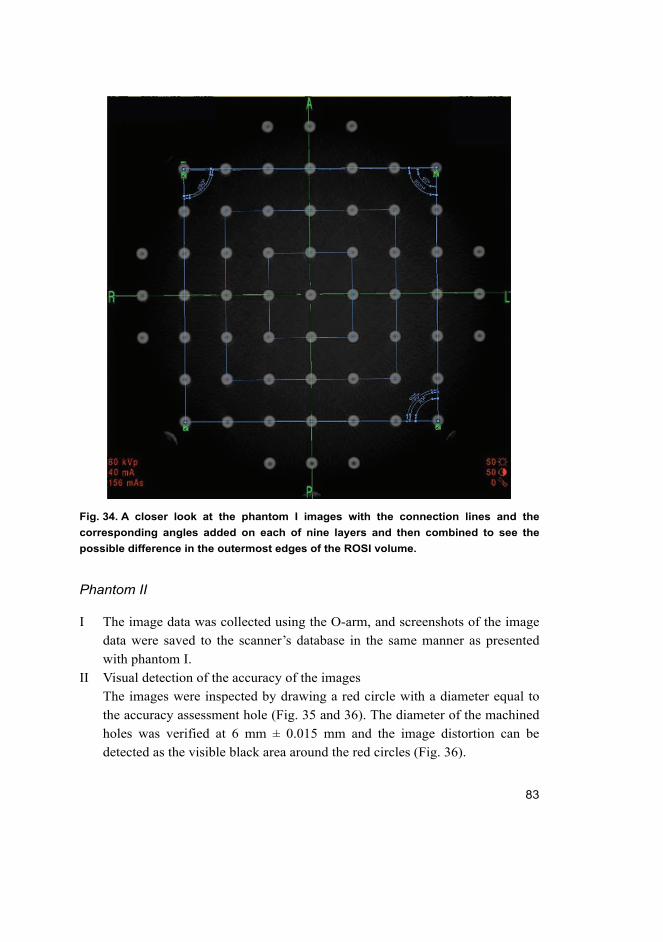
83
Fig. 34. A closer look at the phantom I images with the connection lines and the
corresponding angles added on each of nine layers and then combined to see the
possible difference in the outermost edges of the ROSI volume.
Phantom II
I The image data was collected using the O-arm, and screenshots of the image
data were saved to the scanner’s database in the same manner as presented
with phantom I.
II Visual detection of the accuracy of the images
The images were inspected by drawing a red circle with a diameter equal to
the accuracy assessment hole (Fig. 35 and 36). The diameter of the machined
holes was verified at 6 mm ± 0.015 mm and the image distortion can be
detected as the visible black area around the red circles (Fig. 36).
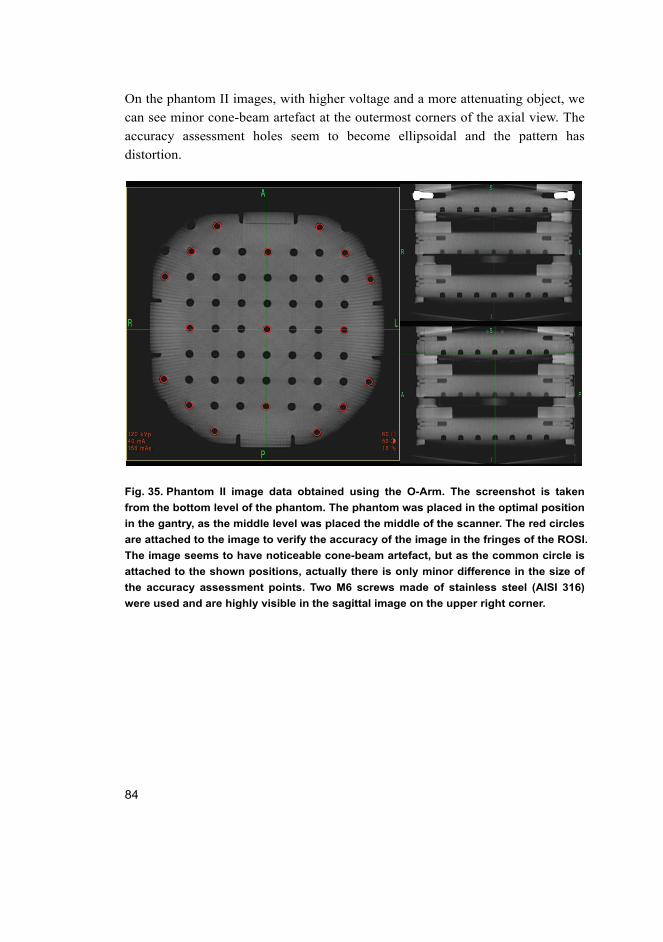
84
On the phantom II images, with higher voltage and a more attenuating object, we
can see minor cone-beam artefact at the outermost corners of the axial view. The
accuracy assessment holes seem to become ellipsoidal and the pattern has
distortion.
Fig. 35. Phantom II image data obtained using the O-Arm. The screenshot is taken
from the bottom level of the phantom. The phantom was placed in the optimal position
in the gantry, as the middle level was placed the middle of the scanner. The red circles
are attached to the image to verify the accuracy of the image in the fringes of the ROSI.
The image seems to have noticeable cone-beam artefact, but as the common circle is
attached to the shown positions, actually there is only minor difference in the size of
the accuracy assessment points. Two M6 screws made of stainless steel (AISI 316)
were used and are highly visible in the sagittal image on the upper right corner.
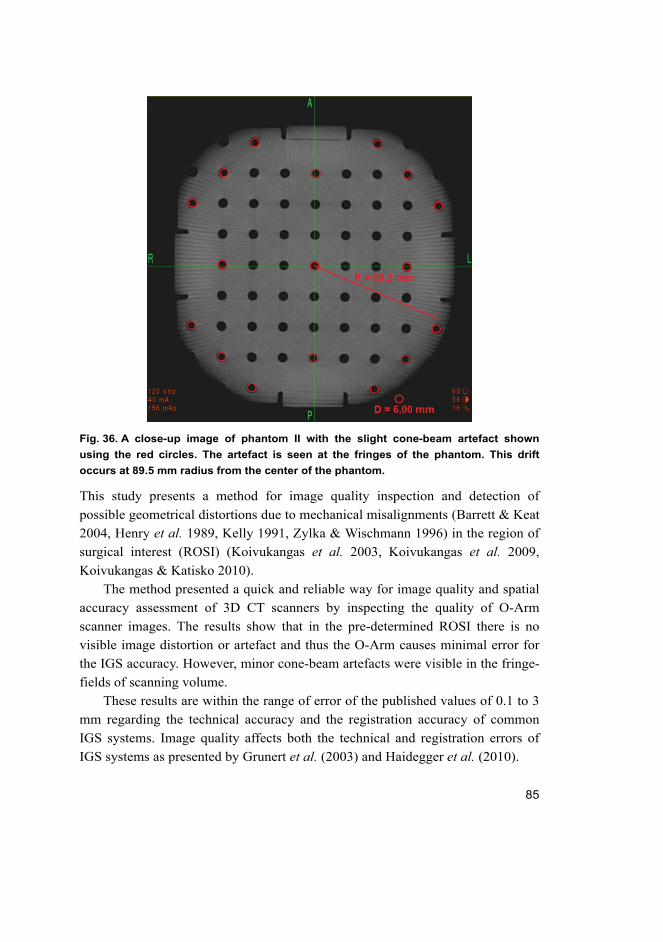
85
Fig. 36. A close-up image of phantom II with the slight cone-beam artefact shown
using the red circles. The artefact is seen at the fringes of the phantom. This drift
occurs at 89.5 mm radius from the center of the phantom.
This study presents a method for image quality inspection and detection of
possible geometrical distortions due to mechanical misalignments (Barrett & Keat
2004, Henry et al. 1989, Kelly 1991, Zylka & Wischmann 1996) in the region of
surgical interest (ROSI) (Koivukangas et al. 2003, Koivukangas et al. 2009,
Koivukangas & Katisko 2010).
The method presented a quick and reliable way for image quality and spatial
accuracy assessment of 3D CT scanners by inspecting the quality of O-Arm
scanner images. The results show that in the pre-determined ROSI there is no
visible image distortion or artefact and thus the O-Arm causes minimal error for
the IGS accuracy. However, minor cone-beam artefacts were visible in the fringe-
fields of scanning volume.
These results are within the range of error of the published values of 0.1 to 3
mm regarding the technical accuracy and the registration accuracy of common
IGS systems. Image quality affects both the technical and registration errors of
IGS systems as presented by Grunert et al. (2003) and Haidegger et al. (2010).
86
4.6 Summary of the research contributions
The systems and methods developed in this thesis as research contributions are:
1. The concept of accuracy testing to meet the needs of quality assurance of
navigators and robots in a hospital environment based on the developed
tracking error theory.
2. A ‘real world’ universal accuracy assessment phantom and protocol for
periodic quality assurance of surgical guidance devices for use in the hospital
setting.
– A phantom
– An accuracy assessment protocol based on statistical formulation
3. Accuracy analysis and evaluation of the two most widely used tracking
modalities and the issues that should be taken into account when setting up
the OR for IGS procedures using these navigators.
– A method for assessing the accuracy of the navigators in the total
ROSI volume
– The dependence of accuracy on the distance from the optical camera
pair to the patient in OTS
– The dependence of accuracy on the distance from the EM field
generator to the patient in EMTS
– Based on the comparison of the results, possible new IGS procedures
for the EMTS modality
4. Accuracy analysis of the surgical robot and the development of the SIRO
– The developed accuracy analysis tools and methods utilized in
accuracy assessment of surgical robots
– Methods and development guides for a 6 DOF surgical robot for use
in MRI
5. Spatial accuracy detection of the O-Arm
– The developed tools and methods utilized in detecting spatial
accuracy of a surgical 3D imager in the ROSI volume.
87
5 Discussion
The discussion of this thesis is divided into four sections. Section 5.1 is a
discussion of the developed tools and methods that were designed for use as
routine hospital accuracy assessment tools and that were utilized in the accuracy
assessment of the surgical guidance devices. Section 5.2 contains the discussion
of the accuracy assessment results of the studied navigators. Section 5.3 discusses
the accuracy assessment of the prototype surgical robot (SIRO). Finally, Section
5.4 contains discussion of the spatial accuracy results of the studied surgical 3D
CT scanner, the O-Arm.
5.1 Accuracy assessment tools and methods for periodic testing of IGS devices
In IGS surgical navigators are used as the main localization technique for
instrument tracking. The most commonly used technique is the optical tracking
system (OTS) (Grunert et al. 2003, Mascott 2005, Wiles et al. 2004). For the
present research, accuracy assessment phantoms and protocols were developed
for periodic assessment of the accuracy of surgical navigators and other IGS
equipment while in routine hospital use (Koivukangas et al. 2009, Koivukangas
& Katisko 2010). The developed phantoms and protocols are a response to the
suggestion by industry for “real world” methods for use in hospitals and designed
for use in the region of surgical interest (ROSI) (ASTM 2011, Haidegger et al.
2010, Stiehl et al. 2007, Wiles et al. 2004). Furthermore, the method satisfies the
requirements of, first, a comprehensive set of statistics representative of the
accuracy and, second, a clear definition of the accuracy assessment protocol
(Stiehl et al. 2007). As this thesis answers to the need of accuracy assessment
tools and methods for periodic evaluation of IGS devices, the technical accuracy
of the devices was represented as mean accuracies in the ROSI. The tools and
methods for the technical accuracy assessment within the studied ROSI provide
essential information for hospital users to contact the manufacturer of the device
if a clear indication of inaccuracy has been detected. The purpose of the tools and
methods is to verify the performance of IGS devices and to indicate the possible
need for re-calibration.
Possible occurrence of image artefact of the phantoms was minimized by
using the chosen material, PMMA. The phantoms were designed for commonly
used surgical CT and MRI scanners, the latter producing magnetic fields between
88
0.15 T to 3 T, and regular tap water with common dish washing solvent was used
as the liquid. Thus, heating effects and gradient field related and chemical
artefacts could be minimized. Naturally increasing the MRI field strength for
example, would cause these artefacts to worsen. Since the tools were utilized in a
common hospital setting, this effect was considered to be outside of the scope of
this thesis.
As demonstrated in the accuracy analysis done for the two commercial
navigators that are in use at Oulu University Hospital, the method can be
universally applied to periodically confirm the quality of IGS guidance devices
such as surgical navigators and medical robots designed to function in the region
of surgical interest. Furthermore, slight cone-beam artefact was detected when the
phantom was scanned with the surgical 3D CT –scanner.
Due to the nature of surgical procedures, anatomic changes occur in the
patient’s anatomy. These changes (e.g., brain shift) in the anatomy are highly
likely to occur during IGS, which is based on preoperative image data acquired
before the procedure. Thus the application accuracy is not uniform within
different assessments even when using common procedures and tools. Based on
these facts and the accuracy assessment of several IGS devices, it can be
concluded that the analysis of technical accuracy is in fact the most necessary
error component that can be periodically verified and improved. Naturally the
errors in the imaging scanners that are related to registration accuracy can cause
significant error for the total IGS procedure, but the testing of these devices has
already been standardized and is a mandatory maintenance procedure.
In the results analysis, the 3D models showed the error dependence on the
location of the accuracy assessment points within the ROSI volume. The
sequence plots show further in detail the error in millimeters at each point. The
histograms of each modality and device show the distribution of the error as
instances within certain tenths of a millimeter. The histograms are tools for seeing
the dependence of the outlier errors with respect to the mean and RMS errors.
These graphs by themselves may not be the best way of presenting the error since
there is no real dependence factor for any other statistics, because of the nature of
the error being distance values, which by definition are presented as positive
numbers. These errors are shown to be systematic and similar within the different
IGS devices, namely the OTS and EMTS of the navigators, and the SIRO robot.
The 95% CI further clarifies the accuracy of the tested device and strengthens the
mean and RMS accuracy results by showing the user the effect of highest errors
on the total accuracy. This is seen especially in Figure 24, where the means of the
89
errors of the two EMTS navigators have a difference of 0.20 mm (0.30 mm for
the S7 and 0.50 mm for the Treon plus), but the difference in the 95% CI error is
0.94 mm (0.82 mm for the S7 and 1.76 mm for the Treon plus). Naturally
extensive temperature and humidity changes could cause errors to deviate even
more, but the effect of these aspects was minimized by testing the IGS devices in
common ambient conditions.
5.2 Accuracy assessment of surgical navigators
After operationalizing the concept of accuracy of image-guided devices, and
consideration of materials and machining to fulfill these requirements, the study
continued with assessment of the accuracy of surgical navigators being used in
the hospital setting. The phantom accuracy assessment points were machined
symmetrically and in three levels to obtain an accuracy assessment volume
mimicking that of the human head, i.e. the region of surgical interest (ROSI) and
specifically in the neurosurgical region (Koivukangas et al. 2009, Koivukangas &
Katisko 2010).
Compared with previous reports, one of the features of the present study was
that the phantoms and study protocol were designed to be used periodically to
verify accurate functioning in the actual hospital setting during routine use of the
surgical navigators. Earlier accuracy assessment studies of surgical navigators
have concentrated on the overall accuracy of the system in general and on the
error sources leading to inaccuracies (Ringel et al. 2009, Hassfeld & Müchling
2000, Kücker et al. 2006, Mascott 2005, Mösges & Schlöndorff 1998, NDI 2011,
Simon 1997, Wiles et al. 2004). The present accuracy assessment results on the
comparison of the two tracking modalities are in the range reported by these
groups.
During this research, the accuracy of the OTS was assessed in detail using
also directional analysis to find the source of error in the surgical procedure setup
and the factors that need to be taken into account when placing the camera with
respect to the patient. The results show that in placing the surgical navigator
equipment using OTS, the most important factor for minimizing displacement
error is the distance from the optical camera to the object.
The overall results for the OTS, being 0.30–0.45 mm, are clearly in the
tolerable error range for safe operations. Groups assessing the OTS have reported
accuracies in the range of 0.1 mm to 1.4 mm, again depending on the assessment
procedure and the device assessed (Alakuijala 2001, Hassfeld & Müchling 2000,
90
Kücker et al. 2006, Mascott 2005, Mösges & Schlöndorff 1998, NDI 2011,
Ringel et al. 2009, Ruohonen & Karhu 2010, Simon 1997, Wiles et al. 2004,
Widmann et al. 2012, Wittmann et al. 2011). Also, a company making
commercial optical cameras for surgical navigators (NDI) gives their new
products, the Polaris Spectra® and Polaris Vicra® RMS accuracies of 0.25 mm
with a 95% CI of 0.5 mm (NDI 2011).
The present study also showed that the direction resulting in increasing error
was the distance from the optical camera pair to the navigated object. This was
seen to be systematic also in the error sequence plot diagrams (Fig. 19). One
possibility for this phenomenon can be seen in the basic stereo camera model
(Schenenberger 2004). There is a tendency for lens distortions using the optical
cameras as the tracking method (Schenenberger 2004, Weng et al. 1992). It has
been shown that the overall technical accuracy of infrared camera based optical
tracking may be influenced by the following different error components: 2D
calculation of the patterns accounts for 0.02 mm of the error, residual image
distortions account for 0.17 mm of the error, thermal drift with up to 0.11 mm
error, scaling which accounts for 0.26 mm error and noise with an additional 0.01
mm error component, with the total error summing to 0.47 mm (Schenenberger
2004). These error components seem to explain the RMS errors obtained also in
the present study.
This finding is comparable to an optical camera manufacturer’s results in
earlier studies in the literature (Wiles et al. 2004). The group assessed the
accuracy of the NDI Optotrack and the Polaris measurement systems that were
used in OTS and they found a notable systematic overall RMS error increase in
the direction from the optical camera to the object. These results further indicate
that the main factor contributing to the RMS error throughout the entire assessed
volume in fact comes from the error in the longitudinal y direction (their z
direction).
The technical accuracy of the EMTS was found to be 0.30–0.50 mm. Thus,
the accuracy of the devices was found to be acceptable for surgical procedures.
Earlier accuracy assessment of the EMTS has been reported to be in the range of
0.17 mm to 1.4 mm depending on the devices and assessment procedures
(Alakuijala 2001, de Lambert et al. 2012, Frantz et al. 2003, Hummel et al. 2006,
Mascott 2005, Schicho et al. 2005, Schneider & Stevens 2005, Simon 1997). The
results also show that the error is highest on the furthest edge of the assessed
volume and the error increases as the function of the cubic radius of the EM field
generator.
91
Also, these results show that the assessed navigator tracking modalities were
nearly equal in the accuracies. Thus, the most suitable method of instrument
tracking for a particular surgical procedure can be chosen by criteria other than
plain technical accuracy. The greatest difference between the tracking modalities
was found to be regarding the instruments used. For the EMTS modality, the
instruments are quite flexible. If the instruments are forced into a place so that
they are subject to bending, it may result in high accuracy errors. Since the EMTS
navigation is based on tracking the coils on the instrument, the relative position of
the coils must not change.
As the difference between the accuracies of the OTS and EMTS was marginal,
this study showed that EMTS is a very suitable method for surgical navigation.
The possible limitations of use when compared to the OTS are in some
interventional procedures. Because of the nature of EMTS tracking, this tracking
method may not be suitable for iMRI procedures. On the other hand, EMTS has
unique advantages compared to OTS that have received little notice in previous
studies. The coils in the instruments are placed near the end of each tip. As a
comparison, the sensing spheres or LED-markers on the OTS instruments are
placed so that they are visible (Figure 7). This is a significant difference between
the tracking methods and means that surgical navigation based on EMTS may be
used more accurately and closer to the ROSI (region of surgical interest) and that
the instruments may be guided closer to the sensitive structures in the human
anatomy. Also, since the patient trackers are light and may be attached to the
patient without for example skull clamps, the immobilization of the patient during
procedures is not as critical as with OTS based navigation. Another noticeable
aspect concerns small children in pediatric procedures. The use of EMTS makes
navigation possible even for babies as rigid immobilization is not necessarily
required.
Based on the experimental analysis of the navigator accuracies it was shown
that EMTS is very suitable for a variety of surgical procedures and its use may be
extended to specialties in which OTS may not be as suitable.
5.3 Accuracy assessment of the SIRO
The accuracy assessment results of the prototype surgical robot (SIRO, Heikkilä
et al. 2012, Koivukangas et al. 2012, Virtanen 2006) were within the range of
error accepted in the literature (Grunert et al. 2003) and also within the range of
error of commercial robots in the surgical field (Haidegger et al. 2010). Thus, the
92
robot’s performance is clearly tolerable and promising for further study and
enhancement. The accuracy assessment protocol together with the phantom also
proved to be a suitable way of accuracy analysis of a surgical robot in the region
of surgical interest (ROSI).
A total of 51 points on the phantom were localized in both of the two
experiment sets with the robot according to the accuracy assessment protocol, and
the mean error of each corresponding point analyzed. The distances measured
from a fixed origin with the robot were compared to the known phantom accuracy
assessment point distances on the phantom giving the mean error for the robot
within the ROSI. The repeatability was assessed by using the collected angular
data of the robot to drive the tip of the instrument from base position back to each
pre-determined accuracy assessment point. The mean difference in the location
between the five experiments on each point is considered as the repeatability.
The mean technical accuracy for the SIRO in the assessed ROSI was verified
to be 1.26 mm ± 0.25 mm with absolute position accuracy (RMS) error of 1.38
mm, 95% interval of confidence of 1.76 mm and repeatability within 0.5 mm. In
the 3D representation of the results we can see that the error tends to be
systematic at the furthest area of the studied ROSI. Also the systematic error in
the vertical direction could be seen (Koivukangas et al. 2012).
The reason for this phenomenon is that the cables on the transmission of DOF
5 and 6 crept slightly due to the tension during the long test drives of the accuracy
assessment. Another reason for the systematic error may have been that the robot
base level slightly differed from that of the phantom level. Also, the basic error
sources in the mechatronic construction of robots in general have an effect on the
total and systematic error. These error sources include possible instrument errors
due to the encoders, elasticity in the structure and the measurement errors in joint
positions. Joint position measurement errors have a tendency of multiplying
through the DH-chain (Kwartowitz et al. 2006, Shiakolas et al. 2002). As
presented, the construction of the present robot, SIRO, was intended to be used in
the MRI environment. This objective naturally set restrictions in using common
technologies and components; thus a number of these parts were designed and
developed during the research project solely for this purpose. The technical error
is thus partially affected by these components.
The results presented in this study reflect these basic phenomena of accuracy
and sources of error of robotic systems. The error trends shown in 3D surfaces
demonstrated that the error increases as the distance from the robot base increases.
Thus, the farther the joint is from the base, the larger is the localization error.
93
It has been shown that the largest effect on robot accuracy is based on its
mechanical construction (Shiakolas et al. 2002). The encoder resolutions of the
joints on the SIRO were 0.006 degrees (joint 1), 0.09 degrees (joint 2), 0.09
degrees (joint 3), 0.006 degrees (joint 4), 0.06 degrees (joint 5), and 0.0125
degrees (joint 6). Based on these resolutions of the encoders, the repeatability of
the position of the tip of the tool is at the level of ±0.26 mm, ±0.24 mm, and
±0.37 mm in x, y and z directions, respectively (Heikkilä et al. 2012).
Based on the requirements for RMS accuracy of IGS, 3–5 mm is generally
considered acceptable as is 2 mm for neurosurgical IGS (Grunert et al. 2003).
Also, submillimetric error has been recommended for robot assisted IGS
procedures (Grunert et al. 2003, Haidegger et al. 2010).
Earlier research results have been published with similar findings of
commercial robots (Grunert et al. 2003, Drake et al. 1993, Kwartowitz et al.
2006). Haidegger et al. collected the accuracy analysis of the most widely used
commercial robots (The Puma 200, the ROBODOC, the NeuroMate and the da
Vinci) with the following results: technical accuracy has been reported in the
range of 0.5–1.35 mm and repeatability of 0.05–0.15 mm (Haidegger et al. 2010).
Bell et al. (2012) recently reported an accuracy of 0.56 mm ±0.41 mm for a robot
that was specially built for stereotactic cochlear implantation by their group at the
ARTOG Center, University of Bern, Switzerland. Also, Song et al. (2009) and
Yong et al. (2010) reported accuracies of 0.89 mm (Song et al. 2009) and 1.77
mm (Yong et al. 2010) for their custom built surgical robots.
The accuracy assessment may seem to have been done with rather compact
data containing two experiment sets of 51 analyzed points from which the
analysis error was done. However, since there was no noticeable deviation within
data received in the experiment sets, and since the repeatability tests of a total of
15 points driven five times each gave such remarkable results, it was concluded
that the accuracy tests were extensive enough for the accuracy assessment of the
robot. Also, as the SIRO robot is a prototype platform, a goal for the accuracy
assessment was to collect information on the maneuverability and limiting factors
of such a construction for future research. Thus, the lack of more extensive data
for the accuracy assessment was justified.
After these encouraging accuracy and repeatability results, future work will
include enhancement of the link and joint power transmission of the current robot.
Especially, the cable driven power transmission for the wrist movements (5th and
6th DOF) are under study with the goal of a more rigid, MR compatible, and
affordable technique for replacing the current cable drives.
94
The accuracy assessment exercise using the SIRO, a prototype surgical robot,
also demonstrated the flexibility of the present phantom and protocol, whose
original intents also included quality assurance of surgical guidance devices
invented and developed in research groups.
5.4 Spatial accuracy of the O-Arm
Image artefacts can decrease the spatial accuracy of CT images making them
useless for diagnosis and thus for use in IGS procedures (Barrett & Keat 2004). It
is necessary to understand possible causes for image artefact and also to have
useful tools for inspecting the spatial accuracy.
It can be seen that using a less attenuating phantom (i.e., less material) with
relatively low imaging parameters, there was no noticeable image distortion or
other image artefact that could result in a noticeable decrease in the accuracy of
IGS procedures. On the other hand, using a more attenuating phantom (i.e., more
material) with higher voltage, the cone-beam artefact became visible at fringes of
the imaged volume.
Thus, the object being scanned should be taken into account when choosing
parameters and positioning the object in the gantry for image acquisition using a
CT-scanner.
Future research on image quality inspection contains evaluation of the
accuracy assessment of the surgical navigators using the image data acquired with
the O-Arm using direct registration. Also, other sources of image artefact will be
studied using surgical instruments such as retractors and implantable fixation
screws commonly used in orthopedic procedures.
95
6 Conclusions
The process of developing reliable tools and methods for accuracy assessment of
IGS devices for this study began in early 2008. At that time there were no
standardized methods available and the research was begun by understanding and
determining the region of surgical interest. As this research arose from the needs
of neurosurgeons and scientists at the Neurosurgical Research Unit in Oulu
University Hospital, Oulu, Finland, the region of surgical interest was chosen to
roughly mimic the size of a human head.
As stated in the introduction and literature review, the multi-national
committee led by the ASTM began their work in standardizing tools and methods
for accuracy assessment of IGS devices. Their scope was to publish a preliminary
standard with orthopedic procedures as the main field of application. This process
led to the ASTM F2554-10 standard that was accepted in December 2010 and
published as a standard practice in 2011. This preliminary standard however left
open questions in other fields e.g. neurosurgery. The standard states that the
practice provides recommendations for the processes of accuracy assessment.
The open questions that may lead to subsequent standards will address the IGS
system along with any necessary imaging modality. Additional standards are also
needed for specialty specific procedures and surgical specialties such as
neurosurgery, including brain tumor biopsy and so forth.
The present study was focused on IGS systems in neurosurgical procedures.
The specified and developed tools and methods were utilized in accuracy
assessment of two commercial navigators, both enabling the OTS and EMTS
modalities, and a prototype surgical robot (SIRO). The developed tools and
methods are intended for periodic accuracy assessment to verify the device
performance, rather than for actual re-calibration. Thus, the mathematical
representation of the technical accuracy was determined as the mean accuracy in
the ROSI. Also, a study on the spatial accuracy of a commercial, surgical 3D CT
scanner (the O-Arm) was performed using both developed phantoms. It is clear
that the accuracy assessment of the IGS devices in the pre-determined ROSI
could be performed and the total ROSI volume analyzed. The 3D error surfaces
show the trend of error of each tracking system in the overall volume. If the
assessment was done in a single surface, the error trend could have been
dramatically different. This is the main difference between this study and the
abovementioned standardized method. Furthermore, since the present phantoms
were made of PMMA, the spatial accuracy of the imager could also be evaluated.
96
Finally, as the phantoms were developed as three level devices, the volumetric
assessment in the ROSI could be reliably assessed.
The results indicate that the two most used tracking modalities in the fields of
IGS, namely the OTS and EMTS, have nearly identical accuracy. Since these
tracking methods are based on different physical phenomena, also the surgical
setups of both modalities are unique and the error dependence on placing the
systems was demonstrated. Based on this fact, suggestions were made in placing
the devices for surgical procedures. Also, suggestions on using either modality for
special cases were discussed. It was found that OTS accuracy was highly
dependent on the distance from the optical camera pair array to the navigated
object. On the other hand, the EMTS magnetic field generator and patient tracker
placement with respect to the navigated object was shown to be critical. The
accuracy assessment results and performance of the SIRO robot showed the
dependence on the placement of the robot base with respect to the object being
critical. The detection of the spatial accuracy of the O-Arm showed noticeable
image artefact in the fringes of the scanned phantom.
The accuracy assessment phantom and protocol satisfied the need expressed
in the literature for a way to periodically check the accuracy of surgical navigators,
robots and other IGS guidance devices, especially those functioning within a
defined region of surgical interest (ASTM 2012, Haidegger et al. 2010,
Kazanzides 2006, Kroneif et al. 2011, Kwartowitz et al. 2006). The importance of
assessing IGS devices and evaluating the performance of robots in particular was
also stressed by Ringel et al. (2012). They showed that for example in some cases
free-hand assisted pedicle screw implantation may be more accurate than that
assisted by the robot.
Recently, the growing number of issues related to the accuracy and
functionality of surgical image-guided devices underscores the need for methods
that can be routinely used to assess the accuracy of these devices in the hospital
setting (MAUDE 2012). Had the accuracy of the devices been assessed routinely,
probably a great number of these errors could have been detected pre-surgically.
The presented methods for accuracy assessment of surgical guidance devices
could be utilized in the following cases:
1. When the IGS guidance device is taken into routine use
2. Periodically for quality assurance
3. When the device indicates accuracy decrease
4. When the user suspects accuracy decrease

97
5. In all clinical research environments in which new IGS technology is being
developed.
The accuracy assessment was done to verify the error in the region of
neurosurgical interest (ROSI). Thus, the assessed volume was limited to mimic
the size of the human head. Increasing the ROSI volume may result in greater
deviation in the results.

98
99
References
Adams L, Knepper A, Meyer-Ebrecht D, Rüger R & van der Brug W (1996) Image guided surgery – Optical position measurement for brain surgery. IEEE Computer 29(1): 48–54.
Alakuijala J (2001) Algorithms for modeling anatomic and target volumes in image-guided neurosurgery and radiotherapy. PhD dissertation, Univ Oulu, Dept Electrical Engineering, Oulu, Finland.
Alexander E III, Moriarty T, Kikinis R & Jolesz F (1995) Innovations in minimalism: intraoperative MRI. Clinical Neurosurgery. Proceedings of the Congress of Neurological Surgeons, San Francisco, CA, USA 43: 338–352.
ASM International (1988) Engineered materials handbook Volume 2: Engineering plastics. ASM International, Metals Park, OH, USA.
Barrett J & Keat N (2004) Artifacts in CT: Recognition and Avoidance. RadioGraphics 24: 1679–1691.
Beaulieu A, Shepard T, & Ellis R (2008) A process control system model for interactive image guided surgery. Proceedings of the 2nd SysCon 2008 - IEEE International Systems Conference, Montreal, Canada: 1–8.
Bell B, Stieger C, Gerber N, Arnold A, NEuer C, Hamacher V, Kompis M, Nolte L, Caversaccio M & Weber S (2012) A self-developed and constructed robot for minimally invasive cochlear implantation. Acta Oto-Laryngology 132(4): 355–60.
Birkenfeller W, Watzinger, F, Wanschitz F, Ewers R & Bergmann H (1998) Calibration of tracking systems in a surgical environment. IEEE Trans Med Imaging 17(5):737–742.
Chiao J, Goldman J, Heck D, Kazansides P, Peine W, Stiehl J, Yen D & Dagalakis N (2008) Metrology and standards needs for some categories of medical devices. J Res Natl Inst Stand Technol 113(2): 121–129.
Chinzei K & Miller K (2001) MRI guided surgical robot. Proceedings of the Australian Conference in Robotics and Automation, Sydney, Australia: 50–55.
Chung A, Edwards P, Deliganni F & Yang G-Z (2004) Freehand cocalibration of optical and electromagnetic trackers for navigated bronchoscopy. MIAR 2004, LNCS 3150: 320–328.
Clarke J, Deakin A, Picard F & Nicol A (2008) Technical evaluation of the positional accuracy of computer assisted surgical systems. Proceedings of the 8th Annual Meeting of CAOS - Int Proc: 333–335.
Cleary K & Nguyen C (2001) State of the art in surgical robotics: Clinical applications and technology challenges. Comp Aid Surg 6(6): 312–328.
Corke PI (1996) A Robotics toolbox for MATLAB. IEEE Rob Aut Mag 3(1): 24–32. de Lambert A, Esneault S, Lucas A, Haigron P, Chinquin Ph & Magne JL (2012)
Electromagnetic tracking for registration and navigation in endovascular aneurysm repair: A phantom study. Eur J Vasc Endovasc Surg 43(6): 684–9.
Drake JM, Joy M, Goldenberg A & Kreindler D (1991) Computer- and robot-assisted resection of thalamic astrocytomas in children. Neurosurg 29(1): 27–33.

100
Drake JM, Prudencio J & Holowka S (1993) A comparison of a PUMA robotic system and the ISG Viewing Wand for neurosurgery. In: Maciunas R (ed) Interactive Image-guided Neurosurgery. Amer Assoc Neurol Surgeons, USA: 121–133.
Fischer GS (2005) Electromagnetic tracker characterization and optimal tool design (with application to ENT surgery). MSc thesis. John Hopkins Univ, Dept Mech Eng. Baltimore, MD, USA.
Fitzpatrick JM, West JB & Maurer CR Jr. (1998) Predicting error in rigid-body, point based registration. IEEE Trans Med Imaging 17: 694–702.
Frantz DD, Wiles AD, Leis S & Kirsch S (2003) Accuracy assessment protocols for electromagnetic tracking systems. Phys Med Biol 48: 2241–51.
Galloway RL, Berger MS, Bass A & Maciunas RJ (1993) Registered intraoperative information: electrophysiology, ultrasound, and endoscopy. In: Maciunas R (ed) Interactive image-guided neurosurgery. Amer Assoc Neurol Surgeons, USA: 247–258.
Gassert R, Burdet E & Chinzei K, (2008) MRI-compatible robotics. A critical tool for image-guided interventions, clinical diagnostics, and neuroscience. IEEE Eng Med Biol Mag 3: 12–14.
Glauser D, Fankhauser H, Epitaux M, Hefti JL & Jaccottet A (1995) Neurosurgical robot Minerva: first results and current developments, J Image Guid Surg 1: 266–272.
Graig J (1986) Introduction to robotics, mechanics & control. Reading, MA, USA, Addison-Wesley: 35–42, 114–119.
Grunert P, Darabi K, Espinosa J, & Filippi R (2003) Computer aided navigation in neurosurgery. Neurosurg Rev 26: 73–99.
Goldman L (2007) Principles of CT and CT technology. J Nucl Med Tech 35(3): 115–128. Haidegger T, Kazandides P, Rudas I, Benyó B & Benyó Z (2010) The importance of
accuracy measurement standards for computer-integrated interventional systems. EURON GEM Sig Workshop on The Role of Experiments in Robotics Research at IEEE ICRA: 1–6.
Haidegger T & Virk GS (2012) International Standardization Efforts in Medical Robotics. A presentation at the ICRA 2012 Workshop on: Modular Surgical Robotics: how can we make it possible? Theme: Robots and Automation: Innovation for Tomorrow’s Needs. 2012 IEEE International Conference on Robotics and Automation. St. Paul, MN, USA. URI: http://www.eurosurge.eu/c/document_library/get_file?uuid=754447 a3-6fa0-4b42-acef-9547b592912f&groupId=13342/. Cited 2012/6/1.
Hassfeld S & Müchling J (2000) Comparative examination of the accuracy of a mechanical and an optical system in CT and MRT based instrument navigation. Int J Oral Maxillofac Surg 29: 400–407.
Hendee W & Morgan C (1984) Magnetic resonance imaging: Part I – physical principles (medical progress). The Western J Med 141: 491–500.
101
Heikkilä T, Yrjänä S, Kilpeläinen P, Koivukangas J & Sallinen M (2012) An assistive surgical MRI compatible robot - first prototype with field tests, explicative cases of controversial issues in neurosurgery. In: Signorelli F (ed), ISBN: 978-953-51-0623-4. InTech. URI: http://www.intechopen.com/books/explicative-cases-of-controversial-issues-in-neurosurgery/an-assistive-surgical-mri-compatible-robot-first-prototype-with-field-tests/. Cited 2012/6/29.
Hill DLG, Batchelor PG, Holden M & Hawkes DJ (2001) Medical image registration. Topical Review. Phys Med Biol 46: R1–45.
Holmes D III, Rettmann M & Robb R (2008) Visualization in image-guided interventions. In: Peters TM & Cleary KR (ed) Image-guided interventions: technology and applications. Springer Science+Business Media, LLC, New York, NY, USA: 45–80.
Hosoda T, Takeuchi H, Hashimoto N, Kitai R, Arishima H, Kodera T, Higashino Y, Sato K & Kikita K (2011) Usefulness of intraoperative computed tomography in surgery for low-grade gliomas: a comparative study between two series without and with intraoperative computed tomography. Neurologia Medico-Chirurgica 51: 490–495.
Hummel J, Figl M, Birkenfellner W, Bax M, Shahidi R, Maurer Jr. C & Bergmann H (2006) Evaluation of a new electromagnetic tracking system using a standardized assessment protocol. Phys Med Biol 51: N205–210.
ISO 5725-1:1994(E) (1994) Accuracy (trueness and precision) of measurement methods and results: Part 1. General principles and definitions. The International Organization for Standardization, Geneva, CH.
ISO 9283 (1998) Manipulating industrial robots-performance criteria and related test methods. The International Organization for Standardization, Geneva, CH.
Katisko J (2004) Optisesti neuronavigoitu ultraäänikuvaus intraoperativisessa magneetti-kuvausympäristössä. Lic. thesis. Univ Oulu, Dept Physics and Neurosurgery and Oulu University Hospital, Oulu, Finland.
Katisko J (2012) Intraoperative imaging guided delineation and location of regions of surgical interest – feasibility study. Ph.D. dissertation, Faculty of Medicine, Institute of Clinical Medicine, Dept Neurosurgery, and Faculty of Medicine, Institute of Diagnostics, Dept Diagnostic Radiology, Univ Oulu, Oulu, Finland.
Kazanzides P (2006) Surgical robots and phantom (artefact) devices. In: Proceedings of the ASTM workshop on medical devices metrology and standards. ASTM, NIST, NCI, FDA and UT. Arlington, Atlanta, USA.
Khatib O, Craig J & Lozano-Pérez T (ed) (1992) The Robotics Review 2. The MIT Press. Cambridge, MA, USA.
Knappe P, Gross I, Pieck S, Wahrburg J, Kuenzler S & Kerchblaumer F (2003) Position control of a surgical robot by a navigation system. Proceedings of the International Conference on IEEE/RJS Conference on Intelligent Robots and Systems, Las Vegas. Nevada, USA, 3: 3350–3354.
Koivukangas J (1984) Ultrasound imaging in operative neurosurgery: An experimental and clinical study with special reference to ultrasound holographic B (UHB) imaging. PhD dissertation. Univ Oulu, Dept Neurosurgery, Oulu, Finland.

102
Koivukangas J, Louhisalmi Y, Alakuijala J & Oikarinen J (1993) Ultrasound-controlled neuronavigator-guided brain surgery. J Neurosurg 79: 36–42.
Koivukangas J, Katisko J, Yrjänä S, Tuominen J, Schiffbauer H & Ilkko E (2003) Successful neurosurgical 0.23T intraoperative MRI in a shared facility. Neurosurg 2003, Monduzzi Editore Medimond: 439–444.
Koivukangas T, Katisko J, Louhisalmi Y, Nevala K, & Koivukangas J (2009) Development of an accuracy assessment phantom for surgical navigators. Proceedings of the 31st Annual International Conference of the IEEE Engineering in Medicine and Biology Society, Minneapolis, MN, USA: 1517–1520.
Koivukangas T & Katisko J (2010) Accuracy assessment phantom for surgical devices. Proceedings of the 5th Cairo International Conference on Biomedical Engineering, Cairo, Egypt: 57–60.
Koivukangas T, Makkonen T, Louhisalmi Y & Nevala K (2012) Accuracy assessment of a prototype surgical interactive robot developed for the MRI environment. Int J CARS 7(Suppl 1): S215–S216.
Kroneif G, Ptacek W, Kornfeld M & Fürst M (2011) Evaluation of robotic assistance in neurosurgical applications. J Rob Surg 1(6): 33–39.
Kubben PL, ter Meulen KJ, Schijns OE, ter Laak-Poort, van Overbeeke JJ & van Santbrink H (2011) Intraoperative MRI-guided resection of glioblastoma multiforme: a systematic review. The Lancet Oncology 12(11): 1062–1070.
Kücker J, Xu S, Viswanathan A, Shen E, Glossop N & Wood B (2006) Clinical evaluation of electromagnetic tracking for biopsy and radiofrequency ablation guidance. Int J CARS 1: 169–187.
Kwartowitz D, Herrell S, Galloway R (2006) Toward image-guided robotic surgery: Determining intrinsic accuracy of the daVinci robot. Int J CARS 1: 157–165.
Larson BT, Erdman AG, Tsekos NV, Yacoub E, Tsekos PV & Koutlas IG (2004) Design of an MRI-compatible robotic stereotactic device for minimally invasive interventions in the breast,” J Biomech Eng 126: 458–465.
Madhavan G, Thanikachalam S, Krukenkamp I & Saltman A (2002) Robotic surgeons. IEEE Potentials 21(3): 4–7.
Madritsch, F (1996) CCD-camera based optical tracking for human computer interaction. IJVR 2007: 161–170.
MaRS 2010. Market Insight. Life Sciences – Minimally-Invasive Medical Technologies, September 2010, MaRS Discovery District, Toronto ON, CA. URI: http://www.profoundmedical.com/images/MinimallyInvasive.pdf/. Cited 2012/6/1.
Masamune K, Kobayashi E, Masutani Y, Suzuki M, Dohi T, Iseki H & Takakura K (1995) Development of an MRI-compatible needle insertion manipulator for stereotactic neurosurgery. J Image Guid Surg 1: 242–248.
Mascott C (2005) Comparison of magnetic tracking and optical tracking by simultaneous use of two independent frameless stereotactic systems. J Neurosurg 57(4): 295–301.
Masood S, Gao J & Yang G-Z (2002) Virtual tagging: Numerical considerations and phantom validation. IEEE Trans Med Imaging 21(9): 1123–1131.
103
MAUDE 2012. The Manufacturer and User Facility Experience Database. URI: http://www.accessdata.fda.gov/scripts/cdrh/cfdocs/cfMAUDE/search.cfm/.
Cited 2012/5/18. McGirt MJ, Chaichana KL, Gathinji M, Attenello FJ, Than K, Olivi A, Weingart JD, Brem
H & Quiñones-Hinojosa AR (2009) Independent association of extent resection with survival in patients with malignant brain astrocytoma. J Neurosurg 110(1): 156–162.
Miga IM, Paulsen KD, Kennedy FE, Hoopes PJ, Hartov A & Roberts DW (1997) A 3d brain deformation model experiencing comparable surgical loads. Proceedings of the 19th Annual International Conference of the IEEE Engineering in Medicine and Biology Society, Chicago, IL, USA: 773–776.
Mooring BW & Pack TJ (1986) Determination and specification of robot repeatability. Proceedings of 1986 IEEE International Conference on Robotics and Automation, San Francisco, CA, USA: 1017–1023.
Moretti B, Fadili L, Ruan S, Bloyet N & Mazouyer B (2000) Phantom-based performance evaluation: Application to brain segmentation from magnetic resonance images. Med Image Anal 4: 303–316.
Mösges R, Schlöndorff G (1998) A new imaging method for intraoperative therapy control in skull base surgery. Neurosurg Rev 11: 245–247.
Nakajima S, Kikinis R, Black PM, Atsumi H, Leventon ME, Hata N, Moriarty TM, Alexander III E & Jolesz FA (1997) Image-guided neurosurgery at Brigham and Women's Hospital. Computer-Assisted Neurosurgery: 144–162.
NASA (2012) The official homepage of the National Aeronautics and Space and Administration. URI: http://science.hq.nasa.gov/kids/imagers/ems/ xrays.html/.
Cited 2012/3/7. Ng WS, Davies BL, Hibberd RD & Timoney AG (1993) Robotic surgery – a first hand
experience in transurethral resection of the prostate. Eng Med Biol 12(1): 120–125. NDI Digital (2012). URI: http://www.ndigital.com/medical/technology-optical.php/. Cited 2012/4/11. Nimsky C (2011) Intraoperative MRI in glioma surgery: proof of benefit? The Lancet
Oncology 12(11): 982–983. Nolte LP, Zamorano LJ, Jiang Z, Wang Q, Langlotz F, Arm E & Visarius H (1994) A
novel approach to computer assisted spine surgery. Proceedings of the 1st Int Symp MRCAS: 323–328.
Polaris Spectra & Polaris Vicra Technical Specifications, Northern Digital Inc. Waterloo, ON, Canada, 2011, URI: http://www.ndigital.com/medical/polarisfamily-techspecs.php/. Cited 2012/4/11.
Ringel F, Stüer C, Reinke A, Preuss A, Behr M, Auer F, Stoffel M & Meyer B (2012) Accuracy of robot-assisted placement of lumbar and sacral pedicle screws: a prospective randomized comparison to conventional freehand screw implantation. Spine 37(8): E496–501.
Ringel F, Ingerl D, OTT S & Meyer B (2009) VarioGuide: a new frameless image.guided stereotactic system - accuracy study and clinical assessment. Neurosurg 64(5 Suppl 2): 365–371.

104
Riviere CN & Khosla PK (1997) Augmenting the human-machine interface: improving manual accuracy. Proceedings of IEEE Robotics & Automation, Albuquerque, NM, USA. (5): 3546–3550.
Riviere CN, Rader RS & Khosla PK (1997) Characteristics of hand motion of eye surgeons. Proceedings of the 19th Annual International Conference of the IEEE Engineering in Medicine and Biology Society, Chicago, IL, USA: 1690–1693.
Ruohonen J & Karhu J (2010) Navigated transcranial magnetic stimulation. Review. Clin Neurophys 40: 7–17.
Russell T & Joskowicz L (2009) Computer-integrated surgery and medical robotics. In: Kurtz M (ed) Standard Hand-book of Biomedical Engineering and Design. McGraw-Hill 14: 391–437.
Roberts DW, Strohbehn JW, Hatch JF, Murray W & Kettenberger H (1986) A frameless integration of computerized tomographic imaging and the operating microscope. J Neurosurg 65(4): 545–549.
Sanai N & Berger MS (2008) Glioma extent of resection and its impact on patient outcome. Neurosurg 62(4): 753–764.
Schenck J (1996) The role of magnetic susceptibility in magnetic resonance imaging: MRI magnetic compatibility of the first and second kinds. Med Phys 13(6): 815–850.
Schicho K, Figl M, Donat M, Birkfellner W, Seemann R, Wagner A, Bergmann H & Ewers R (2005) Stability of miniature electromagnetic tracking systems. Phys Med Biol 50: 2089–2098.
Schiffbauer H (1997) Neuronavigation in brain tumor surgery; clinical beta phase of the Neuronavigator System. PhD dissertation. Univ Oulu Depart Neurosurgery, Oulu, Finland.
Schneberger M (2004) Infrared optical tracking systems mathematical and operational principles. Lecture: Intra-operative Imaging & Visualization URI: http://campar.in.tum.de/twiki/pub/Chair/TeachingWs04IOIV/09StereoCameraTrackig.pdf/. Cited 2012/4/11.
Schneider M & Stevens C (2011). Development and testing of a new magnetic-tracking device for image guidance. URI: http://www.ascension-tech.com/. Cited 2011/11/22.
Shiakolas P, Conrad K & Yih T (2002) On the accuracy, repeatability, and degree of influence of kinematics parameters for industrial robots. Int J Model Simul 22(3): 1–10.
Simon D (1997) Intra-operative position sensing and tracking devices. Proceedings of the First Joint Conference on Computer Vision, Virtual Reality and Robotics in Medicine and Medical Robotics and Computer Assisted Surgery, CVRMed/MRCAS, Grenoble, France: 62–64.
Song Y, Gang A & Zhang J (2009) Positioning accuracy of a medical robotic system for spine surgery. Proceedings of the 2nd International Conference of the Biomedical Engineering and Informatics, Tianjin, China: 1–5.
105
Stiehl J, Bach J & Heck D (2007) Validation and metrology in CAOS. In: Stiehl J, Konermann W, Haaker R & DiGioia A (eds) Navigation and MIS in Orthopedic Surgery. Springer Medizin Verlag, Heidelberg, Germany. ISBN 978–3-540-36690-4: 68-78.
Sutherland GR, Latour I & Greer AD (2008) Integrating an image-guided robot with intraoperative MRI. IEEE Eng Med Biol Mag 27(3):59–65.
Susil RC, Krieger A, Derbyshire JA, Tanacs, Whitcomb LL, Fichtinger G, Atalar E (2003) System for MR image-guided prostate interventions: Canine study. Radiology 228: 886–894.
Taylor RH & Kazanzides P (2007) Medical robotics and computer-integrated interventional medicine. In: Feng DD (ed) Biomedical Information Technology. Academic Press, Burlington, MA, USA: 393–415.
Tronnier VM, Wirtz CR, Knauth M, Lenz G, Pastry O, Bonsanto MM, Albert FK, Kuth R, Staubert A, Schlegel W, Sartor K & Kunze S (1997) Intraoperative diagnostic and interventional magnetic resonance imaging in neurosurgery. Neurosurg 40(5): 891–901.
Tsekos NV, Ozcan A & Christoforou E (2005) A prototype manipulator for MR-guided interventions inside standard cylindrical MRI scanners. J Biomech Eng 127: 972-980.
Tsekos N, Christoforou E & Özcan A (2008) A general-purpose MR-compatible robotic system - Implementation and image guidance for performing minimally invasive interventions. IEEE Eng Med Biol Mag 3: 51–58.
Vahala E, Ylihautala M, Tuominen J, Schiffbauer H, Katisko J, Yrjänä S, Vaara T, Enholm G & Koivukangas J (2001) Registration in interventional procedures with optical navigator. JMRI 13: 93–98.
Virtanen J (2006) Enhancing the compatibility of surgical robots with magnetic resonance imaging. PhD thesis. Univ Oulu, Dept Mechanical Engineering.
Watanabe E, Watanabe T, Manaka S, Mayanagi Y & Takakura K (1987) Three-dimensional digitizer (neuronavigators): New equipment for computed tomography-guided stereotactic surgery. Surg Neurosug 27(6): 543–547.
Wells PNT (1977) Ultrasonics in medicine and biology. Review Article. Phys Med Biol 22(4): 629.
Weng J, Cohen P & Herniou M (1992) Camera calibration with distortion models and accuracy evaluation. IEEE Trans Pattern Anal and Mach Intell 14(10): 965–990.
West JB & Maurer CR Jr. (2004) Designing optically tracked instruments for image-guided surgery. IEEE Trans Med Imaging 23(5): 533–545.
Widmann G, Schullian P, Ortler, M & Bale R (2012) Frameless stereotactic targeting devices: technical features, targeting errors and clinical results. IJCARS 8: 1–16.
Wiles A & Peters T (2009) Real-time estimation of FLE statistics for 3-D tracking with point-based registration. IEEE Trans Med Imaging 28(9): 1384–1398.
Wiles A, Thompson D, & Frantz D (2004) Accuracy assessment and interpretation for optical tracking systems. Medical Imaging 2004: Visualization, Image-Guided Procedures, and Display. In: (ed) Galloway R. Proc SPIE 5367: 421–432.

106
Wittmann W, Wenger T, Loewe E & Lueth TC (2011). Official measurement protocol and accuracy results for an optical surgical navigation system (NPU). Proceedings of the 33rd Annual International Conference of the IEEE Engineering in Medicine and Biology Society, Boston, MA, USA: 1237–1240.
Wood BJ, Zhang H, Durrani A, Glossip N, Sohan R, Lindisch D, Elliott L, Banovac F, Borgert J, Krueger S, Kruecker J, Anald V & Cleary K (2005). Navigation with electromagnetic tracking for interventional radiology procedures: A feasibility study. Laboratory Investigations. J Vasc Interv Radiol 16: 493–505.
Yamura M, Hirai T, Korogi Y, Ikushima I, & Yamashita Y (2005) Quantitative evaluation of measurement accuracy for three-dimensional angiography system using various phantoms. Radiat Med 23(3): 175–181.
Yang L, Wen R, Qin J, Chui C-K, Lim K-B & Chang S (2010) A robotic system for overlapping radiofrequency ablation in large tumor treatment. IEEE/ASME Trans Mechatr 15(6): 887–897.
Zannoni C, Viceconti M, Pierotti L & Capello A (1997) Evaluation of CT accuracy in orthopaedic implants geometry reconstruction. Proceedings of the 19th Annual International Conference of the IEEE Engineering in Medicine and Biology Society, Chicago, IL, USA: 1862–1864.
Zoppi M, Khan M, Schäfer F & Molfino R (2010). Toward lean minimally invasive robotic surgery. Robotica 28: 185–197.
A C T A U N I V E R S I T A T I S O U L U E N S I S
Book orders:Granum: Virtual book storehttp://granum.uta.fi/granum/
S E R I E S C T E C H N I C A
411. Arvola, Jouko (2011) Reducing industrial use of fossil raw materials : Techno-economic assessment of relevant cases in Northern Finland
412. Okkonen, Jarkko (2011) Groundwater and its response to climate variability andchange in cold snow dominated regions in Finland: methods and estimations
413. Anttonen, Antti (2011) Estimation of energy detection thresholds and errorprobability for amplitude-modulated short-range communication radios
414. Neitola, Marko (2012) Characterizing and minimizing spurious responses inDelta-Sigma modulators
415. Huttunen, Paavo (2012) Spontaneous movements of hands in gradients of weakVHF electromagnetic fields
416. Isoherranen, Ville (2012) Strategy analysis frameworks for strategy orientationand focus
417. Ruuska, Jari (2012) Special measurements and control models for a basic oxygenfurnace (BOF)
418. Kropsu-Vehkaperä, Hanna (2012) Enhancing understanding of company-wideproduct data management in ICT companies
419. Hietakangas, Simo (2012) Design methods and considerations of supplymodulated switched RF power amplifiers
420. Davidyuk, Oleg (2012) Automated and interactive composition of ubiquitousapplications
421. Suutala, Jaakko (2012) Learning discriminative models from structured multi-sensor data for human context recognition
422. Lorenzo Veiga, Beatriz (2012) New network paradigms for future multihopcellular systems
423. Ketonen, Johanna (2012) Equalization and channel estimation algorithms andimplementations for cellular MIMO-OFDM downlink
424. Macagnano, Davide (2012) Multitarget localization and tracking : Active andpassive solutions
425. Körkkö, Mika (2012) On the analysis of ink content in recycled pulps
426. Kukka, Hannu (2012) Case studies in human information behaviour in smarturban spaces
C427etukansi.kesken.fm Page 2 Thursday, August 16, 2012 11:41 AM

ABCDEFG
UNIVERS ITY OF OULU P.O.B . 7500 F I -90014 UNIVERS ITY OF OULU F INLAND
A C T A U N I V E R S I T A T I S O U L U E N S I S
S E R I E S E D I T O R S
SCIENTIAE RERUM NATURALIUM
HUMANIORA
TECHNICA
MEDICA
SCIENTIAE RERUM SOCIALIUM
SCRIPTA ACADEMICA
OECONOMICA
EDITOR IN CHIEF
PUBLICATIONS EDITOR
Senior Assistant Jorma Arhippainen
Lecturer Santeri Palviainen
Professor Hannu Heusala
Professor Olli Vuolteenaho
Senior Researcher Eila Estola
Director Sinikka Eskelinen
Professor Jari Juga
Professor Olli Vuolteenaho
Publications Editor Kirsti Nurkkala
ISBN 978-951-42-9903-2 (Paperback)ISBN 978-951-42-9904-9 (PDF)ISSN 0355-3213 (Print)ISSN 1796-2226 (Online)
U N I V E R S I TAT I S O U L U E N S I SACTAC
TECHNICA
U N I V E R S I TAT I S O U L U E N S I SACTAC
TECHNICA
OULU 2012
C 427
Tapani Koivukangas
METHODS FOR DETERMINATION OFTHE ACCURACY OF SURGICAL GUIDANCE DEVICESA STUDY IN THE REGION OF NEUROSURGICAL INTEREST
UNIVERSITY OF OULU GRADUATE SCHOOL;UNIVERSITY OF OULU,FACULTY OF TECHNOLOGY, DEPARTMENT OF MECHANICAL ENGINEERING;FACULTY OF MEDICINE, INSTITUTE OF CLINICAL MEDICINE, DEPARTMENT OF NEUROSURGERY
C 427
ACTA
Tapani Koivukangas
C427etukansi.kesken.fm Page 1 Thursday, August 16, 2012 11:41 AM