Etude fondamentale de la transformation du polyamide 12 par ...
Biological and Pharmaceutical Bulletin Advance Publication by J-STAGE DOI:10.1248/bpb.b19-00644
Ⓒ 2019 The Pharmaceutical Society of Japan
Advance Publication October 24, 2019
Biol. Pharm. Bull.
(Regular Articles)
Method of determining pyrrole-imidazole polyamide in rat plasma using
ultra-fast liquid chromatography–ultraviolet spectrometry
Aoi Miyamoto,*,a Kouta Yagishita,a Takahiko Aoyama,a Masanori Abe,b Noboru Fukuda,b,c
Yoshiaki Matsumoto a
aLaboratory of Clinical Pharmacokinetics, School of Pharmacy, Nihon University, 7-7-1
Narashinodai, Funabashi, Chiba 274-8555, Japan: bDivision of Nephrology, Hypertension and Endocrinology, Department of Internal
Medicine, Nihon University School of Medicine, Tokyo 173-8610, Japan: and cResearch Center Nihon University, Tokyo 102-8275, Japan.
* Correspondence e-mail:
[email protected] (A. Miyamoto)
Biological and Pharmaceutical Bulletin Advance Publication
Summary
To improve the efficiency of drug-discovery research on pyrrole-imidazole
polyamides (PIs), a more rapid method for quantitative and qualitative measurement of PI
in rat plasma samples was developed here using ultra-fast liquid chromatography–
ultraviolet spectrometry (UFLC–UV) in order to shorten the measurement time. A
measurement method of PIs by HPLC developed until now takes 45 min for one sample
measurement. This method was inefficient to investigate extraction conditions from
biological samples and measurement of animal experimental samples. In the developed
method of this study, PI and phenacetin (internal standard, IS) were separated with an
ACQUITY UPLC HSS T3 (1.8 mm, 2.1 × 50 mm; Nihon Waters K.K., Japan) column
using a mobile phase of 0.1% acetic acid (mobile phase A) and acetonitrile (mobile phase
B) at a flow rate of 0.3 mL/min with a linear gradient. The detection wavelength was
310 nm. The calibration curve was linear in the range of 0.225–4.5 μg/mL (correlation
coefficients ≥ 0.9995, n = 5). The intra- and inter-day accuracies were in the range of
−6.04% to 12.2%, and the precision was less than 2.99%. The measurement time of this
Biological and Pharmaceutical Bulletin Advance Publication
method (7 min per injection) was markedly shortened to about one-sixth of the previous
measurement time (45 min per injection). This is the first report describing the quantitative
and qualitative measurement of PI in plasma using UFLC–UV. The present method will be
very useful for the drug-discovery research of PIs.
Keywords
pyrrole-imidazole polyamide; ultra-fast liquid chromatography; drug-discovery research

Biological and Pharmaceutical Bulletin Advance Publication
1. Introduction
Pyrrole-imidazole polyamides (PIs) are DNA recognized peptide that were initially
identified from antibiotics such as duocarmycin A and distamycin A. They recognize and
bind DNA with specific sequences and are composed of the aromatic rings of
N-methylpyrrole and N-methylimidazole amino acids.1–3) A chemically synthesized PI was
found to have a strong affinity to a minor groove of sequence-specific double-helical
DNA.1) In accordance with that property, various types of DNA-binding PIs have been
developed to regulate gene expression by targeting the promoter regions of enhancer and
transcription factor binding elements in vitro.1–4) Dickinson et al.5) reported that the genes
of HIV were silenced by PIs that bind specifically to their regulatory sequences. It was
reported that the expression of TGF-β1 mRNA and protein in the renal cortex of Dahl-S
rats was significantly inhibited by a PI.6) Urinary protein and albumin in Dahl-S rats were
also reduced by the PI and the reduction was independent of changes in blood pressure.6)
Igarashi et al. 7) also reported a preclinical study of a PI (GB 1101) that targets the human
TGF-β1 gene as a transcriptional gene silencer for hypertrophic scars in a common

Biological and Pharmaceutical Bulletin Advance Publication
marmoset primate model. These findings indicate that PI targeting TGF-β1 should be a
novel gene-silencing agent for TGF-β1-associated diseases, including progressive renal
diseases and hypertrophic scarring after surgical operations and skin burns.7, 6) As described
above, it is anticipated that PIs can be used as novel drugs for gene therapy and PIs are
expected to be put into practical use.
We previously reported the methods of detecting other PIs using high-performance
liquid chromatography–ultraviolet spectrophotometry (HPLC–UV) and high-performance
liquid chromatography–tandem mass spectrometry (LC–MS/MS).8–11) Generally,
HPLC-UV requires larger amounts of sample and longer analysis time compare to
LC-MS/MS. The shorter analysis time for a sample by LC-MS/MS (5.5 min)10) is a greater
advantage than that of the HPLC-UV (15 and 45 min)8, 9, 11), however, the installation of
LC-MS/MS could be cost-prohibitive for many research facilities including authors’. Thus,
to promote fundamental research efficiently with lower cost, it is necessary to improve on
the currently available methods. In order to improve the current analysis capacity by
HPLC-UV with a limited budget, we investigated efficient and precise conditions for
Biological and Pharmaceutical Bulletin Advance Publication
measuring PI using an ultra-fast liquid chromatography (UFLC)–UV method. In this study,
UFLC-UV method was focused to develop a cost effective and reasonably rapid method in
a practical range to look for a happy medium.
This is the first research on the analysis method for PIs applying UFLC-UV, so for
as we know. We attempted to improve the method of measuring PI (GB 1101) by focusing
on TGF-β1 here. Among various PIs, GB1101 was regarded as the most promising
drug.
6, 7)
2. Materials and methods
2.1. Reagents and solutions
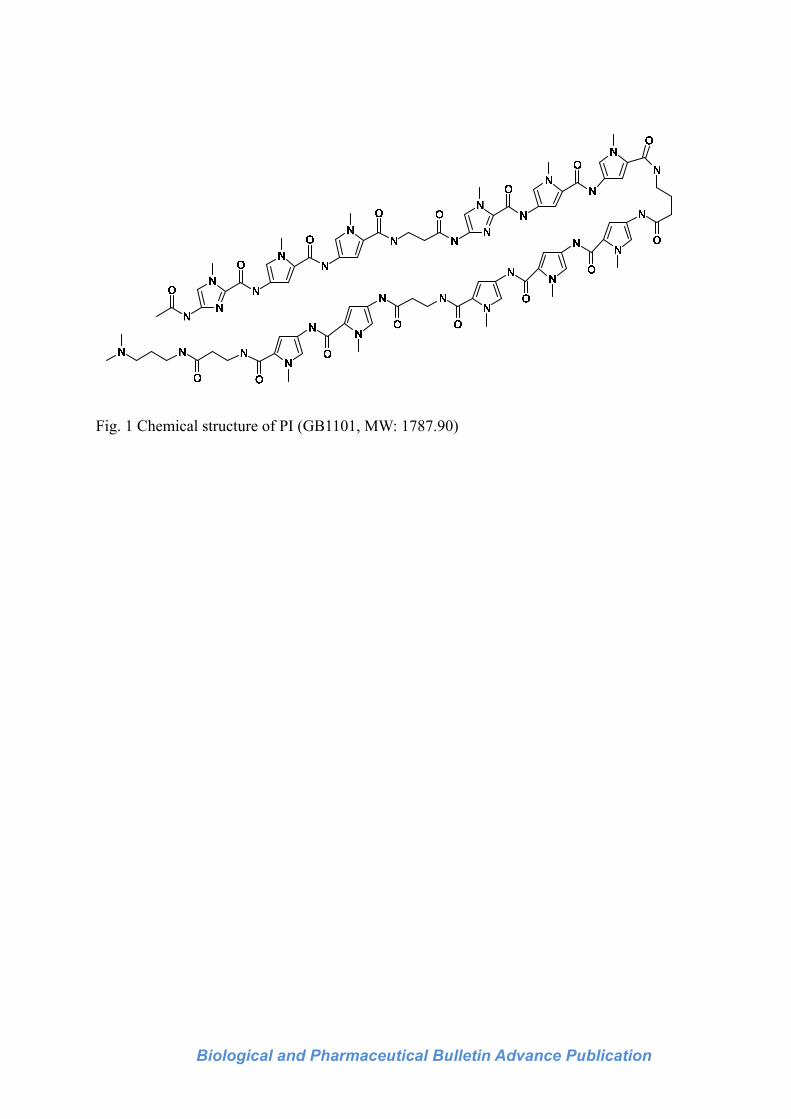
PI was synthesized by Nihon University School of Medicine following the method
of Bando et al.12) The chemical structure of PI was shown in Figure 1. Acetic acid was
purchased from Wako Pure Chemical Industries, Ltd. (Tokyo, Japan). Phenacetin was
purchased from Sigma–Aldrich Co. LLC (Tokyo, Japan) and used as an internal standard
(IS). Acetonitrile and methanol were all of HPLC-grade, and were obtained from Kanto
Biological and Pharmaceutical Bulletin Advance Publication
Chemical Co., Inc. (Tokyo, Japan). Water was obtained from a water purification system
(Direct-Q; Nihon Millipore Ltd., Tokyo, Japan). Sprague–Dawley rat plasma was
purchased from Charles River Laboratories Japan, Inc. (Kanagawa, Japan).
2.2. Chromatography conditions and instruments
The UFLC–UV system consisted of a Prominence UFLC (20A Series) (Shimadzu
Co., Kyoto, Japan). PI and IS were analyzed on an ACQUITY UPLC HSS T3 (1.8 mm, 2.1
× 50 mm; Nihon Waters K.K., Tokyo, Japan). The column and autosampler were
maintained at 40 and 4°C, respectively. Mobile phases A (0.1% acetic acid) and B
(acetonitrile) were used for examining the separation between PI and IS, at a flow rate of
0.3 mL/min. The injection volume was 10 μL and the detection wavelength was set to
310 nm. These conditions were used in reference to previously published papers. 8-11)
2.3.1. Preparation of standard samples
A primary stock solution of PI (1 mg/mL) was prepared by dissolving the

Biological and Pharmaceutical Bulletin Advance Publication
compounds in 0.1% acetic acid. The solutions were stored at 4°C. Secondary stock
solutions were prepared by diluting the primary stock solution with 0.1% acetic acid just
before use. The solutions for calibration standard samples were prepared at concentrations
of 5, 10, 15, 20, and 25 μg/mL, and those for rat plasma calibration curve samples were
made at concentrations of 2.25, 3, 7.5, 15, 22.5, 30, 37.5, and 45 μg/mL. An IS was
dissolved in methanol (0.5 mM).
2.3.2. Preparation of samples for investigating separation conditions of UFLC
Samples for examining the separation conditions were as follows: The same
volumes of secondary standard solution of 5 μg/mL PI and 1 mM IS were mixed (PI
sample). Moreover, 1 mM IS was mixed with the same volume of 0.1% acetic acid (IS
sample). A blank sample was prepared by mixing the same amounts of 0.1% acetic acid and
methanol.

Biological and Pharmaceutical Bulletin Advance Publication
2.3.3. Preparation of rat plasma samples for calibration curve
Calibration standard plasma samples were prepared by mixing 5 μL of
secondary stock solutions and 45 μL of blank plasma (final concentrations of PI: 0.225, 0.3,
0.75, 1.5, 2.25, 3, 3.75, and 4.5 μg/mL), to create a rat plasma calibration curve.
2.3.4. Pretreatment of rat plasma samples
The rat plasma samples for calibration curves and the plasma from
PI-administered rats were pretreated with methanol. The plasma samples of 50 μL were
mixed with 100 μL of methanol containing 0.5 mM IS and vortexed. After centrifugation at
10,000 ×g for 5 min at 4°C, the supernatant was obtained. The centrifugation was repeated
twice and the supernatant (10 μL) was injected into the UFLC system.
2.4. Animals and drug administration
Two male 12-week-old Sprague–Dawley rats weighed 344 and 345 g were
purchased from Japan SLC, Inc. (Tokyo, Japan). A cannula was inserted into the right

Biological and Pharmaceutical Bulletin Advance Publication
femoral artery and right jugular vein of each rat by the vendor. The experiment was
performed at least 1 day after purchase. The rats were housed in a temperature-controlled
room under a 12-h light–dark cycle and were allowed free access to food and water. PI in
0.1% acetic acid (6.0 mg/kg) was administered in a single intravenous dose. The sampling
times were 0, 0.16, 0.33, 0.5, 1, 1.5, 2, 3, 4, 6, and 8 h after administration. Each sample
was immediately transferred to a heparinized microcentrifuge tube. These samples were
separated by centrifugation at 4°C and 10,000 × g for 10 min and stored at −80°C until use.
After sampling, the collected blood was replaced with an equal volume of saline. The
plasma concentration–time profiles of PI were analyzed by a non-compartmental method.
The area under the plasma concentration–time curve (AUC) and the area under the first
moment curve (AUMC) were obtained using the linear trapezoidal rule and extrapolated to
infinity. The terminal elimination rate constant (ke) was calculated by regression of the
terminal log-linear portion of the plasma concentration curve. The terminal elimination
half-life (t1/2) was calculated to be 0.693/ke. The clearance (CL), mean residence time
(MRT), and the volume of distribution in the steady state (Vss) were calculated as
Biological and Pharmaceutical Bulletin Advance Publication
dose/AUC, AUMC/AUC, and CL*MRT, respectively. The plasma concentrations of PI
were extrapolated to time zero (C0). Nihon University Animal Care and Use Committee
(Tokyo, Japan) approved the animal experiment.
2.5. Method validation
Evaluation of the method was performed as follows applying the procedures
previously reported.13) The method was validated for selectivity, recovery, linearity,
accuracy, and precision. The validation was conducted in accordance with the guidelines of
the National Institute of Health Sciences (NIHS).14) The selectivity was evaluated by
examining the separation of PI and IS from the plasma matrix components of blank rat
plasma. The recovery was determined for the intra-day (n=3) and inter-day (n=3) precision
at a concentration of 3 μg/mL PI. The recovery was determined by comparing the absolute
peak areas of the extracted samples with those of the pre-spiked standards. The calibration
curves were constructed by plotting the PI peak area divided by the IS peak area. The
linearity of the calibration curves was evaluated by linear regression analysis. The lower
Biological and Pharmaceutical Bulletin Advance Publication
limit of quantitation (LLOQ) of PI was experimentally defined as the lowest concentration
of the calibration curve that could be measured with acceptable accuracy and precision.
The intra- and inter-day accuracy and precision of this method were investigated
using working solutions of PI. Accuracy was expressed as a percentage of the measured
concentration relative to the theoretical concentration.
Accuracy (%) = [(measured concentration − theoretical concentration) / theoretical
concentration] × 100.
The criterion for acceptable accuracy was defined as a mean concentration within ±15% of
the nominal concentration, except for the case of LLOQ (0.225 μg/mL), for which it should
not exceed ±20%.14) Precision was expressed as the relative standard deviation (RSD). The
acceptance criterion for precision was defined as the RSD at each concentration not
exceeding 15%, except for the case of LLOQ, for which it should not exceed 20%.14)
Biological and Pharmaceutical Bulletin Advance Publication
3. Results and discussion
3.1. Investigation of gradient elution
At the first onset, a mobile phase for UFLC analysis were investigated using
isocratic elution and LC-MS/MS gradient elution reported by Nagashima et al.10)
Various isocratic elutions were investigated, however, an appropriate condition to
avoid peak splitting, tailing, broadening, and peak overlapping with the blank peak could
not be find. Applying the LC-MS/MS gradient elution for UFLC without any modification
resulted PI peak overlapping with the IS peak. It was assumed that the PI and IS
overlapping was happed during non-polar environment, acetonitrile: 0.1% acetic acid = 95:
5. Considering the results, various gradient patters were studied based on the LC-MS/MS
gradient pattern paying attention on non-polar condition.
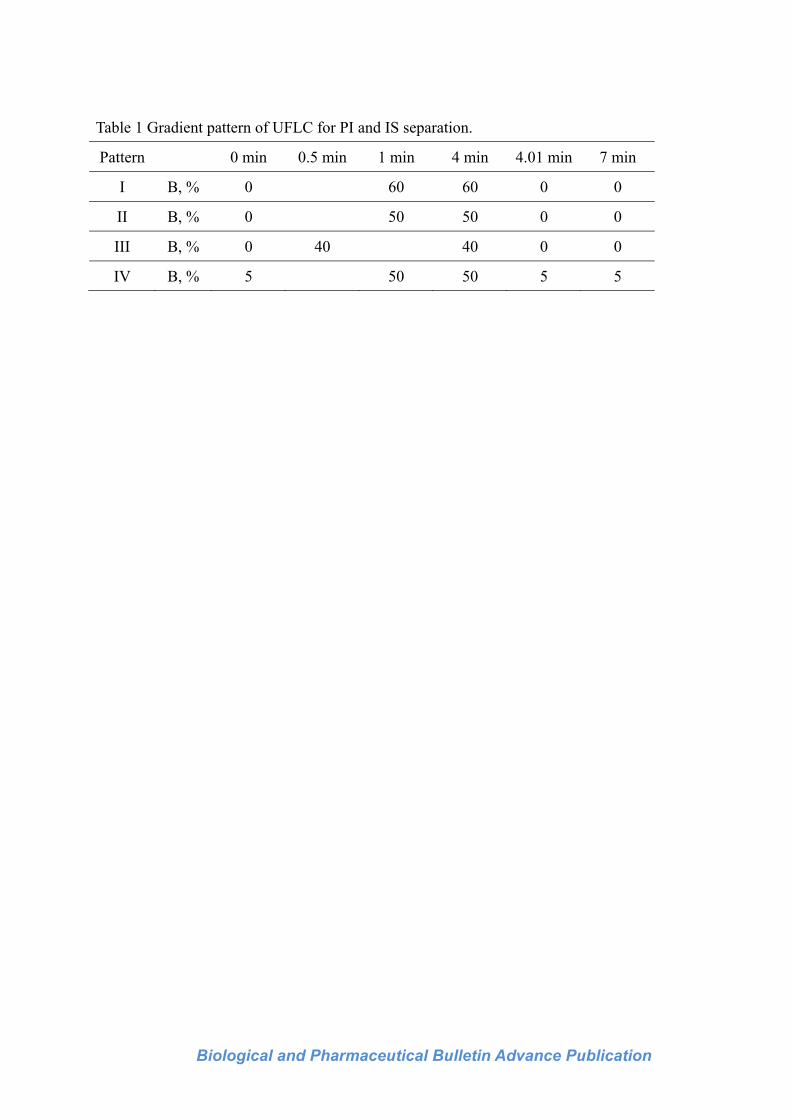
Table 1 summarizes the investigated conditions of the representative gradient
mobile phase of eluent B. The initial gradient time influenced the retention time of PI and
IS. When this time was prolonged, the retention times of both compounds increased (data
not shown). The next isocratic eluent ratio and time affected the separation of PI and IS. It
Biological and Pharmaceutical Bulletin Advance Publication
was possible to separate the peaks of PI, IS, and contaminants in all gradient patterns. To
select the optimal conditions from the conditions in Table 1, a calibration curve was
prepared under each condition, and the correlation coefficient and the accuracy and
precision were calculated.
Tables 2 and 3 show the obtained results. The results of accuracy, precision, and
correlation coefficient at gradient pattern III were not as good as those of gradient patterns I,
II, and IV. The degrees of separation differed slightly among gradient patterns I, II, and IV.
Gradient pattern IV, in which the change rate of the eluent was low, was adopted as the
optimal condition in order to shorten the time of return of the eluent to its initial state after
measurement. The total measurement time of this gradient was 7 min per injection
(including the time of return to the initial conditions for the next measurement).
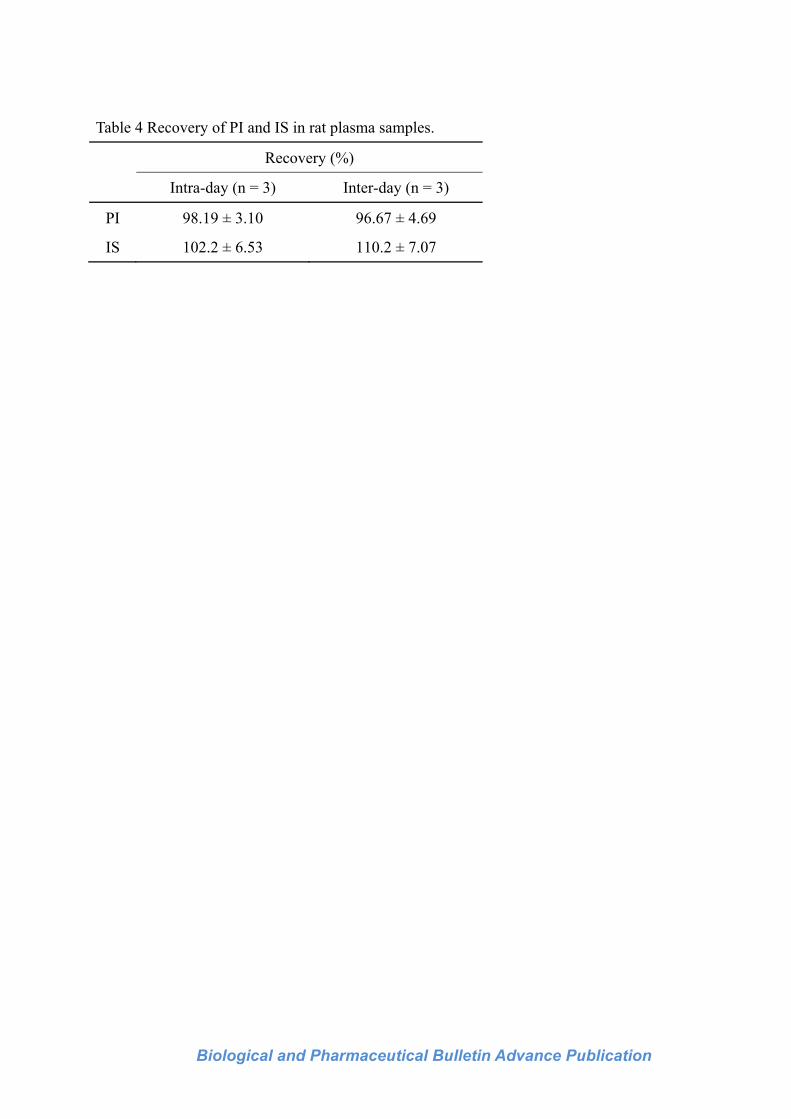
3.2. Results of rat plasma sample validation
For validation, recovery, linearity of the calibration curves, accuracy, and precision
were investigated. Table 4 shows the recovery of 3 μg/mL PI and 0.5 mM IS from rat

Biological and Pharmaceutical Bulletin Advance Publication
plasma. Both compounds were recovered at high yield. The linearity of the calibration
curves of PI was measured in the range of 0.225 to 4.5 μg/mL in the rat plasma (n = 5).
Chromatograms of blank rat plasma and blank rat plasma spiked with PI (4.5 μg/mL) under
the optimal condition presented in Table 1 pattern IV are shown in Figure 2. The
relationships between the PI peak area divided by the IS peak area and the corresponding
concentrations were found to be linear. The correlation coefficients were ≥0.9995. Table 5
shows the results of accuracy and precision. The intra- and inter-day accuracy for all
concentrations was within the range of −6.04 to 12.2%. In addition, the intra- and inter-day
precision was less than 2.99%. These values complied with NIHS guidelines.
3.3. Application to animal experiments
Chromatograms of rat plasma collected at zero and 0.16 h after administration of
PI are shown in Figure 3. Figure 4 shows the plasma concentration versus time plots for PI.
The validated UFLC–UV method was successfully applied to determine PI in a PK study.
Table 6 lists the PK parameters of PI in rats.

Biological and Pharmaceutical Bulletin Advance Publication
4. Conclusions
In this research, we aimed to establish a method for measuring PI using UFLC–UV.
In the measurement method studied here, it was possible to shorten the measurement time
from 4511) to 7 min. To analyze all samples (n=123) in Table 4 and 5, it takes 92.25 h
(3.84 days) by HPLC, compared with 14.35 h by the UFLC method reported in this paper
(not including time for sample preparation and pretreatment). Via this improvement, we can
expect to boost the efficiency of research and reduce costs. In the range of 0.225 to
4.5 μg/mL, applicable results were obtained in terms of linearity, accuracy, and accuracy of
the calibration curve in daily fluctuations. When rat plasma was used as a biological sample,
it was revealed that the methods developed in this research can quantify PI with good
accuracy and reproducibility. In addition, the detection sensitivity was improved about
fourfold. The minimum quantification limit by UFLC–UV in rat plasma was reduced to
0.225 μg/mL. Though the type of PI was different, the lower limit of quantifications were 1
or 0.25 μg/mL (HPLC-UV) 8, 9) and 10 ng/mL (LC-MS/MS). 10) The assay sensitivity was
slightly improved compared to HPLC-UV. The measurement method newly developed in

Biological and Pharmaceutical Bulletin Advance Publication
this investigation is useful for measuring blood concentrations of various PIs in
pharmaceutical research.
5. Acknowledgments
This work was supported by JSPS Grant-in-Aid for Scientific Research (C) Grant
Number 17K09716. The authors thank Fumiya Murakami, BSc, Tamako Kaminoyama,
BSc, Hidetada Koyama, BSc, Asako Muranami, BSc, Ayumi Nagamine, BSc, and Yuka
Satou, BSc, for their assistance.
6. Conflict of Interest
The authors declare no conflict of interest.
Biological and Pharmaceutical Bulletin Advance Publication
References
1. P.B. Dervan, Molecular recognition of DNA by small molecules, Bioorg. Med. Chem. 9
(2001) 2215–2235.
https://doi.org/10.1016/S0968-0896(01)00262-0.
2. J.W. Trauger, E.E. Baird, P.B. Dervan, Recognition of DNA by designed ligands at
subnanomolar concentrations, Nature 382 (1996) 559–561.
https://doi.org/10.1038/382559a0.
3. S. White, E.E. Baird, P.B. Dervan, On the pairing rules for recognition in the minor
groove of DNA by pyrrole–imidazole polyamides, Chem. Biol. 4(1997) 569–578.
https://doi.org/10.1016/S1074-5521(97)90243-X.
4. M.S. Murty, H. Sugiyama, Biology of N-methylpyrrole-Nmethylimidazole hairpin
polyamide, Biol. Pharm. Bull. 27 (4) (2004) 468–474.
https://doi.org/10.1248/bpb.27.468.
5. L.A. Dickinson, R.J. Gulizia, J.W. Trauger, E.E. Baird, D.E. Mosier, J.M. Gottesfeld,
P.B. Dervan, Inhibition of RNA polymerase polymerase II transcription in human cells
Biological and Pharmaceutical Bulletin Advance Publication
by synthetic DNA-binding ligands, Proc. Nat. Acad. Sci. U S A 95 (1998) 12890–
12895.
https://doi.org/10.1073/pnas.95.22.12890.
6. H. Matsuda, N. Fukuda, T. Ueno, Y. Tahira, H. Ayame, W. Zhang, T. Bando, H.
Sugiyama, S. Saito, K. Matsumoto, H. Mugishima, K. Serie, Development of gene
silencing pyrrole-imidazole polyamide targeting the TGF-β1 promoter for treatment of
progressive renal diseases, J. Am. Soc. Nephrol. 17 (2006) 422–432.
https://doi.org/10.1681/ASN.2005060650.
7. J. Igarashi, N. Fukuda, T. Inoue, S. Nakai, K. Saito, K. Fujiwara, H. Matsuda, T. Ueno,
Y. Matsumoto, T. Watanabe, H. Nagase, T. Bando, H. Sugiyama, T. Itoh, M. Soma,
Preclinical study of novel gene silencer pyrrole-imidazole polyamide targeting human
TGF-β1 promoter for hypertrophic scars in a common marmoset primate model, PLoS
One. 10 (2015) e0125295. https://doi.org/10.1371/journal.pone.0125295.
8. A. Fukasawa, T. Nagashima, T. Aoyama, N. Fukuda, H. Matsuda, T. Ueno, H.
Sugiyama, H. Nagase, Y. Matsumoto, Optimization and validation of a

Biological and Pharmaceutical Bulletin Advance Publication
high-performance liquid chromatographic method with UV detection for the
determination of pyrrole–imidazole polyamides in rat plasma, J. Chromatogr. B 859
(2007) 272–275.
https://doi.org/10.1016/j.jchromb.2007.09.032.
9. T. Kamei, T. Aoyama, C. Tanaka, T. Nagashima, Y. Aoyama, H. Hayashi, H. Nagase, T.
Ueno, N. Fukuda, Y. Matsumoto, Quantitation of pyrrole-imidazole polyamide in rat
plasma by high-performance liquid chromatography coupled with UV detection, J
Biomed. Biotechnol. Volume 2012, Article ID 715928, 10 pages.
http://dx.doi.org/10.1155/2012/715928.
10. T. Nagashima, T. Aoyama, A. Fukasawa, S. Watabe, N. Fukuda, T. Ueno, H. Sugiyama,
H. Nagase, Y. Matsumoto, Determination of pyrrole–imidazole polyamide in rat
plasma by liquid chromatography–tandem mass spectrometry, J. Chromatogr. B 877
(2009) 1070–1076. https://doi.org/10.1016/j.jchromb.2009.02.041.
11. A. Miyamoto, T. Aoyama, H. Kobayashi, T. Ueno, N. Fukuda, Y. Matsumoto,
Establishment of PI polyamide extraction method in biological sample, the 138th

Biological and Pharmaceutical Bulletin Advance Publication
Annual Meeting of the Pharmaceutical Society of Japan, March 28, 2018.
http://nenkai.pharm.or.jp/138/pc/ipdfview.asp?i=2649.
12. T. Bando, A. Narita, I. Saito, H. Sugiyama, Molecular design of pyrrole–imidazole
hairpin polyamides for effective DNA alkylation, Chemistry 8 (2002) 4781–4790.
https://doi.org/10.1002/1521-3765(20021018)8:20<4781::AID-CHEM4781>3.0.CO;2-
J.
13. A. Miyamoto, T. Aoyama, Y. Matsumoto, The Measurement of Meloxicam and
Meloxicam Metabolites in Rat Plasma Using a High-Performance Liquid
Chromatography-Ultraviolet Spectrophotometry Method, Chem. Pharm. Bull. 65
(2017) 121–126.
https://doi.org/10.1248/cpb.c16-00514.
14. National Institute of Health Sciences, Guideline on Bioanalytical Method Validation in
Pharmaceutical Development, 2014.
Biological and Pharmaceutical Bulletin Advance Publication
Fig. 1 Chemical structure of PI (GB1101, MW: 1787.90)
Biological and Pharmaceutical Bulletin Advance Publication
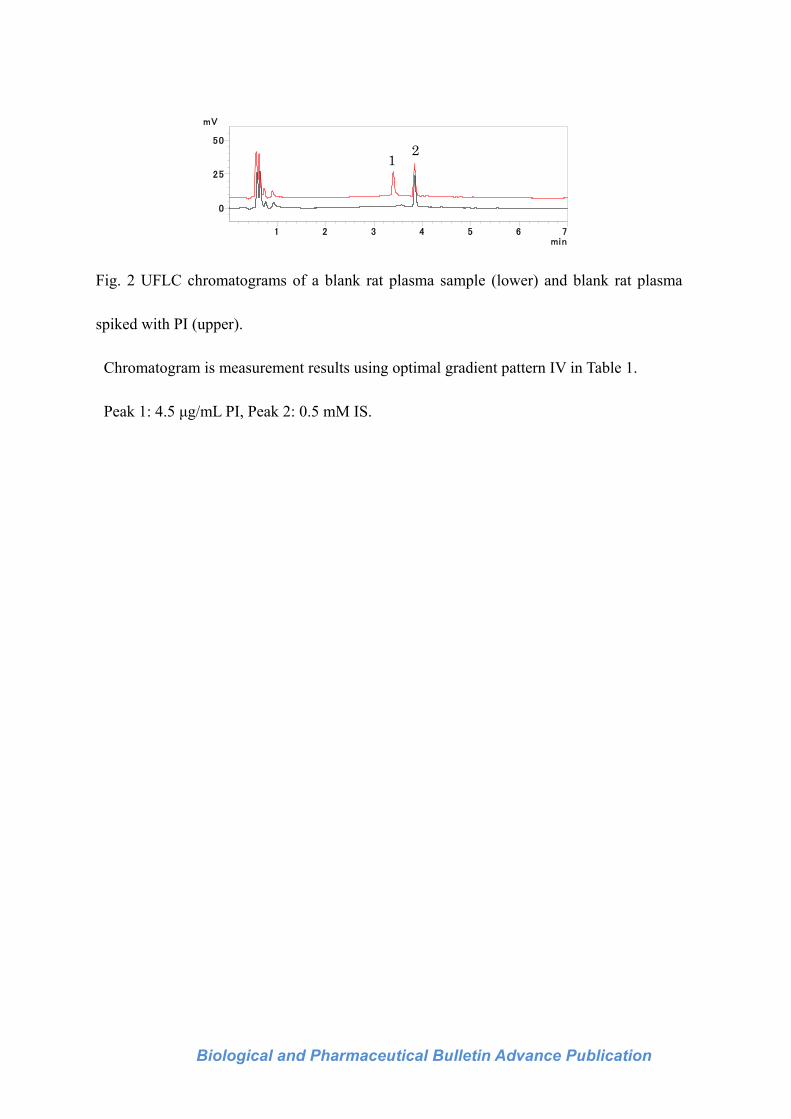
Fig. 2 UFLC chromatograms of a blank rat plasma sample (lower) and blank rat plasma
spiked with PI (upper).
Chromatogram is measurement results using optimal gradient pattern IV in Table 1.
Peak 1: 4.5 μg/mL PI, Peak 2: 0.5 mM IS.
Biological and Pharmaceutical Bulletin Advance Publication
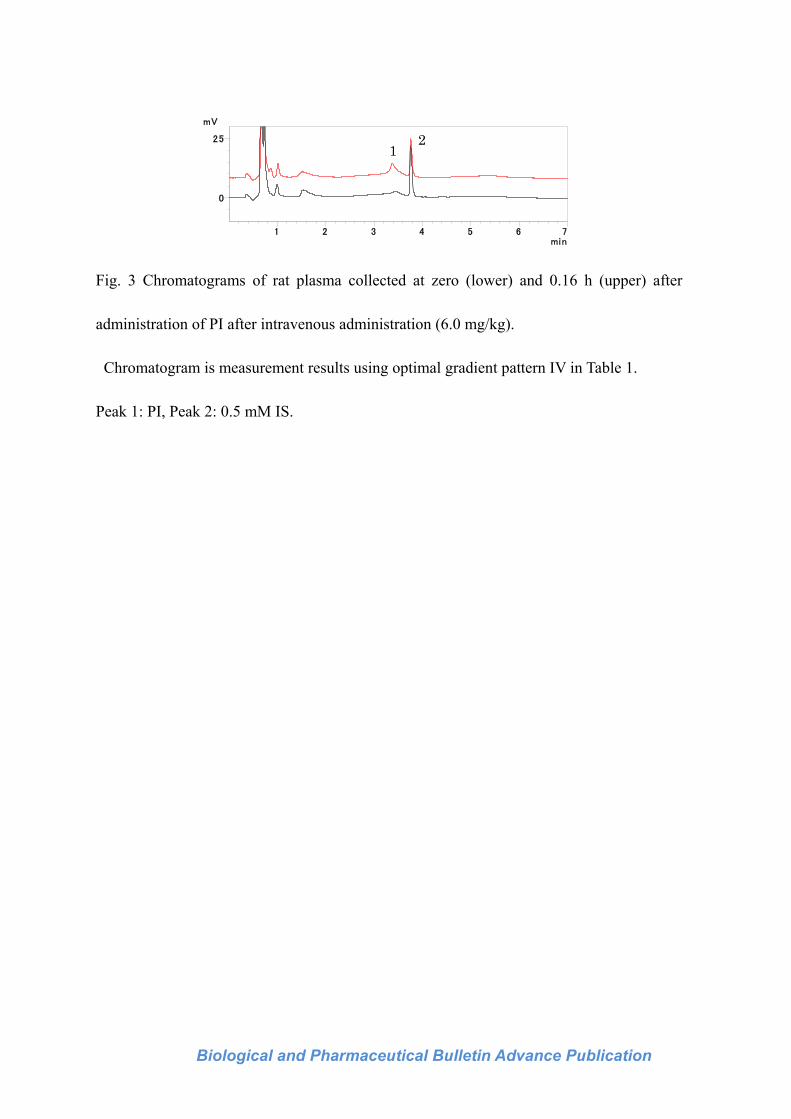
Fig. 3 Chromatograms of rat plasma collected at zero (lower) and 0.16 h (upper) after
administration of PI after intravenous administration (6.0 mg/kg).
Chromatogram is measurement results using optimal gradient pattern IV in Table 1.
Peak 1: PI, Peak 2: 0.5 mM IS.

Biological and Pharmaceutical Bulletin Advance Publication
Fig. 4 Rat plasma concentration–time profile after intravenous administration (6.0 mg/kg).
PI in 0.1% acetic acid (6.0 mg/kg) was administered a single intravenous dose to two male
12-week-old Sprague–Dawley rats. The sampling times were 0, 0.16, 0.33, 0.5, 1, 1.5, 2, 3,
4, 6, and 8 h after the administration.
0
0.5
1
1.5
2
2.5
3
0 1 2 3 4 5 6 7 8 9
Con
cent
rati
on o
f P
I (µ
g/m
L)
Time (h)
Rat 1Rat 2
Biological and Pharmaceutical Bulletin Advance Publication
Table 1 Gradient pattern of UFLC for PI and IS separation.
Pattern 0 min 0.5 min 1 min 4 min 4.01 min 7 min
I B, % 0 60 60 0 0
II B, % 0 50 50 0 0
III B, % 0 40 40 0 0
IV B, % 5 50 50 5 5

Biological and Pharmaceutical Bulletin Advance Publication
Table 2 Intra-day accuracy and precision of each gradient pattern.
Nominal concentration
(µg/mL)
Mean concentration
(µg/mL)
Accuracy
(%)
Precision
(%)
Pattern I
5 4.998 3.41 −0.04
10 10.17 1.04 1.69
15 14.78 0.13 −1.50
20 19.95 1.58 −0.25
25 25.11 0.43 0.43
Pattern II
5 4.93 3.70 −1.50
10 10.22 1.44 2.21
15 14.85 0.71 −0.97
20 19.93 1.87 −0.33
25 25.07 0.53 0.28
Pattern III
5 5.25 4.32 4.96
10 11.11 1.54 11.1
15 12.91 25.0 −13.9
20 19.49 4.14 −2.55
25 26.06 2.36 4.23
Pattern IV
5 4.96 1.09 −0.77
10 9.93 1.94 −0.75
15 15.23 2.35 1.53
20 19.92 1.93 −0.40
25 24.96 1.28 −0.14

Biological and Pharmaceutical Bulletin Advance Publication
Table 3 Calibration curve parameters for each gradient pattern (n = 3).
Slope Intercept Correlation coefficient
Pattern I 0.829 ± 0.012 0.132 ± 0.137 0.9998
Pattern II 0.827 ± 0.011 0.229 ± 0.113 0.9998
Pattern III 0.788 ± 0.021 0.167 ± 0.591 0.9863
Pattern IV 1.377 ± 0.019 0.303 ± 0.349 0.9998
Biological and Pharmaceutical Bulletin Advance Publication
Table 4 Recovery of PI and IS in rat plasma samples.
Recovery (%)
Intra-day (n = 3) Inter-day (n = 3)
PI 98.19 ± 3.10 96.67 ± 4.69
IS 102.2 ± 6.53 110.2 ± 7.07

Biological and Pharmaceutical Bulletin Advance Publication
Table 5 Intra- and inter-day accuracy and precision in rat plasma samples.

Biological and Pharmaceutical Bulletin Advance Publication
Table 6 The pharmacokinetic parameters of PI in rats after single intravenous dose of PI at
6.0 mg/kg (n = 2).
Pharmacokinetic parameters Rat 1 Rat 2
C0 (μg/mL) 2.45 2.49
ke (1/h) 0.27 0.34
t1/2 (h) 2.59 2.06
CL (mL/h) 629.4 310.9
Vss (mL) 2351.5 924.2
AUC 0-∞ (μg h/mL) 3.28 6.65
C0: initial concentration
ke: elimination rate constant
t1/2: half-life of PI elimination at the terminal phase
CL: clearance
Vss: volume of distribution in the steady state
AUC 0-∞: area under the plasma concentration–time curve from 0 h to infinity.