Serge Coulombe, ECO 6120 –Convergence and growth regressions.
META Reps, and the Convergence of Level 1 and Desktop Support
Jeff Rumburg
Managing Partner
MetricNet, LLC
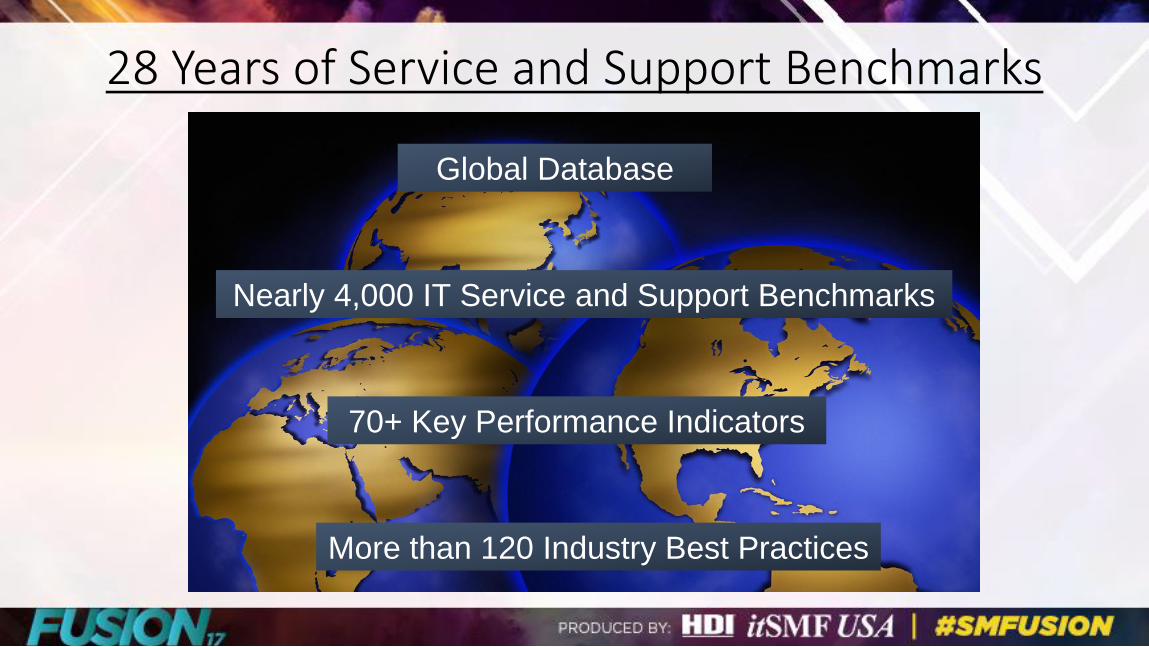
28 Years of Service and Support Benchmarks
Nearly 4,000 IT Service and Support Benchmarks
Global Database
70+ Key Performance Indicators
More than 120 Industry Best Practices
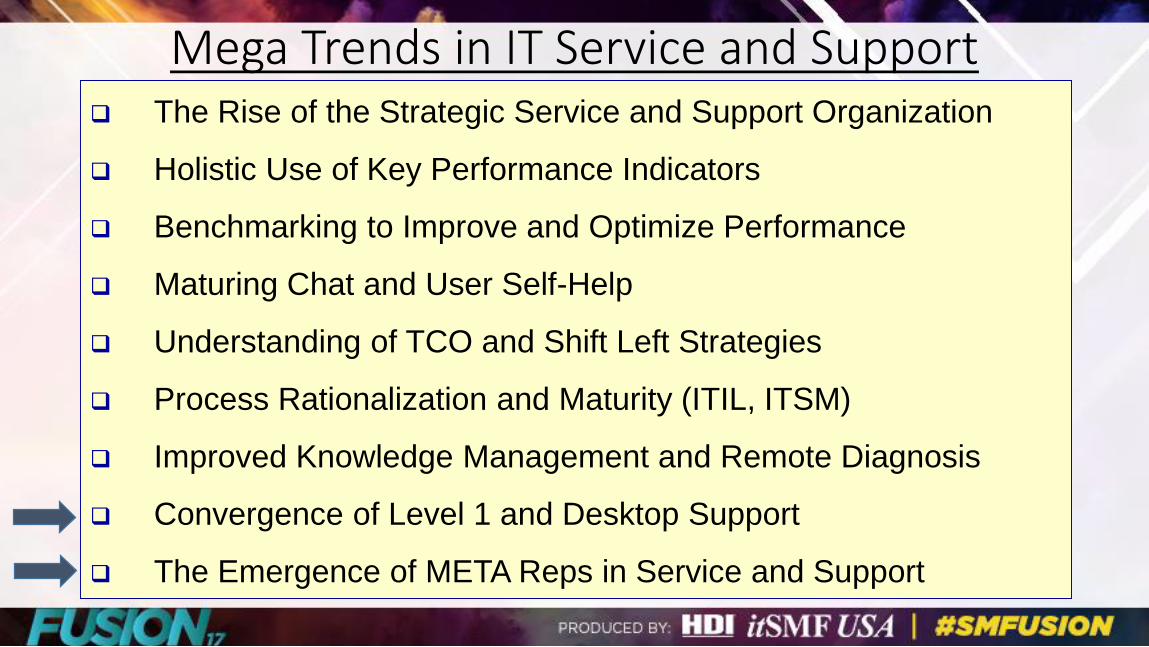
Mega Trends in IT Service and Support The Rise of the Strategic Service and Support Organization
Holistic Use of Key Performance Indicators
Benchmarking to Improve and Optimize Performance
Maturing Chat and User Self-Help
Understanding of TCO and Shift Left Strategies
Process Rationalization and Maturity (ITIL, ITSM)
Improved Knowledge Management and Remote Diagnosis
Convergence of Level 1 and Desktop Support
The Emergence of META Reps in Service and Support

Service Desk vs. Desktop Support
Service Desk Provides Support
RemotelyRequires no physical touch to the device
Desktop Support Provides Support
DesksideRequires a physical touch to the device.

A New Industry Vernacular
Remote Desktop Support
Level 1.5 Support
Field Services

Shift Left Has Empowered Level 1 Reps

The Proliferation of Remote Diagnostic Tools
53.8%55.2%
59.6% 60.0%
64.1%
66.9% 67.4%
74.9%
78.6%
82.1%83.0%
50%
55%
60%
65%
70%
75%
80%
85%
90%
% W
ith
Rem
ote
Co
ntr
ol To
ol
Year

The Effect of Remote Tools on First Level Resolution
0.0%
10.0%
20.0%
30.0%
40.0%
50.0%
60.0%
70.0%
80.0%
90.0%
100.0%
Ne
t F
irs
t L
ev
el R
es
olu
tio
n
Remote Diagnostic Software No Remote Diagnostic Software
Average = 77.8% FLR
Average = 61.4% FLR
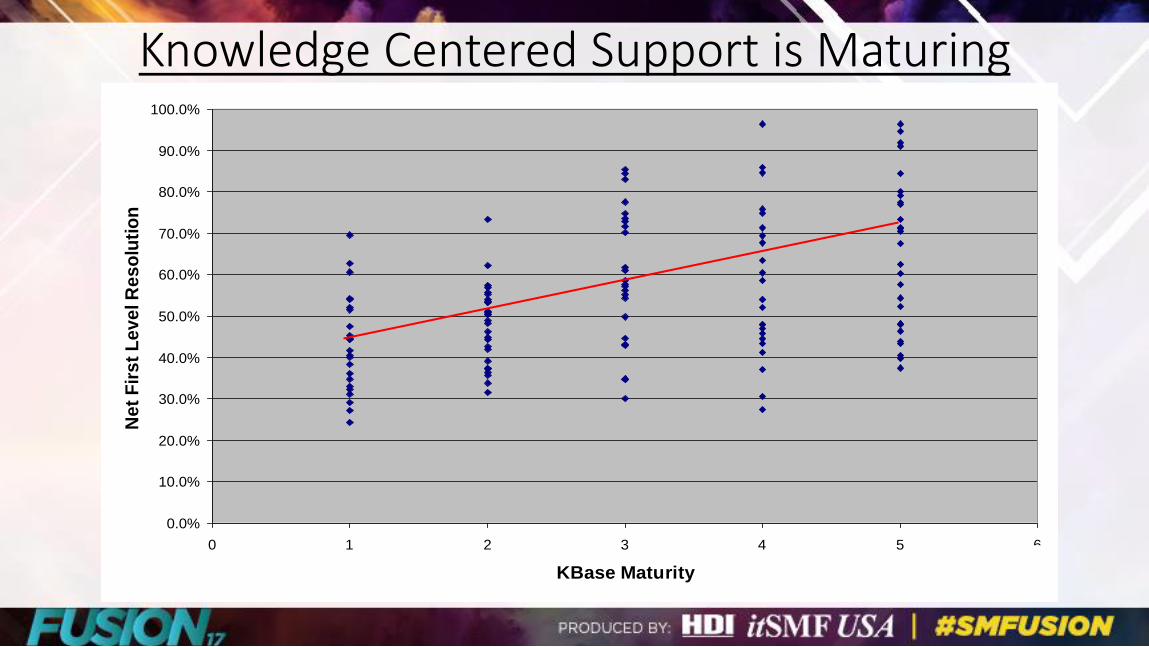
Knowledge Centered Support is Maturing
0.0%
10.0%
20.0%
30.0%
40.0%
50.0%
60.0%
70.0%
80.0%
90.0%
100.0%
0 1 2 3 4 5 6
KBase Maturity
Ne
t F
irs
t L
ev
el R
es
olu
tio
n

50 FTE’s 25 FTE’s
10
Cross-
Trained
META
Reps
Remote
Service Desk
Deskside
Desktop Support
The Convergence of Level 1 and Desktop Support

Mega Trends in IT Service and Support The Rise of the Strategic Service and Support Organization
Holistic Use of Key Performance Indicators
Benchmarking to Improve and Optimize Performance
Maturing Chat and User Self-Help
Understanding of TCO and Shift Left Strategies
Process Rationalization and Maturity (ITIL, ITSM)
Improved Knowledge Management and Remote Diagnosis
Convergence of Level 1 and Desktop Support
The Emergence of META Reps in Service and Support

▪ Newer and less evolved support
organizations are in this category
▪ A reactive “fire-fighting”
mentality prevails at this stage
▪ Focus tends to be almost
exclusively on service level
compliance
▪ Support is continuously playing
catch-up with user needs and
expectations
▪ The primary purpose of a strategic
support organization is to make end users more productive, and to drive
a positive view of IT
▪ A preventive, proactive culture
prevails
▪ Support anticipates user needs and
expectations, and provides services
accordingly
▪ Customer enthusiasm
and value creation is the goal!
Heavy investments in training, tools, and metrics characterize this stage
A knowledge base of problem solutions is typically established
An expert network of problem solvers is developed outside of support
User self-help begins: user-enabled password resets, user searchable knowledge base
Reactive Stage
The Maturity Continuum in IT SupportGrowth Stage Strategic Stage
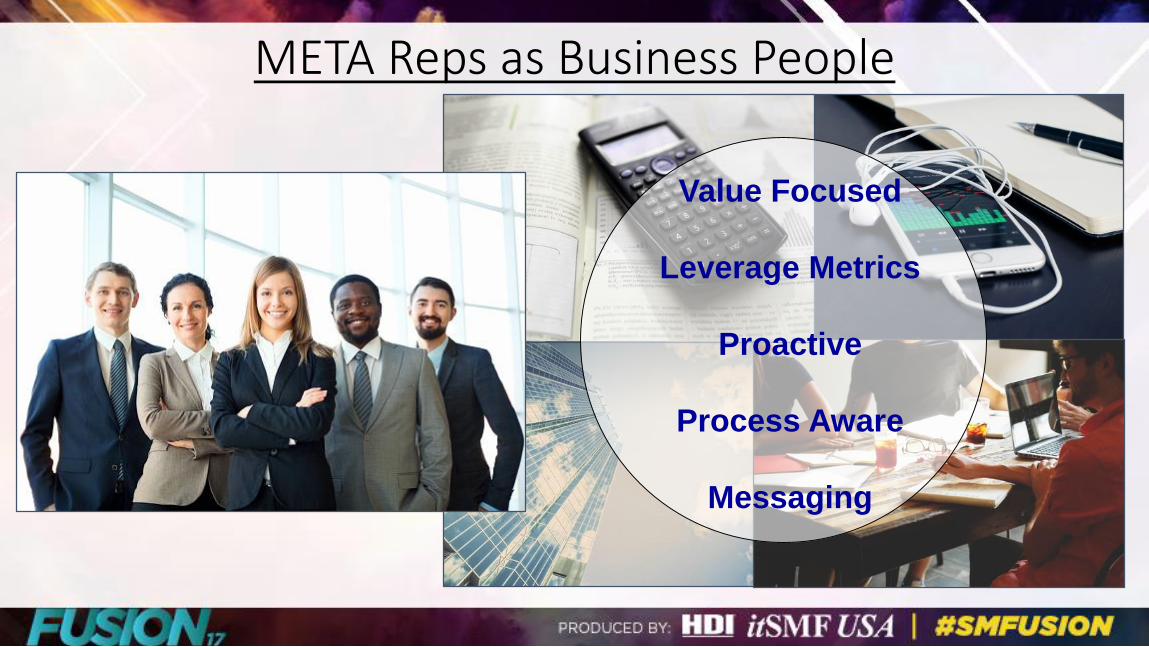
Value Focused
Leverage Metrics
Proactive
Process Aware
Messaging
META Reps as Business People

Shift Left is a Key Source of Value Creation

Contact Deflection into Lower Cost Channels
80%
70%
60%
50%
40%
30%
20%
10%
0%
Year
% o
f Ti
cket
Vo
lum
e$24.50
$24.00
$23.50
$23.00
$22.50
$22.00
$21.50
$21.00
$20.50
Co
st
per
Tic
ket
Self Service
Average Cost
per Ticket
Email/Web
Chat
Voice

0
10
20
30
40
50
60
70
0 1 2 3 4 5
Pro
du
cti
ve H
ou
rs L
ost
per
Em
plo
yee p
er
Year
Quality of Support Creates Economic Value
1 (top) 2 3 4 (bottom)
Customer Satisfaction 93.5% 84.5% 76.1% 69.3%
First Contact Resolution Rate 90.1% 83.0% 72.7% 66.4%
Mean Time to Resolve (hours) 0.8 1.2 3.6 5.0
Customer Satisfaction 94.4% 89.2% 79.0% 71.7%
First Contact Resolution Rate 89.3% 85.6% 80.9% 74.5%
Mean Time to Resolve (hours) 2.9 4.8 9.4 12.3
Service Desk
Desktop Support
Performance QuartileSupport Function Key Performance Indicator
37.4 46.9Average Productive Hours Lost per Employee per Year 17.1 25.9
Performance Quartile n = 60

META Reps Leverage KPIs for Continual Service Improvement5 %We Have Achieved World-Class Performance
We Use Metrics Prescriptively
We Use Metrics to Continuously Improve
We Use Metrics Diagnostically
10%
10 %
20%
We can Define our KPI’s 80%
We do Reporting 90%
We Understand Cause and Effect 30%
We Have Metrics 100%
Incre
asin
g V
alu
e!

Cause-and-Effect for Service and Support KPIsCost per Ticket Customer Satisfaction
Agent
Utilization
First
Contact
Resolution
Agent
Satisfaction
Coaching Career Path Training Hours
Call
Quality
Handle
Time
Agents/
Total FTE’s
Absenteeism/
Turnover
First Level
ResolutionScheduling
Efficiency
Service Levels:
ASA and AR
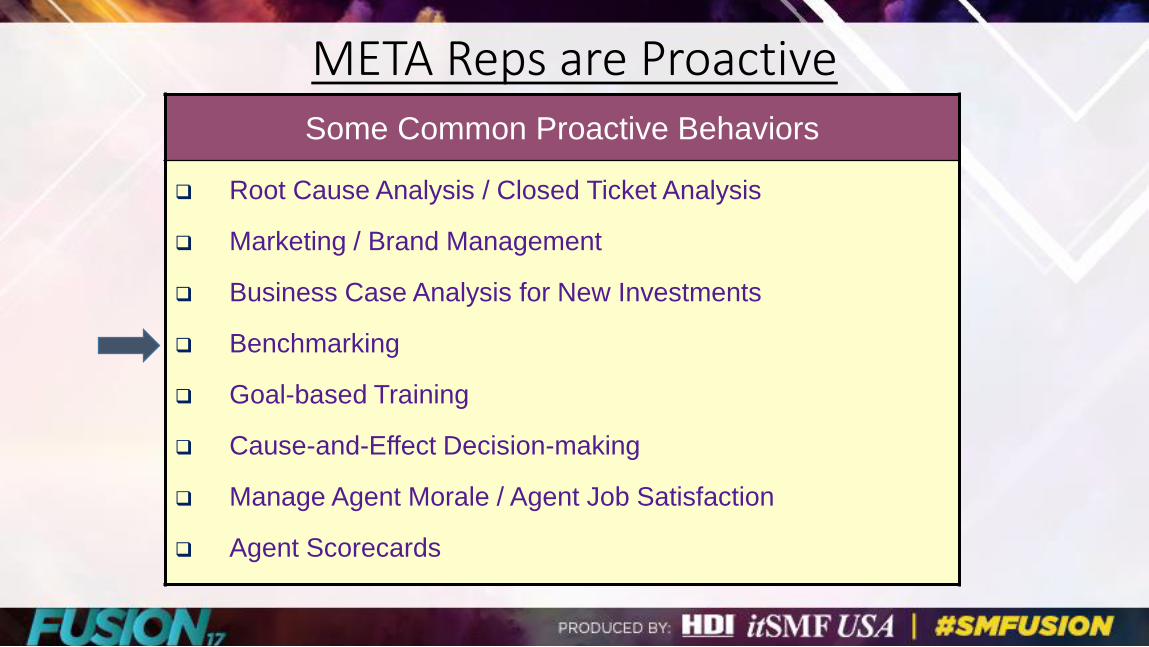
META Reps are ProactiveSome Common Proactive Behaviors
Root Cause Analysis / Closed Ticket Analysis
Marketing / Brand Management
Business Case Analysis for New Investments
Benchmarking
Goal-based Training
Cause-and-Effect Decision-making
Manage Agent Morale / Agent Job Satisfaction
Agent Scorecards

The Benchmarking Methodology
Your IT Support
Performance
Performance of
Benchmarking Peer
Group
Determine How Best in Class Achieve
Superiority
Adopt Selected Practices of
Best in Class
Build a Sustainable Competitive Advantage
The ultimate
objective of
benchmarking
COMPARE

Benchmarking and Continuous Improvement
Yet fewer than 20% of all IT support
groups engage in benchmarking.
Yet fewer than 20% of all IT support groups engage in benchmarking!
There is a 1:1 Correspondence Between Benchmarking and
World-Class Performance.

The Goal of Benchmarking
Cost per Ticket HigherLower
HigherBEST-IN-CLASS
PERFORMANCE CURVE
AVERAGE PERFORMANCE CURVE
AFTER BENCHMARKING
STARTING POINT: BEFORE
BENCHMARKING

Process Awareness
Proactively Managing
Stakeholder
Expectations
Stakeholder Communication
A Holistic Approach to
Performance
Measurement
Performance Measurement
Leveraging People and
ProcessesTechnology
Expeditious Delivery of
Customer ServiceProcess
Proactive, Life-cycle
Management of
Personnel
Human
Resources
Defining Your Charter
and MissionStrategy
DefinitionModel
Component
Customer
Enthusiasm
Strategy
Human Resources
ProcessTechnology
PerformanceMeasurement
Stakeholder Communication
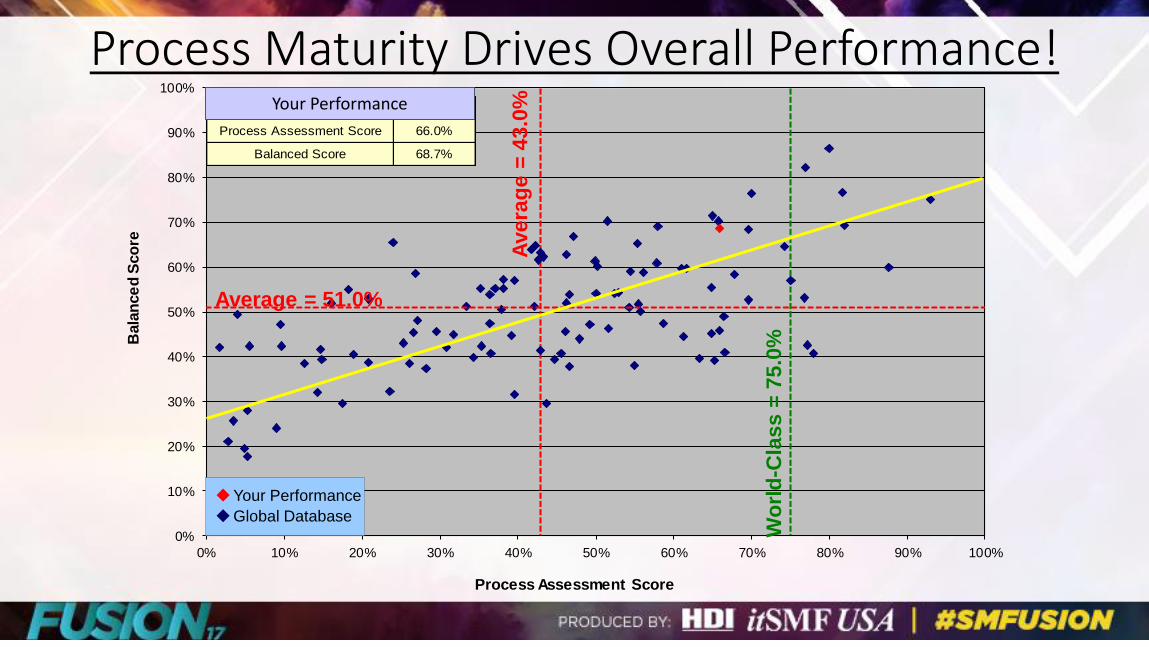
Process Maturity Drives Overall Performance!
0%
10%
20%
30%
40%
50%
60%
70%
80%
90%
100%
0% 10% 20% 30% 40% 50% 60% 70% 80% 90% 100%
Bala
nce
d S
co
re
Process Assessment Score
Avera
ge =
43.0
%
Wo
rld
-Cla
ss =
75.0
%
Average = 51.0%
Your Performance
Global Database
Process Assessment Score 66.0%
Balanced Score 68.7%
Medtronic PerformanceYour Performance

The Optimized Support Organization5 – Optimized Maturity
4
3
2
1
Pro
cess Matu
rity

Managing the Message of IT Support
We’ve all heard the expression…
“Expectations Not Set…are Expectations Not Met!
So, let’s get serious about proactively managing expectations!
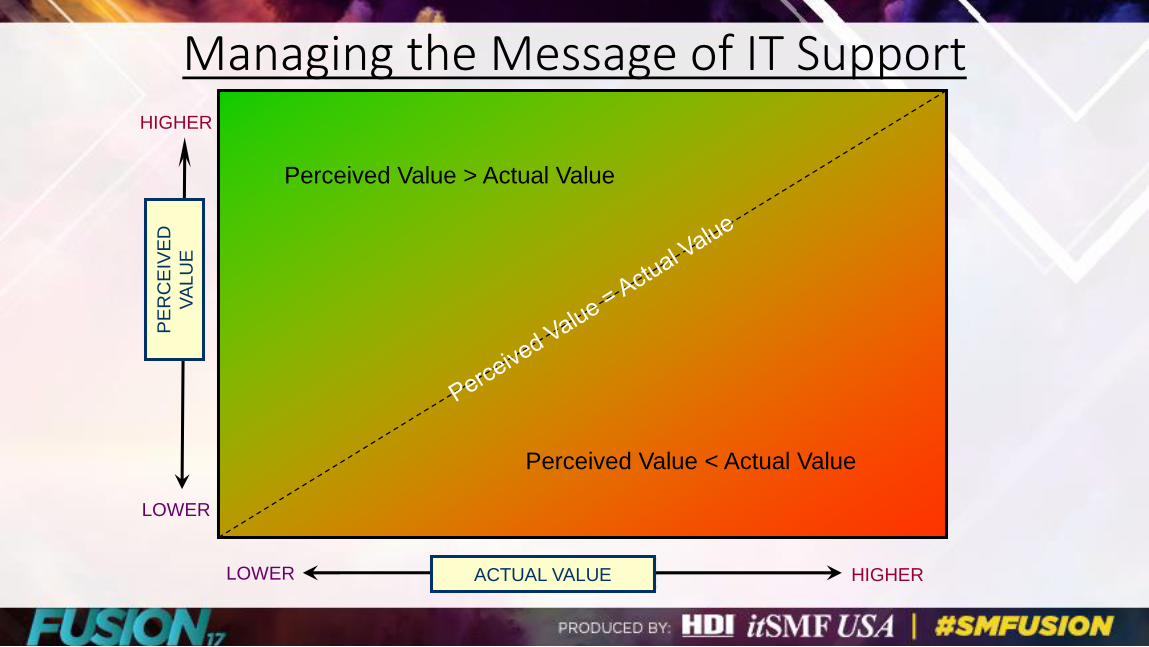
Managing the Message of IT Support
LOWER COST HIGHERACTUAL VALUE
PE
RC
EIV
ED
VA
LU
E
HIGHER
LOWER
Perceived Value > Actual Value
Perceived Value < Actual Value
Managing the Message of IT Support
Where is IS failing to meet XXX needs?
Rank Fails Survey Question
1 - 22.1% 24. Availability of shared resources
2 - 16.2% 30. Your satisfaction with remote access services
3 - 14.7% 17. Continue using the IS Support Center
4 - 13.2% 28. Overall satisfaction with computing/network services
5 - 11.8% 21. The response to requested software changes
5 - 11.8% 29. Satisfaction with the current E-Mail services
7 - 10.3% 09. Current services provided by IS
8 - 8.8% 19. Developers understand your business requirements
9 - 8.8% 23. Reliability of business applications
10 - 7.4% 08. IS communication of products and services
10 - 7.4% 22. The response to requested enhancements
12 - 4.4% 07. IS value compared to the cost of services
12 - 4.4% 14. Value of IS Business Consultants
12 - 4.4% 20. Responsiveness to application maintenance requests
15 - 2.9% 12. Acquisition process for IT
15 - 2.9% 18. Applications provide the necessary functionality
12%
Avg.
2.9 % of XXX’s said issue18. failed to meet expectations.
Mean
for ALL
“fails”
Sort field
sequence
field
varriance
duplicate rank
Title of List
above
average
below
average
Selected Issues
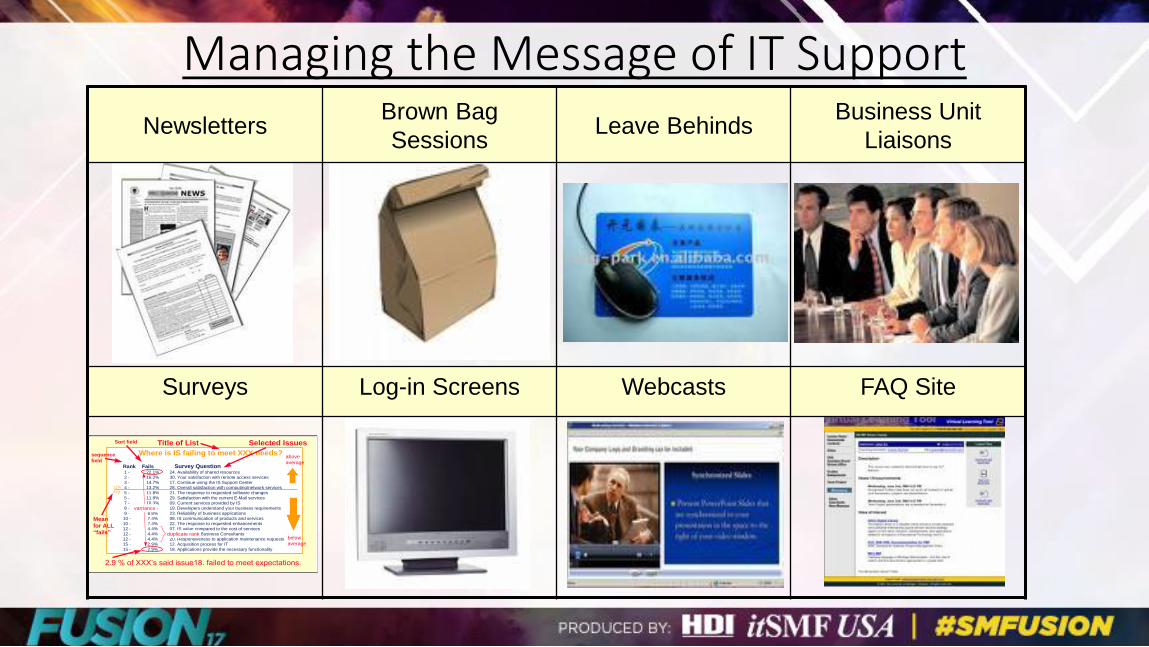
NewslettersBrown Bag
SessionsLeave Behinds
Business Unit
Liaisons
Surveys Log-in Screens Webcasts FAQ Site

Mega Trends in IT Service and Support The Rise of the Strategic Service and Support Organization
Holistic Use of Key Performance Indicators
Benchmarking to Improve and Optimize Performance
Maturing Chat and User Self-Help
Understanding of TCO and Shift Left Strategies
Process Rationalization and Maturity (ITIL, ITSM)
Improved Knowledge Management and Remote Diagnosis
Convergence of Level 1 and Desktop Support
The Emergence of META Reps in Service and Support

The Paradox of IT Support
Less than 5% of all IT spending is allocated
to end-user support
▪ Service desk, desktop support, field support
This leads many to erroneously assume
that there is little upside opportunity in IT
support
The result is that most support
organizations are managed with the goal of
minimizing costs
But the most effective support strategies
focus on maximizing valueCorporate IT Spending Breakdown
4%
96%: Non support functions
End-User Support
Application
Development
Application
Maintenance
Network
Operations
Mainframe and
midrange Computing
Desktop Computing
Contract Services
(e.g., disaster
recovery)

▪ n = 1,044
▪ Global large cap companies
▪ Survey type: multiple choice
▪ 3 responses allowed per survey
▪ 84% cited the service desk as a very important factor in their overall satisfaction with corporate IT
▪ 47% cited desktop support as a very important factor in their overall satisfaction with corporate IT
Service and Support Drives Customer Satisfaction for All of IT

Jeff Rumburg
Managing Partner
MetricNet, LLC
Questions?


Jeff Rumburg
Managing Partner
MetricNet, LLC
Thank You!
Jeff Rumburg
Managing Partner
MetricNet, LLC
Questions?

META Reps, and the Convergence of Level 1 and Desktop Support
Jeff Rumburg
Managing Partner
MetricNet, LLC
About MetricNetYour Benchmarking Partner
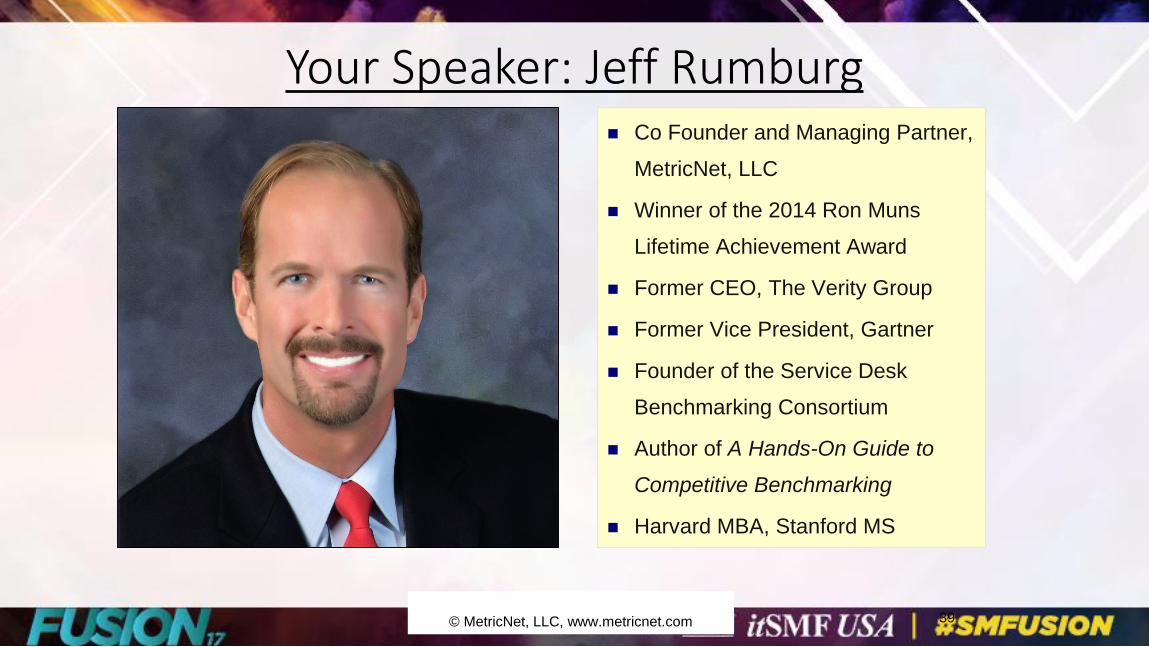
Your Speaker: Jeff Rumburg
© MetricNet, LLC, www.metricnet.com
Co Founder and Managing Partner,
MetricNet, LLC
Winner of the 2014 Ron Muns
Lifetime Achievement Award
Former CEO, The Verity Group
Former Vice President, Gartner
Founder of the Service Desk
Benchmarking Consortium
Author of A Hands-On Guide to
Competitive Benchmarking
Harvard MBA, Stanford MS
39

Benchmarking is MetricNet’s Core Business
Call Centers
Telecom
Information Technology
Satisfaction
Customer Service
Technical Support
Telemarketing/Telesales
Collections
Service Desk
Desktop Support
Field Support
Price Benchmarking
Customer Satisfaction
Employee Satisfaction
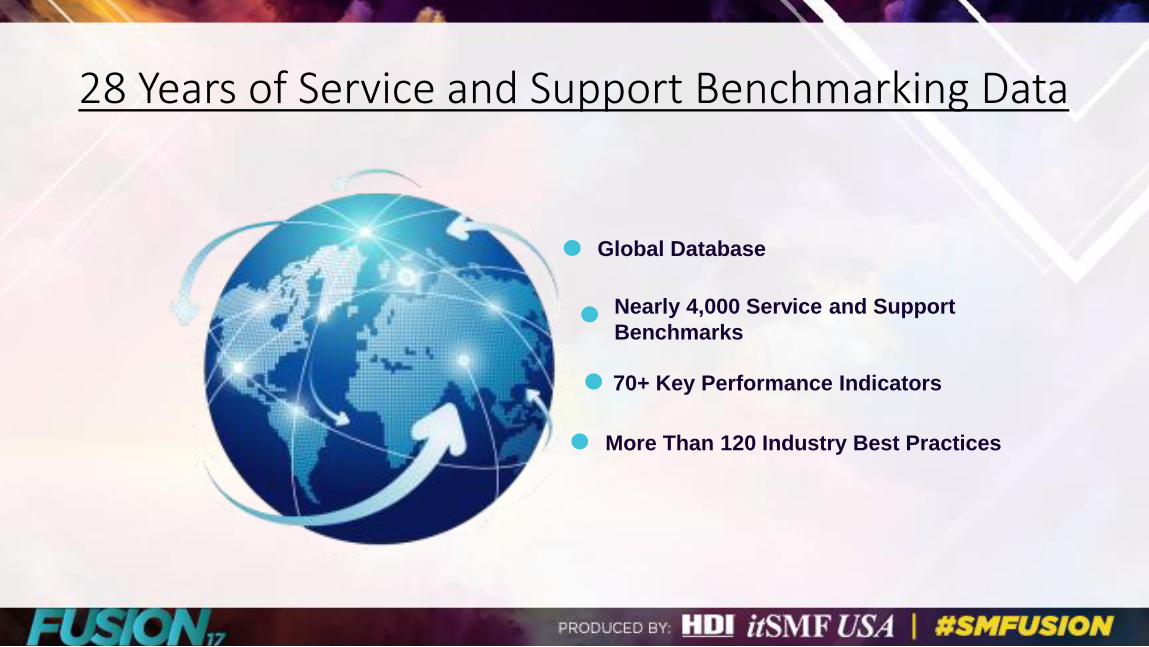
28 Years of Service and Support Benchmarking Data
Nearly 4,000 Service and Support
Benchmarks
Global Database
70+ Key Performance Indicators
More Than 120 Industry Best Practices

Meet a Sampling of Our ClientsMetricNet Conducts benchmarking for IT Service and Support
organizations worldwide, and across virtually every industry sector.
Jeff Rumburg
Managing Partner
MetricNet, LLC
Thank You!