Membranes vs. Conventional Technology · -Not complete suspended solid removal -Carry over ......
69
Presented by Membranes vs. Conventional Technology
Transcript of Membranes vs. Conventional Technology · -Not complete suspended solid removal -Carry over ......

Presented by
Membranes vs.Conventional Technology


What’s on the mind of Utility Engineers?
• Water scarcity
• Changing water characteristics
• Water discharge limits
• Overall cost of operation
• Makeup water quality – impact to equipment
• Makeup water quality – impact to equipment and operational costs
• Manpower requirements

Understand your water source
• How it can vary over time –mineral content
• It’s organic and turbidity variability (organic slippage)
• Biological aspects
• How will sludges be handled and their respective costs
• Defining the “dirt” loading that would be allowable to a pretreatment system
– Ion exchange typically an SDI of 3-5 and suspended solids no greater then 10 ppm
– membranes typically an SDI of <3 and zero suspended solids
Solids Removal

Pretreatment approaches
• Clarification
• Hot or cold lime clarification
• Media filtering
• Membrane filtering
• With or without chlorination
• Do nothing

Impurity Removal Processes
0.045 µm
Electrodialysis Reversal
Table Work - 1
What is the primary pretreatment system in place at your plant?
What are the components in this system?

Typical Raw Water
Raw Water
10.0
100.0
1000.0
10000.0
100000.0
0.1 1 10 100
% of Total Particles
Volume ppm % of Total Volume
Particle Volume
0.5-1.0 483009.0 94.7% 0.0671 0.37% 669709.61.0-2.0 22580.0 4.4% 0.0261 0.15% 260253.72.0-4.0 2320.0 0.5% 0.0277 0.15% 276706.14.0-6.0 560.0 0.1% 0.0361 0.20% 361249.66.0-8.0 300.0 0.1% 0.0533 0.30% 533428.8
8.0-10.0 210.0 0.0% 0.0819 0.46% 818574.710.-15.0 290.0 0.1% 0.2881 1.61% 2881549
15.0-20.0 130.0 0.0% 0.3227 1.80% 322794820.0-30.0 300.0 0.1% 2.2484 12.54% 2248863530.0-40.0 80.0 0.0% 1.9380 10.81% 1938342040.0-50.0 20.0 0.0% 0.7038 3.92% 703932150-100 90.0 0.0% 12.1412 67.70% 1.21E+08
100-200 0.0 0.0% 0.0000 0.00% 0Total 100% 17.9345 100%509889.0
Particle Size (microns) Particles per mL
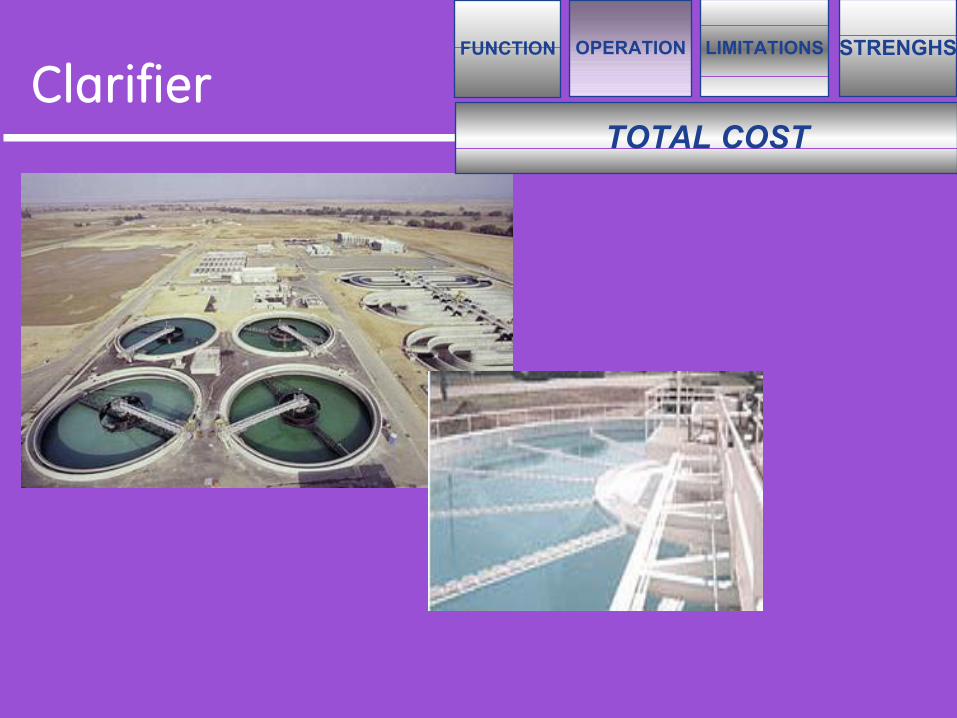
ClarifierTOTAL COST
FUNCTION LIMITATIONSOPERATION STRENGHS
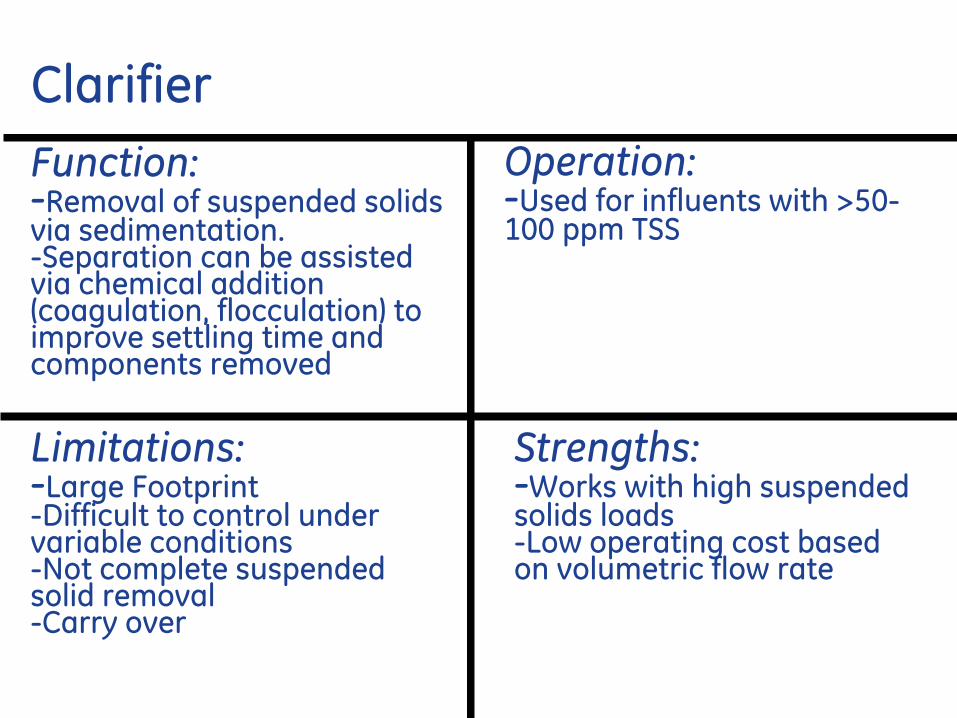
ClarifierFunction:-Removal of suspended solids via sedimentation.-Separation can be assisted via chemical addition (coagulation, flocculation) to improve settling time and components removed
Operation:-Used for influents with >50-100 ppm TSS
Limitations:-Large Footprint-Difficult to control under variable conditions-Not complete suspended solid removal -Carry over
Strengths:-Works with high suspended solids loads-Low operating cost based on volumetric flow rate
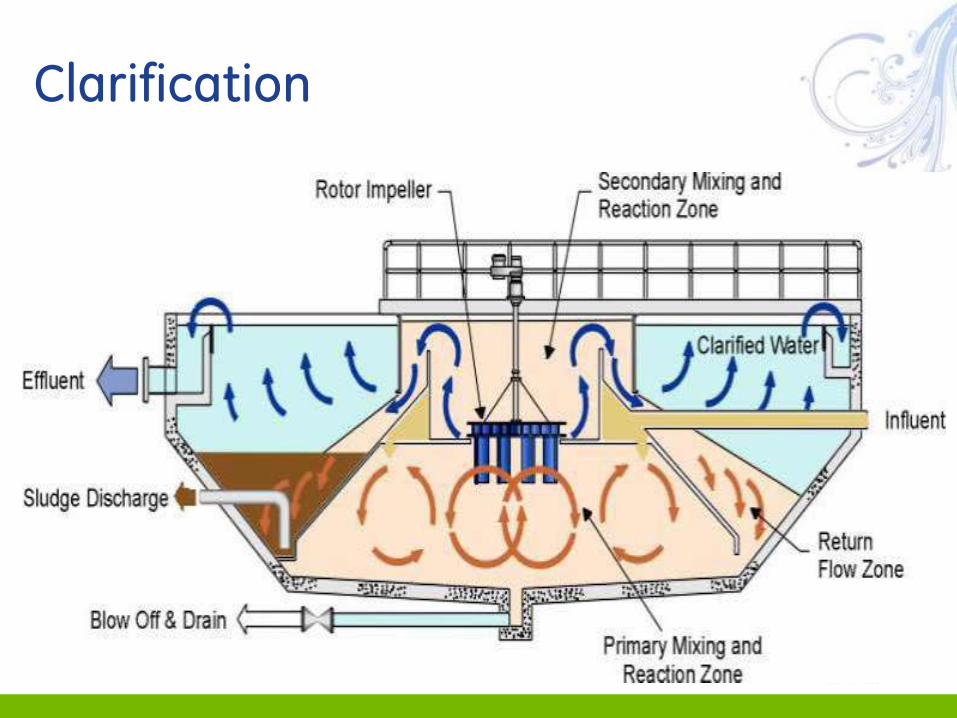
Clarification
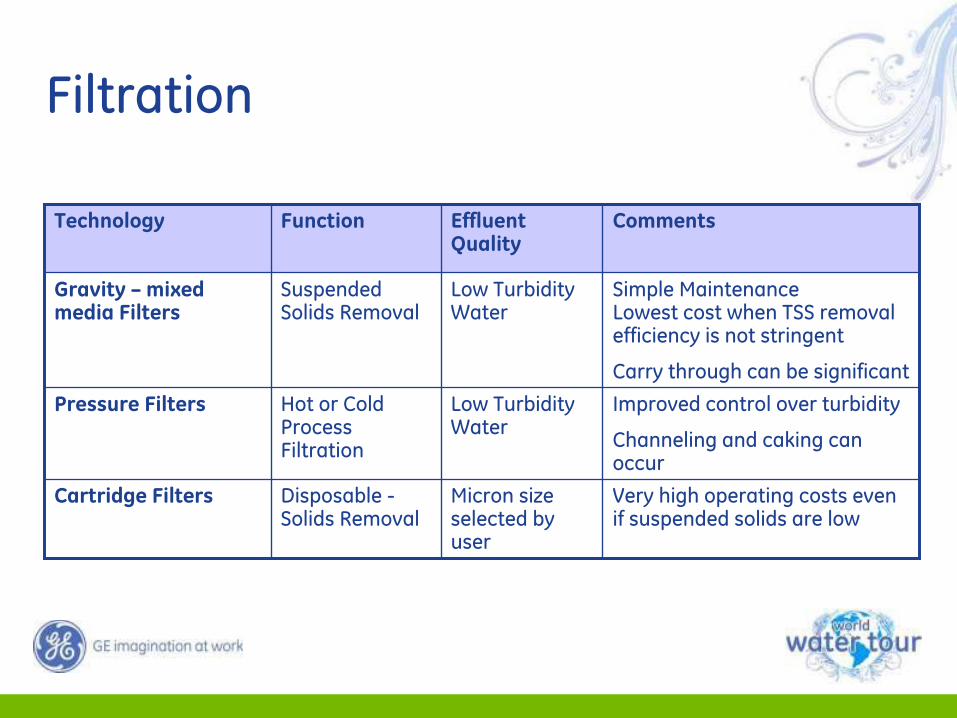
Filtration
Very high operating costs even if suspended solids are low
Micron size selected by user
Disposable -Solids Removal
Cartridge Filters
Improved control over turbidity
Channeling and caking can occur
Low Turbidity Water
Hot or Cold Process Filtration
Pressure Filters
Simple MaintenanceLowest cost when TSS removal efficiency is not stringent
Carry through can be significant
Low Turbidity Water
Suspended Solids Removal
Gravity – mixed media Filters
CommentsEffluent Quality
FunctionTechnology

Gravity - Mixed Media Filter
Most multi media filters rated at around 5 GPM/ft2
Above 6 or 7 GPM/ft2, see quality of effluent decrease
Low flow rates can cause channeling
Avoid sudden rate changes on a dirty filter

Particle Size Analysis effluent from a MMF with Coagulant feed
Filter 4, 5, 6
0.1
1.0
10.0
100.0
1000.0
10000.0
0.1 1 10 100Particle Diameter (µm)
Part
icle
s Co
unte
d (#
n/m
L)
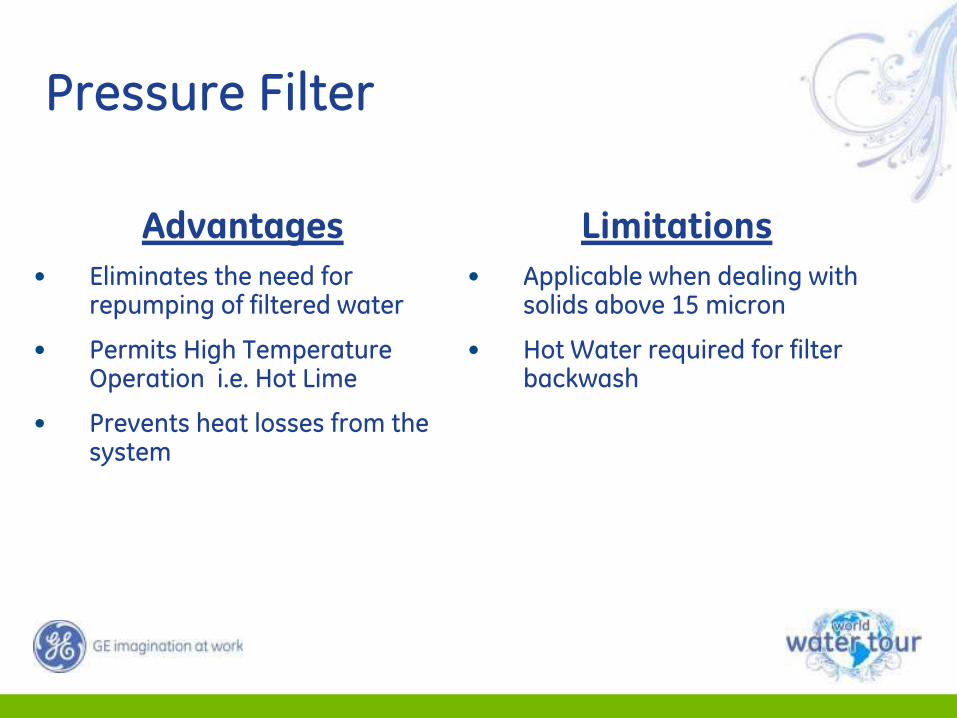
Pressure Filter
Advantages• Eliminates the need for
repumping of filtered water
• Permits High Temperature Operation i.e. Hot Lime
• Prevents heat losses from the system
Limitations• Applicable when dealing with
solids above 15 micron
• Hot Water required for filter backwash

Membranes vs. Conventional Technology
Conventional TreatmentMembrane Treatment
Labor and chemical intensive
OperationFully automated with minimal chemical use
Gravity driven with coarse filtration
Separation ProcessPhysical barrier = reliable filtration
Large land requirementFootprintExtremely compact
Developed in the 1800’sTechnologyModern and continuously improving
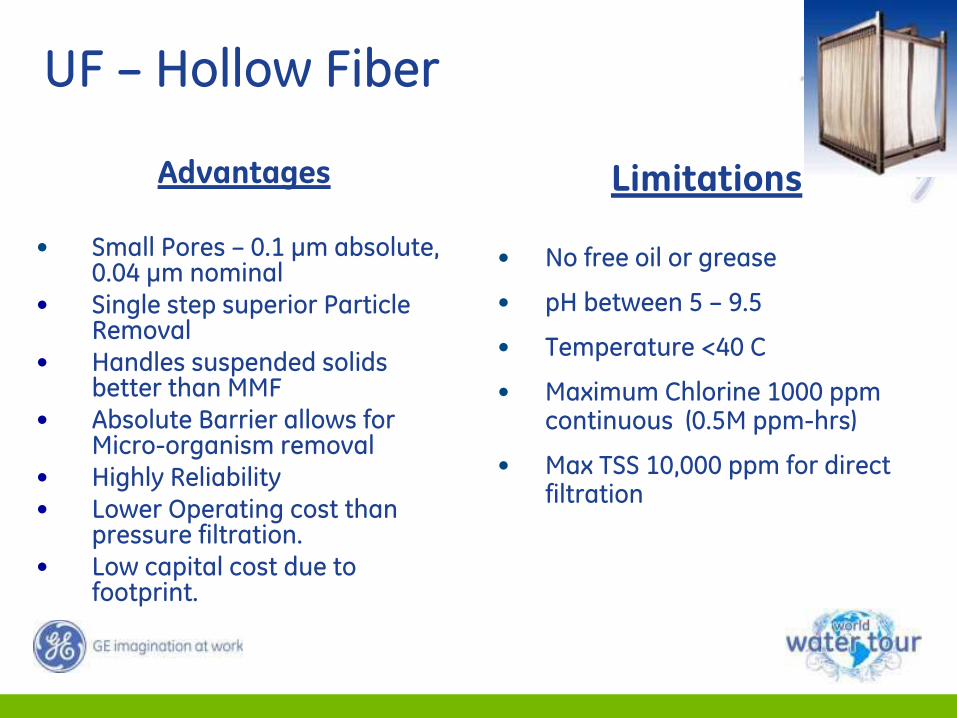
UF – Hollow Fiber
Advantages
• Small Pores – 0.1 µm absolute, 0.04 µm nominal
• Single step superior Particle Removal
• Handles suspended solids better than MMF
• Absolute Barrier allows for Micro-organism removal
• Highly Reliability• Lower Operating cost than
pressure filtration. • Low capital cost due to
footprint.
Limitations
• No free oil or grease
• pH between 5 – 9.5
• Temperature <40 C
• Maximum Chlorine 1000 ppm continuous (0.5M ppm-hrs)
• Max TSS 10,000 ppm for direct filtration

UF - Hollow FiberHollow strands of porous plastic fibers with billions of microscopic pores on the surface
The pores are thousands of times smaller in diameter than a human hair
Pores form a physical barrier to impurities but allow pure water molecules to pass
Clean water is drawn to the inside of fiber by a gentle suction Membrane
Fiber Membrane Module
7 ft
3 ft
Electron microscope view of membrane surface

Hollow Fiber Configurations
More difficult to remove solids from confined pressure vessels, tightly packed fibers
Use higher pressures as membranes become fouled
Expensive pressure vessel required for each unit
Open tank configuration, loosely packed fibers for easier solids removal
Low pressure, vacuum-driven operation
Simpler scale-up for larger systems
PressurizedImmersed


Immersed systems have lower capital cost
Capital Cost--Immersed vs. Pressure UF
Source: Sorghini, Lisa.(USFilter):”Evalution of Low Pressure Membranes: Submerged versus Pressure”. Paper presented at the 2003 AWWA Membrane Specialty Conference, Atlanta, GA.
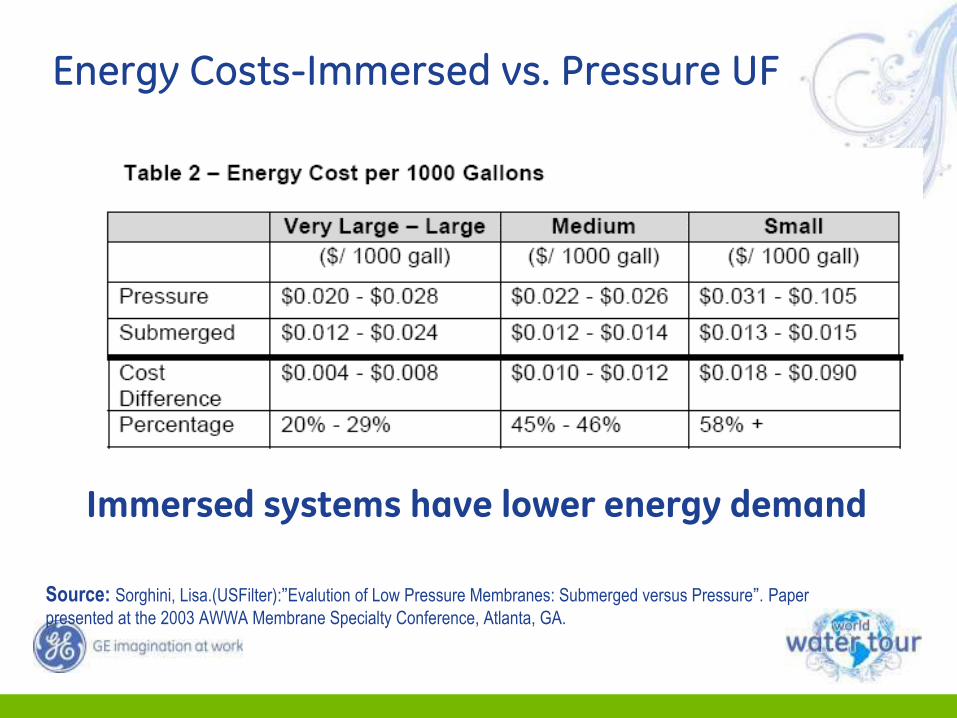
Immersed systems have lower energy demand
Energy Costs-Immersed vs. Pressure UF
Source: Sorghini, Lisa.(USFilter):”Evalution of Low Pressure Membranes: Submerged versus Pressure”. Paper presented at the 2003 AWWA Membrane Specialty Conference, Atlanta, GA.
Dissolved Solids Removal
Table Work - 2
What type of dissolved solids removal systems do you use today and for which systems (Demin, RO, Softener, etc)?
Estimate the cost to operate each system on a $/gal basis?

Ion Exchange
LowModerate50 to 90% Alkalinity reduction
Reduction of alkalinity, hardness and some TDS
Starvation Dealkalization
ModerateLow-Moderate50 to 90% Alkalinity reduction
Reduction of alkalinity
Chloride AnionDealkalization
HighHigh<10 umho Conductivity <200 ppm Silica
Removal of all dissolved solids
Demineralization
ModerateHigh0.2 – 1.0 ppm hardness
Some alkalinity, silica and TDS removal
Hot process water softening
Hot Zeolite Softening
LowLow0.2 – 1.0 ppm hardness
Hardness Removal
Sodium Zeolite Softening
O&M CostsCapital CostsEffluent QualityFunctionTechnology
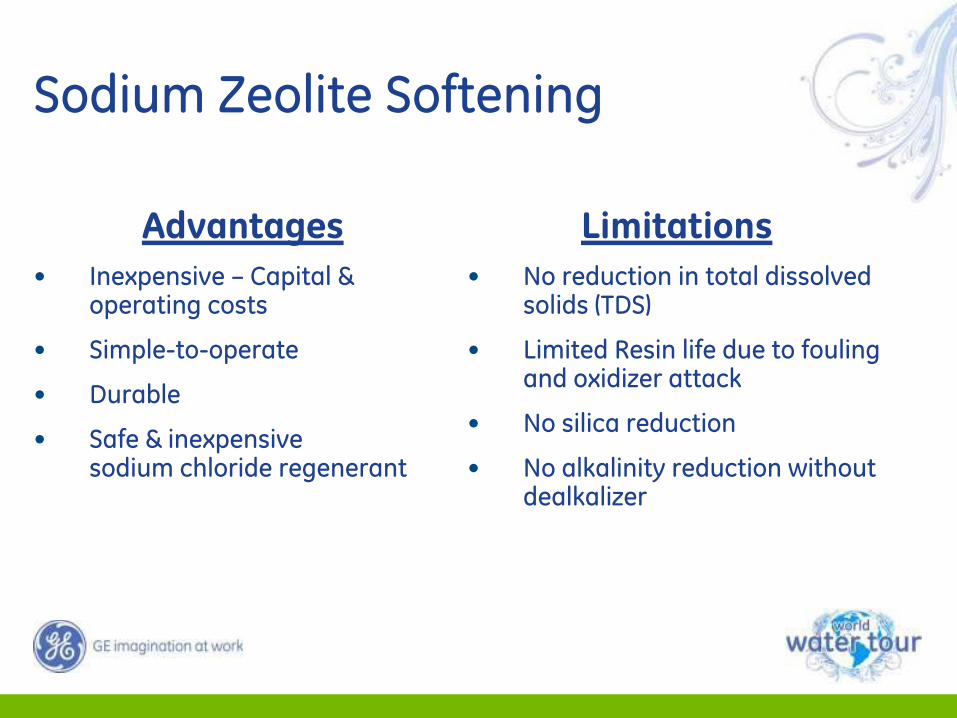
Advantages• Inexpensive – Capital &
operating costs
• Simple-to-operate
• Durable
• Safe & inexpensive sodium chloride regenerant
Limitations• No reduction in total dissolved
solids (TDS)
• Limited Resin life due to fouling and oxidizer attack
• No silica reduction
• No alkalinity reduction without dealkalizer
Sodium Zeolite Softening

Hot Zeolite Softening
Advantages• Softening under process
temperatures (100 – 115 C)
• Softening reactions go to completion
• Typically good silica reduction as well through absorption of silica on the magnesium hydroxide precipitate
• Some TDS reduction
Limitations• Clogging or improper spray
pattern can prevent proper heating of water
• Lime feed is always a pain
• Sludge handling concerns

Demineralization
Advantages
• Reduction in all dissolved solids
• Enables high cycles operation
• Suitable for high-pressure boilers
• Can tailor to specific purity needs
• Excellent silica rejection
• Excellent alkalinity/CO2 rejection
Limitations
• Strong acid/caustic required for regeneration
• Caustic costs high & variable
• Limited anion resin life
• Silica and sodium leakage
• Manpower intensive
• Operating costs directly proportional to TDS

Chloride Anion Dealkalization
Advantages• Inexpensive – Capital &
operating costs
• Simple-to-operate
• Durable
• Safe & inexpensive sodium chloride regenerant
Limitations• No reduction in total dissolved
solids (TDS)
• FW quality can limit boiler cycles
• Not suitable for high-pressure boiler operation (> 900 psig)
• No silica reduction
• No alkalinity reduction without dealkalizer

Starvation Dealkalization
Advantages• Reduction of 80-90% alkalinity
• Reduction of hardness to <0.1 ppm
• Some reduction of TDS
• Efficient use of regenerants
• Low water wastage
Limitations• Waste is not readily reusable
• Handling of acids
• Neutralization of waste required
• No silica reduction
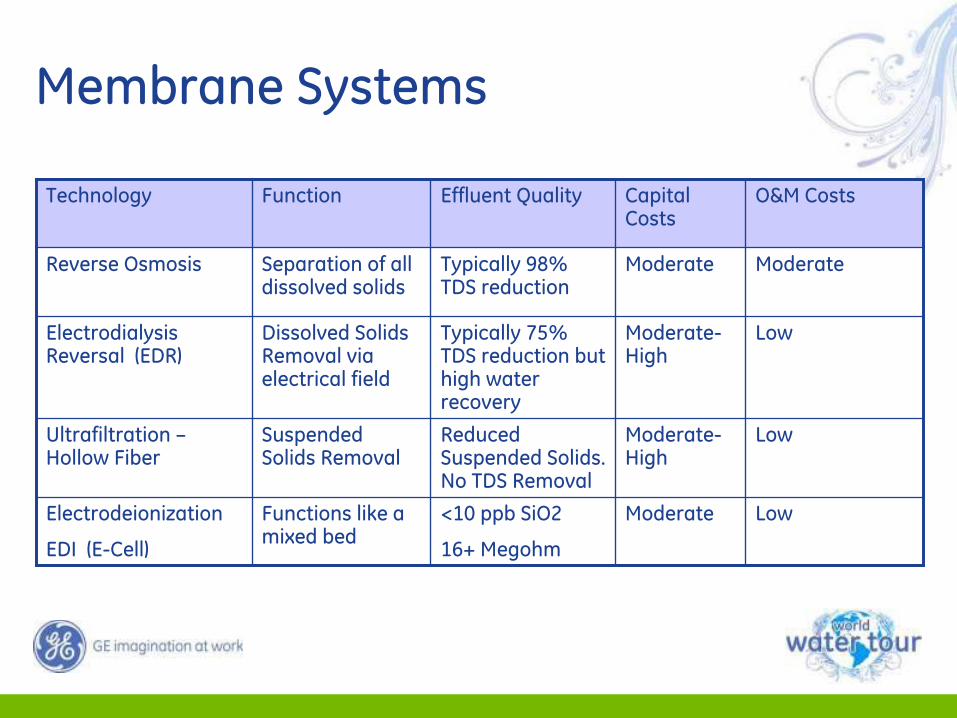
Membrane Systems
LowModerate-High
Reduced Suspended Solids. No TDS Removal
Suspended Solids Removal
Ultrafiltration –Hollow Fiber
LowModerate<10 ppb SiO2
16+ Megohm
Functions like a mixed bed
Electrodeionization
EDI (E-Cell)
LowModerate-High
Typically 75% TDS reduction but high water recovery
Dissolved Solids Removal via electrical field
Electrodialysis Reversal (EDR)
ModerateModerateTypically 98% TDS reduction
Separation of all dissolved solids
Reverse Osmosis
O&M CostsCapital Costs
Effluent QualityFunctionTechnology

What is a Membrane?
Two classes of membranes:• Porous (UF, MF)• Non-porous (RO, NF)
Non-porous membranes typically comprise a thin film on a support
Fabric
Porous layer ~ 55-100 µmNon-porous film ~ 50 – 10,000 nm
Composite Membrane Cross-section
UF,
MF
Mem
bran
e
RO
, NF
Mem
bran
e
Top Surface
Cross-Section

Reverse Osmosis
Advantages• Rejection of all dissolved solids
• Operating costs not directly dependant on TDS
• Enables high cycle boiler operation
• Requires no chemical regenerants (acid/caustic)
• Not labor intensive
• Versatile pairings with resin-based systems
• Ideal for mobile applications
Limitations• Not meant for Suspended Solids
removal
• Higher electrical costs than resin-based systems (high-pressure pumps)
• Generates significant reject stream (typically 20 – 30% of input stream)
• Does not reject CO2
• Maximum Temperature – 80C
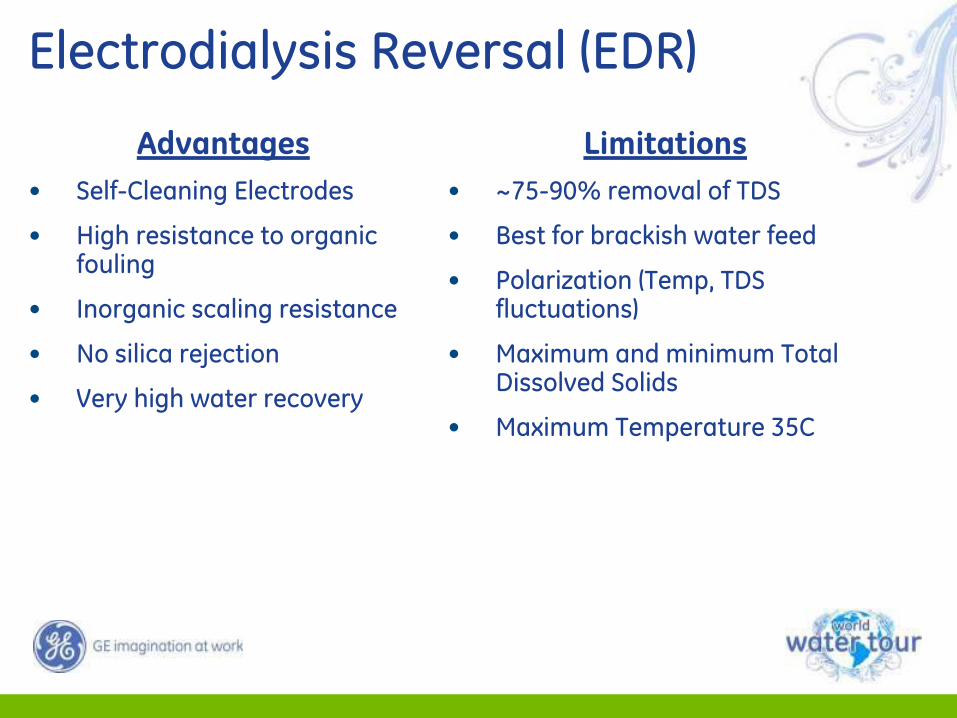
Electrodialysis Reversal (EDR)
Advantages• Self-Cleaning Electrodes
• High resistance to organic fouling
• Inorganic scaling resistance
• No silica rejection
• Very high water recovery
Limitations• ~75-90% removal of TDS
• Best for brackish water feed
• Polarization (Temp, TDS fluctuations)
• Maximum and minimum Total Dissolved Solids
• Maximum Temperature 35C
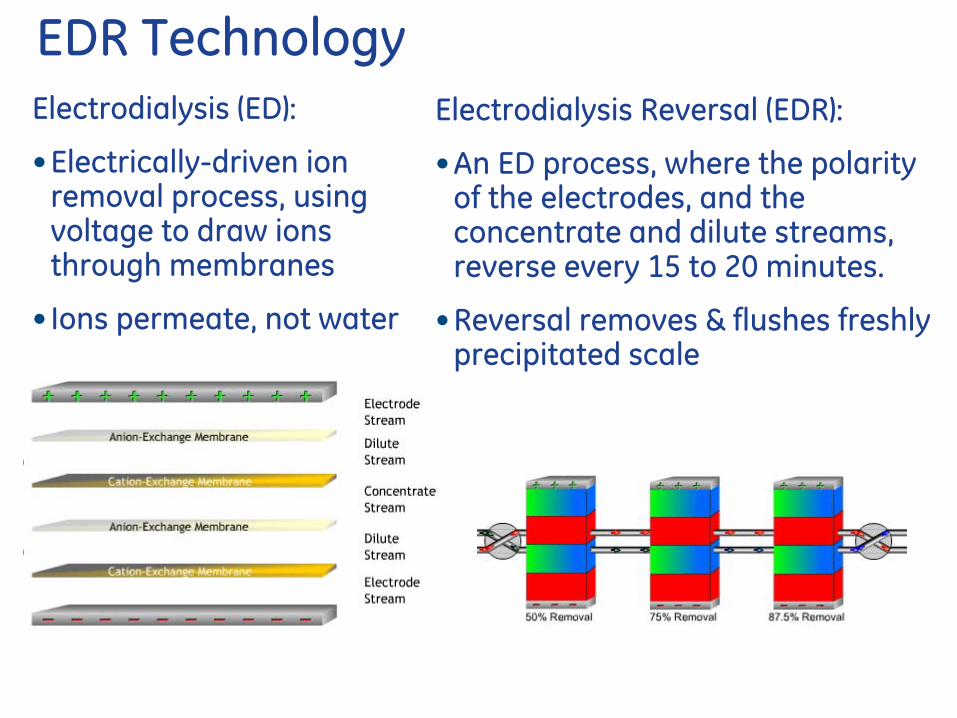
EDR TechnologyElectrodialysis (ED):
•Electrically-driven ion removal process, using voltage to draw ions through membranes
• Ions permeate, not water
Electrodialysis Reversal (EDR):
•An ED process, where the polarity of the electrodes, and the concentrate and dilute streams, reverse every 15 to 20 minutes.
•Reversal removes & flushes freshly precipitated scale

PRO MK-3 E-Cell Systems

Purification Evolution
Pretreatment Cation IX Anion IX Mixed Bed
Caustic
Acid
1940’s
Pretreatment Mixed Bed
Caustic Acid
R.O.
1990’s
R.O. EDIZeeweedPretreatment
2000+

Selected Experiences
Shell AOSD--River water, UF, RO, MB
Southern Company – Plant Harris--River water, UF, RO, MB
Petro Canada + Edmonton Gold Bar Muni WWT Plant-- UF, RO

Caustic
Acid
Demin BoilerFeed Water
390 m3/h(1700 USGPM)
North Saskatchewan River
3 mmScreen Heat
Exchanger
2 x 50 %ZeeWeed® Ultrafilters
ZeeWeed®Reject
2 x 50 %ReverseOsmosis
Units ROReject
Forced DraftDegasifier
2 x 100%Mixed Bed IonExchangers
NeutralizationTank
SpentRegenerant
Boiler
NeutralizedRegenerant
Anti-ScalantBisulphiteFerric
Chloride
SodiumHypochlorite
Shell AOSD Plant PFD

Southern Co. Plant Harris PFD
Caustic
Acid
Demin BoilerFeed Water
114 m3/h(500 USGPM)
Alabama River
1 mmScreen
2 x 50 %ZeeWeed® Ultrafilters
ZeeWeed®Reject
2 x 50 %ReverseOsmosis
Units ROReject
2 x 50%Mixed Bed IonExchangers
NeutralizationTank
SpentRegenerant
NeutralizedRegenerant
Anti-ScalantBisulphite
SodiumHypochlorite
InclinedPlate
ClarifierFilter Press

Southern Co Plant Harris
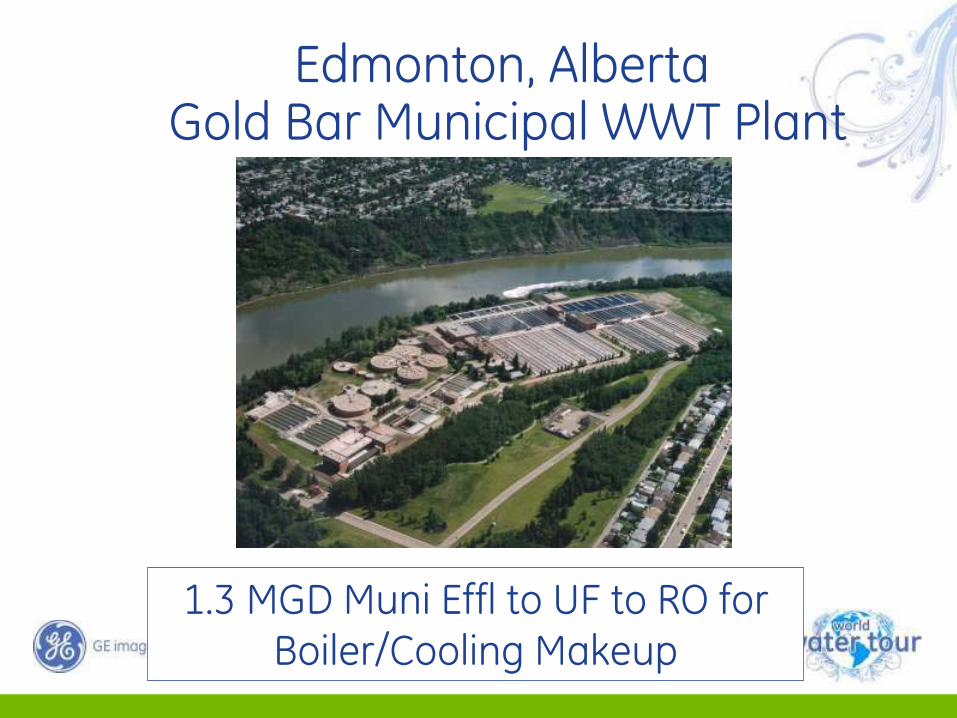
Edmonton, AlbertaGold Bar Municipal WWT Plant
1.3 MGD Muni Effl to UF to RO for Boiler/Cooling Makeup

Effluent Quality Gold Bar UF

Operating Scenarios

Potential Membrane Solutions for Boiler Process Systems
1. RO in front of existing demineralizers
2. RO in front of, or to replace existing softeners
3. New plant—RO/MB or Demin/MB?
4. 2 pass RO/EDI to replace resin-based demineralizer- Mixed-bed quality train
5. Ultrafiltration in front of demin. or RO to replace traditional filtration/clarification
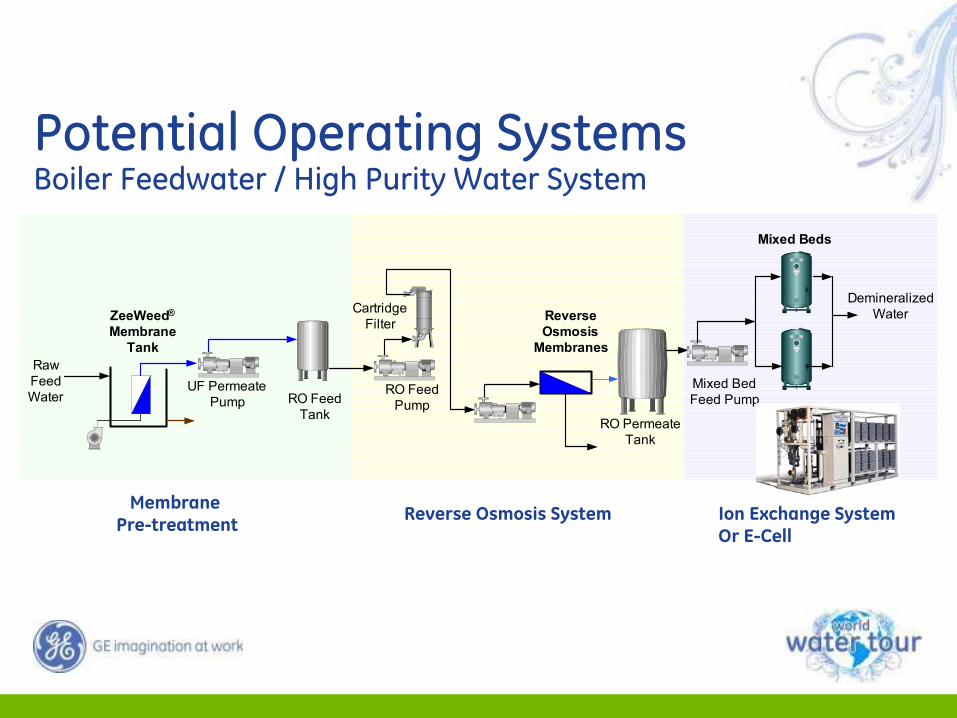
Potential Operating SystemsBoiler Feedwater / High Purity Water System
RawFeedWater
CartridgeFilter
RO FeedPump
RO PermeateTank
RO FeedTank
Mixed BedFeed Pump
DemineralizedWater
UF PermeatePump
ZeeWeed®
MembraneTank
ReverseOsmosis
Membranes
Mixed Beds
Membrane Pre-treatment Reverse Osmosis System Ion Exchange System
Or E-Cell
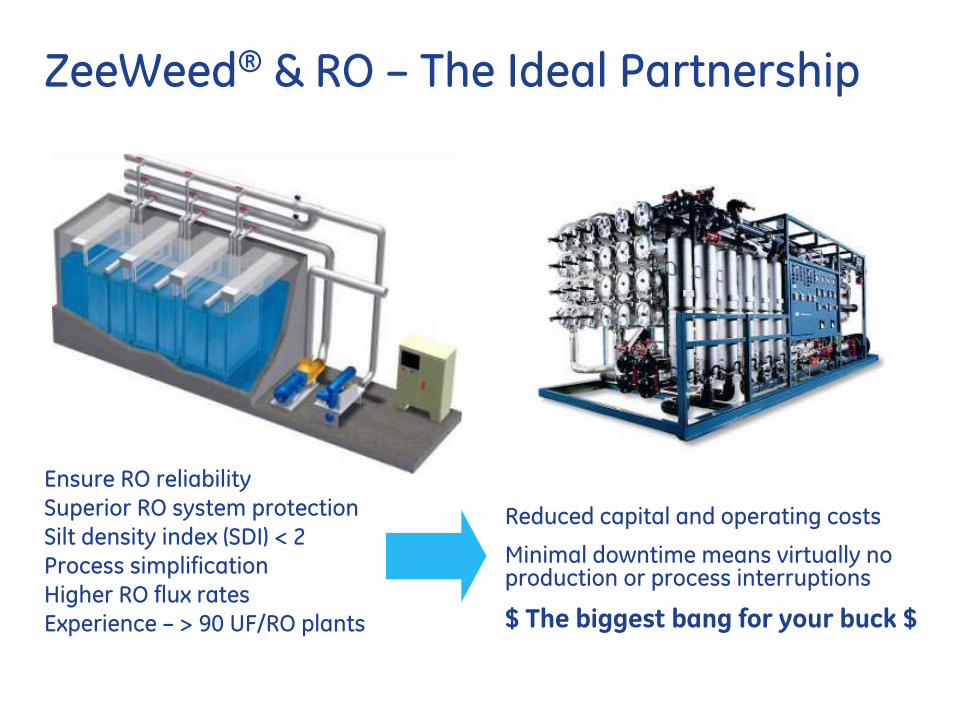
ZeeWeed® & RO – The Ideal Partnership
Ensure RO reliabilitySuperior RO system protectionSilt density index (SDI) < 2Process simplificationHigher RO flux ratesExperience – > 90 UF/RO plants
Reduced capital and operating costs
Minimal downtime means virtually no production or process interruptions
$ The biggest bang for your buck $

Addition of RO ahead of Existing Demin
Reduced acid & caustic regenerant costs– 85 – 90% reduction in regenerant usage is typical
10 to 15% more feedwater production each month
90% less high TDS regenerant waste
Extended ion exchange resin life– 40 – 50% extension in resin life typical– Much longer regen. cycles & reduced iron/organic fouling
Improved feedwater & steam quality– Sodium & silica slippage & breaks reduced
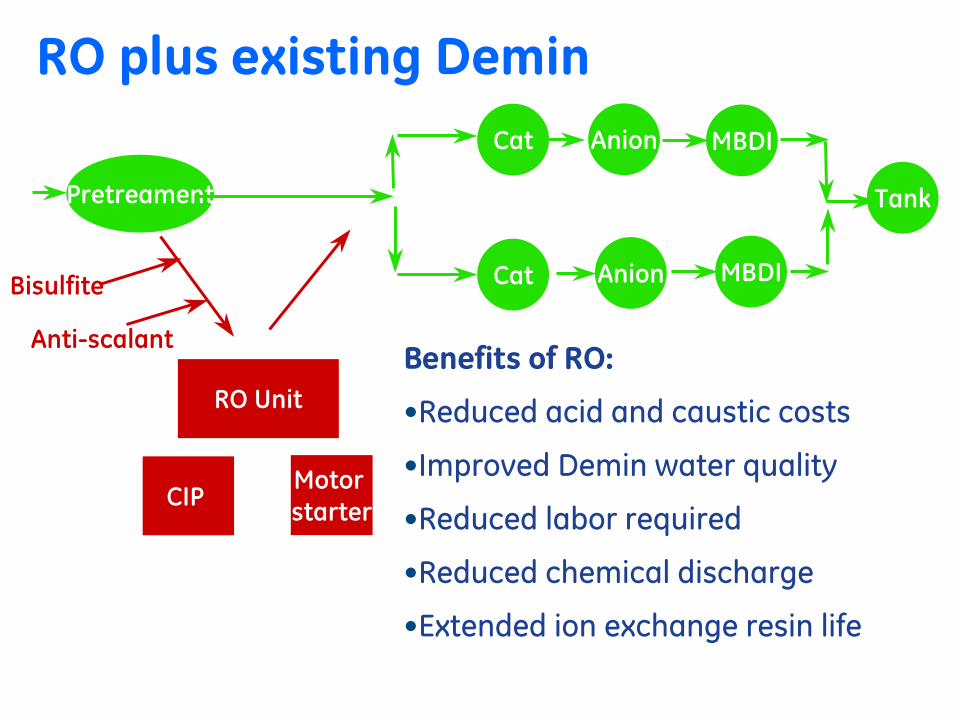
RO plus existing DeminCat
Pretreament
Cat
RO Unit
Bisulfite
Anion
Anion
MBDI
CIP
MBDI
Tank
Anti-scalant
Motor starter
Benefits of RO:
•Reduced acid and caustic costs
•Improved Demin water quality
•Reduced labor required
•Reduced chemical discharge
•Extended ion exchange resin life
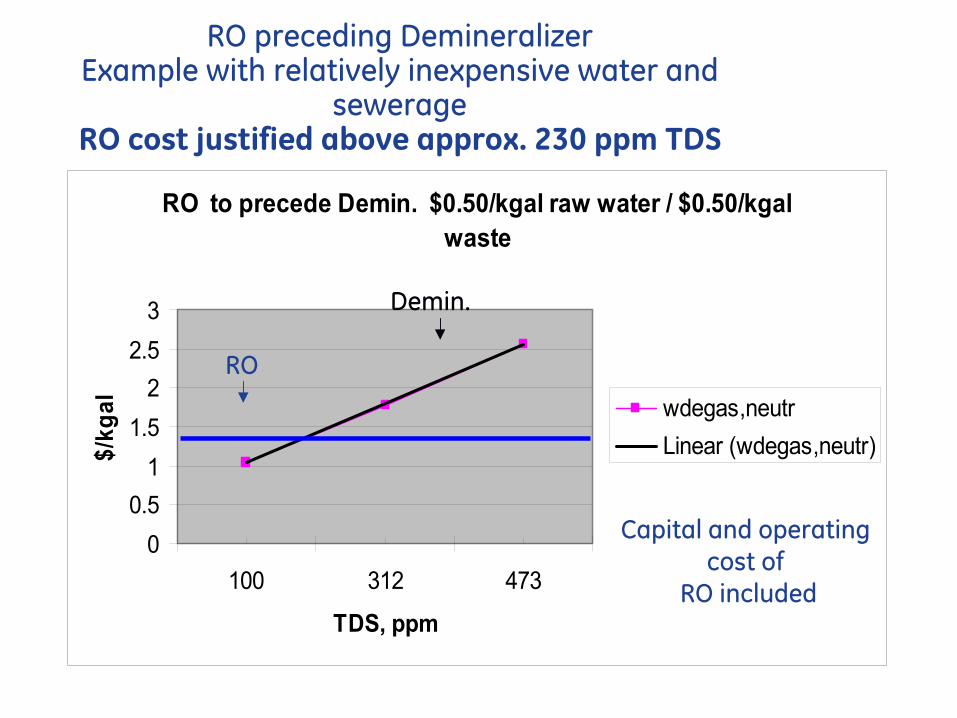
RO preceding Demineralizer Example with relatively inexpensive water and
sewerageRO cost justified above approx. 230 ppm TDS
RO to precede Demin. $0.50/kgal raw water / $0.50/kgal waste
00.5
11.5
22.5
3
100 312 473
TDS, ppm
$/kg
al wdegas,neutrLinear (wdegas,neutr)
RO
Demin.
Capital and operating cost of
RO included

Logical candidates for analysis Softener and/or Dealkalizer to RO
• Boiler cycles limited to 20 or less (5% or more blowdown) • High alkalinity and/or high silica waters - cycles limiting
or scale-forming• Steam treatment costs excessive due to high alkalinity
make-up • Steam purity is critical – turbines; steam contact with
process; clean steam generators• Amine feed is not permitted or desired• Systems without blowdown heat recovery
(or inoperable/inefficient blowdown HX)

HPI Facility with High TDS Well Water using Dealkalizer and NaZ Softener
Basis
BD BTU compared to 90F water ("free process preheat"), no BD heat recovery
$8.00 per mill BTU
85% incremental fired heater efficiency
Condensate return = 20%
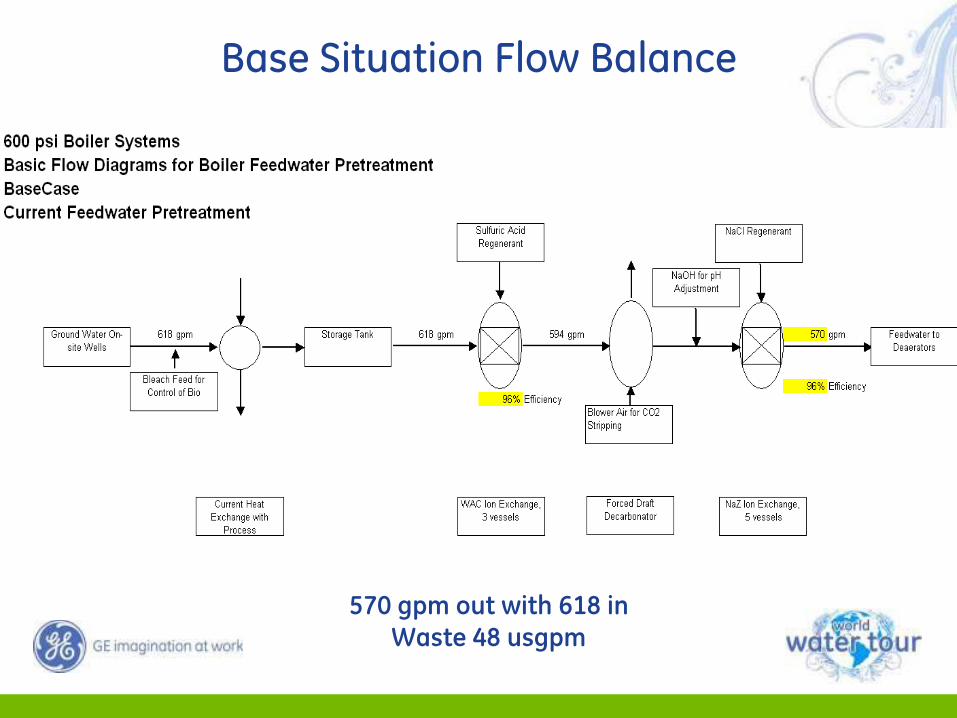
Base Situation Flow Balance
570 gpm out with 618 in Waste 48 usgpm
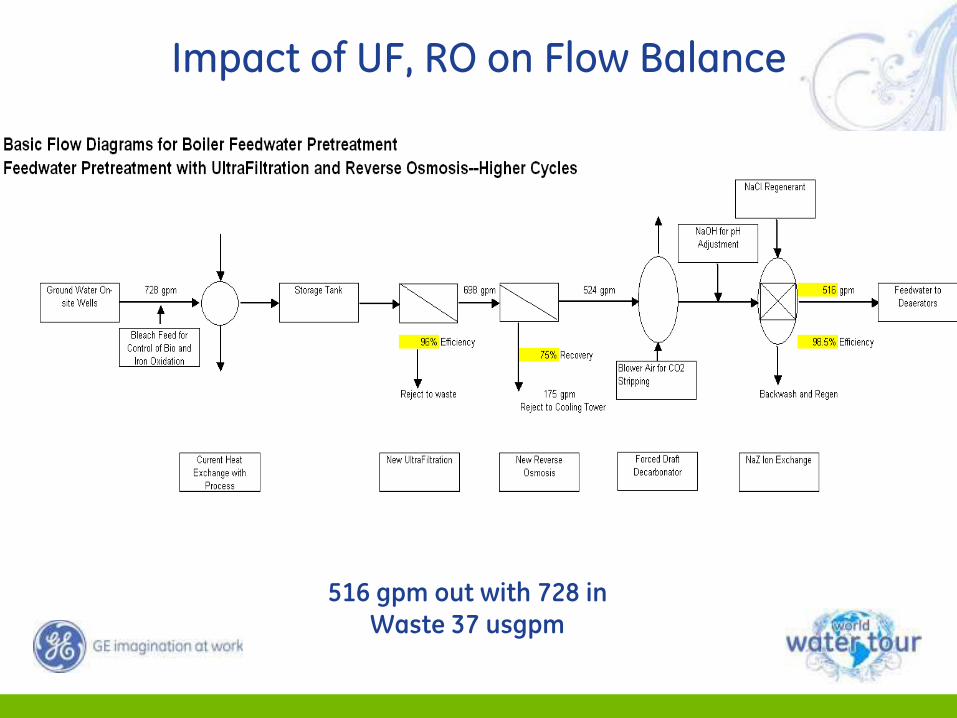
516 gpm out with 728 in Waste 37 usgpm
Impact of UF, RO on Flow Balance

• Improved steam purity> Process/Turbine
• Improved condensate corrosion control> High-alkalinity waters
• Minimizes operating and maintenance expenses> Boiler waterside and steamside failures
• Maintains optimal thermal performance> Boiler and steam heat transfer efficiency
• Reduced chemical treatment costs> Higher cycles operation – less wastage> Lower steam system treatment requirements
Conversion from Softened to RO make-up

BasisRaw water cost, $/1000 usg $0.25Sewer cost, $/1000 usg $0.25Electricity cost, $ / Kwh $0.06Fuel Cost, $/MM BTU $8.00Boiler efficiency, % 85.0%Salt $/lb $0.04Acid 100% $/lb $0.05Caustic 100% $/lb $0.24
RO to precede NaZ


Additional benefits of RO-quality make-up water to boilersImproved steam purity for process and turbomachinery
– Greatly reduced dissolved solids reduce carryover potential– Greatly reduced loading on blowdown heat recovery system
Improved boiler efficiency & reliability– Reduced potential for scale deposits– Reduced potential for boiler tube failure due to scale/overheating
Reduced corrosivity of steam to processing equipment
– Reduced carbonic acid loading and amine demand– Reduced carryover potential from alkalinity

Presented by
GE Water & Process Technologies
Economic Models
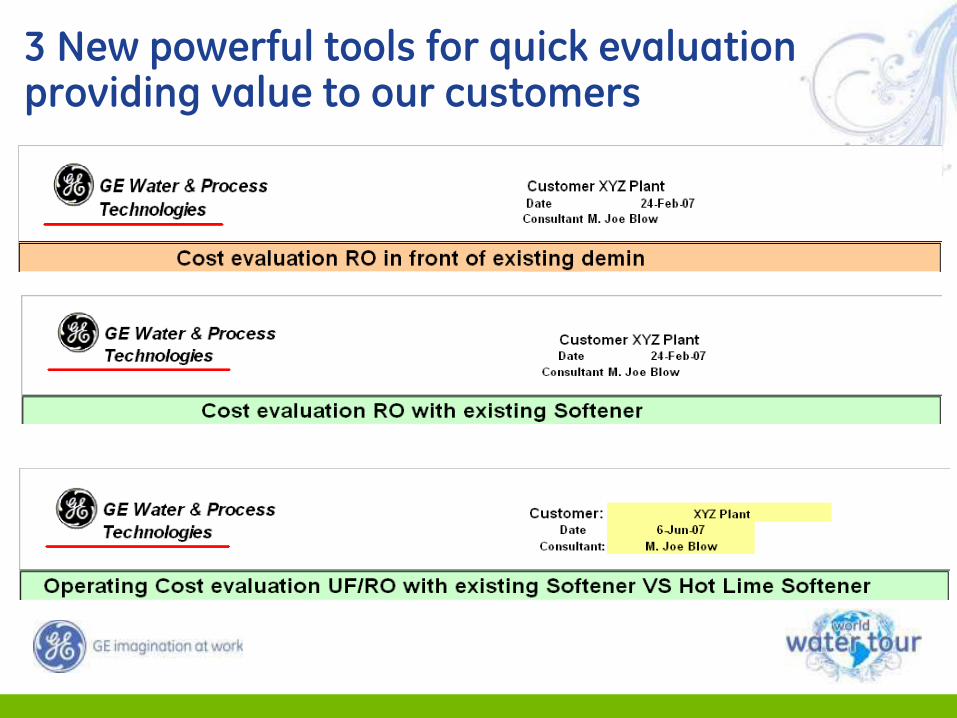
3 New powerful tools for quick evaluationproviding value to our customers
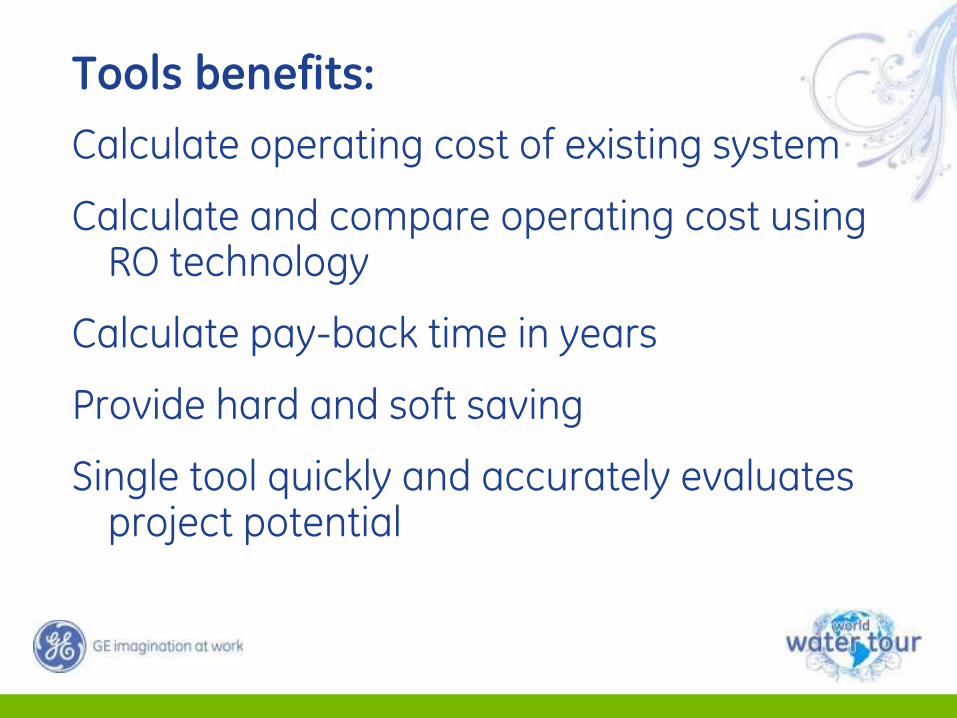
Tools benefits:Calculate operating cost of existing system
Calculate and compare operating cost using RO technology
Calculate pay-back time in years
Provide hard and soft saving
Single tool quickly and accurately evaluates project potential
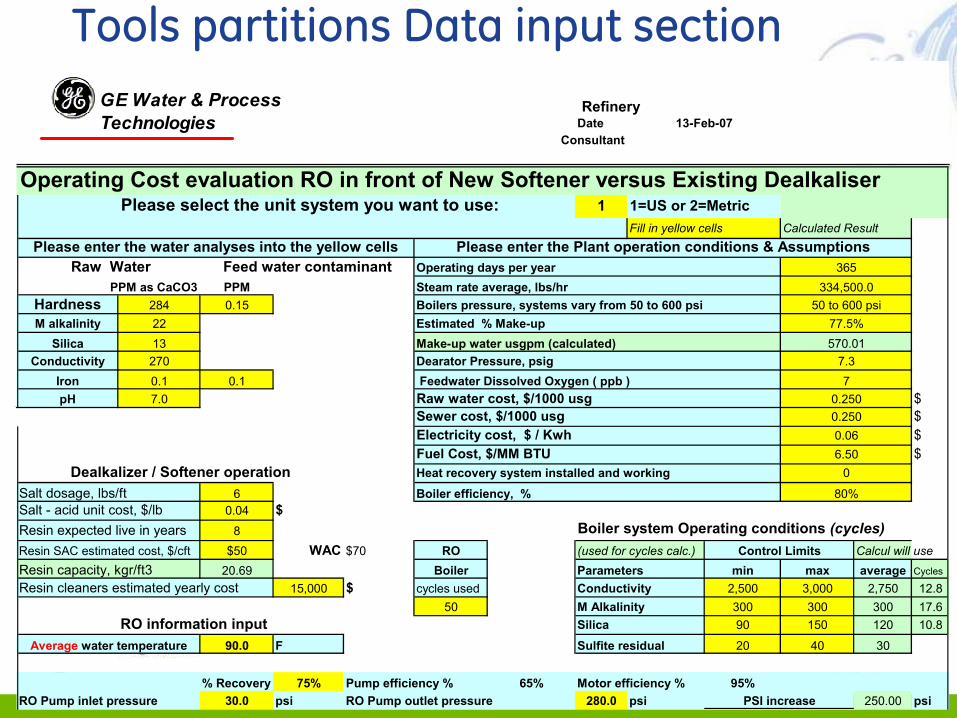
Tools partitions Data input section RefineryDate
Consultant
Operating Cost evaluation RO in front of New Softener versus Existing DealkaliserPlease select the unit system you want to use: 1 1=US or 2=Metric
Fill in yellow cells Calculated Result
PPMHardness 284 0.15M alkalinity 22
Silica 13Conductivity 270 Dearator Pressure, psig
Iron 0.1 0.1pH 7.0 Raw water cost, $/1000 usg $
Sewer cost, $/1000 usg $Electricity cost, $ / Kwh $Fuel Cost, $/MM BTU $Heat recovery system installed and working
6 Boiler efficiency, %0.04 $
8 Boiler system Operating conditions (cycles)$50 WAC $70 RO (used for cycles calc.) Calcul will use
20.69 Boiler Parameters min max average Cycles
15,000 $ cycles used Conductivity 2,500 3,000 2,750 12.850 M Alkalinity 300 300 300 17.6
RO information input Silica 90 150 120 10.8
90.0 F Sulfite residual 20 40 30
% Recovery 75% Pump efficiency % 65% Motor efficiency % 95%RO Pump inlet pressure 30.0 psi RO Pump outlet pressure 280.0 psi 250.00 psi
0.2500.06
7.3
Estimated % Make-up
Average water temperature
Resin cleaners estimated yearly cost
Dealkalizer / Softener operation
50 to 600 psi77.5%570.01
70.250
Operating days per year 365Steam rate average, lbs/hr
Feed water contaminant334,500.0PPM as CaCO3
Boilers pressure, systems vary from 50 to 600 psi
6.500
80%
PSI increase
13-Feb-07
Resin SAC estimated cost, $/cftResin capacity, kgr/ft3
Make-up water usgpm (calculated)
Salt dosage, lbs/ft
Feedwater Dissolved Oxygen ( ppb )
Control Limits
Raw WaterPlease enter the Plant operation conditions & AssumptionsPlease enter the water analyses into the yellow cells
Salt - acid unit cost, $/lbResin expected live in years
GE Water & ProcessTechnologies
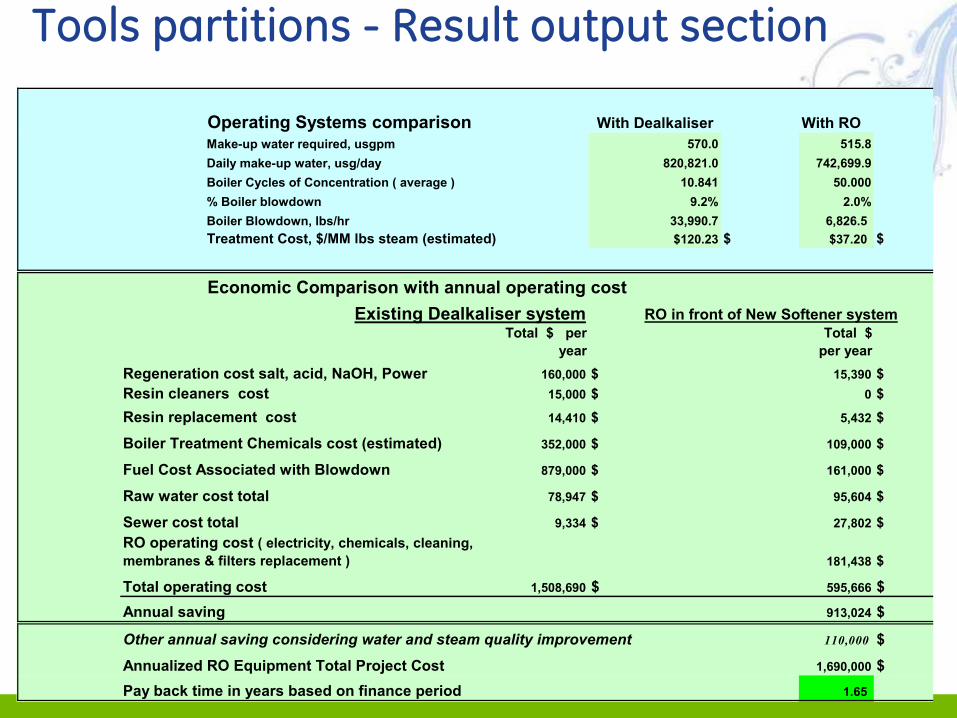
Tools partitions - Result output section
Operating Systems comparison With ROMake-up water required, usgpm 515.8Daily make-up water, usg/day 742,699.9Boiler Cycles of Concentration ( average ) 50.000% Boiler blowdown 2.0%Boiler Blowdown, lbs/hr 6,826.5 Treatment Cost, $/MM lbs steam (estimated) $ $37.20 $
Economic Comparison with annual operating costExisting Dealkaliser system RO in front of New Softener system
Total $ per year
Total $ per year
Regeneration cost salt, acid, NaOH, Power 160,000 $ 15,390 $Resin cleaners cost 15,000 $ 0 $Resin replacement cost 14,410 $ 5,432 $
Boiler Treatment Chemicals cost (estimated) 352,000 $ 109,000 $
Fuel Cost Associated with Blowdown 879,000 $ 161,000 $
Raw water cost total 78,947 $ 95,604 $
Sewer cost total 9,334 $ 27,802 $
181,438 $
Total operating cost 1,508,690 $ 595,666 $Annual saving 913,024 $
Other annual saving considering water and steam quality improvement 110,000 $
Annualized RO Equipment Total Project Cost 1,690,000 $Pay back time in years based on finance period 1.65
10.841
RO operating cost ( electricity, chemicals, cleaning, membranes & filters replacement )
820,821.0570.0
33,990.7$120.23
With Dealkaliser
9.2%
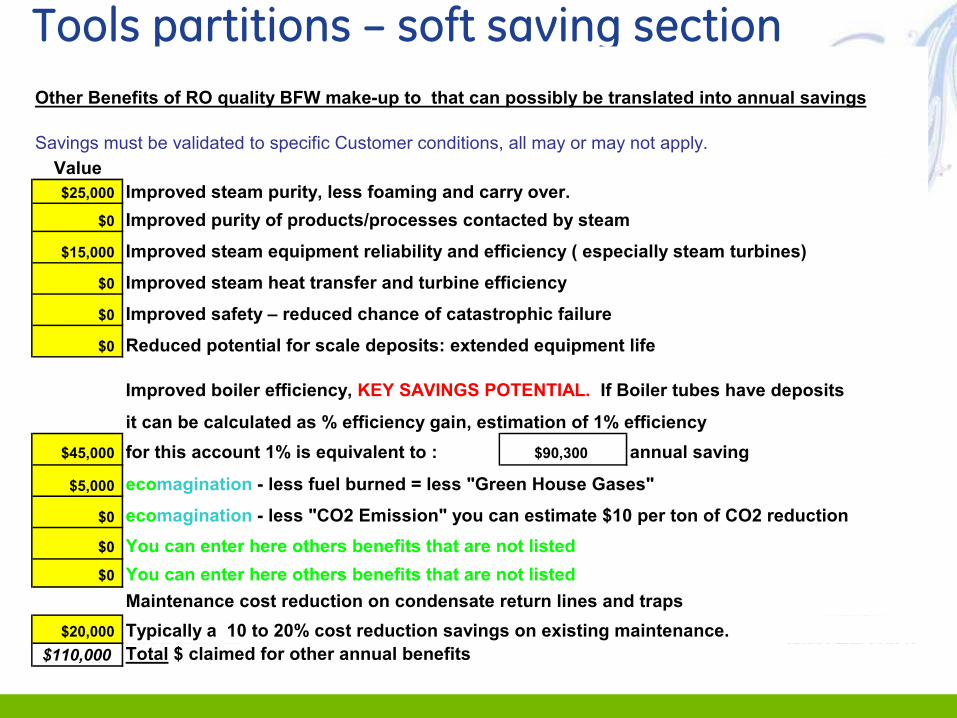
Tools partitions – soft saving sectionOther Benefits of RO quality BFW make-up to that can possibly be translated into annual savings
Savings must be validated to specific Customer conditions, all may or may not apply. Value$25,000 Improved steam purity, less foaming and carry over.
$0 Improved purity of products/processes contacted by steam
$15,000 Improved steam equipment reliability and efficiency ( especially steam turbines)
$0 Improved steam heat transfer and turbine efficiency
$0 Improved safety – reduced chance of catastrophic failure
$0 Reduced potential for scale deposits: extended equipment life
Improved boiler efficiency, KEY SAVINGS POTENTIAL. If Boiler tubes have deposits
it can be calculated as % efficiency gain, estimation of 1% efficiency$45,000 for this account 1% is equivalent to : $90,300 annual saving
$5,000 ecomagination - less fuel burned = less "Green House Gases"
$0 ecomagination - less "CO2 Emission" you can estimate $10 per ton of CO2 reduction$0 You can enter here others benefits that are not listed$0 You can enter here others benefits that are not listed
Maintenance cost reduction on condensate return lines and traps$20,000 Typically a 10 to 20% cost reduction savings on existing maintenance.
$110,000 Total $ claimed for other annual benefits

3 New powerful tools for quick evaluationproviding value to our customers
Summary
Membrane systems can save you money and potentially water for utility applications
New systems are predominately moving to an all-membrane approach
The green approach!!