MEASURING THE CONTRIBUTION OF THE INFORMAL SECTOR … · MEASURING THE CONTRIBUTION OF THE INFORMAL...
29
MEASURING THE CONTRIBUTION OF THE INFORMAL SECTOR (IS) TO THE TOTAL ECONOMY Meeting on Implementation of the 2008 SNA Group of Experts on National Accounts Geneva 30 April - 04 May 2012 Third module: Expert Group on National Accounts (2-4 May 2012) Item 5. Household sector and unincorporated enterprises ՀԱՅԱՍՏԱՆԻ ՀԱՅԱՍՏԱՆԻ ՀԱՅԱՍՏԱՆԻ ՀԱՅԱՍՏԱՆԻ ԱԶԳԱՅԻՆ ԱԶԳԱՅԻՆ ԱԶԳԱՅԻՆ ԱԶԳԱՅԻՆ ՎԻՃԱԿԱԳՐԱԿԱՆ ՎԻՃԱԿԱԳՐԱԿԱՆ ՎԻՃԱԿԱԳՐԱԿԱՆ ՎԻՃԱԿԱԳՐԱԿԱՆ ԾԱՌԱՅՈՒԹՅՈՒՆ ԾԱՌԱՅՈՒԹՅՈՒՆ ԾԱՌԱՅՈՒԹՅՈՒՆ ԾԱՌԱՅՈՒԹՅՈՒՆ NATIONAL STATISTICAL SERVICE OF ARMENIA
Transcript of MEASURING THE CONTRIBUTION OF THE INFORMAL SECTOR … · MEASURING THE CONTRIBUTION OF THE INFORMAL...
MEASURING THE CONTRIBUTION OF THE INFORMAL SECTOR ( IS) TO THE TOTAL ECONOMY
Meeting on Implementation of the 2008 SNA Group of Experts on National Accounts
Geneva 30 April - 04 May 2012 Third module: Expert Group on National Accounts (2- 4 May 2012)
Item 5. Household sector and unincorporated enterpr ises
ՀԱՅԱՍՏԱՆԻՀԱՅԱՍՏԱՆԻՀԱՅԱՍՏԱՆԻՀԱՅԱՍՏԱՆԻ ԱԶԳԱՅԻՆԱԶԳԱՅԻՆԱԶԳԱՅԻՆԱԶԳԱՅԻՆ ՎԻՃԱԿԱԳՐԱԿԱՆՎԻՃԱԿԱԳՐԱԿԱՆՎԻՃԱԿԱԳՐԱԿԱՆՎԻՃԱԿԱԳՐԱԿԱՆԾԱՌԱՅՈՒԹՅՈՒՆԾԱՌԱՅՈՒԹՅՈՒՆԾԱՌԱՅՈՒԹՅՈՒՆԾԱՌԱՅՈՒԹՅՈՒՆ
NATIONAL STATISTICAL SERVICE OF ARMENIA
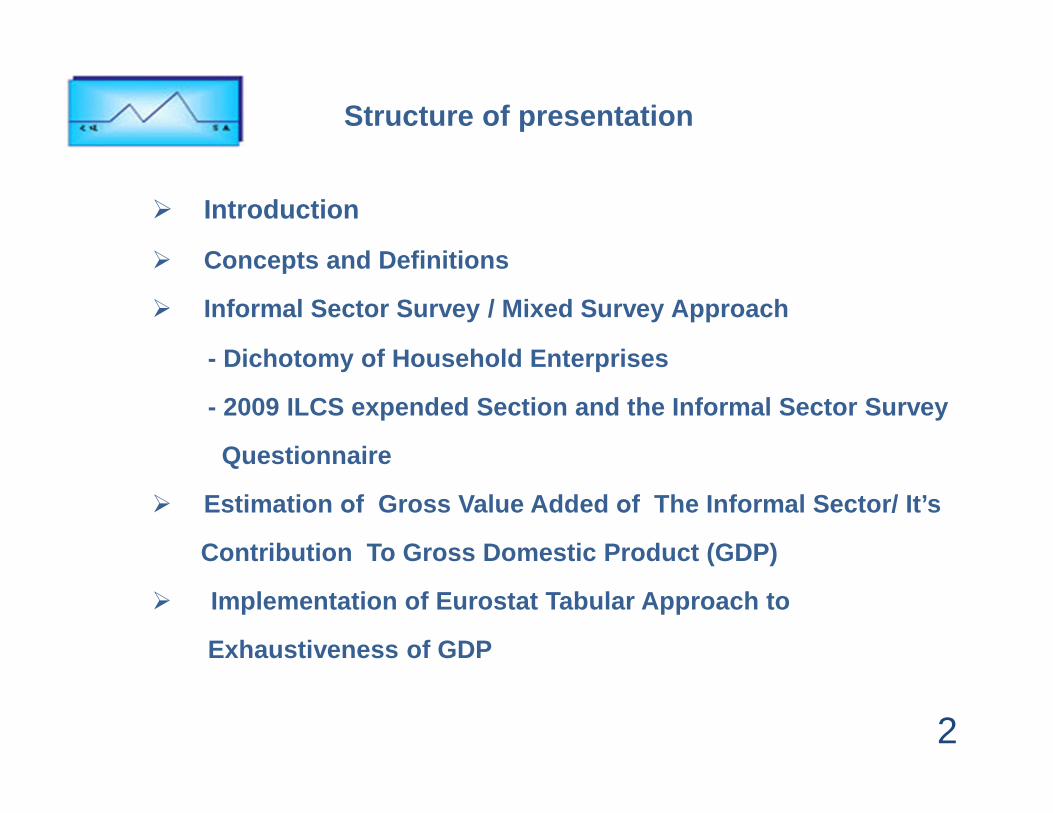
Structure of presentation
� Introduction
� Concepts and Definitions
� Informal Sector Survey / Mixed Survey Approach
- Dichotomy of Household Enterprises
- 2009 ILCS expended Section and the Informal Sector Survey
Questionnaire
� Estimation оf Gross Value Added оf The Informal Sector/ It’s
Contribution To Gross Domestic Product (GDP)
� Implementation of Eurostat Tabular Approach to
Exhaustiveness of GDP
2
The National Statistical Service of the Republic of Armenia (NSSRA) applied the mixed survey through the Asian Developm ent Bank’s (ADB) Regional Technical Assistance (RETA) 6430: Me asuring the Informal Sector.
The mixed survey approach that was implemented in 2 009 has two phases: the first phase is the expanded Labor and E mployment module of the Integrated Living Conditions Survey (ILCS), while the second phase is the Informal Sector Survey (ISS).
The survey period coincided with the financial and economic crisis that affected Armenia’s economy starting in October –November 2008. As a response, the Government of the Republic of Ar menia drafted an anti-crisis program, which involved simplification of all types of businesses, including small and medium -sized enterprises, and the new tax procedures. Those factors have been affecti ng economic units implementing informal activity.
INTRODUCTION
3
4
CONCEPTS AND DEFINITIONS
The revised 2008 System of National Accounts (SNA) Chapter 25: Informal Aspects of the EconomyOECD handbook: Measuring the Non-observed Economy
ILO Definition of ISThe 15th ICLS defines the IS in terms of characteri stics of theenterprises (producing unit) in which the activitie s take place; asubset of household unincorporated enterprises.
IS According to the Delhi Group (Expert Group on IS set up by UNSD):
Legal organization (unincorporated enterprises)No complete set of accountsWith at least some market outputEmployment size (less than 5)
5
CONCEPTS AND DEFINITIONS
Employment in the IS includes all jobs in the IS enterprises or all persons who, during a given reference period, were employed in at least one IS enterprise, irrespective of their s tatus of employment or whether it was their main or secondary job.
Informal employment comprises the total number of informal jobs characterized by absence of contracts, social prote ction, or entitlement to certain employment benefits (advance notice of dismissal, severances of pay, paid annual or sick l eave, etc).
6
Informal Sector Survey / Mixed Survey Approach
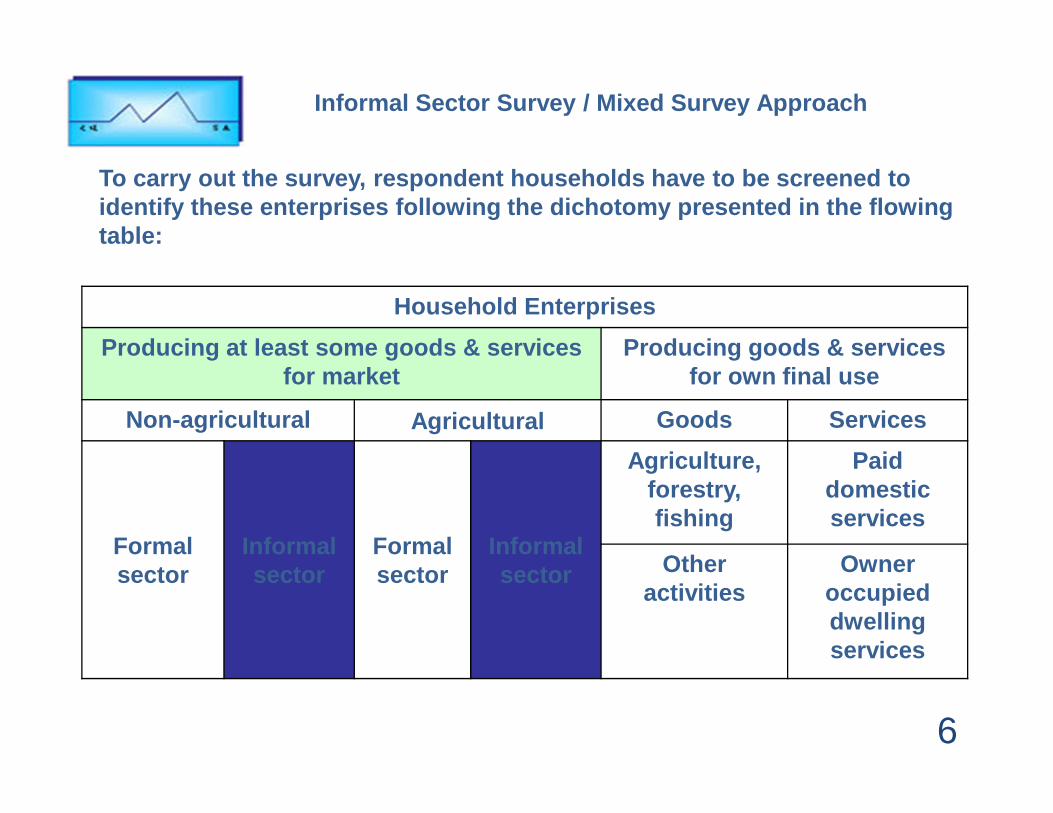
To carry out the survey, respondent households have to be screened to identify these enterprises following the dichotomy presented in the flowing table:
Household Enterprises
Producing at least some goods & services for market
Producing goods & services for own final use
Non-agricultural Agricultural Goods Services
Formal sector
Informal sector
Formal sector
Informal sector
Agriculture, forestry, fishing
Paid domestic services
Other activities
Owner occupied dwelling services
7
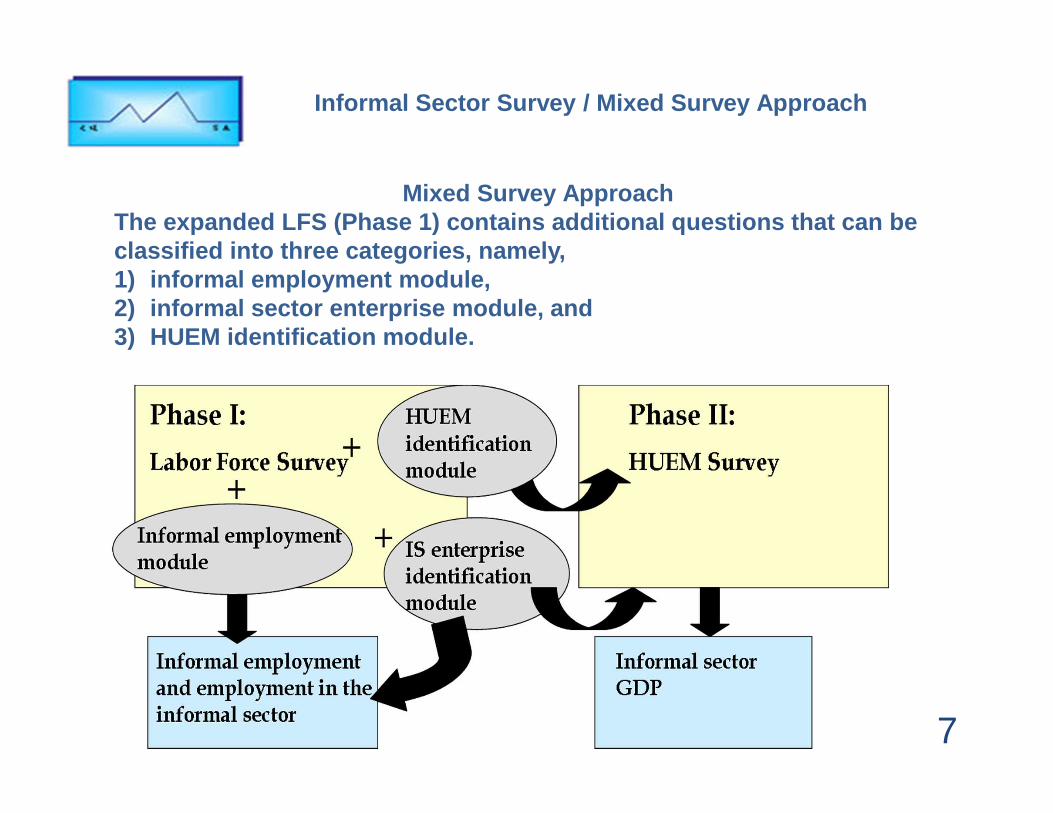
Informal Sector Survey / Mixed Survey Approach
Mixed Survey ApproachThe expanded LFS (Phase 1) contains additional ques tions that can beclassified into three categories, namely, 1) informal employment module, 2) informal sector enterprise module, and 3) HUEM identification module.
8
Informal Sector Survey / Mixed Survey Approach
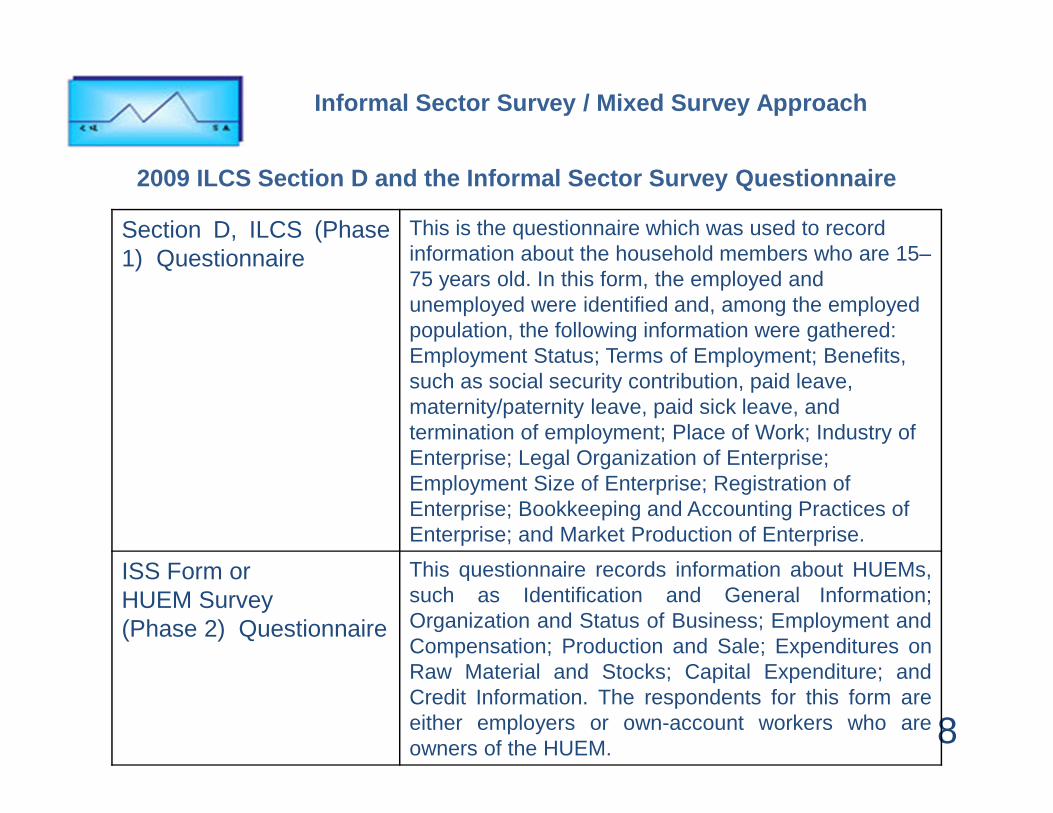
Section D, ILCS (Phase1) Questionnaire
This is the questionnaire which was used to record information about the household members who are 15–75 years old. In this form, the employed and unemployed were identified and, among the employed population, the following information were gathered: Employment Status; Terms of Employment; Benefits, such as social security contribution, paid leave, maternity/paternity leave, paid sick leave, and termination of employment; Place of Work; Industry of Enterprise; Legal Organization of Enterprise; Employment Size of Enterprise; Registration of Enterprise; Bookkeeping and Accounting Practices of Enterprise; and Market Production of Enterprise.
ISS Form orHUEM Survey(Phase 2) Questionnaire
This questionnaire records information about HUEMs,such as Identification and General Information;Organization and Status of Business; Employment andCompensation; Production and Sale; Expenditures onRaw Material and Stocks; Capital Expenditure; andCredit Information. The respondents for this form areeither employers or own-account workers who areowners of the HUEM.
2009 ILCS Section D and the Informal Sector Survey Questionnaire
Estimation оf Gross Value Added оf The Informal Sector / It’s Contribution To Gross Domestic
Product
9
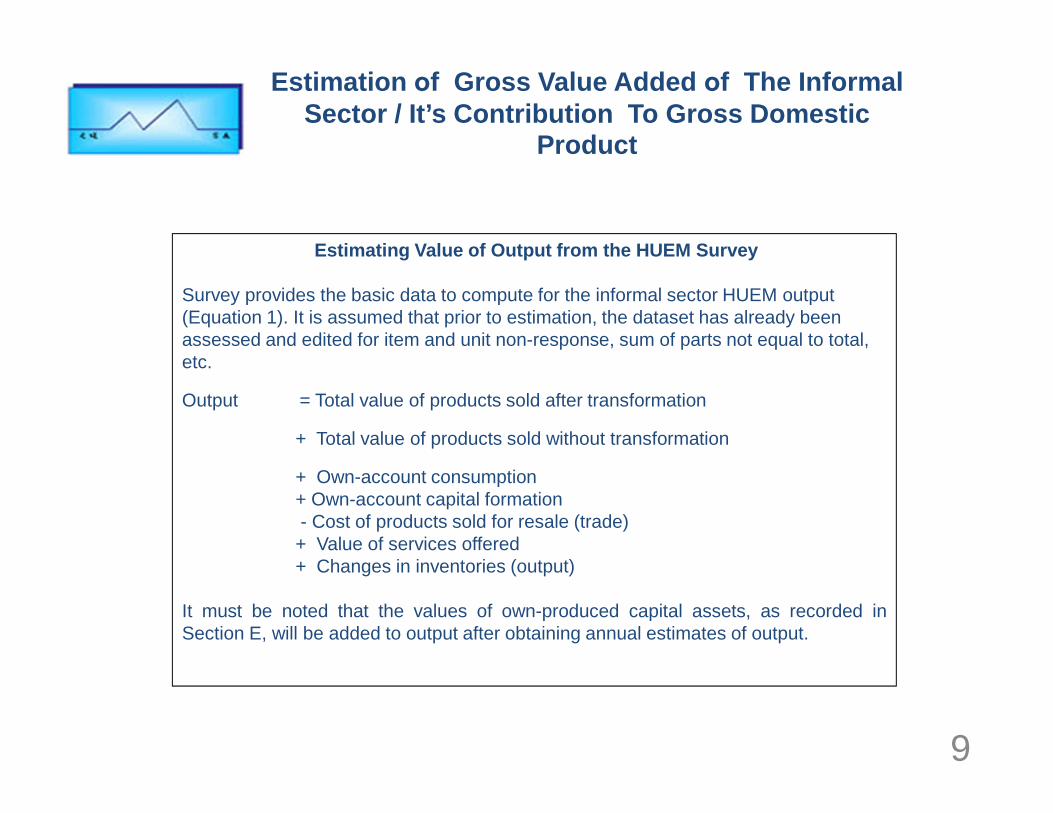
Estimating Value of Output from the HUEM Survey
Survey provides the basic data to compute for the informal sector HUEM output (Equation 1). It is assumed that prior to estimation, the dataset has already been assessed and edited for item and unit non-response, sum of parts not equal to total, etc.
Output = Total value of products sold after transformation
+ Total value of products sold without transformation
+ Own-account consumption+ Own-account capital formation- Cost of products sold for resale (trade)+ Value of services offered+ Changes in inventories (output)
It must be noted that the values of own-produced capital assets, as recorded inSection E, will be added to output after obtaining annual estimates of output.
Estimation оf Gross Value Added оf The Informal Sector / It’s Contribution To Gross Domestic
Product
10
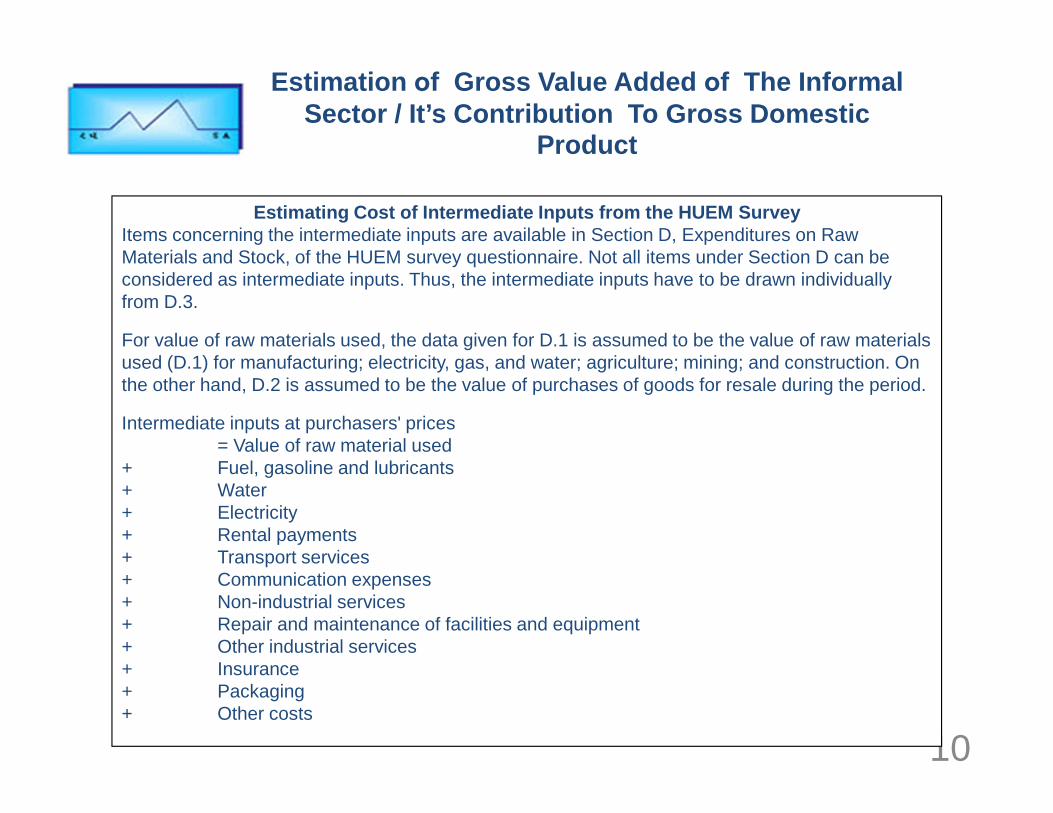
Estimating Cost of Intermediate Inputs from the HUE M SurveyItems concerning the intermediate inputs are available in Section D, Expenditures on Raw Materials and Stock, of the HUEM survey questionnaire. Not all items under Section D can be considered as intermediate inputs. Thus, the intermediate inputs have to be drawn individually from D.3.
For value of raw materials used, the data given for D.1 is assumed to be the value of raw materials used (D.1) for manufacturing; electricity, gas, and water; agriculture; mining; and construction. On the other hand, D.2 is assumed to be the value of purchases of goods for resale during the period.
Intermediate inputs at purchasers' prices = Value of raw material used
+ Fuel, gasoline and lubricants+ Water+ Electricity+ Rental payments+ Transport services+ Communication expenses+ Non-industrial services+ Repair and maintenance of facilities and equipment+ Other industrial services+ Insurance+ Packaging+ Other costs

Estimation оf Gross Value Added оf The Informal Sector / It’s Contribution To Gross Domestic
Product
11
Income Approach
The income approach adds up all incomes paid in the process of production. In general, the income measure of gross domestic product (GDP) is computed as the sum of compensation of emp loyees, indirect taxes net of subsidies (i.e., taxes on production a nd imports), and operating surplus.
Adjustments
Some sectors in Armenia are not well-represented in the ISS.
Taking into account lack of data received for some sectors, otherdata sources and assumptions were used to estimate IS GVA.1. Fishing
• Data from Household survey were used. • Expenditure of households on fresh fish outside for mal
trade (shops)• Taking into account period of year when fishing is allowed
Estimation оf Gross Value Added оf The Informal Sector / It’s Contribution To Gross Domestic
Product
12
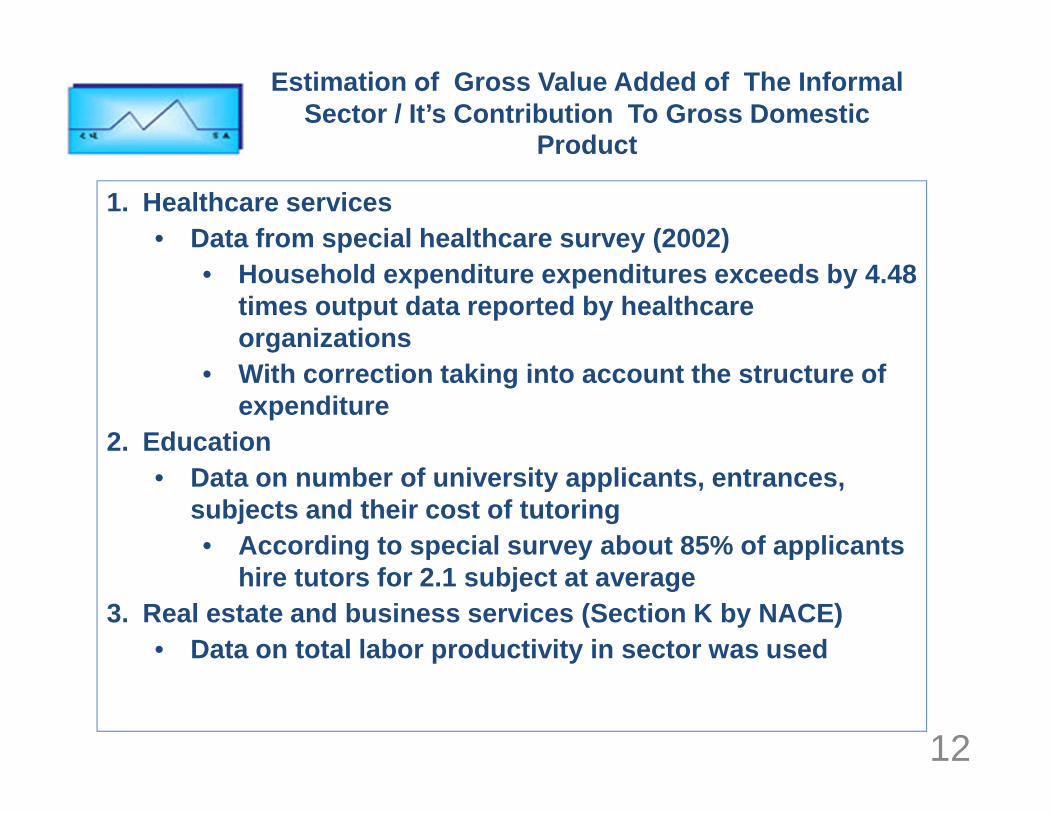
1. Healthcare services• Data from special healthcare survey (2002)
• Household expenditure expenditures exceeds by 4.48 times output data reported by healthcare organizations
• With correction taking into account the structure o f expenditure
2. Education• Data on number of university applicants, entrances,
subjects and their cost of tutoring• According to special survey about 85% of applicants
hire tutors for 2.1 subject at average3. Real estate and business services (Section K by N ACE)
• Data on total labor productivity in sector was used
Estimation оf Gross Value Added оf The Informal Sector / It’s Contribution To Gross Domestic
Product
13
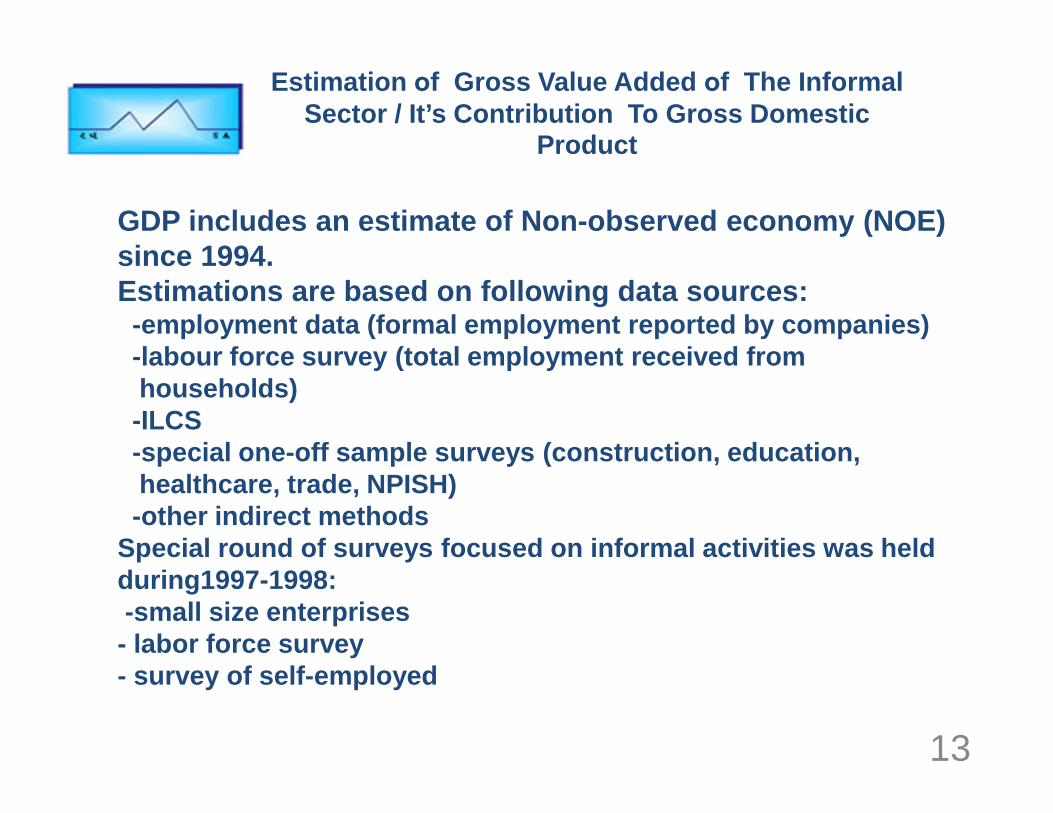
GDP includes an estimate of Non-observed economy (N OE) since 1994. Estimations are based on following data sources:-employment data (formal employment reported by com panies)-labour force survey (total employment received fro mhouseholds)-ILCS -special one-off sample surveys (construction, educ ation,healthcare, trade, NPISH) -other indirect methods
Special round of surveys focused on informal activi ties was held during1997-1998: -small size enterprises- labor force survey - survey of self-employed
Estimation оf Gross Value Added оf The Informal Sector / It’s Contribution To Gross Domestic
Product
14
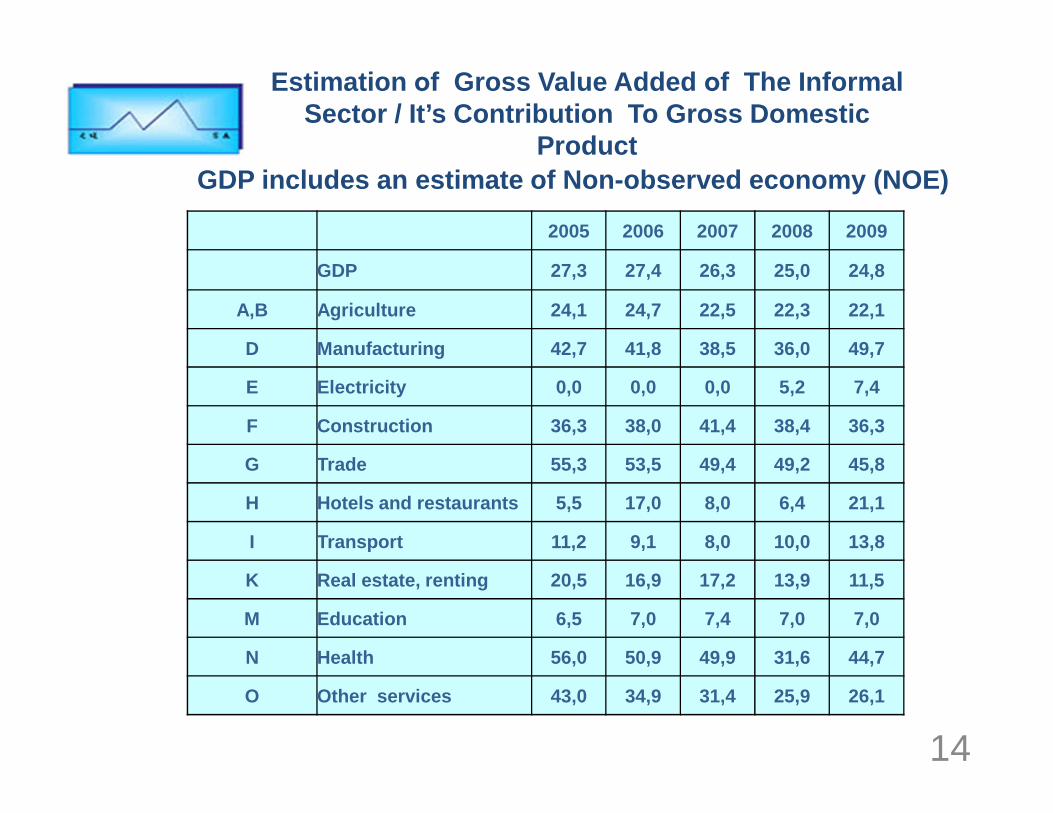
2005 2006 2007 2008 2009
GDP 27,3 27,4 26,3 25,0 24,8
A,B Agriculture 24,1 24,7 22,5 22,3 22,1
D Manufacturing 42,7 41,8 38,5 36,0 49,7
E Electricity 0,0 0,0 0,0 5,2 7,4
F Construction 36,3 38,0 41,4 38,4 36,3
G Trade 55,3 53,5 49,4 49,2 45,8
H Hotels and restaurants 5,5 17,0 8,0 6,4 21,1
I Transport 11,2 9,1 8,0 10,0 13,8
K Real estate, renting 20,5 16,9 17,2 13,9 11,5
M Education 6,5 7,0 7,4 7,0 7,0
N Health 56,0 50,9 49,9 31,6 44,7
O Other services 43,0 34,9 31,4 25,9 26,1
GDP includes an estimate of Non-observed economy (N OE)
15
Estimation оf Gross Value Added оf The Informal Sector / It’s Contribution To Gross Domestic
Product
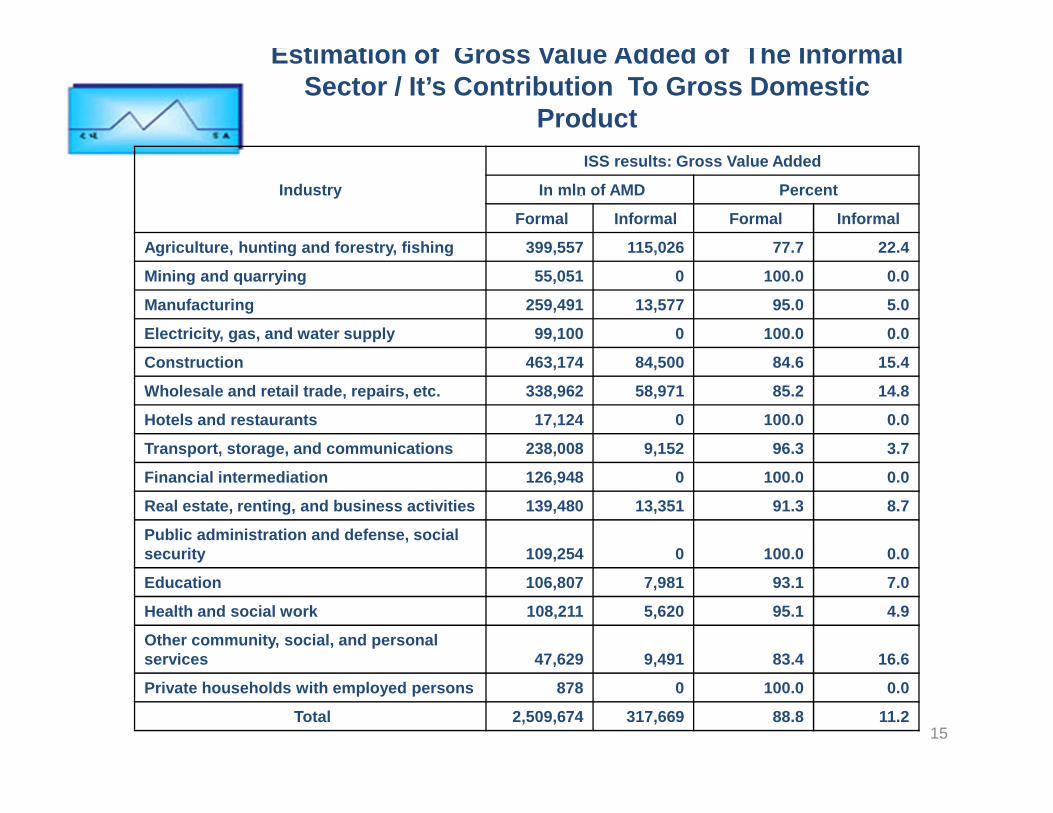
Industry
ISS results: Gross Value Added
In mln of AMD Percent
Formal Informal Formal Informal
Agriculture, hunting and forestry, fishing 399,557 1 15,026 77.7 22.4
Mining and quarrying 55,051 0 100.0 0.0
Manufacturing 259,491 13,577 95.0 5.0
Electricity, gas, and water supply 99,100 0 100.0 0.0
Construction 463,174 84,500 84.6 15.4
Wholesale and retail trade, repairs, etc. 338,962 58 ,971 85.2 14.8
Hotels and restaurants 17,124 0 100.0 0.0
Transport, storage, and communications 238,008 9,152 96.3 3.7
Financial intermediation 126,948 0 100.0 0.0
Real estate, renting, and business activities 139,4 80 13,351 91.3 8.7
Public administration and defense, social security 109,254 0 100.0 0.0
Education 106,807 7,981 93.1 7.0
Health and social work 108,211 5,620 95.1 4.9
Other community, social, and personal services 47,629 9,491 83.4 16.6
Private households with employed persons 878 0 100.0 0 .0
Total 2,509,674 317,669 88.8 11.2
16
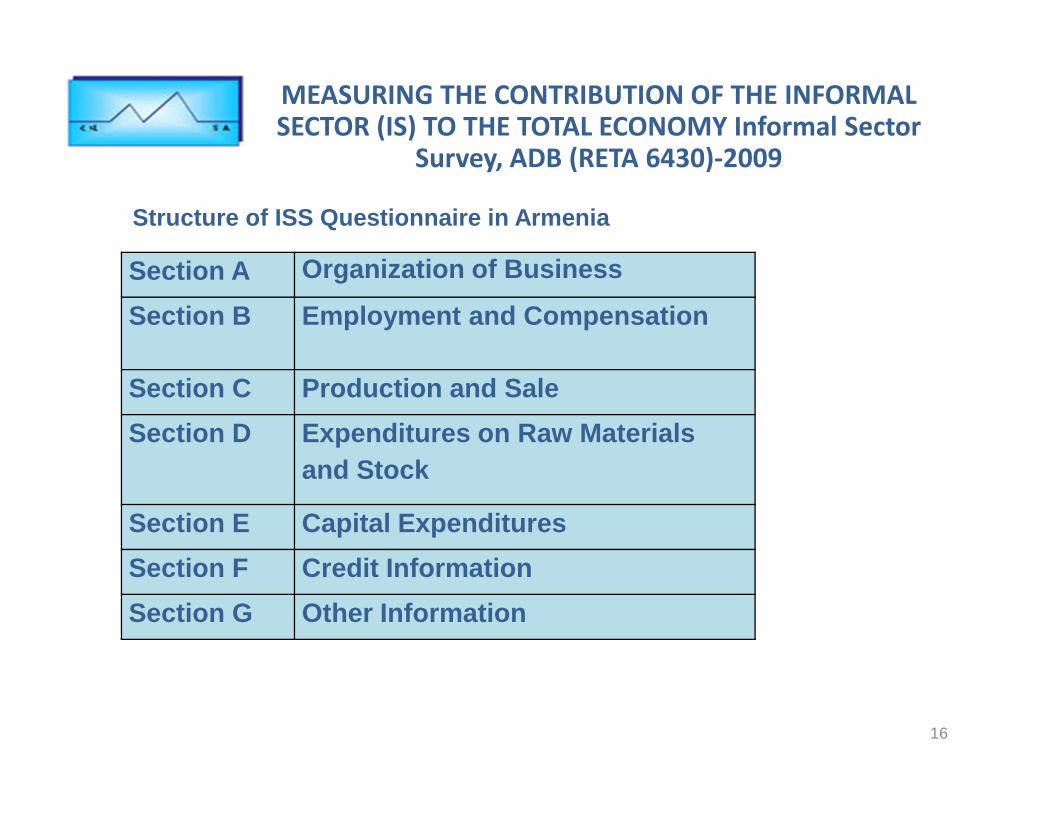
Structure of ISS Questionnaire in Armenia
MEASURING THE CONTRIBUTION OF THE INFORMAL SECTOR (IS) TO THE TOTAL ECONOMY Informal Sector
Survey, ADB (RETA 6430)-2009
Section A Organization of Business
Section B Employment and Compensation
Section C Production and Sale
Section D Expenditures on Raw Materials and Stock
Section E Capital Expenditures
Section F Credit Information
Section G Other Information
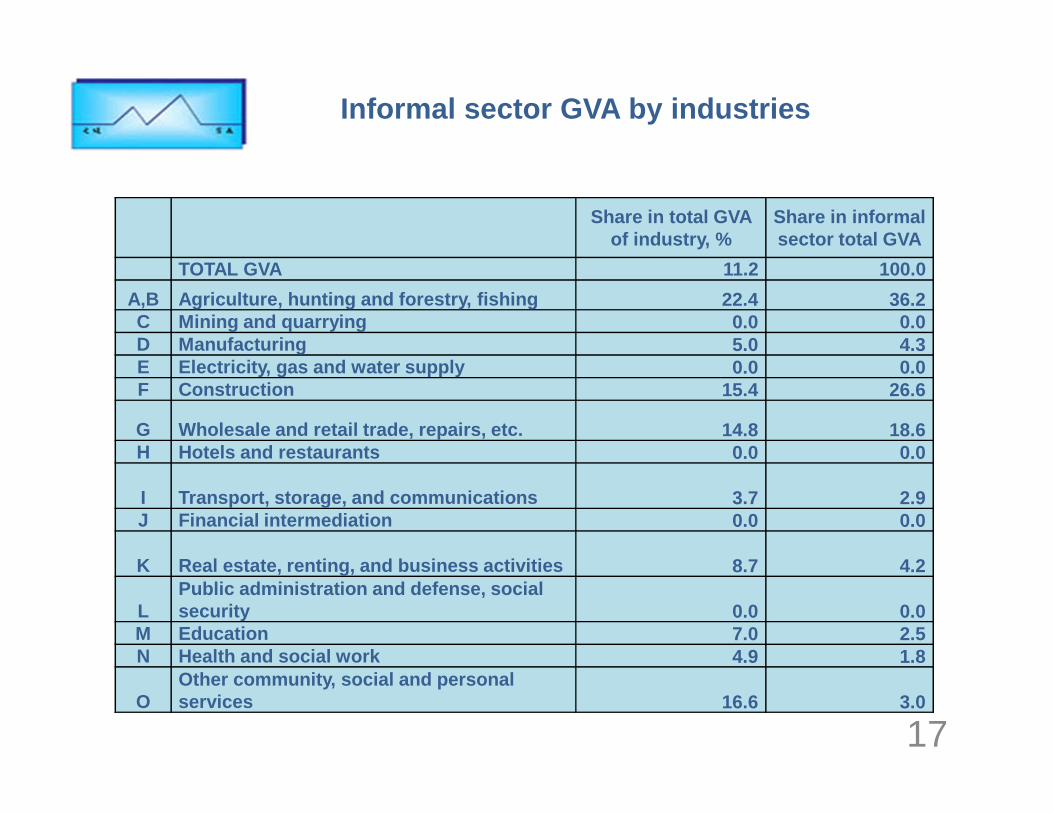
Informal sector GVA by industries
17
Share in total GVA of industry, %
Share in informal sector total GVA
TOTAL GVA 11.2 100.0
A,B Agriculture, hunting and forestry, fishing 22.4 36.2C Mining and quarrying 0.0 0.0D Manufacturing 5.0 4.3E Electricity, gas and water supply 0.0 0.0F Construction 15.4 26.6
G Wholesale and retail trade, repairs, etc. 14.8 18.6H Hotels and restaurants 0.0 0.0
I Transport, storage, and communications 3.7 2.9J Financial intermediation 0.0 0.0
K Real estate, renting, and business activities 8.7 4.2
LPublic administration and defense, social security 0.0 0.0
M Education 7.0 2.5N Health and social work 4.9 1.8
OOther community, social and personal services 16.6 3.0
18
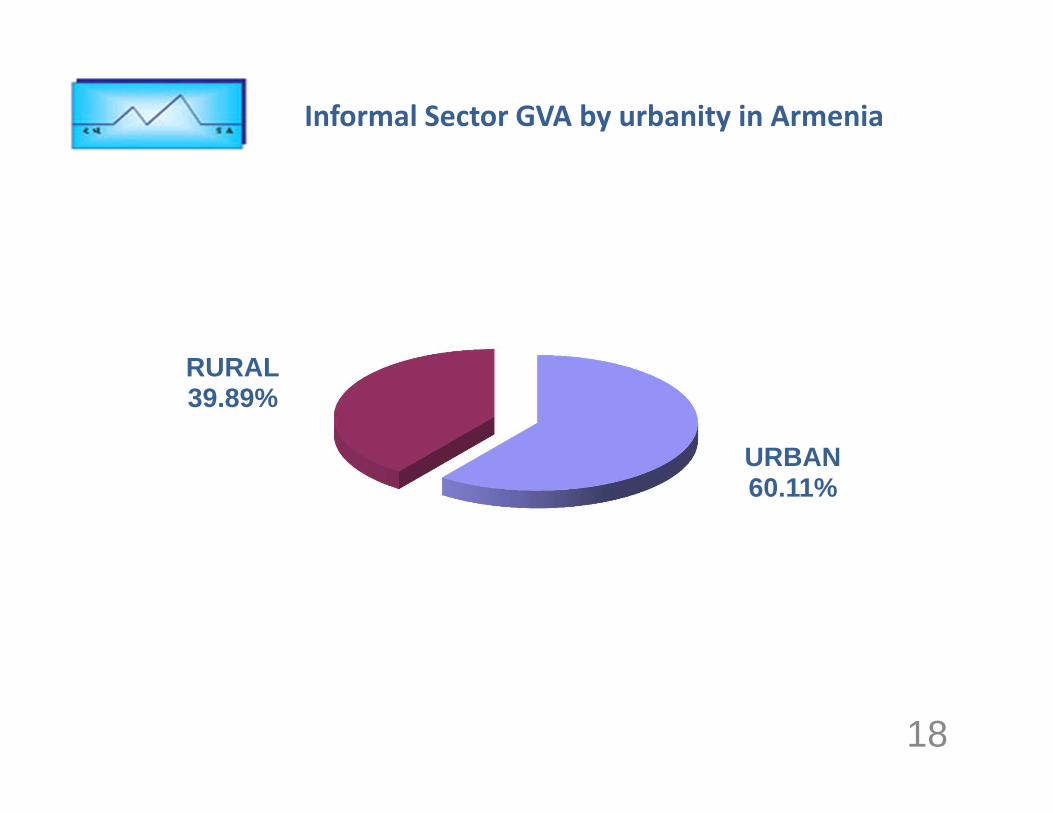
URBAN60.11%
RURAL39.89%
Informal Sector GVA by urbanity in Armenia
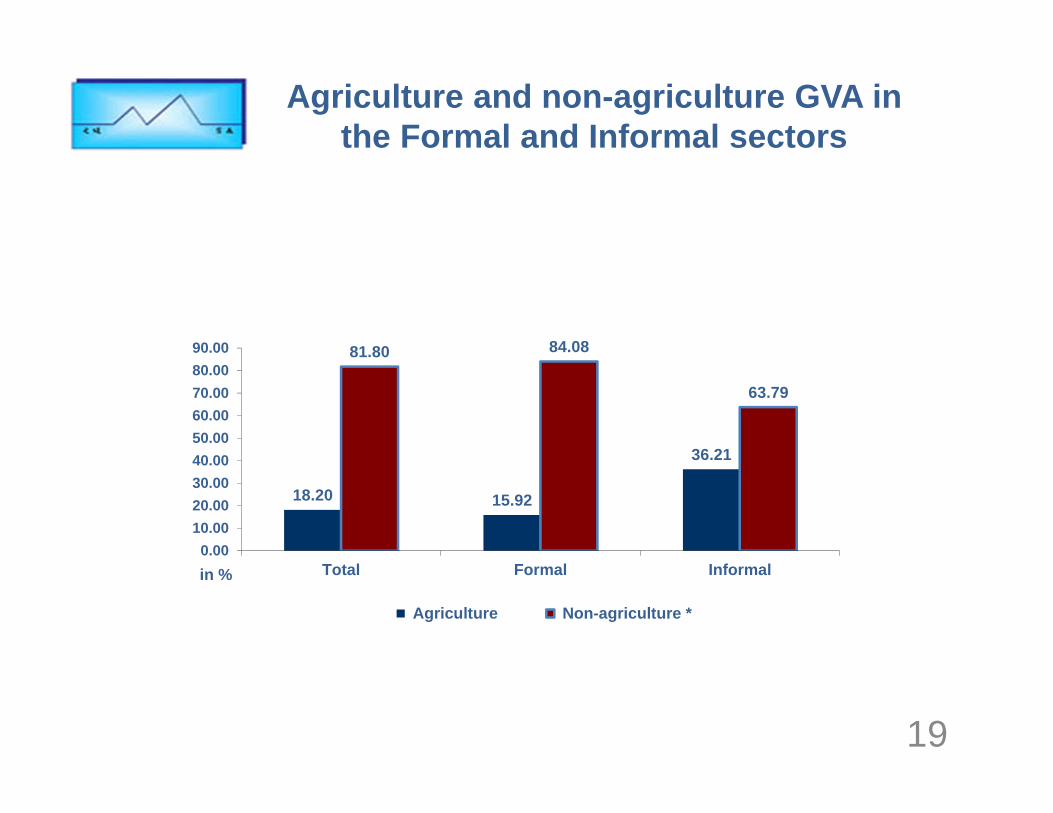
Agriculture and non-agriculture GVA in the Formal and Informal sectors
19
18.20 15.92
36.21
81.80 84.08
63.79
0.00
10.00
20.00
30.00
40.00
50.00
60.00
70.00
80.00
90.00
Total Formal Informalin %
Agriculture Non-agriculture *
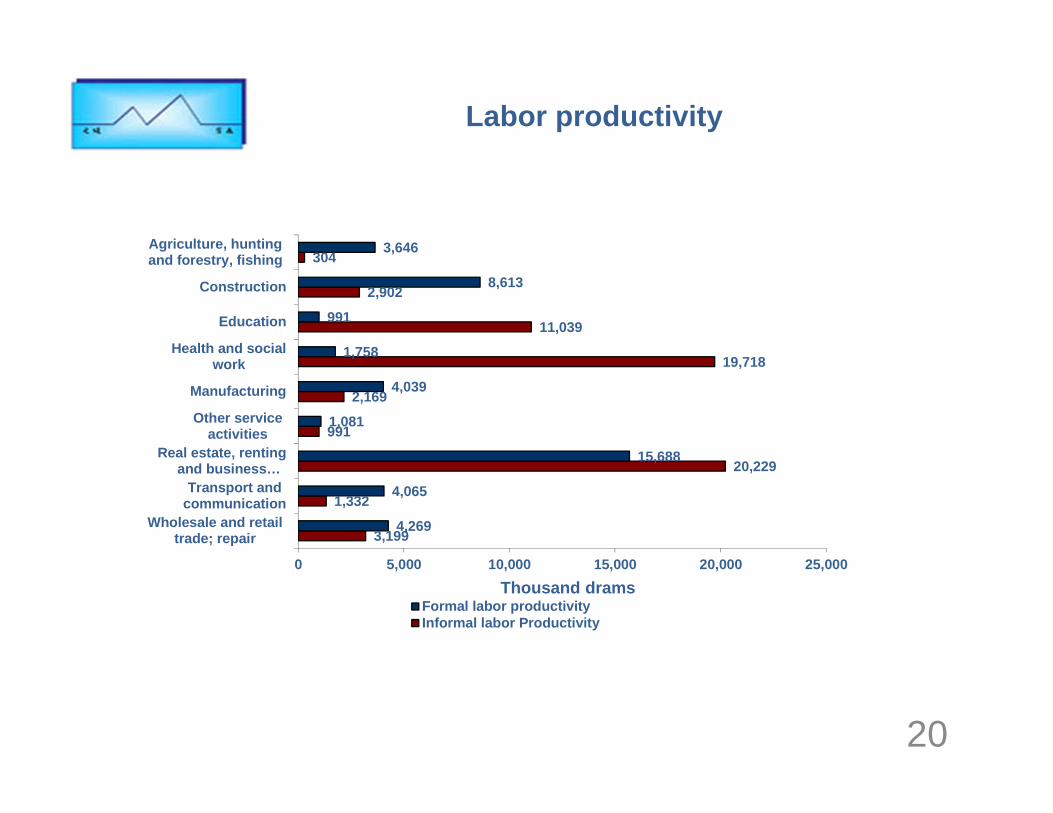
Labor productivity
20
3,199
1,332
20,229
991
2,169
19,718
11,039
2,902
304
4,269
4,065
15,688
1,081
4,039
1,758
991
8,613
3,646
0 5,000 10,000 15,000 20,000 25,000
Wholesale and retailtrade; repair
Transport andcommunication
Real estate, rentingand business…
Other serviceactivities
Manufacturing
Health and socialwork
Education
Construction
Agriculture, huntingand forestry, fishing
Thousand dramsFormal labor productivityInformal labor Productivity
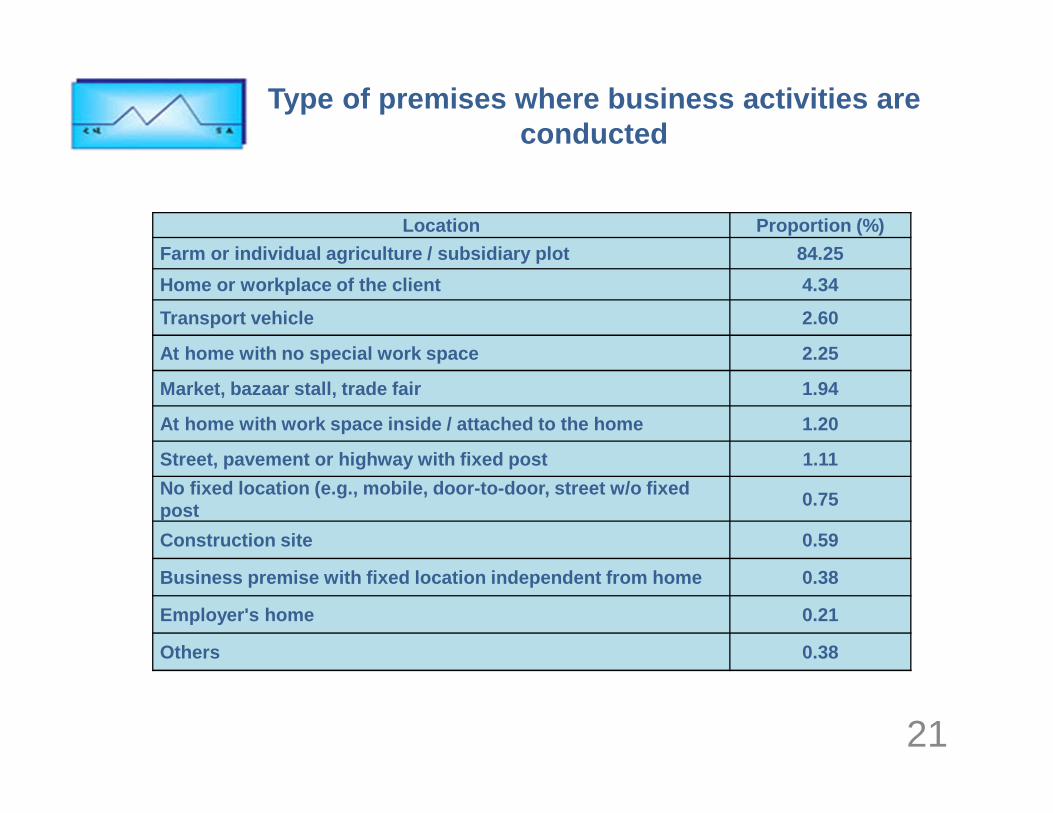
Type of premises where business activities are conducted
21
Location Proportion (%)
Farm or individual agriculture / subsidiary plot 84. 25
Home or workplace of the client 4.34
Transport vehicle 2.60
At home with no special work space 2.25
Market, bazaar stall, trade fair 1.94
At home with work space inside / attached to the ho me 1.20
Street, pavement or highway with fixed post 1.11
No fixed location (e.g., mobile, door-to-door, stre et w/o fixed post
0.75
Construction site 0.59
Business premise with fixed location independent fr om home 0.38
Employer's home 0.21
Others 0.38
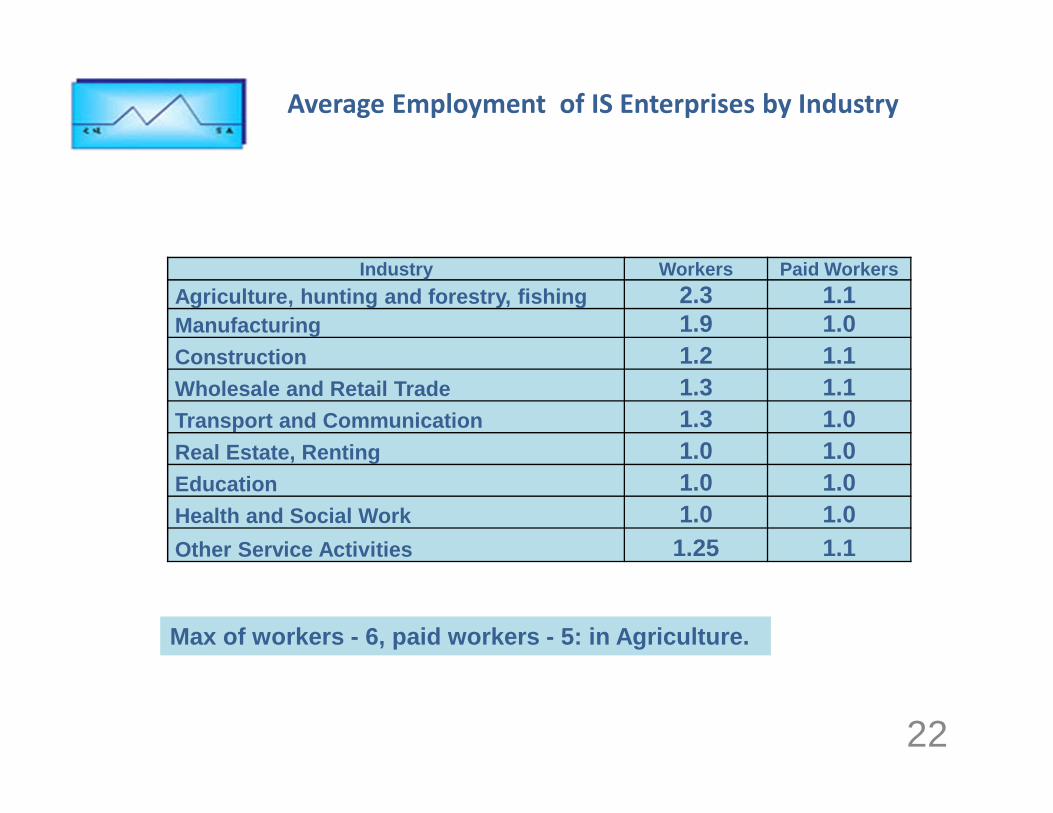
Average Employment of IS Enterprises by Industry
22
Industry Workers Paid Workers
Agriculture, hunting and forestry, fishing 2.3 1.1Manufacturing 1.9 1.0Construction 1.2 1.1Wholesale and Retail Trade 1.3 1.1Transport and Communication 1.3 1.0Real Estate, Renting 1.0 1.0Education 1.0 1.0Health and Social Work 1.0 1.0Other Service Activities 1.25 1.1
Max of workers - 6, paid workers - 5: in Agriculture.
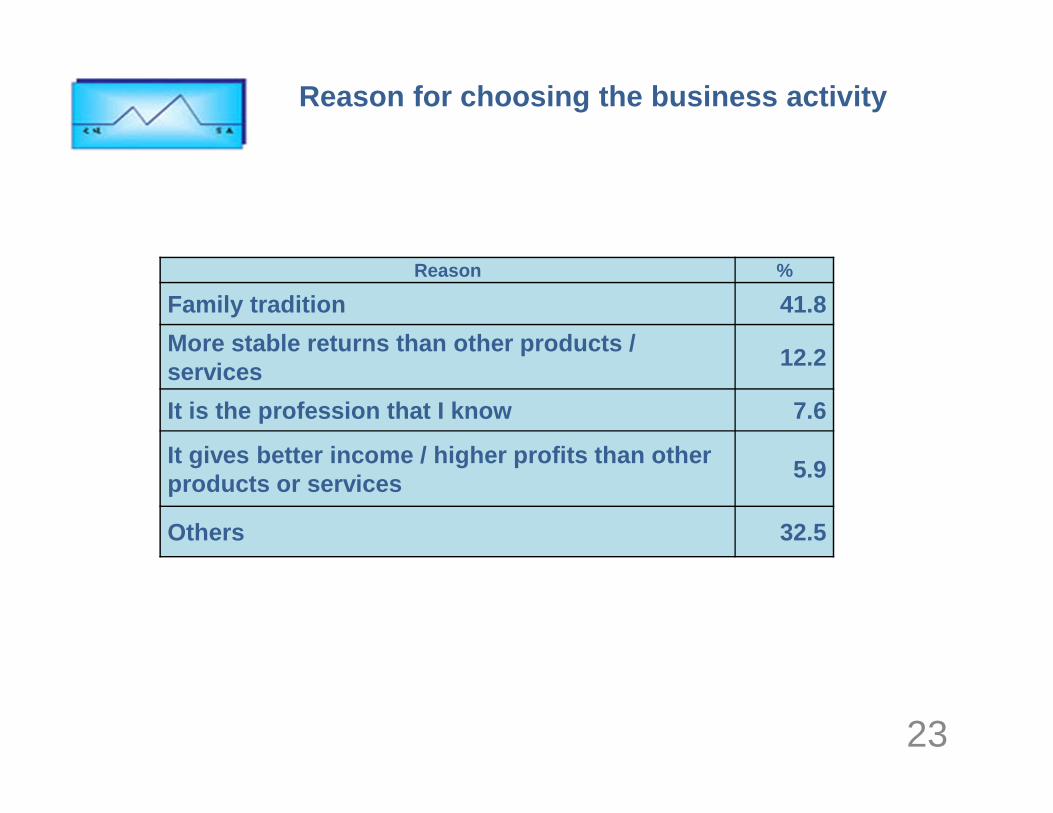
Reason for choosing the business activity
23
Reason %
Family tradition 41.8
More stable returns than other products / services
12.2
It is the profession that I know 7.6
It gives better income / higher profits than other products or services
5.9
Others 32.5
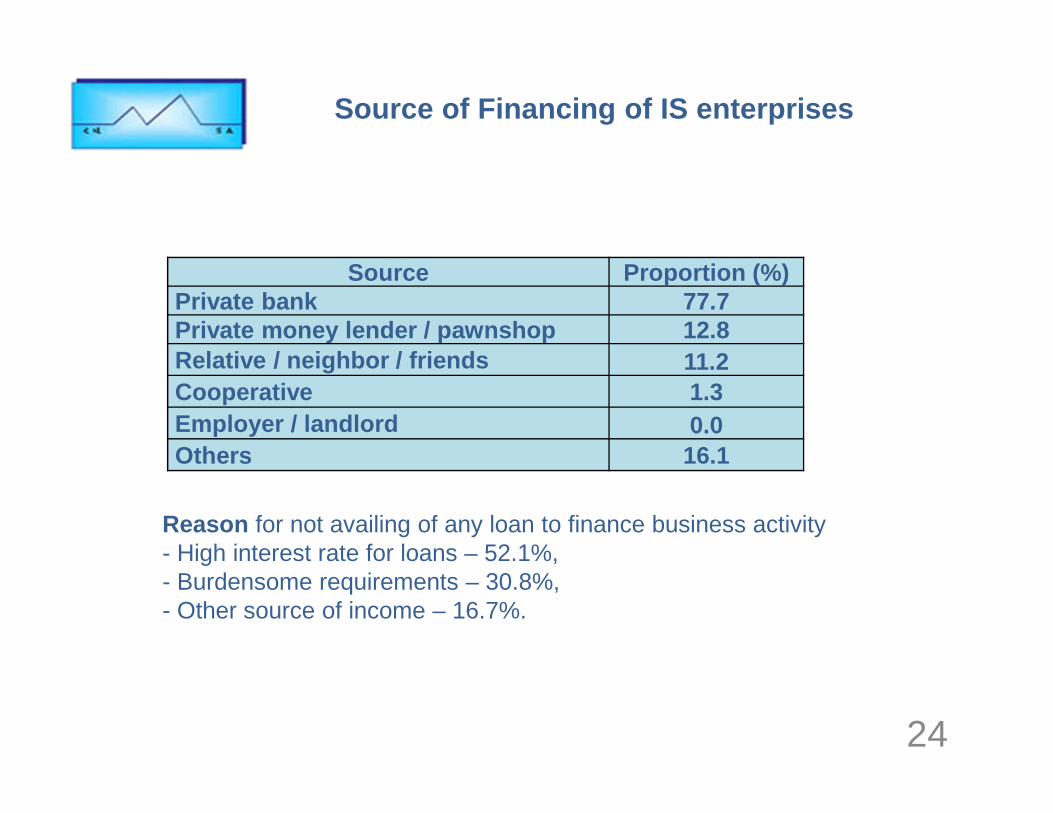
Source of Financing of IS enterprises
24
Source Proportion (%)Private bank 77.7Private money lender / pawnshop 12.8Relative / neighbor / friends 11.2Cooperative 1.3Employer / landlord 0.0Others 16.1
Reason for not availing of any loan to finance business activity- High interest rate for loans – 52.1%,- Burdensome requirements – 30.8%,- Other source of income – 16.7%.
25
Implementation of Eurostat Tabular approach to Exhaustiveness of GDP
Current TWINNING project from January 2011 to Janua ry 2013 withStatistics of Denmark as the core partner includes also project
component for Exhaustiveness of GDP with aim to int roduceEurostat Tabular approach to Exhaustiveness into pra ctice.
The three tables were compiled according to Eurosta t TabularApproach to Exhaustiveness Guidelines.
Table 1A Elements of non-exhaustiveness: Output App roachTable 2A Exhaustiveness adjustments: Output Approac hTable 3A Summary of adjustments: Output Approach
Information about sources and methods used in the R epublic ofArmenia has been presented.
26
Implementation of Eurostat Tabular approach to Exhaustiveness of GDP
Steps:- With the purpose to evaluate non-exhaustiveness the Tabular
approach has been applied to NACE G (Wholesale and retail trade; repair of motor vehicles and motorcycles) in practice to test it.
- NACE G section is the economic activity with the o ne of the largest share of exhaustiveness adjustments.
- It is also representative since all the main types of non-exhaustiveness may be found.
- All possible non exhaustiveness types were defined according to economic institutional sectors by NSS RA by using each non exhaustiveness type (N1-N7) for adj ustments using different sources and methods.
- Later, respectively the same exercise was repeated for the rest 16 NACE sections for identification of non exhaustiveness types.
- «Informal Employment and Informal Sector in Armenia » survey (financed by Asian Development bank) results were used as the information source for the non exhausti veness types adjustments for 2009. This information ga ve an opportunity to directly evaluate informal part in G DP in lower economic activity type classification level (NAC E 4 digits)
27
Implementation of Eurostat Tabular approach to Exhaustiveness of GDP
There are no adjustments for N2 illegal activities. Sources and methods for the calculation of such estimates shoul d be investigated. As an operational starting point, est imates for one or more of three types could be considered: prostituti on, narcotics and smuggling.
For some industries, the value of the hidden activi ty(N6 adjustments) is calculated using the assumption tha t the hidden activity has the same VA per employee and the same input-percentage as the formal activity. The number of em ployees is not adjusted for actual hours worked. Such adjustments will be made in the near future. It should be investigated if in formation from the LFS can be used to adjust the number of employees f or actual hours worked.
28
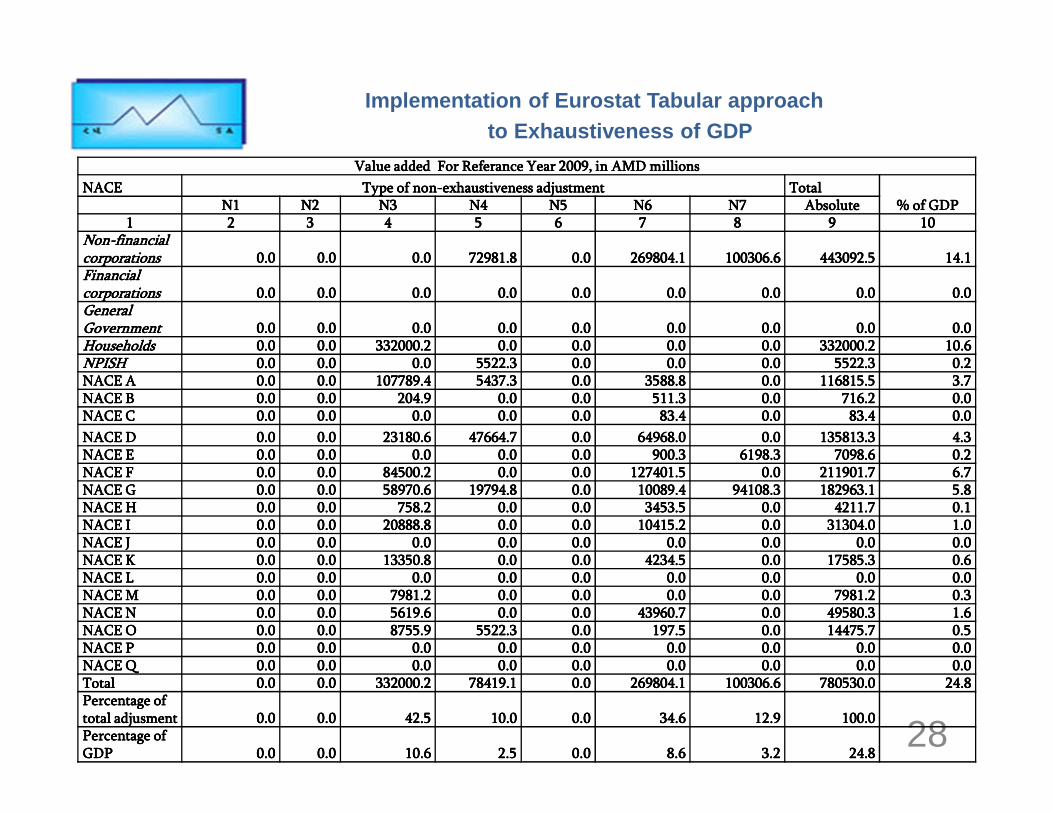
Implementation of Eurostat Tabular approach to Exhaustiveness of GDP
Value added For Value added For Value added For Value added For ReferanceReferanceReferanceReferance Year 2009, in AMD millionsYear 2009, in AMD millionsYear 2009, in AMD millionsYear 2009, in AMD millions
NACE NACE NACE NACE Type of nonType of nonType of nonType of non----exhaustiveness adjustmentexhaustiveness adjustmentexhaustiveness adjustmentexhaustiveness adjustment TotalTotalTotalTotal% of GDP% of GDP% of GDP% of GDPN1N1N1N1 N2N2N2N2 N3N3N3N3 N4N4N4N4 N5N5N5N5 N6N6N6N6 N7N7N7N7 AbsoluteAbsoluteAbsoluteAbsolute
1111 2222 3333 4444 5555 6666 7777 8888 9999 10101010NonNonNonNon----financial financial financial financial corporations corporations corporations corporations 0.00.00.00.0 0.00.00.00.0 0.00.00.00.0 72981.872981.872981.872981.8 0.00.00.00.0 269804.1269804.1269804.1269804.1 100306.6100306.6100306.6100306.6 443092.5443092.5443092.5443092.5 14.114.114.114.1Financial Financial Financial Financial corporations corporations corporations corporations 0.00.00.00.0 0.00.00.00.0 0.00.00.00.0 0.00.00.00.0 0.00.00.00.0 0.00.00.00.0 0.00.00.00.0 0.00.00.00.0 0.00.00.00.0General General General General Government Government Government Government 0.00.00.00.0 0.00.00.00.0 0.00.00.00.0 0.00.00.00.0 0.00.00.00.0 0.00.00.00.0 0.00.00.00.0 0.00.00.00.0 0.00.00.00.0Households Households Households Households 0.00.00.00.0 0.00.00.00.0 332000.2332000.2332000.2332000.2 0.00.00.00.0 0.00.00.00.0 0.00.00.00.0 0.00.00.00.0 332000.2332000.2332000.2332000.2 10.610.610.610.6NPISHNPISHNPISHNPISH 0.00.00.00.0 0.00.00.00.0 0.00.00.00.0 5522.35522.35522.35522.3 0.00.00.00.0 0.00.00.00.0 0.00.00.00.0 5522.35522.35522.35522.3 0.20.20.20.2NACE ANACE ANACE ANACE A 0.00.00.00.0 0.00.00.00.0 107789.4107789.4107789.4107789.4 5437.35437.35437.35437.3 0.00.00.00.0 3588.83588.83588.83588.8 0.00.00.00.0 116815.5116815.5116815.5116815.5 3.73.73.73.7NACE BNACE BNACE BNACE B 0.00.00.00.0 0.00.00.00.0 204.9204.9204.9204.9 0.00.00.00.0 0.00.00.00.0 511.3511.3511.3511.3 0.00.00.00.0 716.2716.2716.2716.2 0.00.00.00.0NACE CNACE CNACE CNACE C 0.00.00.00.0 0.00.00.00.0 0.00.00.00.0 0.00.00.00.0 0.00.00.00.0 83.483.483.483.4 0.00.00.00.0 83.483.483.483.4 0.00.00.00.0
NACE DNACE DNACE DNACE D 0.00.00.00.0 0.00.00.00.0 23180.623180.623180.623180.6 47664.747664.747664.747664.7 0.00.00.00.0 64968.064968.064968.064968.0 0.00.00.00.0 135813.3135813.3135813.3135813.3 4.34.34.34.3NACE ENACE ENACE ENACE E 0.00.00.00.0 0.00.00.00.0 0.00.00.00.0 0.00.00.00.0 0.00.00.00.0 900.3900.3900.3900.3 6198.36198.36198.36198.3 7098.67098.67098.67098.6 0.20.20.20.2NACE FNACE FNACE FNACE F 0.00.00.00.0 0.00.00.00.0 84500.284500.284500.284500.2 0.00.00.00.0 0.00.00.00.0 127401.5127401.5127401.5127401.5 0.00.00.00.0 211901.7211901.7211901.7211901.7 6.76.76.76.7NACE GNACE GNACE GNACE G 0.00.00.00.0 0.00.00.00.0 58970.658970.658970.658970.6 19794.819794.819794.819794.8 0.00.00.00.0 10089.410089.410089.410089.4 94108.394108.394108.394108.3 182963.1182963.1182963.1182963.1 5.85.85.85.8NACE HNACE HNACE HNACE H 0.00.00.00.0 0.00.00.00.0 758.2758.2758.2758.2 0.00.00.00.0 0.00.00.00.0 3453.53453.53453.53453.5 0.00.00.00.0 4211.74211.74211.74211.7 0.10.10.10.1NACE INACE INACE INACE I 0.00.00.00.0 0.00.00.00.0 20888.820888.820888.820888.8 0.00.00.00.0 0.00.00.00.0 10415.210415.210415.210415.2 0.00.00.00.0 31304.031304.031304.031304.0 1.01.01.01.0NACE JNACE JNACE JNACE J 0.00.00.00.0 0.00.00.00.0 0.00.00.00.0 0.00.00.00.0 0.00.00.00.0 0.00.00.00.0 0.00.00.00.0 0.00.00.00.0 0.00.00.00.0NACE KNACE KNACE KNACE K 0.00.00.00.0 0.00.00.00.0 13350.813350.813350.813350.8 0.00.00.00.0 0.00.00.00.0 4234.54234.54234.54234.5 0.00.00.00.0 17585.317585.317585.317585.3 0.60.60.60.6NACE LNACE LNACE LNACE L 0.00.00.00.0 0.00.00.00.0 0.00.00.00.0 0.00.00.00.0 0.00.00.00.0 0.00.00.00.0 0.00.00.00.0 0.00.00.00.0 0.00.00.00.0NACE MNACE MNACE MNACE M 0.00.00.00.0 0.00.00.00.0 7981.27981.27981.27981.2 0.00.00.00.0 0.00.00.00.0 0.00.00.00.0 0.00.00.00.0 7981.27981.27981.27981.2 0.30.30.30.3NACE NNACE NNACE NNACE N 0.00.00.00.0 0.00.00.00.0 5619.65619.65619.65619.6 0.00.00.00.0 0.00.00.00.0 43960.743960.743960.743960.7 0.00.00.00.0 49580.349580.349580.349580.3 1.61.61.61.6NACE ONACE ONACE ONACE O 0.00.00.00.0 0.00.00.00.0 8755.98755.98755.98755.9 5522.35522.35522.35522.3 0.00.00.00.0 197.5197.5197.5197.5 0.00.00.00.0 14475.714475.714475.714475.7 0.50.50.50.5NACE PNACE PNACE PNACE P 0.00.00.00.0 0.00.00.00.0 0.00.00.00.0 0.00.00.00.0 0.00.00.00.0 0.00.00.00.0 0.00.00.00.0 0.00.00.00.0 0.00.00.00.0NACE QNACE QNACE QNACE Q 0.00.00.00.0 0.00.00.00.0 0.00.00.00.0 0.00.00.00.0 0.00.00.00.0 0.00.00.00.0 0.00.00.00.0 0.00.00.00.0 0.00.00.00.0TotalTotalTotalTotal 0.00.00.00.0 0.00.00.00.0 332000.2332000.2332000.2332000.2 78419.178419.178419.178419.1 0.00.00.00.0 269804.1269804.1269804.1269804.1 100306.6100306.6100306.6100306.6 780530.0780530.0780530.0780530.0 24.824.824.824.8Percentage of Percentage of Percentage of Percentage of total total total total adjusmentadjusmentadjusmentadjusment 0.00.00.00.0 0.00.00.00.0 42.542.542.542.5 10.010.010.010.0 0.00.00.00.0 34.634.634.634.6 12.912.912.912.9 100.0100.0100.0100.0Percentage of Percentage of Percentage of Percentage of GDPGDPGDPGDP 0.00.00.00.0 0.00.00.00.0 10.610.610.610.6 2.52.52.52.5 0.00.00.00.0 8.68.68.68.6 3.23.23.23.2 24.824.824.824.8
29
THANK YOU!
For More Information http://www.armstat.am/en/?nid=82&id=1218 -
Meeting on Implementation of the 2008 SNA Group of Experts on National Accounts
Geneva 30 April - 04 May 2012
ՀԱՅԱՍՏԱՆԻՀԱՅԱՍՏԱՆԻՀԱՅԱՍՏԱՆԻՀԱՅԱՍՏԱՆԻ ԱԶԳԱՅԻՆԱԶԳԱՅԻՆԱԶԳԱՅԻՆԱԶԳԱՅԻՆ ՎԻՃԱԿԱԳՐԱԿԱՆՎԻՃԱԿԱԳՐԱԿԱՆՎԻՃԱԿԱԳՐԱԿԱՆՎԻՃԱԿԱԳՐԱԿԱՆԾԱՌԱՅՈՒԹՅՈՒՆԾԱՌԱՅՈՒԹՅՈՒՆԾԱՌԱՅՈՒԹՅՈՒՆԾԱՌԱՅՈՒԹՅՈՒՆ
NATIONAL STATISTICAL SERVICE OF ARMENIA