Measuring CDN performance and why you're doing it wrong
113
Measuring CDN Performance Hooman Beheshti, VP Technology
Transcript of Measuring CDN performance and why you're doing it wrong
Measuring CDN Performance
Hooman Beheshti, VP Technology
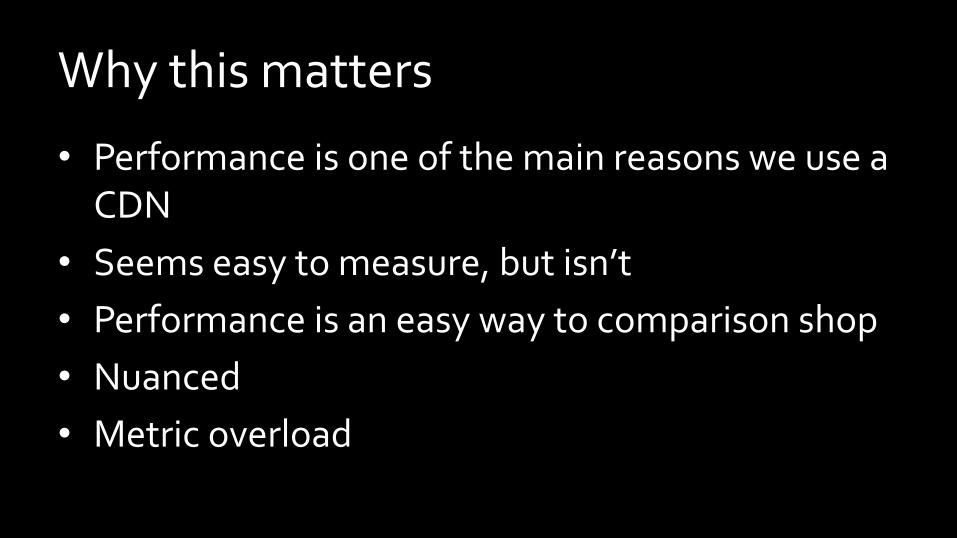
Why this matters
• Performance is one of the main reasons we use a CDN
• Seems easy to measure, but isn’t • Performance is an easy way to comparison shop • Nuanced • Metric overload

Common mistakes
• Getting lost in data • Focusing on one thing and one thing alone – We like numbers!
• Forgetting about our applications • Letting vendors influence us – (I’m fully aware of the irony!)

Goals
• Share measurement experiences
• What does the measurement landscape look like
• Help guide towards good testing plan – Avoid pitfalls

Background
CDNs: delivery platforms
• We won’t talk about – Extra stuff: security, GSLB, TLS offload, etc – We also won’t talk about page-‐level optimizations
• We will focus on the delivery side – Delivering HTTP objects
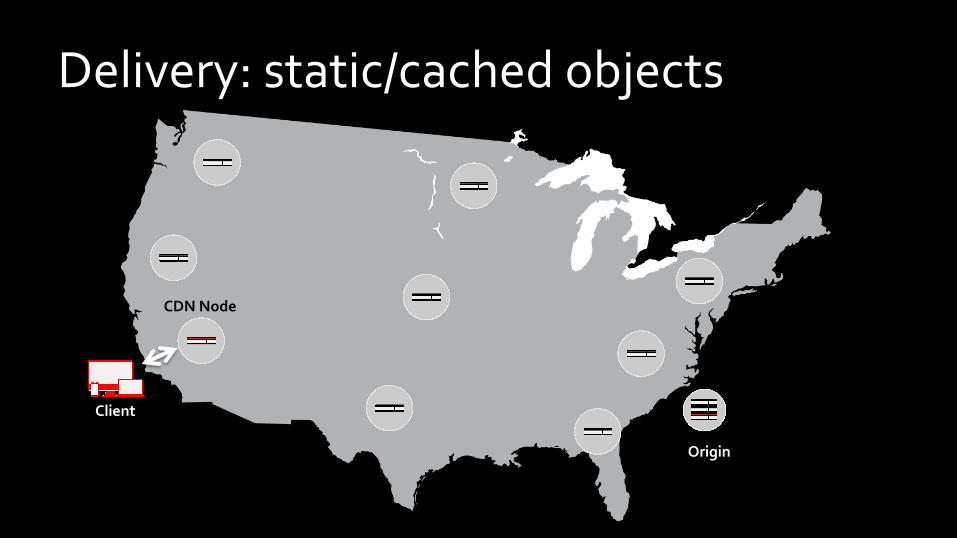
Delivery: static/cached objects
Client
CDN Node
Origin
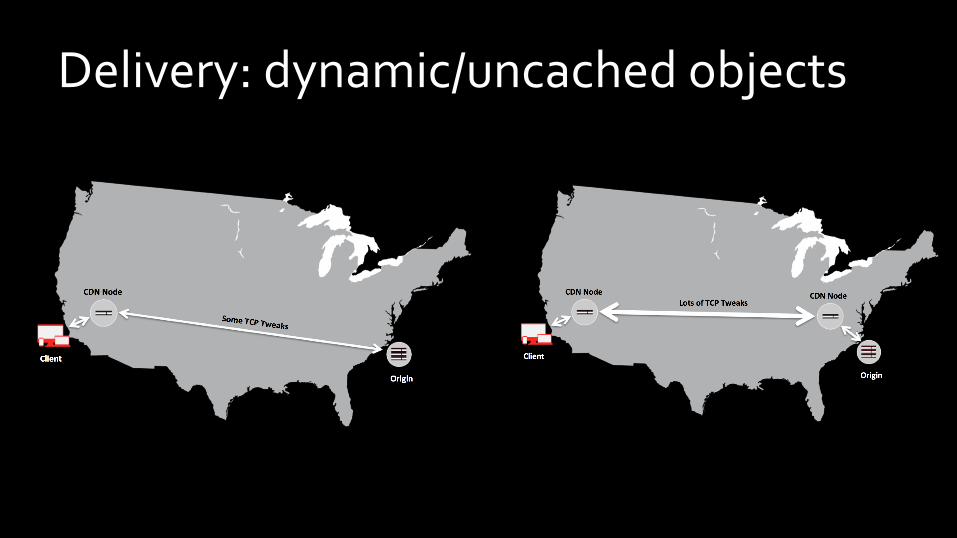
Delivery: dynamic/uncached objects
What we’ll be focusing on
• How we measure • Metrics to measure • What to measure • Some gotchas, misconceptions, and common mistakes

Measurement Techniques
(how we measure)
Measurement techniques • Pretend Users – Synthetic tests – Not actual users
• Real Users – In the browser – Actual users

Synthetic testing
Synthetic testing
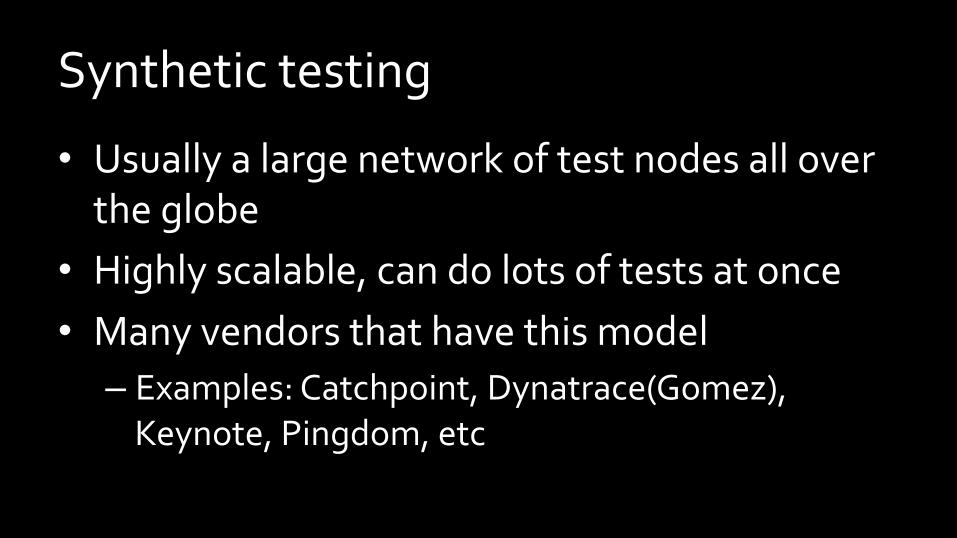
• Usually a large network of test nodes all over the globe
• Highly scalable, can do lots of tests at once • Many vendors that have this model – Examples: Catchpoint, Dynatrace(Gomez), Keynote, Pingdom, etc
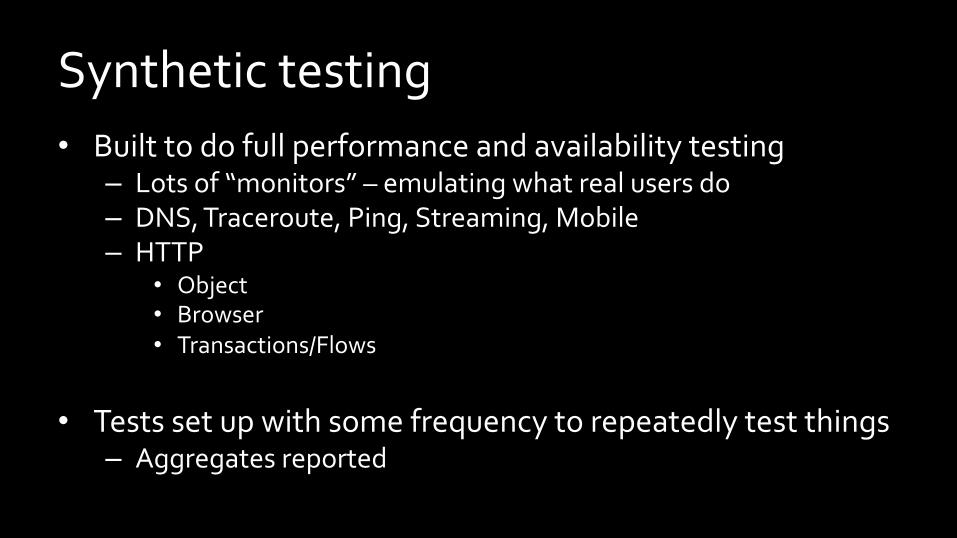
Synthetic testing • Built to do full performance and availability testing
– Lots of “monitors” – emulating what real users do – DNS, Traceroute, Ping, Streaming, Mobile – HTTP
• Object • Browser • Transactions/Flows
• Tests set up with some frequency to repeatedly test things
– Aggregates reported

Backbone nodes • Test machines sitting in datacenters all around the globe • Terrible indicators of raw performance
– No latency – Infinite bandwidth
• But really good at: – Availability – Scale – Backend problems – Global reach
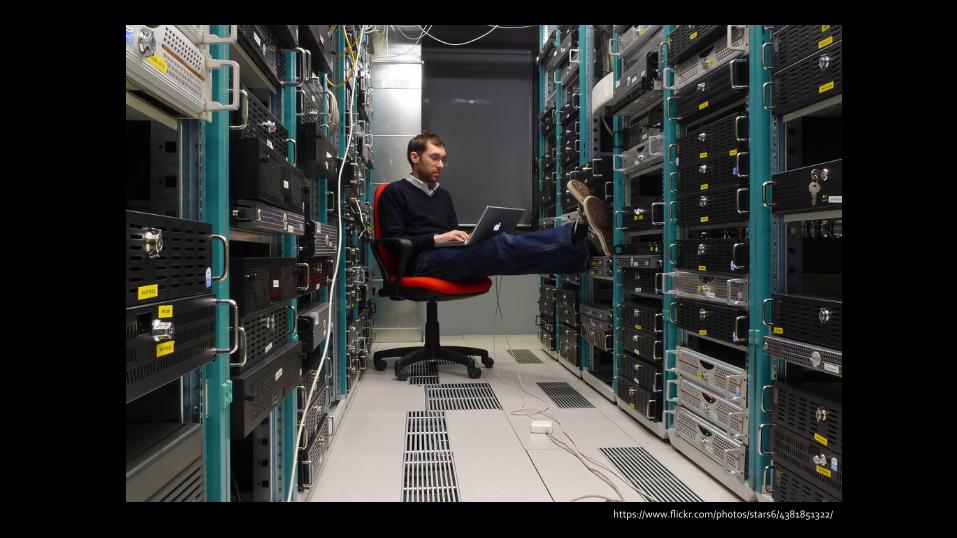
https://www.flickr.com/photos/stars6/4381851322/

Backbone nodes • Test machines sitting in datacenters all around the globe • Terrible indicators of raw performance
– No latency – Infinite bandwidth
• But really good at: – Availability – Scale – Backend problems – Global reach

Last mile nodes • Test machines sitting behind a real home-‐like internet connection
• Much better at reporting what you can expect from users, but sometimes unreliable
• Also not as dense in deployment
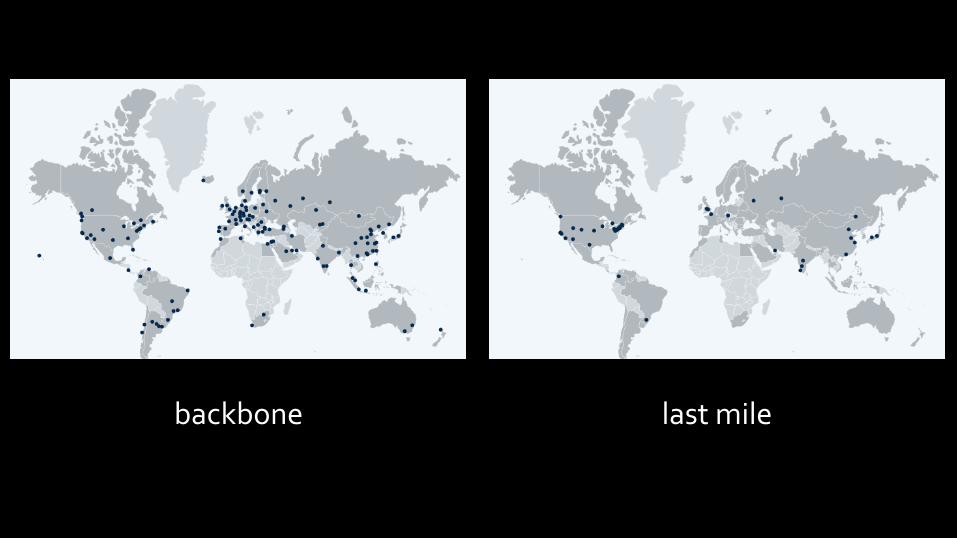
backbone last mile
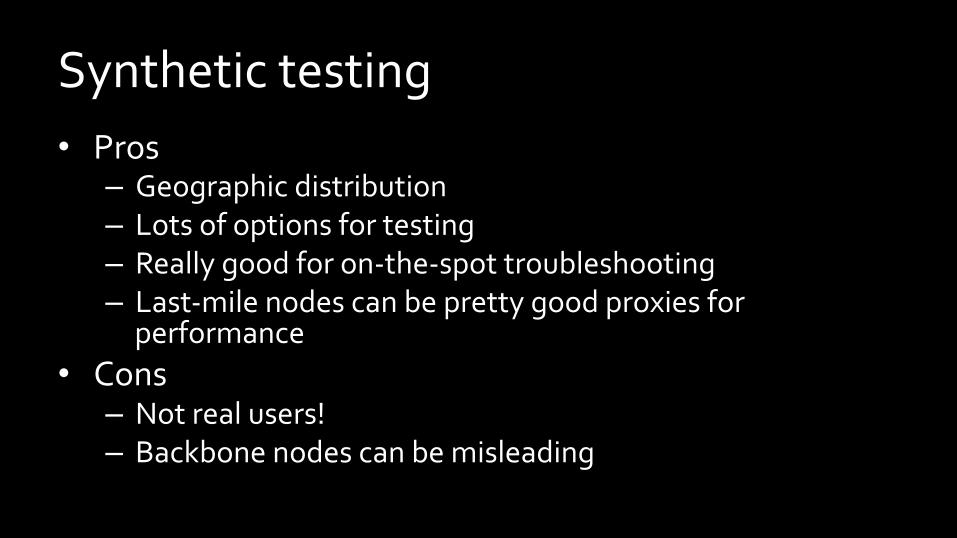
Synthetic testing • Pros – Geographic distribution – Lots of options for testing – Really good for on-‐the-‐spot troubleshooting – Last-‐mile nodes can be pretty good proxies for performance
• Cons – Not real users! – Backbone nodes can be misleading
Real users (RUM)
RUM
• Use javascript to collect timing metrics
• Can collect lots of things through browser APIs – Page metrics, asset metrics, user-‐defined metrics
Use test assets
• Use this model to initiate tests in the browser • Some vendors: – Cedexis, TurboBytes, CloudHarmony, more… – Usually, this isn’t their business, but the data drives their main business objectives
• You can build this yourself too
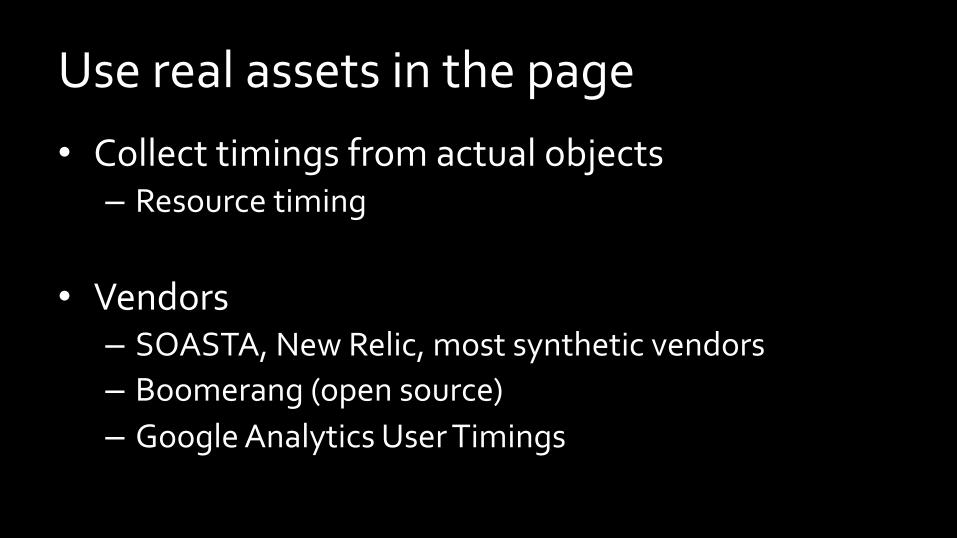
Use real assets in the page • Collect timings from actual objects – Resource timing
• Vendors – SOASTA, New Relic, most synthetic vendors – Boomerang (open source) – Google Analytics User Timings
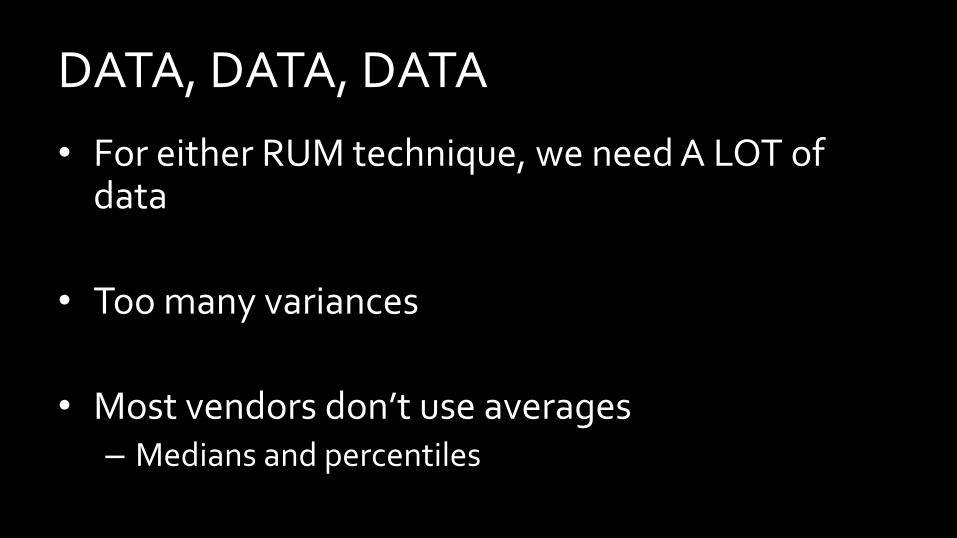
DATA, DATA, DATA • For either RUM technique, we need A LOT of data
• Too many variances
• Most vendors don’t use averages – Medians and percentiles

Real user measurements • Pros – Real users, real browsers, real world conditions – If you use your own content, could be close to what your users experience
– With enough data, great for granular analysis • Cons – We need a lot of data – If you do it yourself, data infrastructures aren’t trivial
Measurement Metrics

Client Server

Client Server
1 x RTT

Client Server
DNS DNS
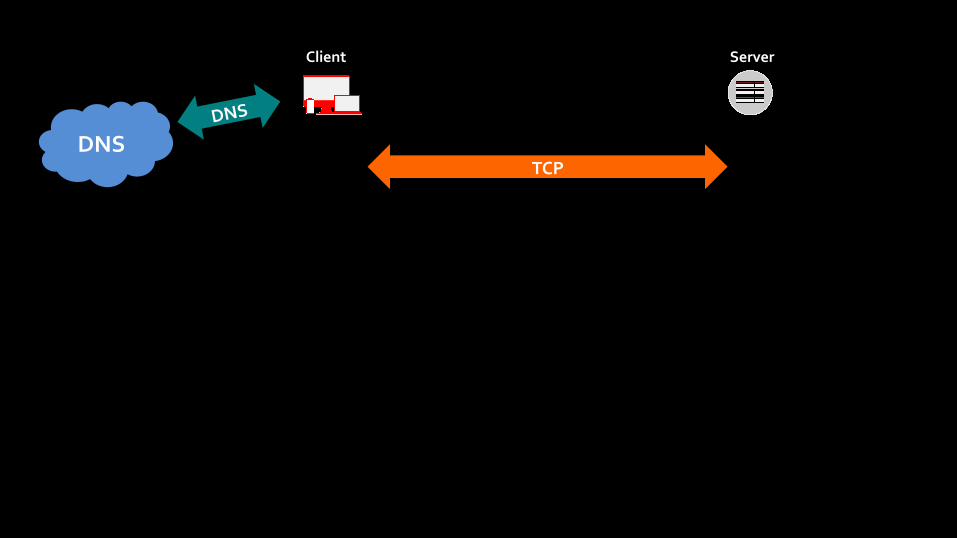
TCP
Client Server
DNS DNS
TCP
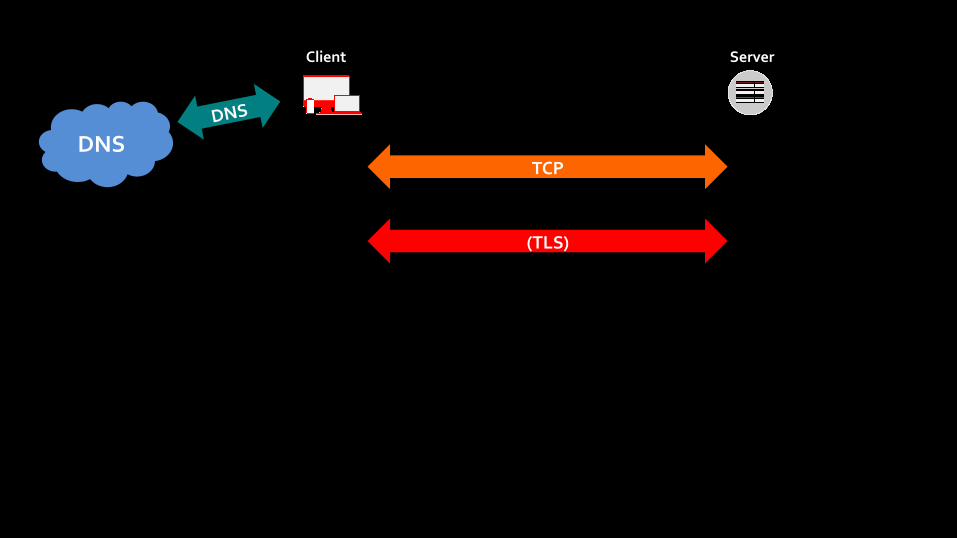
Client Server
DNS DNS
(TLS)

TCP
Client Server
DNS DNS
(TLS)
HTTP
TCP
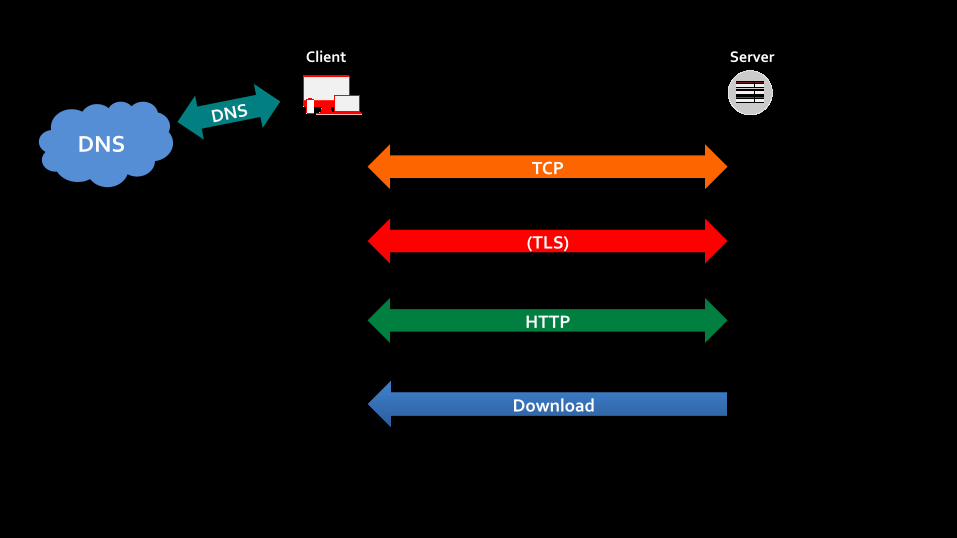
Client Server
DNS DNS
(TLS)
HTTP
Download

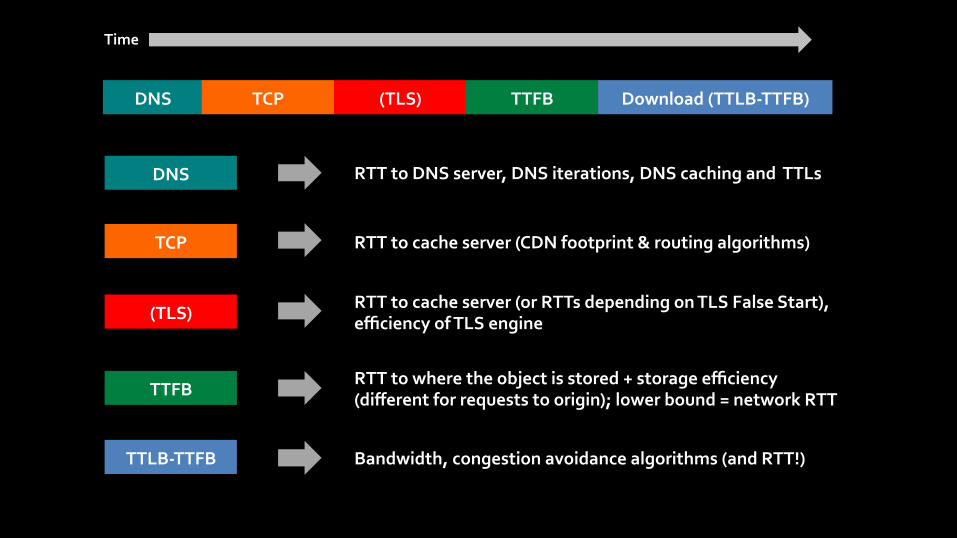
DNS TCP (TLS) TTFB Download (TTLB-‐TTFB)
Time

DNS TCP (TLS) TTFB Download (TTLB-‐TTFB)
Time
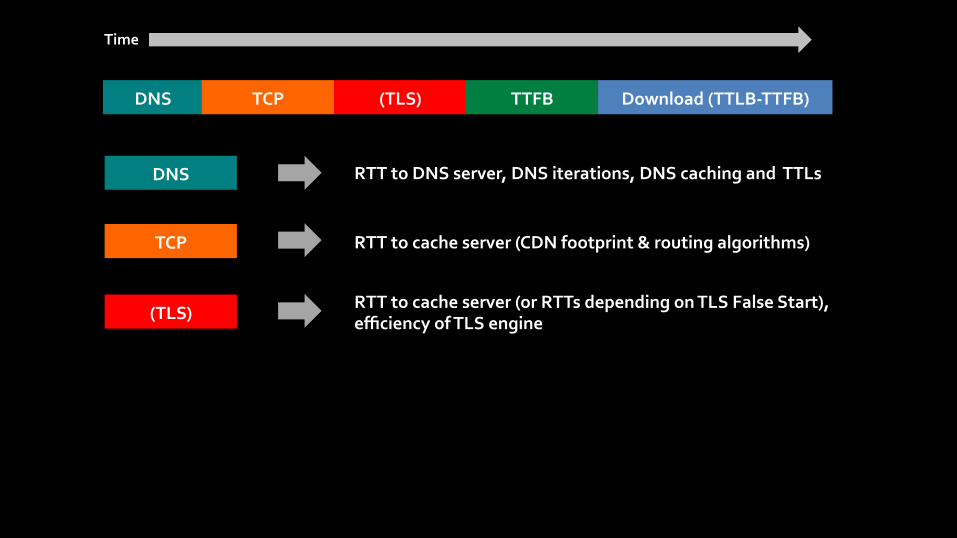
DNS RTT to DNS server, DNS iterations, DNS caching and TTLs

DNS TCP (TLS) TTFB Download (TTLB-‐TTFB)
Time
DNS
TCP
RTT to DNS server, DNS iterations, DNS caching and TTLs
RTT to cache server (CDN footprint & routing algorithms)
DNS TCP (TLS) TTFB Download (TTLB-‐TTFB)
Time
DNS
TCP
(TLS)
RTT to DNS server, DNS iterations, DNS caching and TTLs
RTT to cache server (CDN footprint & routing algorithms)
RTT to cache server (or RTTs depending on TLS False Start), efficiency of TLS engine
DNS TCP (TLS) TTFB Download (TTLB-‐TTFB)
Time
DNS
TCP
(TLS)
TTFB
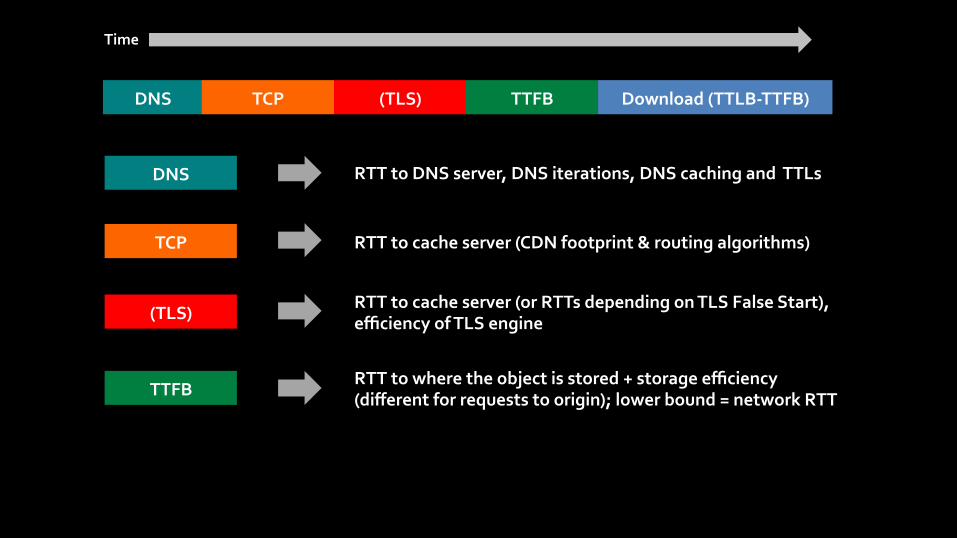
RTT to DNS server, DNS iterations, DNS caching and TTLs
RTT to cache server (CDN footprint & routing algorithms)
RTT to cache server (or RTTs depending on TLS False Start), efficiency of TLS engine
RTT to where the object is stored + storage efficiency (different for requests to origin); lower bound = network RTT
DNS TCP (TLS) TTFB Download (TTLB-‐TTFB)
Time
DNS
TCP
(TLS)
TTFB
TTLB-‐TTFB
RTT to DNS server, DNS iterations, DNS caching and TTLs
RTT to cache server (CDN footprint & routing algorithms)
RTT to cache server (or RTTs depending on TLS False Start), efficiency of TLS engine
RTT to where the object is stored + storage efficiency (different for requests to origin); lower bound = network RTT
Bandwidth, congestion avoidance algorithms (and RTT!)

Core object metrics • Not every request experiences every metric: – DNS: once per domain – TCP/TLS once per connection – HTTP/Download for every object (not already in browser cache)
• All techniques/tools measure and report these metrics

Resource timing
http://www.w3.org/TR/resource-‐timing/
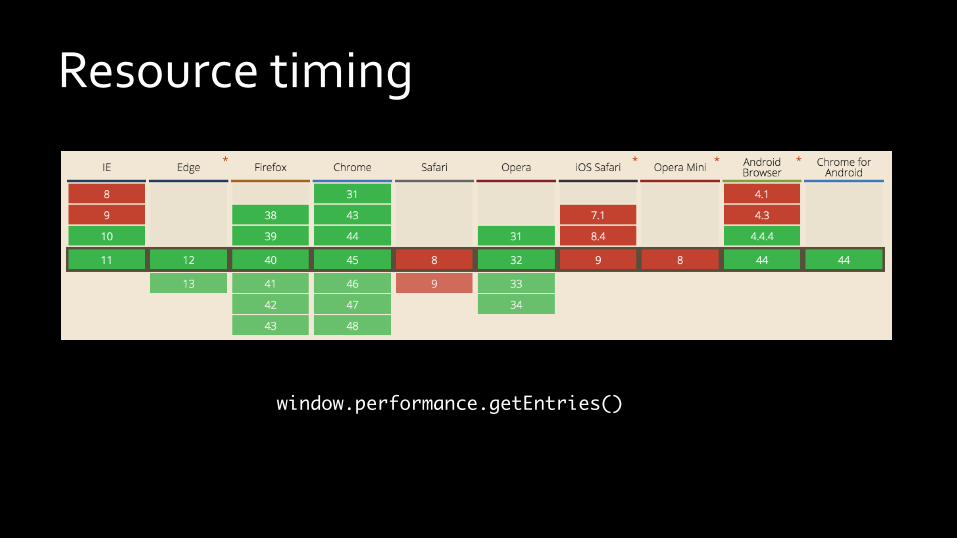
Resource timing
window.performance.getEntries()
object metrics or
page metrics


Download: 15Mbps Upload: 5Mbps Latency: 10 ms, 25 ms
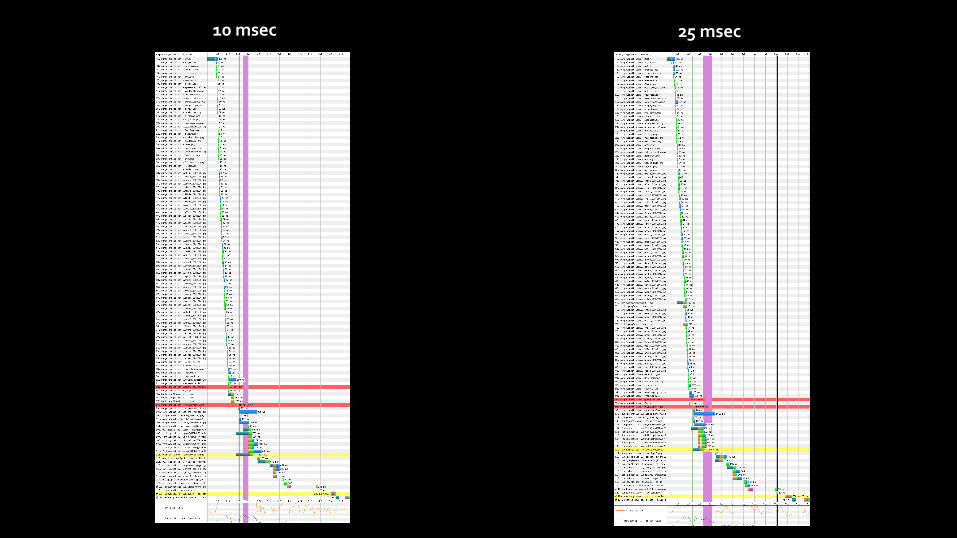
10 msec 25 msec

10 msec 25 msec
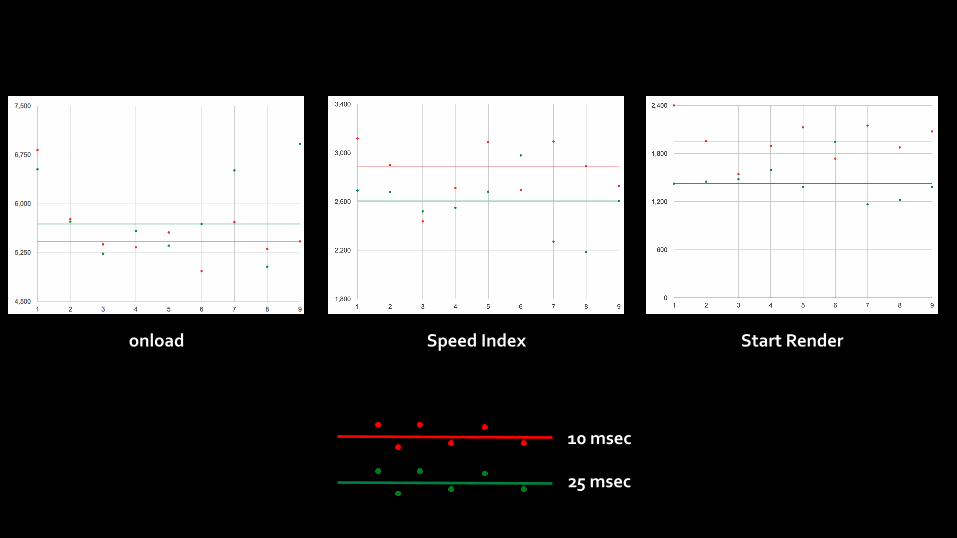
onload Speed Index Start Render
10 msec
25 msec

What the…??? • We always assume “all things equal”
• Too many factors affect page load time – 3rd parties (sometimes varying), content form origin, layout, JS execution, etc
• Too much variance

3rd parties
Source: httparchive.org
To be clear… • Always use webpagetest (or something like it) to understand your
application’s performance profile
• Continue to monitor application performance, and always spot check
• Be extremely careful when using it to gage/compare CDN performance, it can mislead you – If using RUM to measure page metrics, with lots of data, things
become a little more meaningful (data volume handles variance)

What to measure
(plus the right metrics)

Most commonly… • Pick a “normal object”
– e.g. some object on the home page
• Set up testing from multiple places (usually with a synthetic vendor) – And hopefully not backbone!
• Compare either overall load time, or some object metrics

Totally application-‐dependent

Example: web application

Web application: objects
• Ratio of objects coming from CDN cache vs those coming from origin (through CDN) should determine objects to test
• If HTML is from origin, we must measure it – Essential to critical page metrics

Web application: object sizes
Web application: metrics • On any page
– DNS queries only happen a small number of times – 6 TCP connections per domain – Many many many HTTP fetches
• Core metrics – TTFB – Download (TTLB-‐TTFB) if important large objects – Should have a good idea of DNS/TCP/TLS, but less critical

Web application • If CDN only for static/cacheable objects: – One or two representative assets – TTFB and maybe download most important
Client CDN Node

X-Cache: HIT

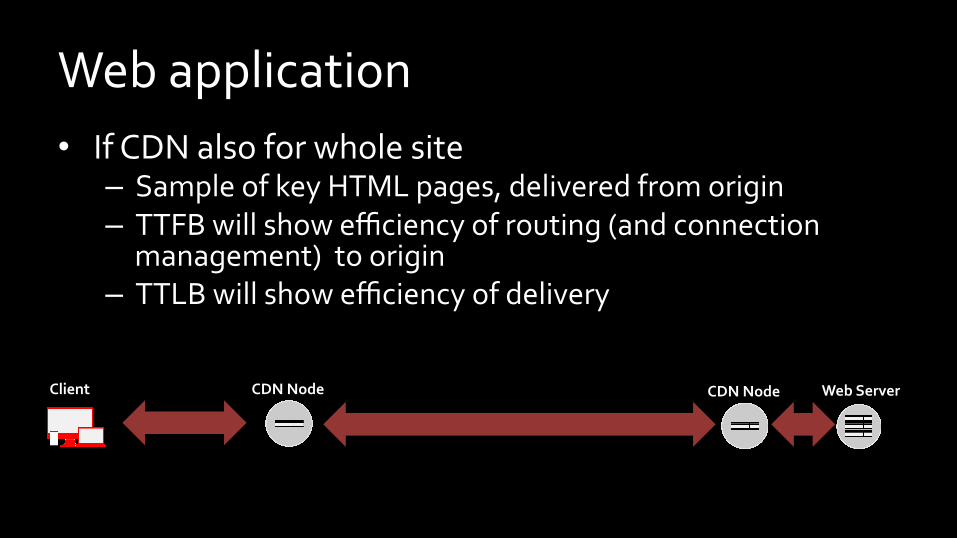
Web application • If CDN also for whole site – Sample of key HTML pages, delivered from origin – TTFB will show efficiency of routing (and connection management) to origin
– TTLB will show efficiency of delivery
Web Server Client CDN Node
Web application • If CDN also for whole site – Sample of key HTML pages, delivered from origin – TTFB will show efficiency of routing (and connection management) to origin
– TTLB will show efficiency of delivery
Web Server Client CDN Node CDN Node

Example: software download
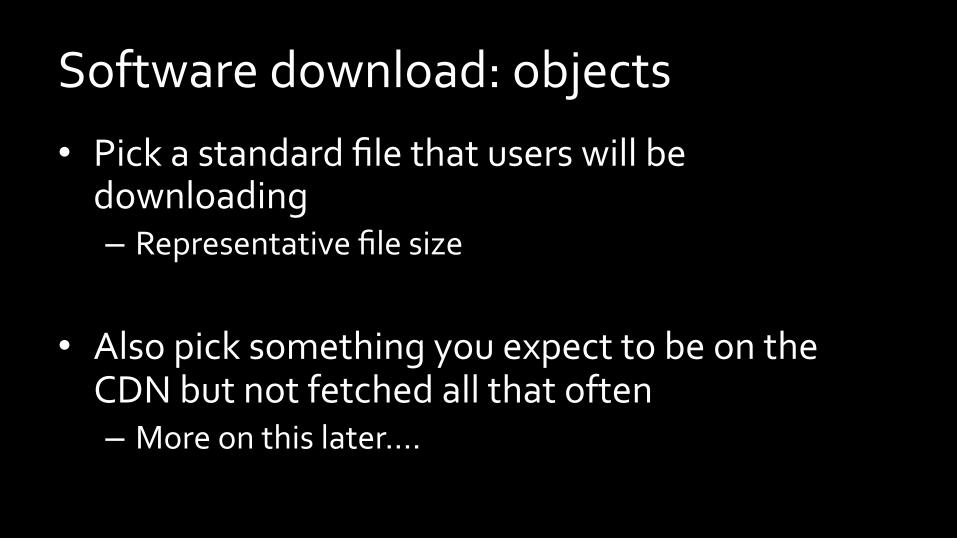
Software download: objects • Pick a standard file that users will be downloading – Representative file size
• Also pick something you expect to be on the CDN but not fetched all that often – More on this later….
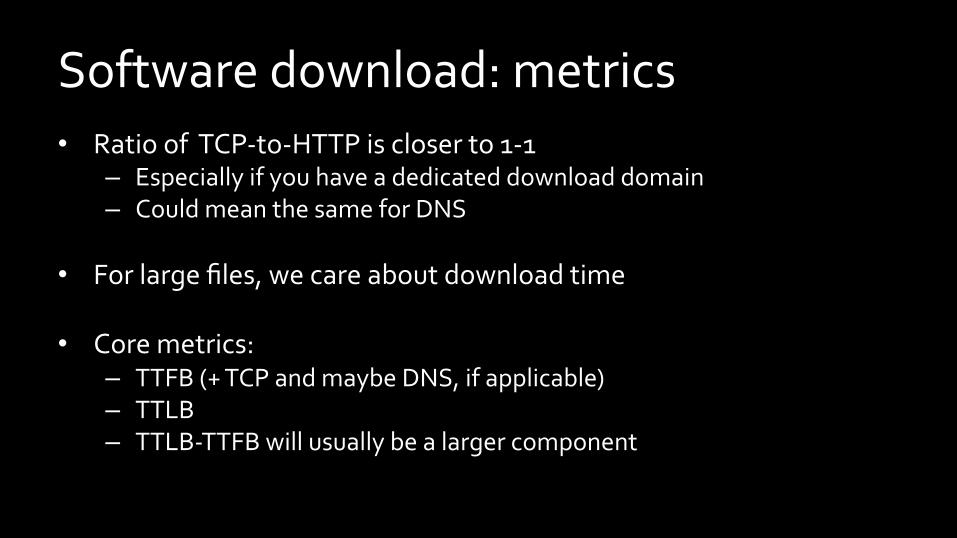
Software download: metrics • Ratio of TCP-‐to-‐HTTP is closer to 1-‐1
– Especially if you have a dedicated download domain – Could mean the same for DNS
• For large files, we care about download time
• Core metrics: – TTFB (+ TCP and maybe DNS, if applicable) – TTLB – TTLB-‐TTFB will usually be a larger component

Bandwidth/Download measurements

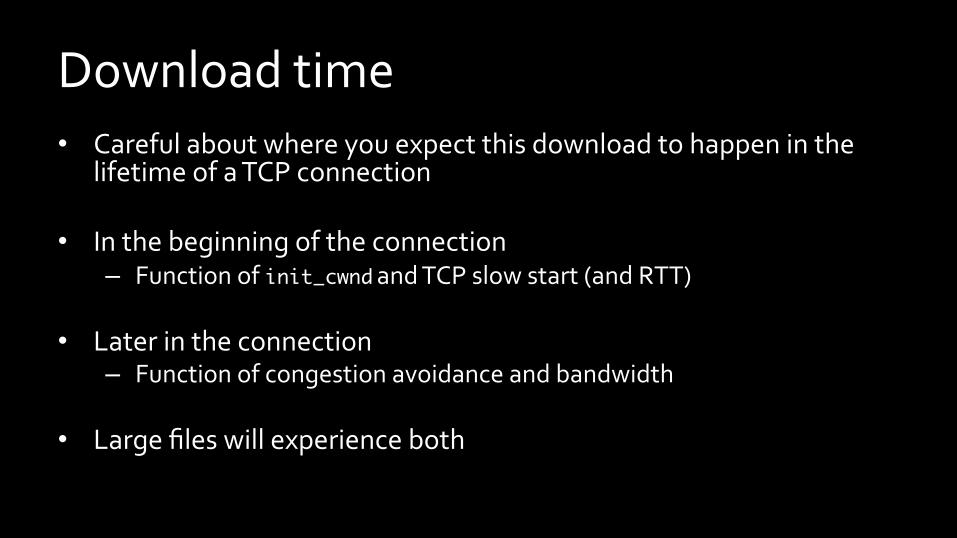
Download time • Careful about where you expect this download to happen in the
lifetime of a TCP connection
• In the beginning of the connection – Function of init_cwnd and TCP slow start (and RTT)
• Later in the connection – Function of congestion avoidance and bandwidth
• Large files will experience both
time
bytes
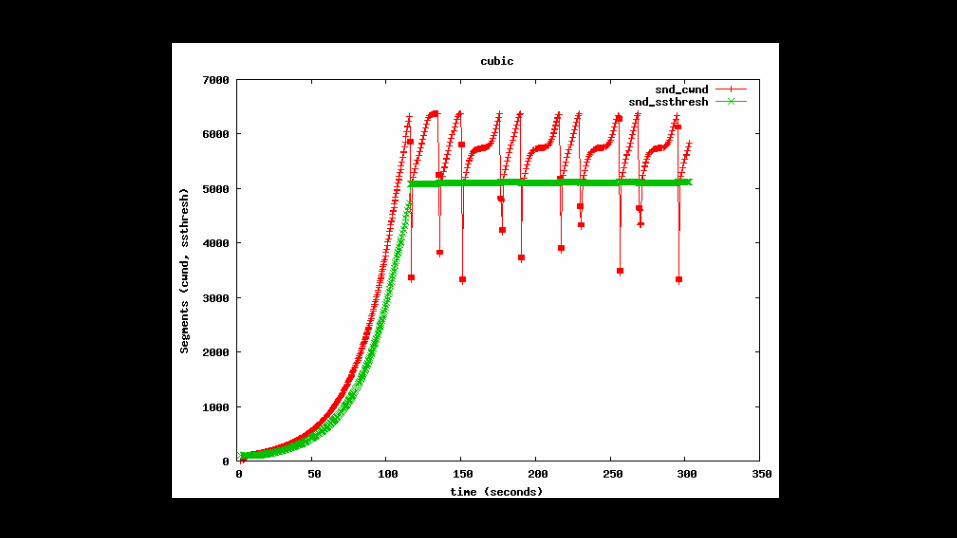
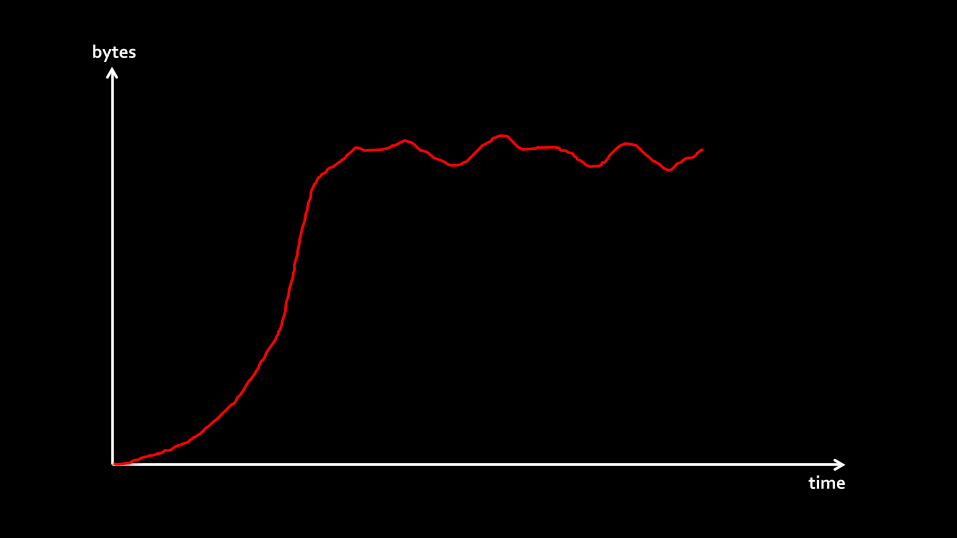
Download time • Careful about where you expect this download to happen in the
lifetime of a TCP connection
• In the beginning of the connection – Function of init_cwnd and TCP slow start (and RTT)
• Later in the connection – Function of congestion avoidance and bandwidth
• Large files will experience both

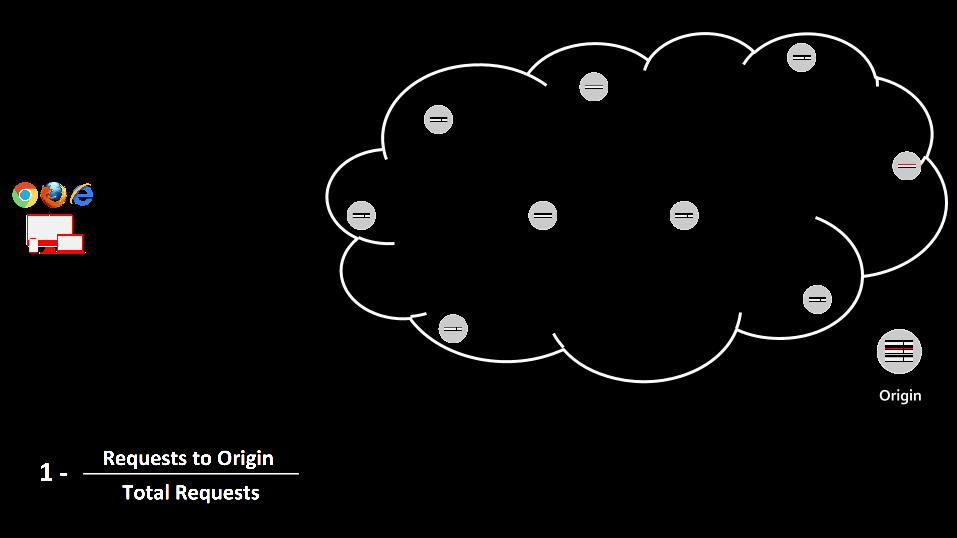
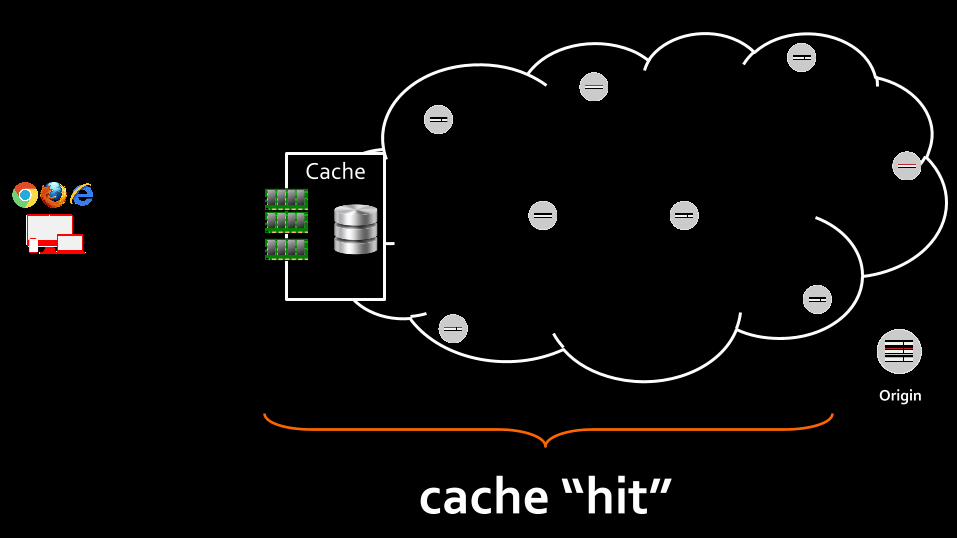
Cache hit ratios

Cache hit ratio: traditional calculation
1 -‐ Requests to Origin
Total Requests
Origin

Origin
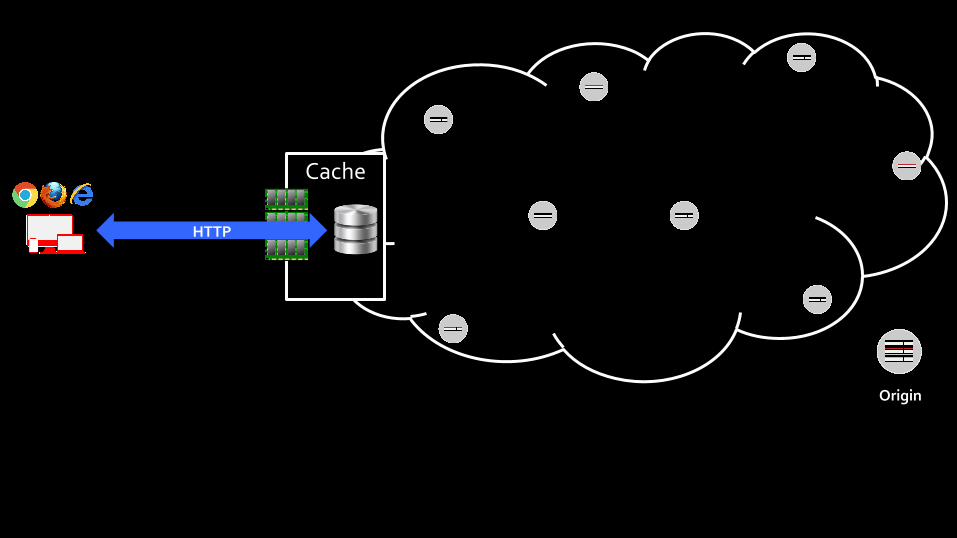
Cache

TCP
Origin
Cache

HTTP
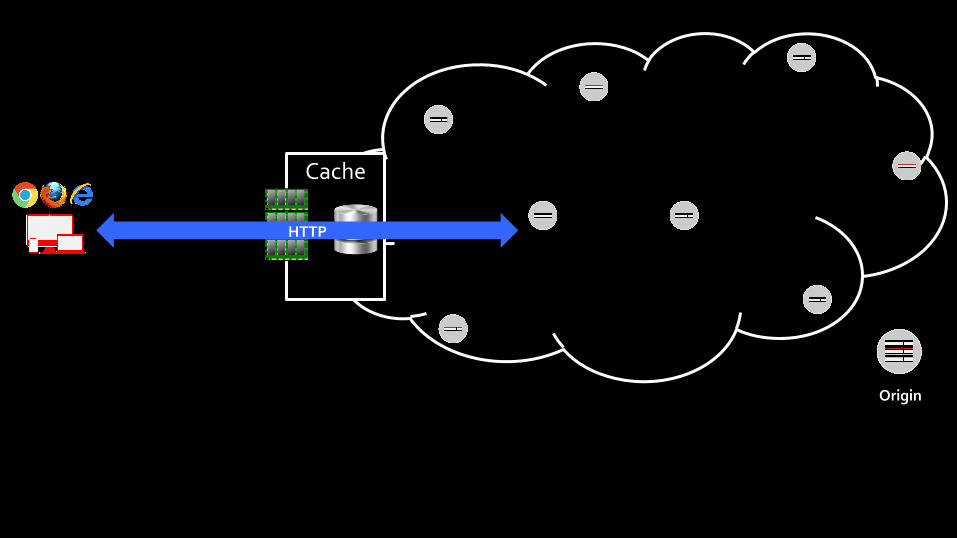
Origin
Cache

Origin
Cache
HTTP
Origin
Cache
HTTP

Origin
Cache
HTTP
Origin
Cache
HTTP

Origin
Cache
HOT COLD
Origin
Cache
cache “hit”

Cache hit ratio: traditional calculation
1 -‐ Requests to Origin
Total Requests

Isn’t this better?
Hits
Total Requests @edge
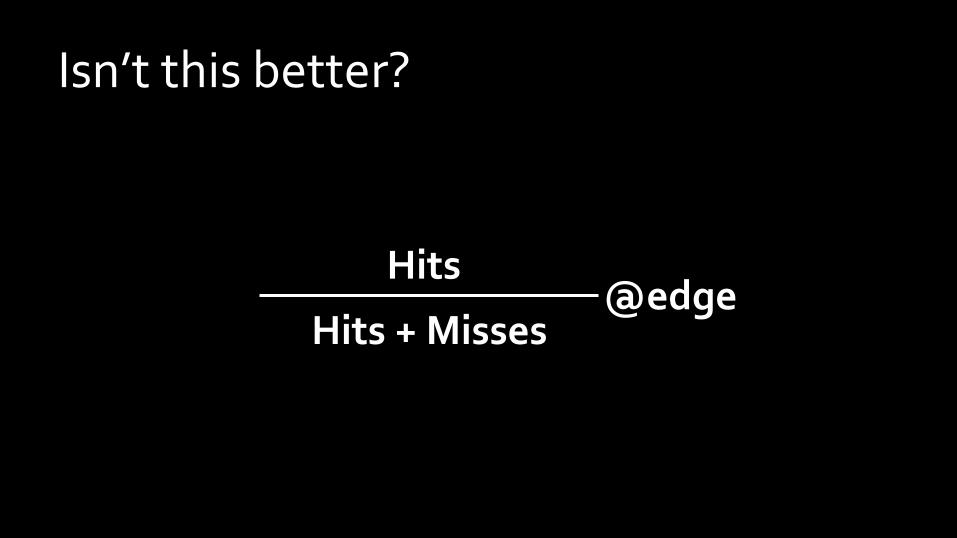
Isn’t this better?
Hits
Hits + Misses @edge
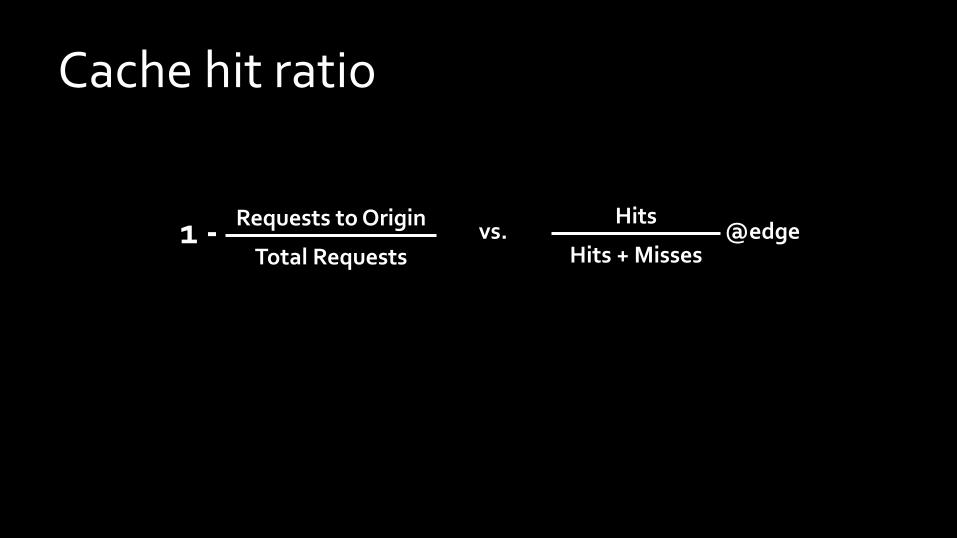
Cache hit ratio
vs. 1 -‐ Requests to Origin
Total Requests
Hits
Hits + Misses @edge
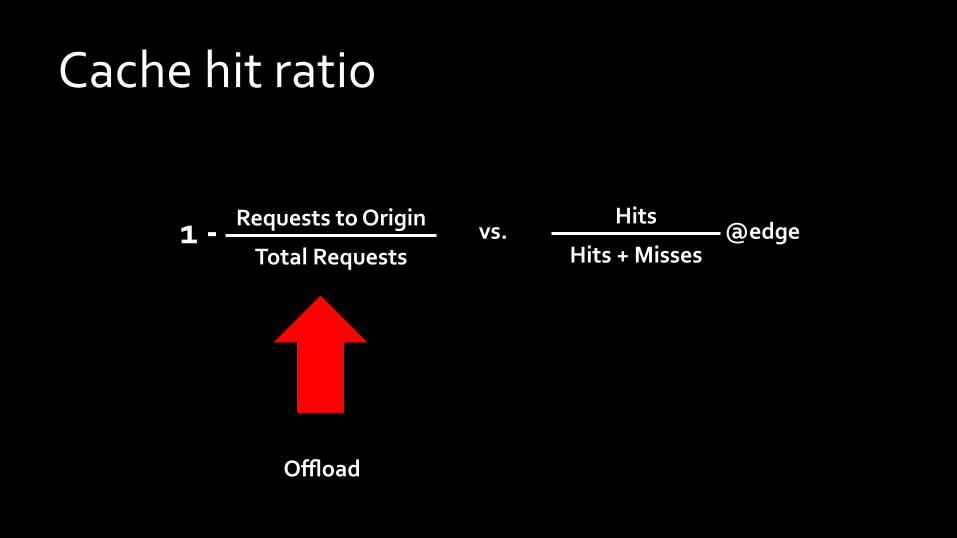
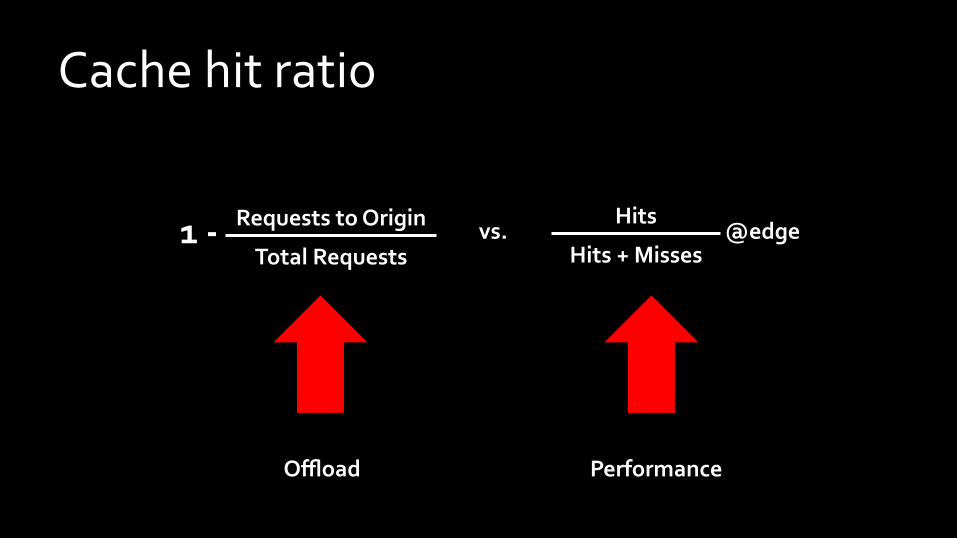
Cache hit ratio
vs. 1 -‐ Requests to Origin
Total Requests
Hits
Hits + Misses @edge
Offload
Cache hit ratio
vs. 1 -‐ Requests to Origin
Total Requests
Hits
Hits + Misses @edge
Offload Performance

Effect on long tail content

Effect on long tail content
(long tail: Cacheable but seldom fetched)
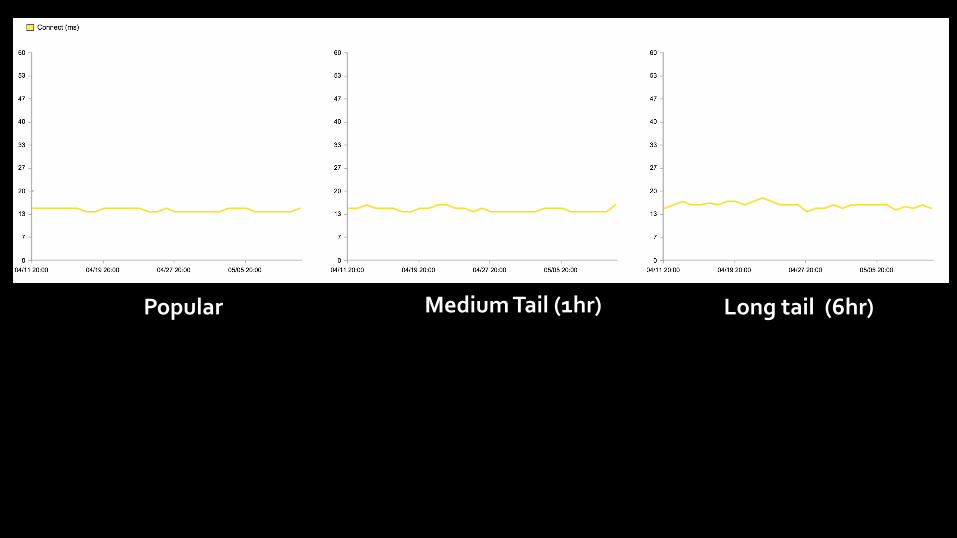
Popular Medium Tail (1hr) Long tail (6hr)
Popular Medium Tail (1hr) Long tail (6hr)
Connect (median)
Popular 14msec
1hr Tail 15msec
6hr Tail 16msec

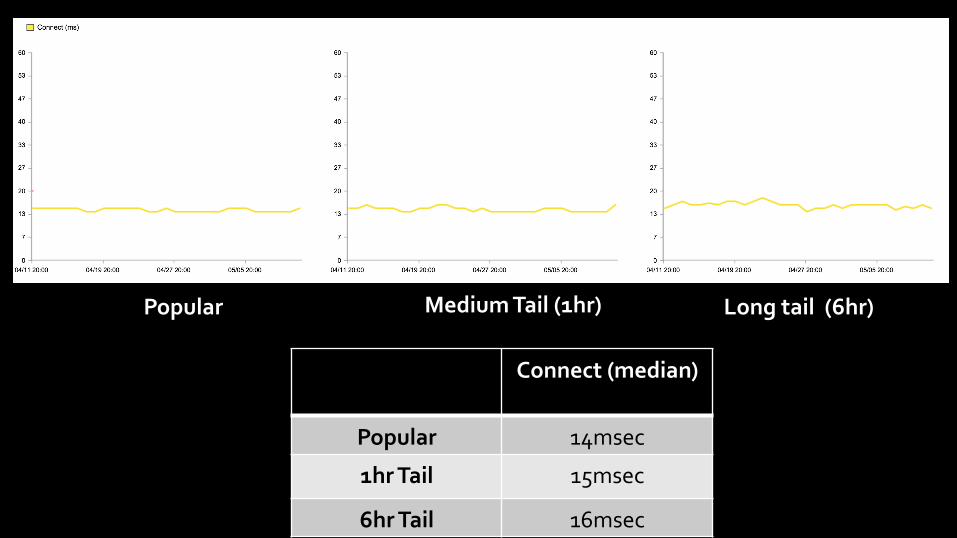
Popular Medium Tail (1hr) Long tail (6hr)
Connect (median)
Popular 14msec
1hr Tail 15msec
6hr Tail 16msec 6,400+ measurements
77,000+ measurements
38,000+ measurements
Popular Medium Tail (1hr) Long tail (6hr)
Connect (median)
Popular 14msec
1hr Tail 15msec
6hr Tail 16msec 6,400+ measurements
77,000+ measurements
38,000+ measurements

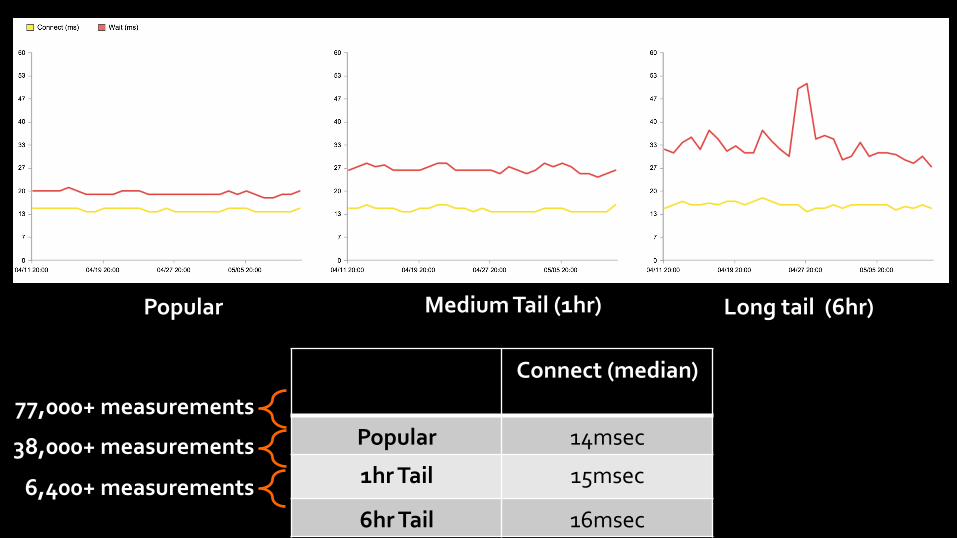
Popular Medium Tail (1hr) Long tail (6hr)
Connect (median) Wait (median)
Popular 14msec 19msec
1hr Tail 15msec 26msec
6hr Tail 16msec 32msec 6,400+ measurements
77,000+ measurements
38,000+ measurements

Popular Medium Tail (1hr) Long tail (6hr)
Isn’t this better?

Now…

Does all this really matter?

Does all this really matter?
Yes, but…


The bigger picture
• It’s really easy to lock in on a metric
• Performance absolutely matters
• True performance isn’t always as easy to measure

Storage model and long tail content

Cache hit ratios for offload and performance

Footprint

HTTP vs TLS footprint

Caching something you didn’t think you could cache

Serve stale content if necessary
Key takeaways • Everything is application-‐dependent
– Evaluate how your application works and what impacts performance the most
• Don’t get locked into a single number
• Always know your application performance and bottlenecks
• Be mindful of the bigger picture!


![cours logistique Enicarthage · 2015. 10. 24. · think it is correct or wrong. (A) C] Correct Wrong (B) Correct Wrong Wrong (D) [2 Correct Wrong a (B) a (D) a Follow up: With your](https://static.fdocument.pub/doc/165x107/60d6b767f5df8b53991a3a77/cours-logistique-enicarthage-2015-10-24-think-it-is-correct-or-wrong-a-c.jpg)