Measurement Significant Figures Error and Uncertainty Data...
107
Introduction 绪 论
Transcript of Measurement Significant Figures Error and Uncertainty Data...

Introduction绪 论
zhidi
附注
“zhidi”设置的“Marked”
zhidi
文本框
此资料来源于互联网! 转载请注明
zhidi
文本框
http://wlsyzx.whu.edu.cn/
Measurement
Significant Figures
Error and Uncertainty
Data processing 数据处理
测量
有效数字
误差及不确定度
Measurement测 量
Physical quantities物理量
All the quantities describing states or movements of the matter are called physical quantities.
The value of physical quantities can be determined throughmeasurement.

What is measurement?
Measurement of the physical quantity is a fundamental operation of physical experiments. In fact measuring is a direct or indirect quantitative comparison between the physical quantity of the object to be measured and the one selected to be standard measuring unit through specified method with some devices.

DirectMeasurement
EqualObservation
IndirectMeasurement
UnequalObservation
MeasurementMeasurement
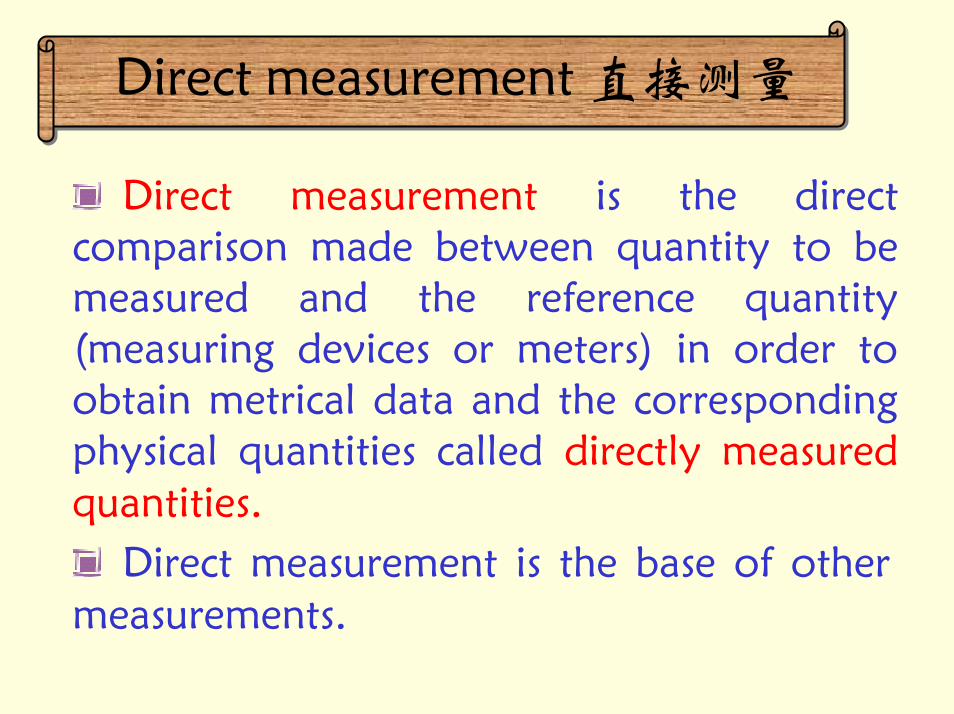
Direct measurement 直接测量
Direct measurement is the direct comparison made between quantity to be measured and the reference quantity (measuring devices or meters) in order to obtain metrical data and the corresponding physical quantities called directly measured quantities.
Direct measurement is the base of other measurements.
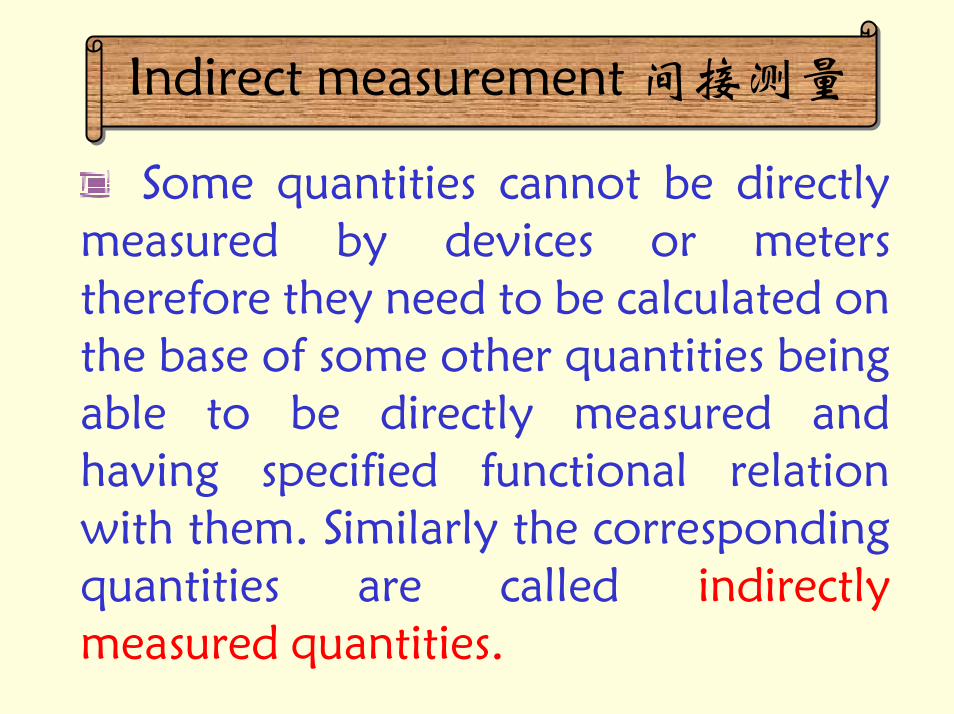
Indirect measurement 间接测量
Some quantities cannot be directly measured by devices or meters therefore they need to be calculated on the base of some other quantities being able to be directly measured and having specified functional relation with them. Similarly the corresponding quantities are called indirectly measured quantities.
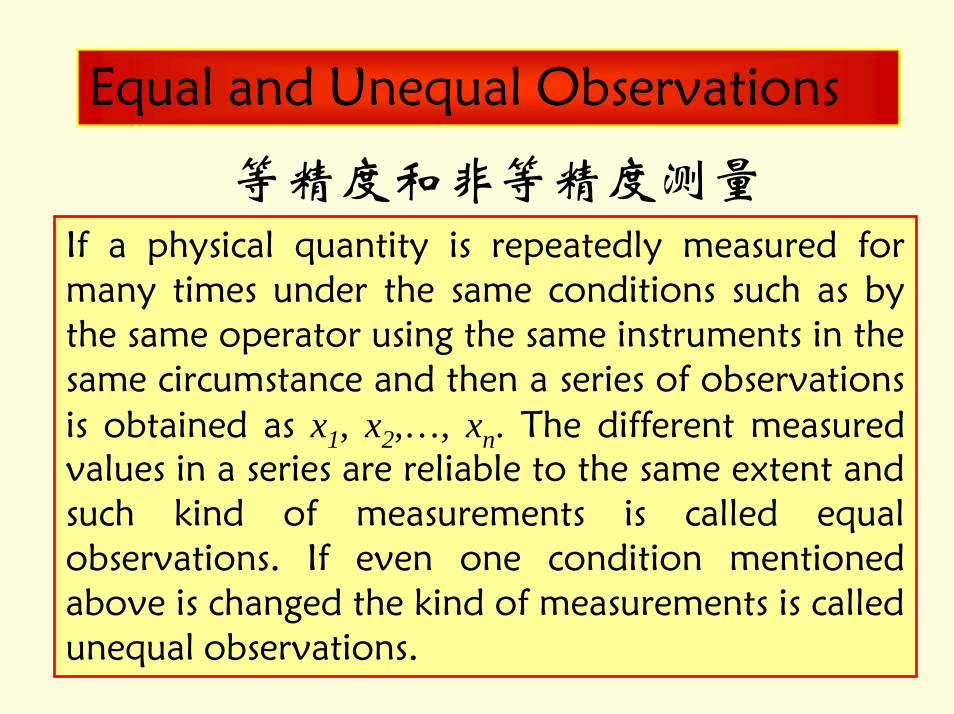
Equal and Unequal Observations
等精度和非等精度测量If a physical quantity is repeatedly measured for many times under the same conditions such as by the same operator using the same instruments in the same circumstance and then a series of observations is obtained as x1, x2,…, xn. The different measured values in a series are reliable to the same extent and such kind of measurements is called equal observations. If even one condition mentioned above is changed the kind of measurements is called unequal observations.
Methods for Measurements 测量方法
Relative method 比较法
Compensatory approach 补偿法
Measurement by magnification 放大法
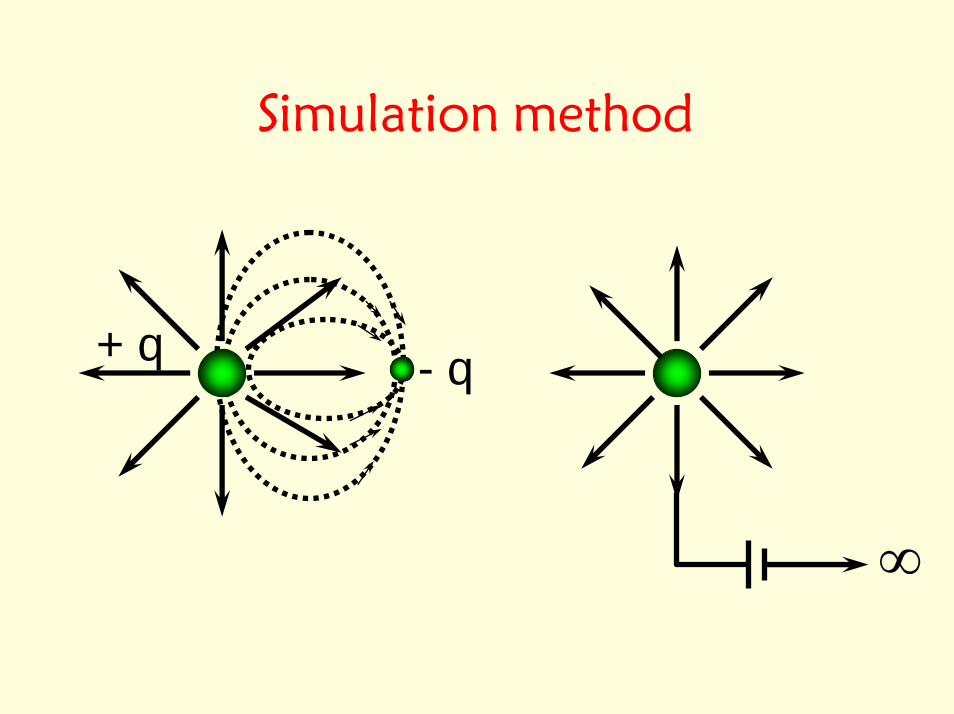
Simulation method
Conversion method
Interferometry
Electric means for non-electric quantity
Optical means for non-optical quantity
模拟法
转换法
干涉计量
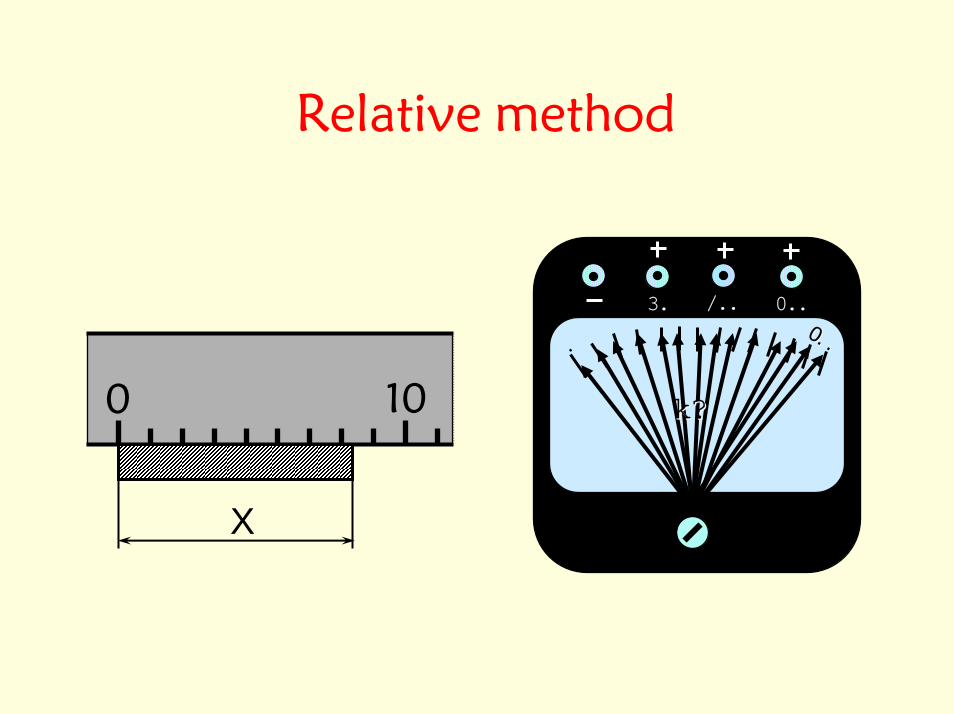
Relative method
5050 100100 200200
mAmA
0
200200
X
0 10

Compensatory approach
I=0
Ex
E0
I=0
Ex
E0
Ex=E0 Ex<E0
I=0
Ex
E0Ex>E0
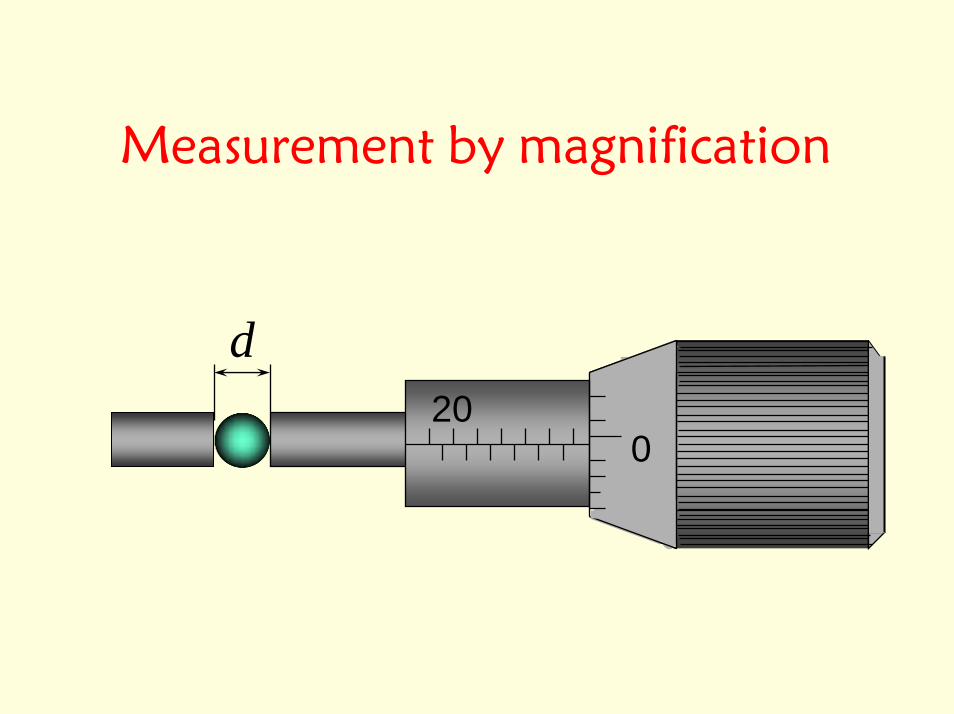
Measurement by magnification
200
d
Simulation method
+ q - q
∞
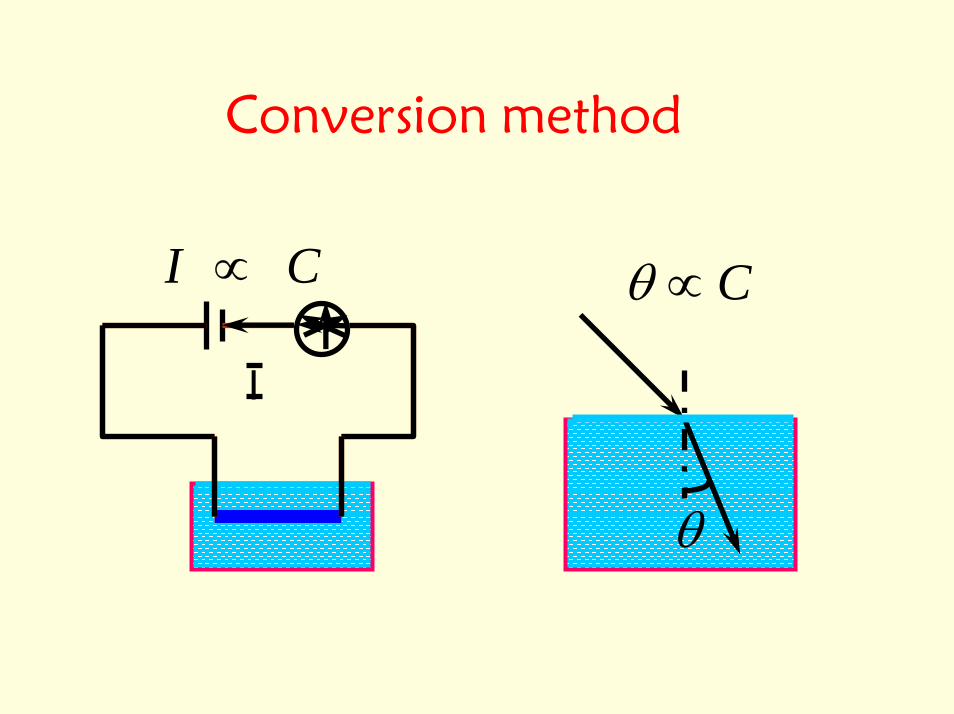
Conversion method
I
I C∝ θ ∝ C
θ

The measurement of the stress distribution of the driver’s seat using piezoelectric sensor.
Drying apparatus
′II0
FF
GrainGrainBelt conveyer
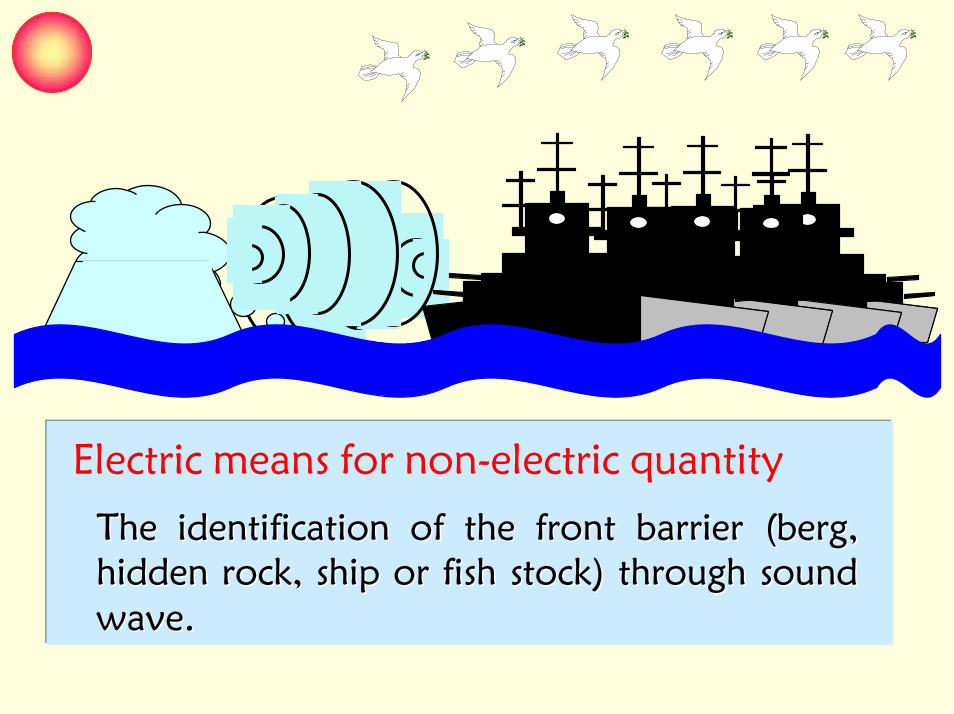
The identification of the front barrier (berg, The identification of the front barrier (berg, hidden rock, ship or fish stock) through sound hidden rock, ship or fish stock) through sound wave.wave.
Electric means for non-electric quantity
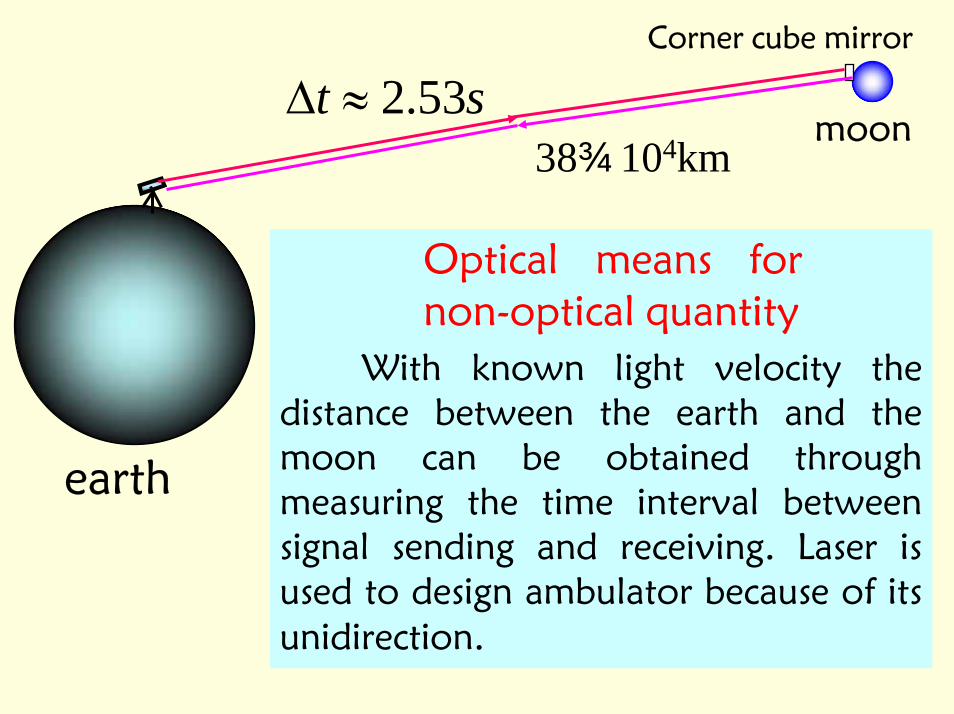
Corner cube mirror
Optical means for non-optical quantity
moon
With known light velocity the distance between the earth and the moon can be obtained through measuring the time interval between signal sending and receiving. Laser is used to design ambulator because of its unidirection.
st 53.2≈∆38×104km
earth
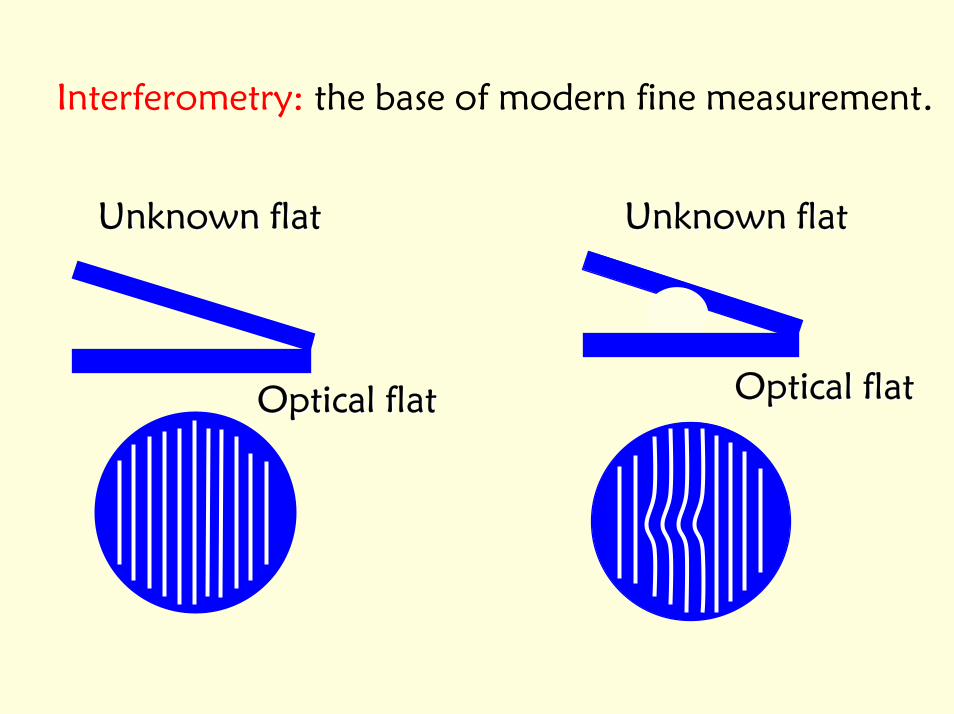
Interferometry: the base of modern fine measurement.
Unknown flatUnknown flat
Optical flatOptical flat
Unknown flatUnknown flat
Optical flatOptical flat

Significant Figures有效数字
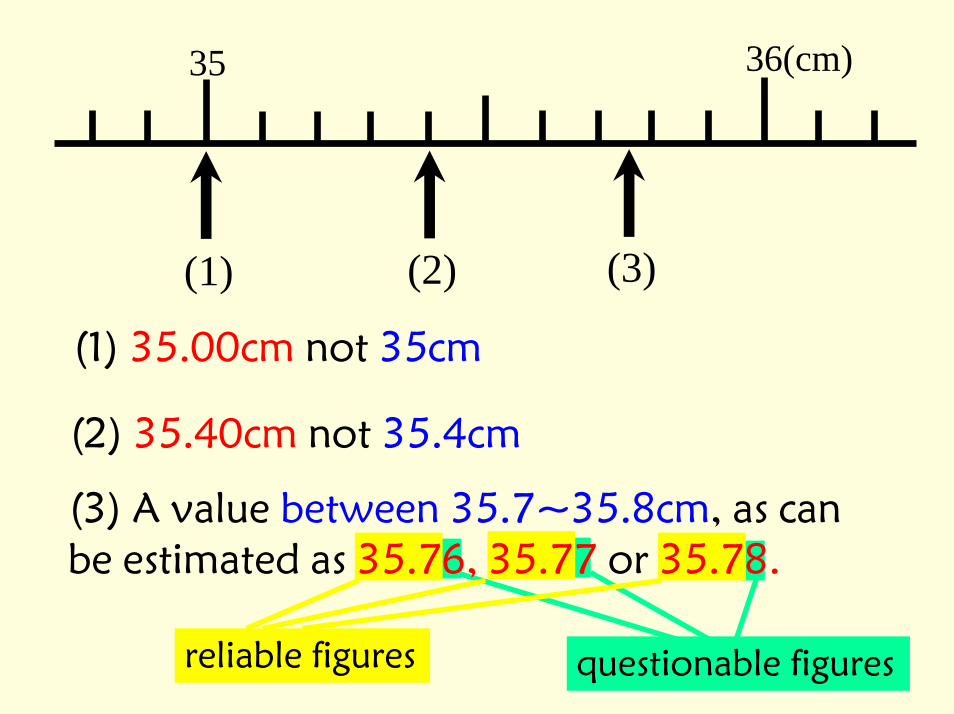
35 36(cm)
(2) (3)(1)
(1) 35.00cm not 35cm
(2) 35.40cm not 35.4cm
questionable figuresreliable figures
(3) A value between 35.7‾35.8cm, as can be estimated as 35.76, 35.77 or 35.78.
questionable questionable figuresfigures
存疑数字存疑数字
reliable figuresreliable figures可靠数字可靠数字
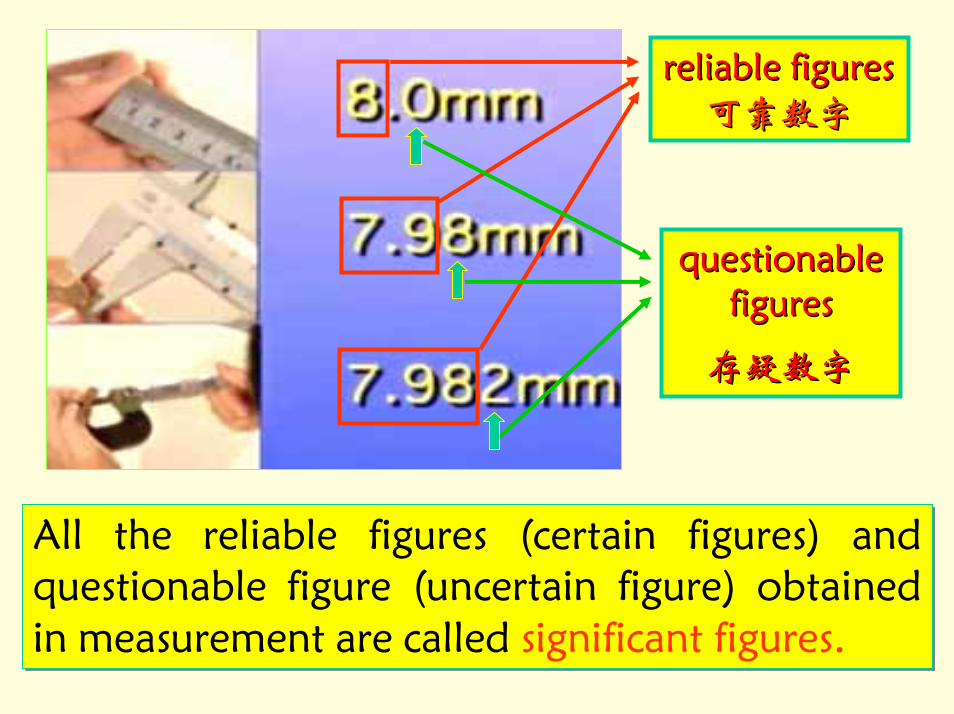
All the reliable figures (certain figures) and questionable figure (uncertain figure) obtained in measurement are called significant figures.
All the reliable figures (certain figures) and questionable figure (uncertain figure) obtained in measurement are called significant figures.
A note on significant figures
对有效数字的说明
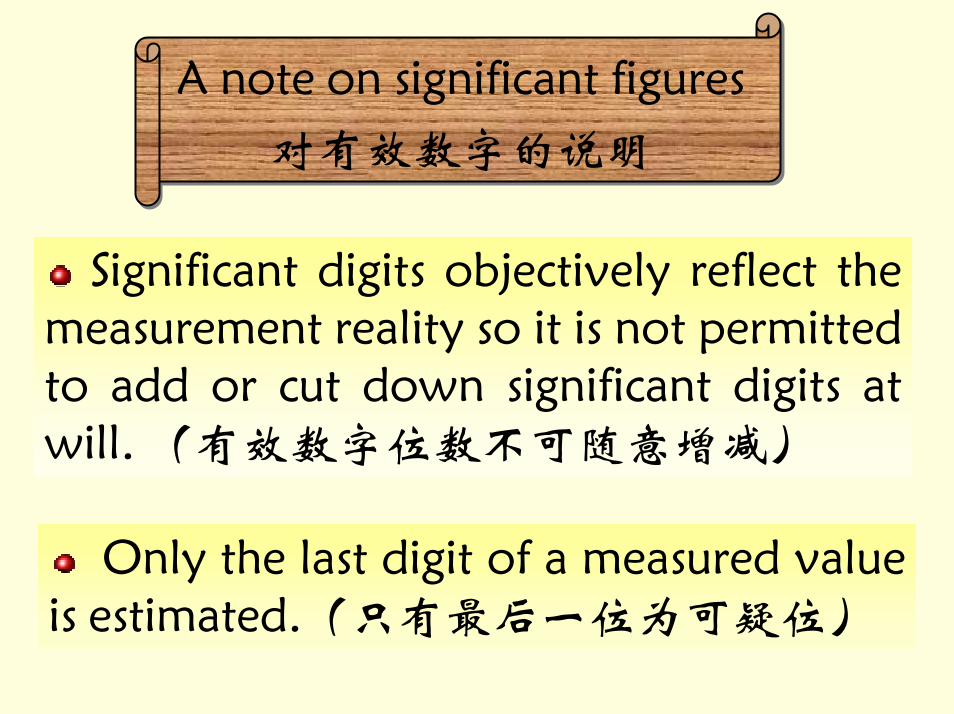
Significant digits objectively reflect the measurement reality so it is not permitted to add or cut down significant digits at will. (有效数字位数不可随意增减)
Only the last digit of a measured value is estimated.(只有最后一位为可疑位)
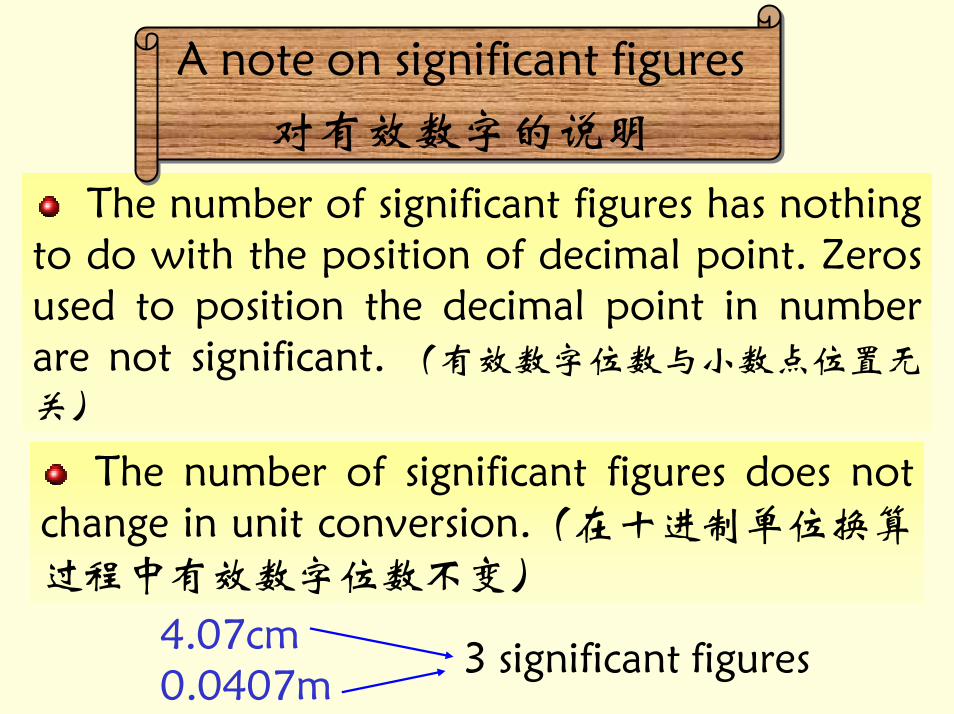
The number of significant figures has nothing to do with the position of decimal point. Zeros used to position the decimal point in number are not significant. (有效数字位数与小数点位置无关)
A note on significant figures
对有效数字的说明
4.07cm0.0407m
3 significant figures
The number of significant figures does not change in unit conversion.(在十进制单位换算过程中有效数字位数不变)
A note on significant figures
对有效数字的说明
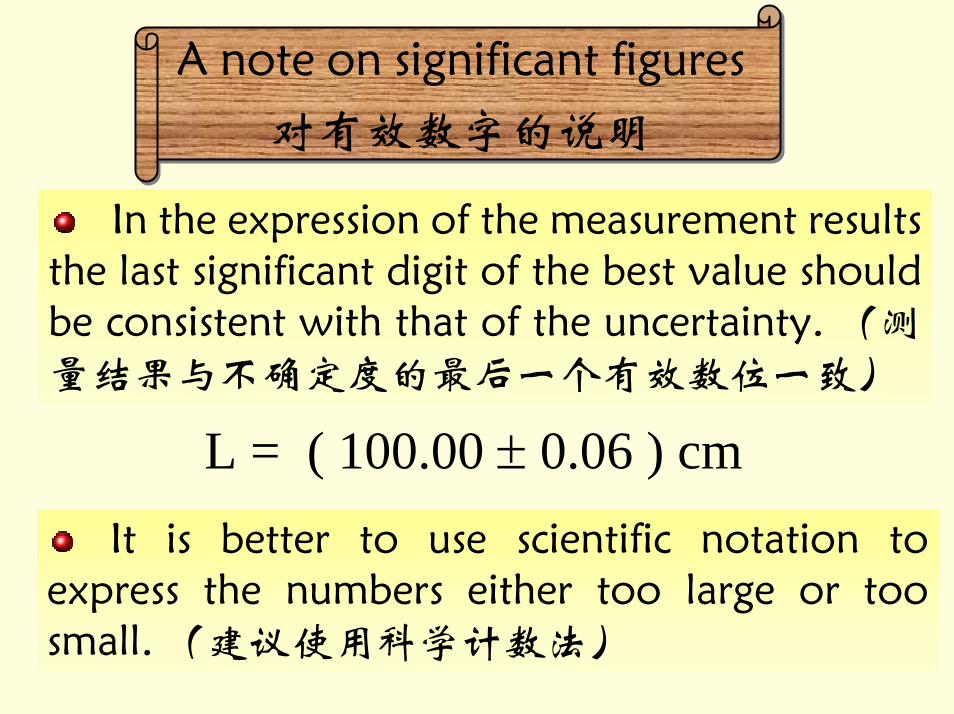
In the expression of the measurement results the last significant digit of the best value should be consistent with that of the uncertainty. (测量结果与不确定度的最后一个有效数位一致)
L = ( 100.00 ± 0.06 ) cmIt is better to use scientific notation to
express the numbers either too large or too small. (建议使用科学计数法)
Scientific Notation 科学计数法
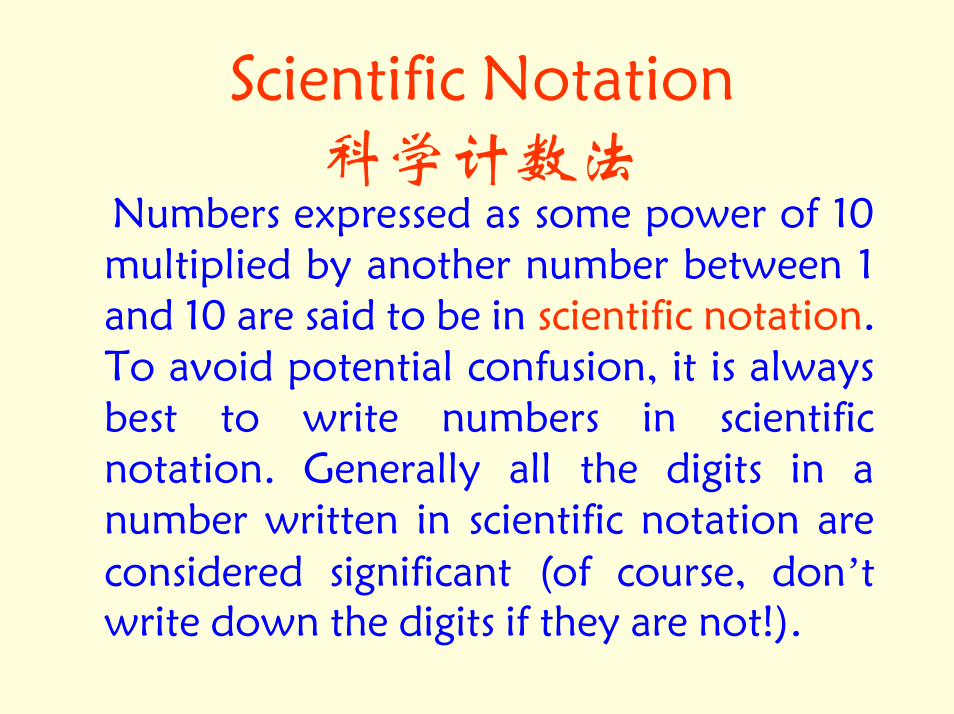
Numbers expressed as some power of 10 multiplied by another number between 1 and 10 are said to be in scientific notation. To avoid potential confusion, it is always best to write numbers in scientific notation. Generally all the digits in a number written in scientific notation are considered significant (of course, don’t write down the digits if they are not!).
Significant Figures in Calculation
有效数字运算规则
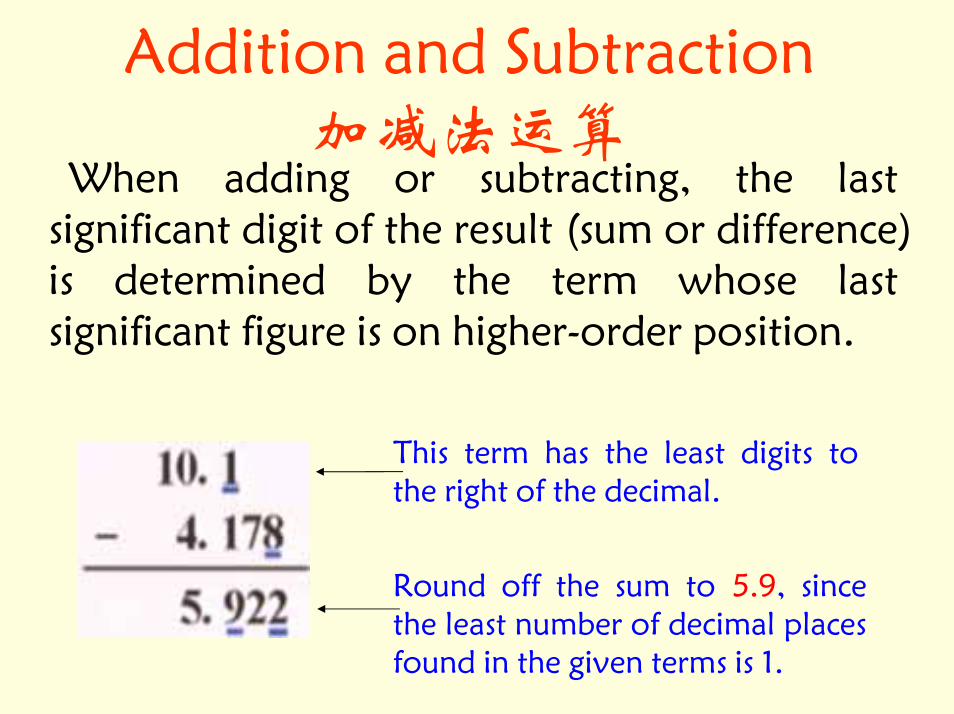
Addition and Subtraction 加减法运算
When adding or subtracting, the last significant digit of the result (sum or difference) is determined by the term whose last significant figure is on higher-order position.
This term has the least digits to the right of the decimal.
Round off the sum to 5.9, since the least number of decimal places found in the given terms is 1.
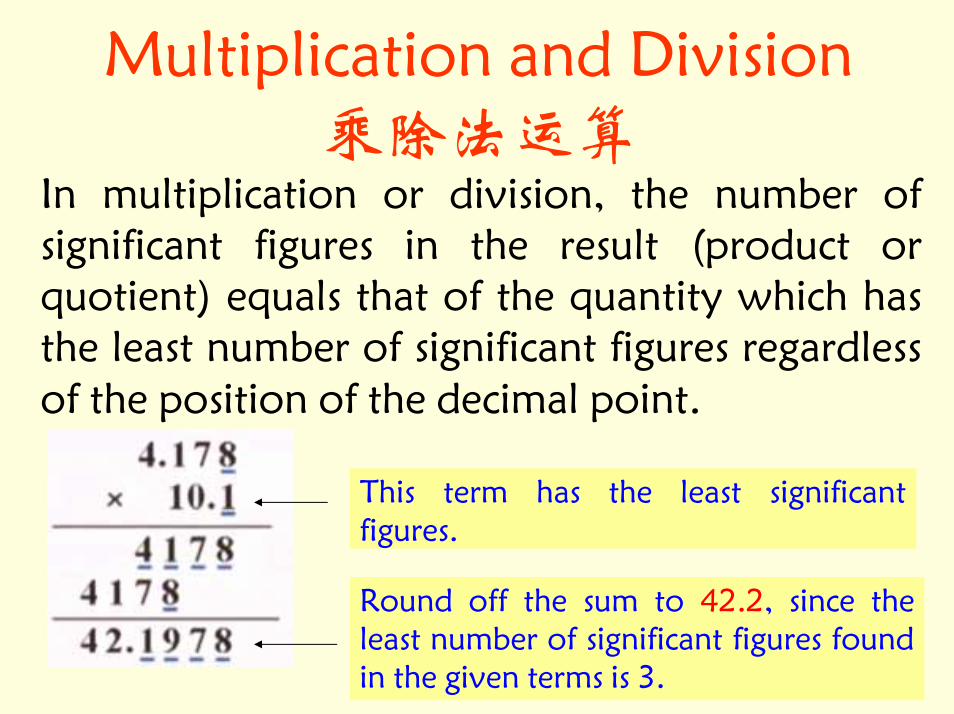
Multiplication and Division乘除法运算
In multiplication or division, the number of significant figures in the result (product or quotient) equals that of the quantity which has the least number of significant figures regardless of the position of the decimal point.
This term has the least significant figures.
Round off the sum to 42.2, since the least number of significant figures found in the given terms is 3.
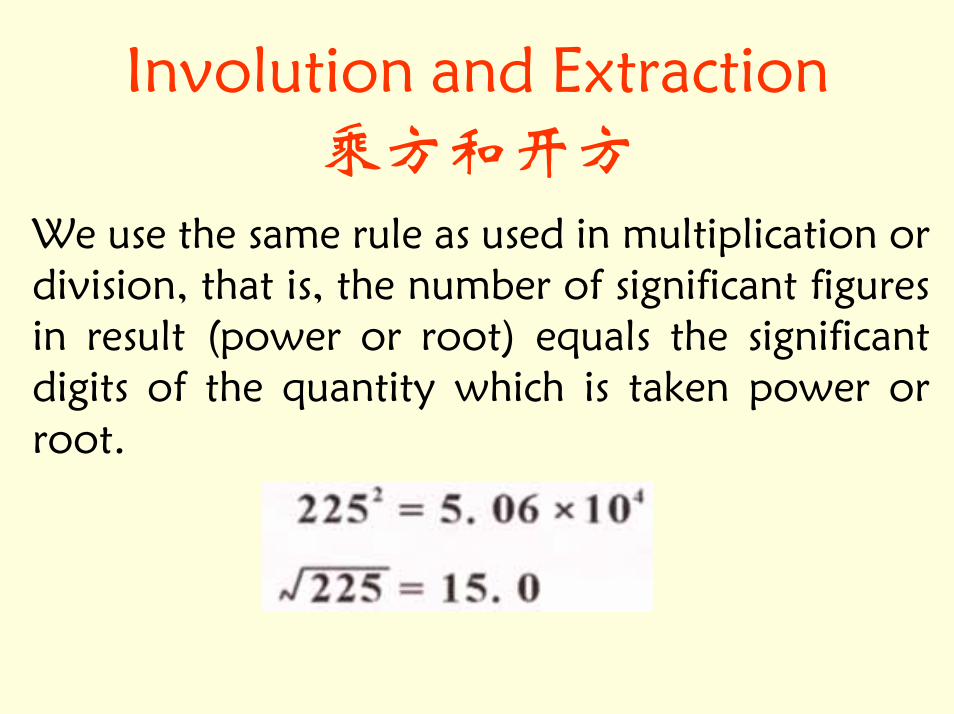
Involution and Extraction乘方和开方
We use the same rule as used in multiplication or division, that is, the number of significant figures in result (power or root) equals the significant digits of the quantity which is taken power or root.

Trigonometric Function三角函数
In the calculation of trigonometric function, when we change the questionable (uncertain) digit in the independent variable the digit which changes most in the result is the last digit to be retained.
90.500755550330sin80.500503740230sin
'0
'0
=
=
The first different digit is the forth decimal place, so
0.50050230sin '0 =

Logarithm 对数运算When taking logarithms, retain in the mantissa
(the number to the right of the decimal point in the logarithm) the same number of significant figures as there are in the number whose logarithm is taken.

Exponent 指数运算
When taking exponential calculation, the number of decimal digits in the result equals the number of decimal digits in the index number.
314.9 1032.9 ×=e
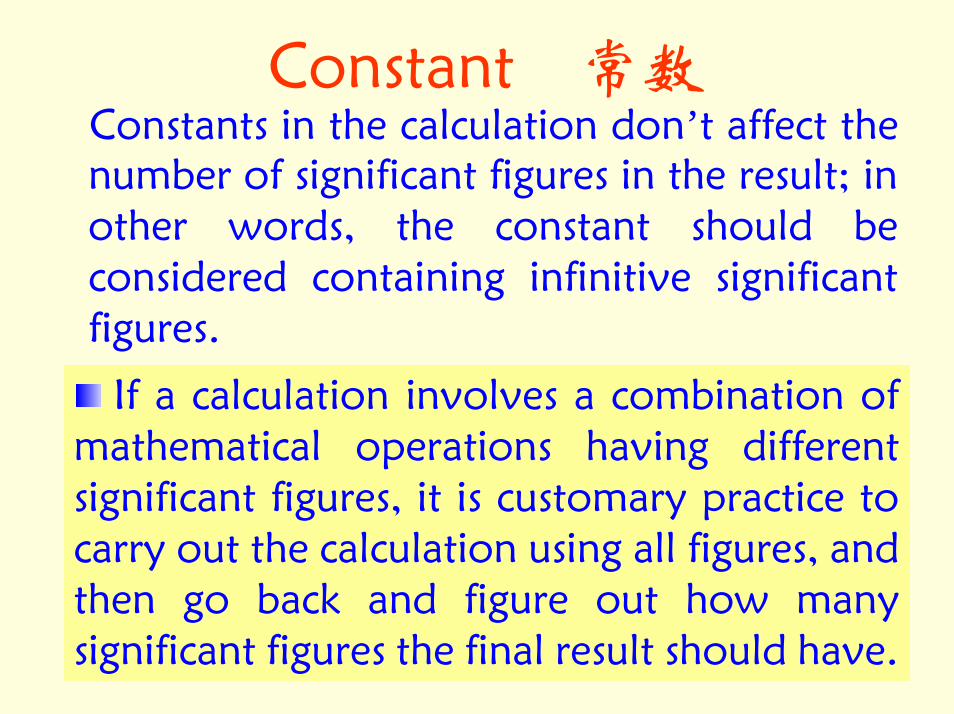
Constant 常数Constants in the calculation don’t affect the number of significant figures in the result; in other words, the constant should be considered containing infinitive significant figures.
If a calculation involves a combination of mathematical operations having different significant figures, it is customary practice to carry out the calculation using all figures, and then go back and figure out how many significant figures the final result should have.
Rules for Rounding Numbers
有效数字修约规则
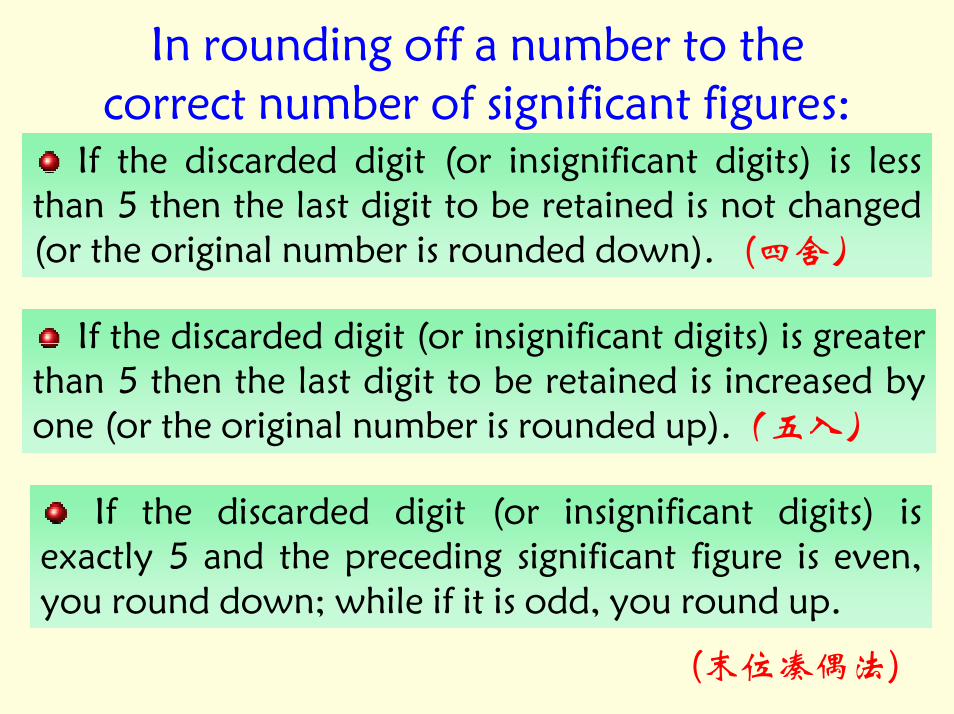
In rounding off a number to the correct number of significant figures:
If the discarded digit (or insignificant digits) is less than 5 then the last digit to be retained is not changed (or the original number is rounded down). (四舍)
If the discarded digit (or insignificant digits) is greater than 5 then the last digit to be retained is increased by one (or the original number is rounded up).(五入)
If the discarded digit (or insignificant digits) is exactly 5 and the preceding significant figure is even, you round down; while if it is odd, you round up.
(末位凑偶法)

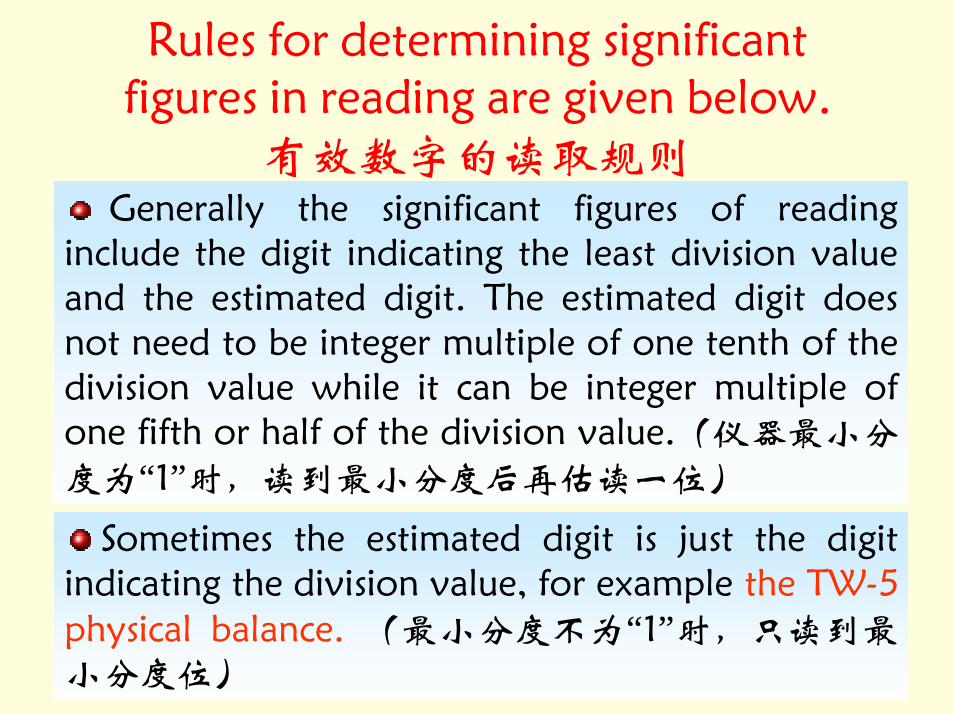
Rules for determining significant figures in reading are given below.
有效数字的读取规则Generally the significant figures of reading
include the digit indicating the least division value and the estimated digit. The estimated digit does not need to be integer multiple of one tenth of the division value while it can be integer multiple of one fifth or half of the division value.(仪器最小分度为“1”时,读到最小分度后再估读一位)
Sometimes the estimated digit is just the digit indicating the division value, for example the TW-5 physical balance. (最小分度不为“1”时,只读到最小分度位)
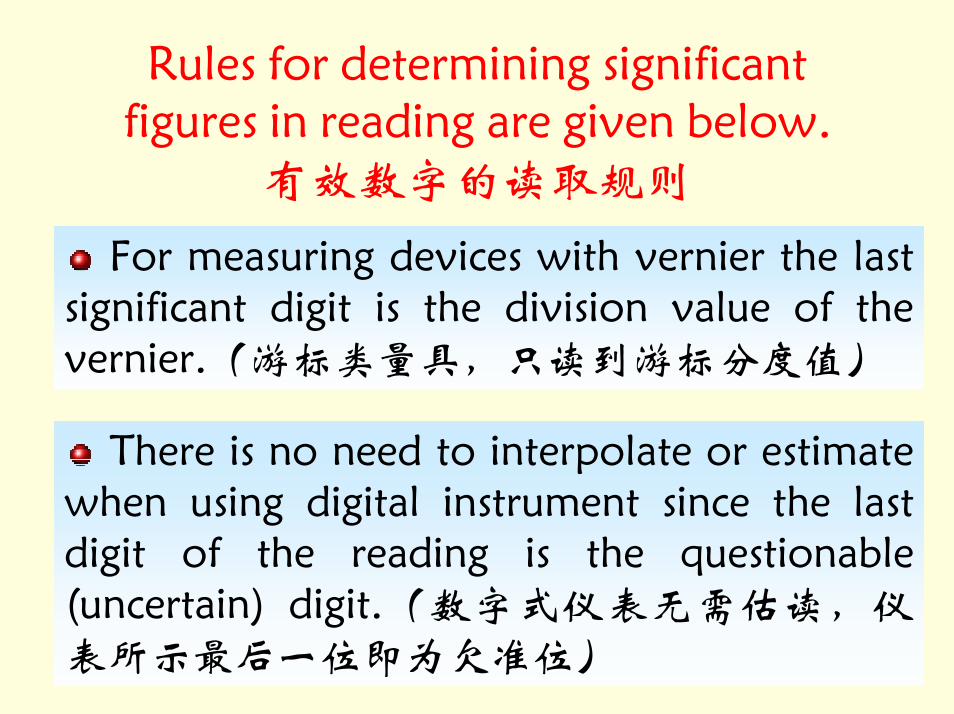
Rules for determining significant figures in reading are given below.
有效数字的读取规则
For measuring devices with vernier the last significant digit is the division value of the vernier.(游标类量具,只读到游标分度值)
There is no need to interpolate or estimate when using digital instrument since the last digit of the reading is the questionable (uncertain) digit.(数字式仪表无需估读,仪表所示最后一位即为欠准位)
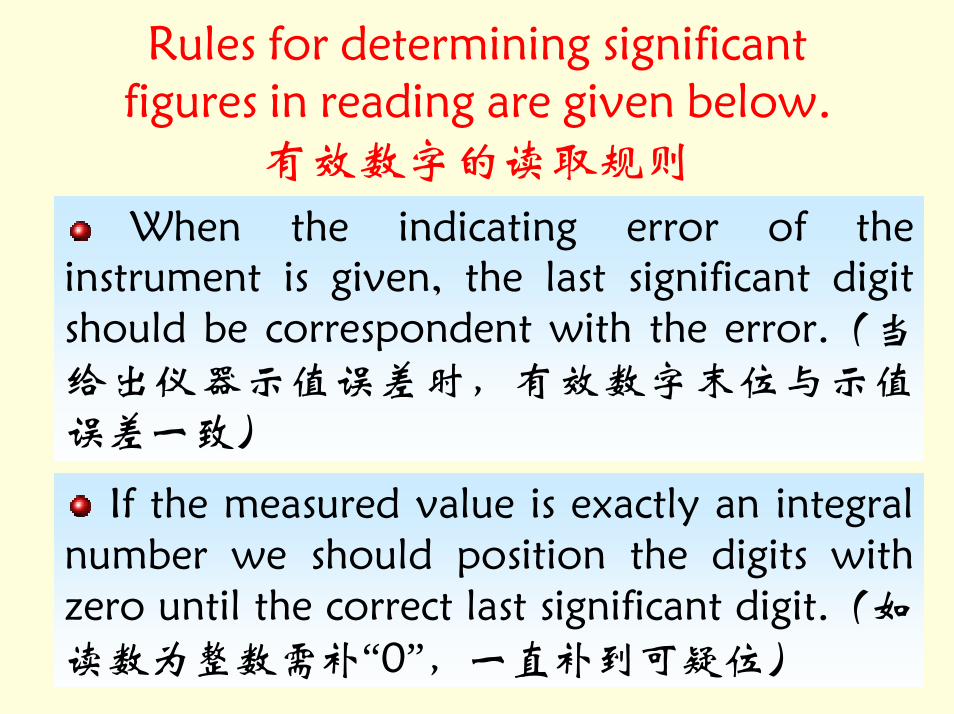
Rules for determining significant figures in reading are given below.
有效数字的读取规则
When the indicating error of the instrument is given, the last significant digit should be correspondent with the error.(当给出仪器示值误差时,有效数字末位与示值误差一致)
If the measured value is exactly an integral number we should position the digits with zero until the correct last significant digit.(如读数为整数需补“0”,一直补到可疑位)
Error 误差

ErrorError
Systematic Error系统误差Experimental
Error
实验误差 Random Error随机误差

Systematic errors系统误差
Systematic errors are those caused by the way in which the experiment was conducted. In other words, they are caused by the design of the system. Systematic errors cannot be eliminated by averaging. In principle, they can always be eliminated by changing the way in which the experiment was done. In actual fact though, you may not even know their existence.
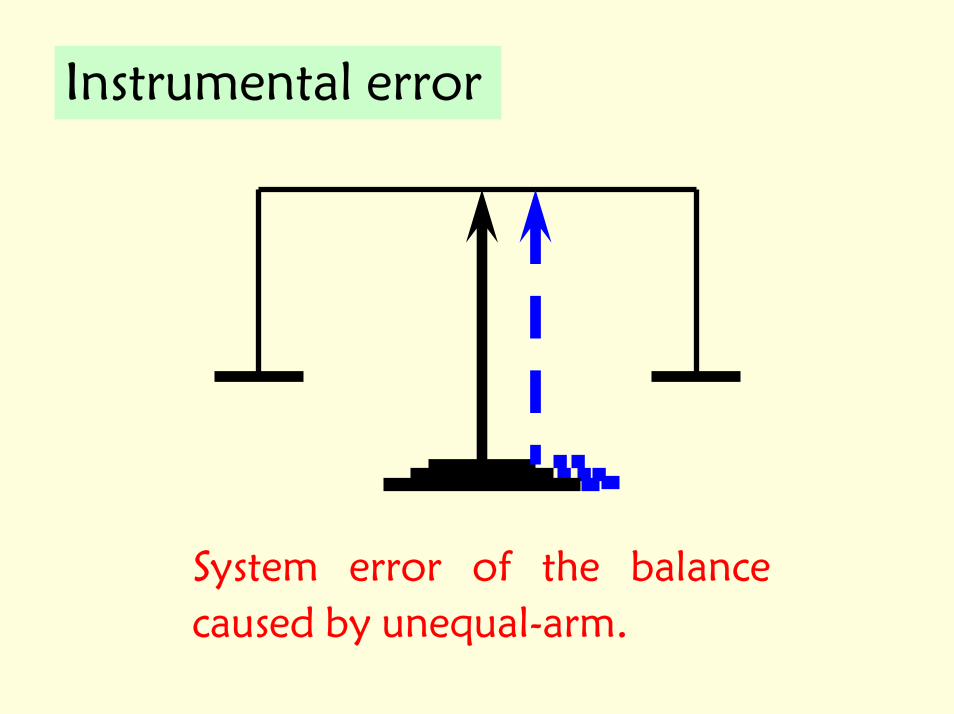
Instrumental error
System error of the balance
caused by unequal-arm.
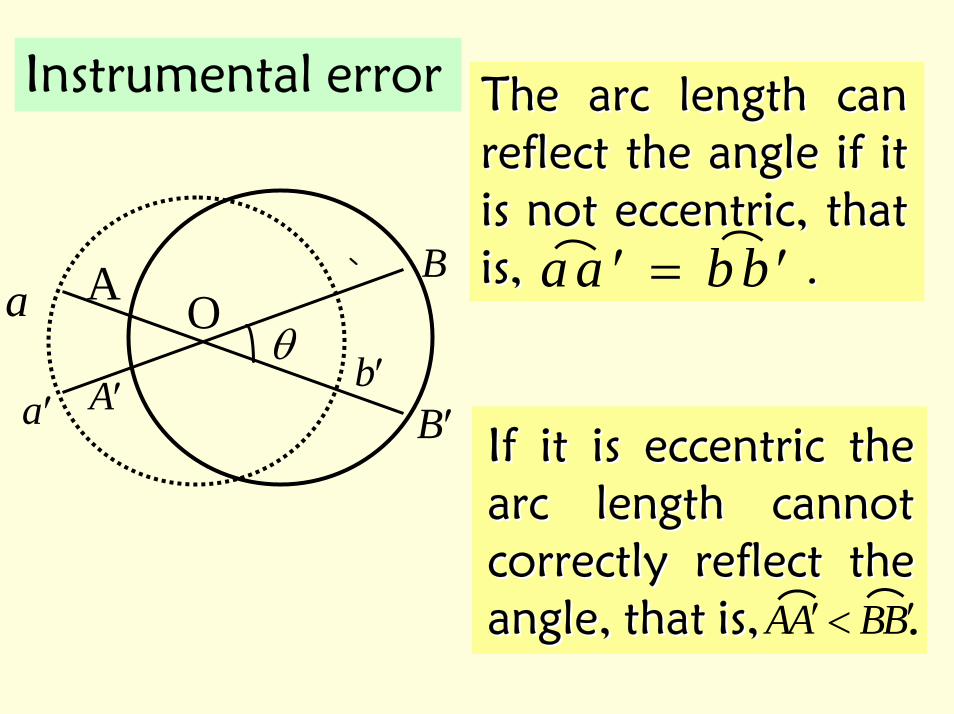
Instrumental error The arc length can The arc length can reflect the angle if it reflect the angle if it is not eccentric, that is not eccentric, that is,is, ..a a b b′ = ′A O
θ
′B′A′a
bb
′b
aB
If it is eccentric the If it is eccentric the arc length cannot arc length cannot correctly reflect the correctly reflect the angle, that is, angle, that is, BBAA ′<′ .
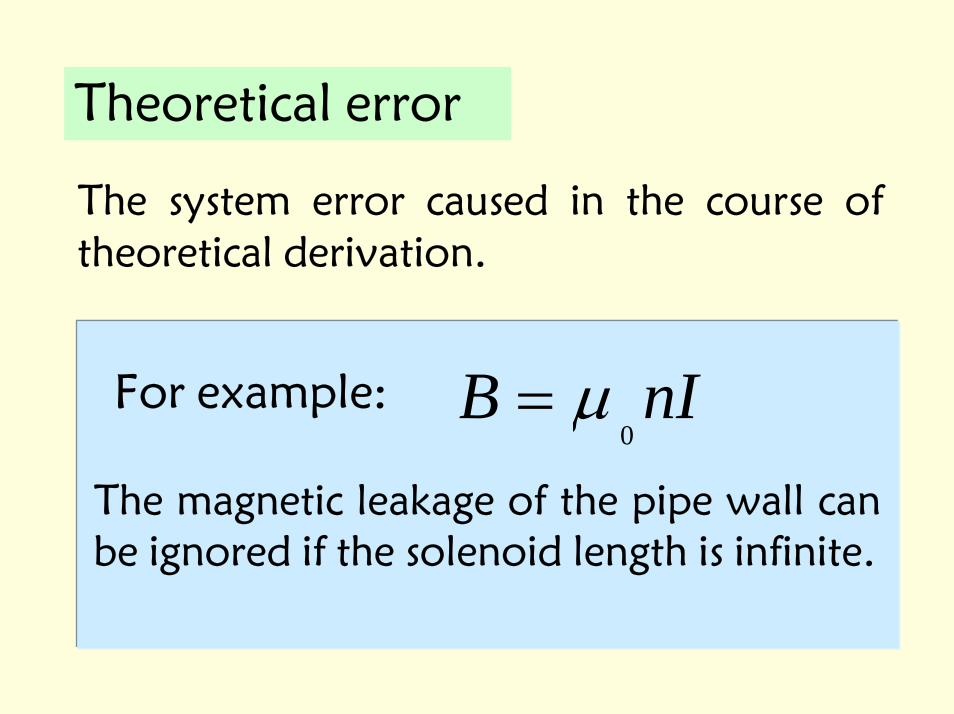
Theoretical error
The system error caused in the course of theoretical derivation.
nIB0
µ=The magnetic leakage of the pipe wall can be ignored if the solenoid length is infinite.
For example:
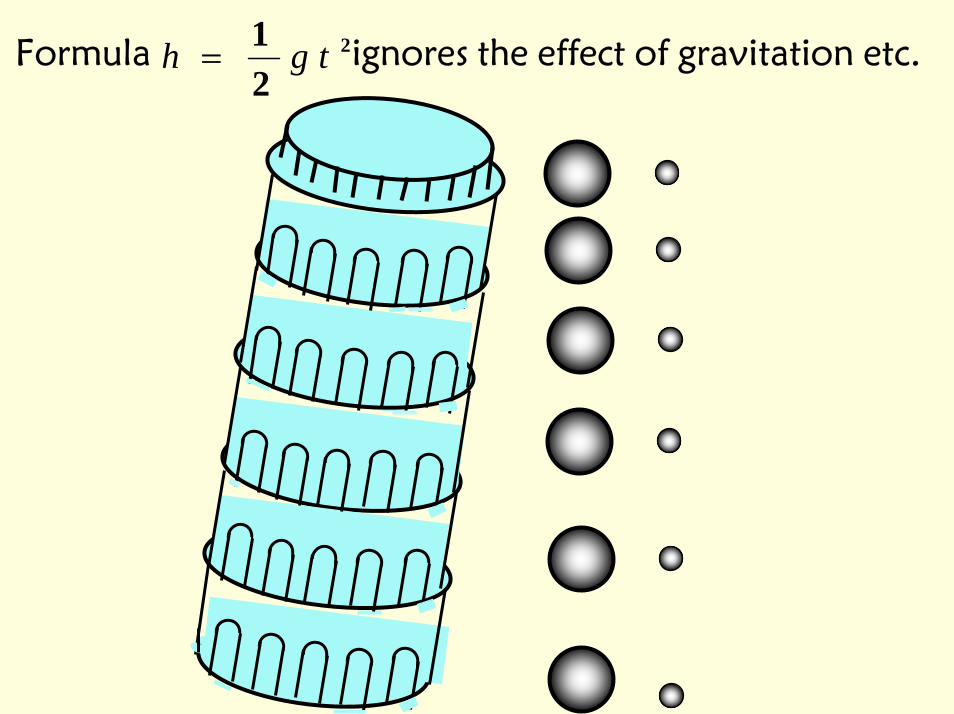
Formula ignores the effect of gravitation etc. h g t=12
2

Artificial error
Psychological effects: The higher or lower interpolation of the measured value.
Physiology effects
Audition
Smell sense
Color sense
Visual sense
The discrimination of gamut (20Hz‾20KHz).
The tone discrimination.
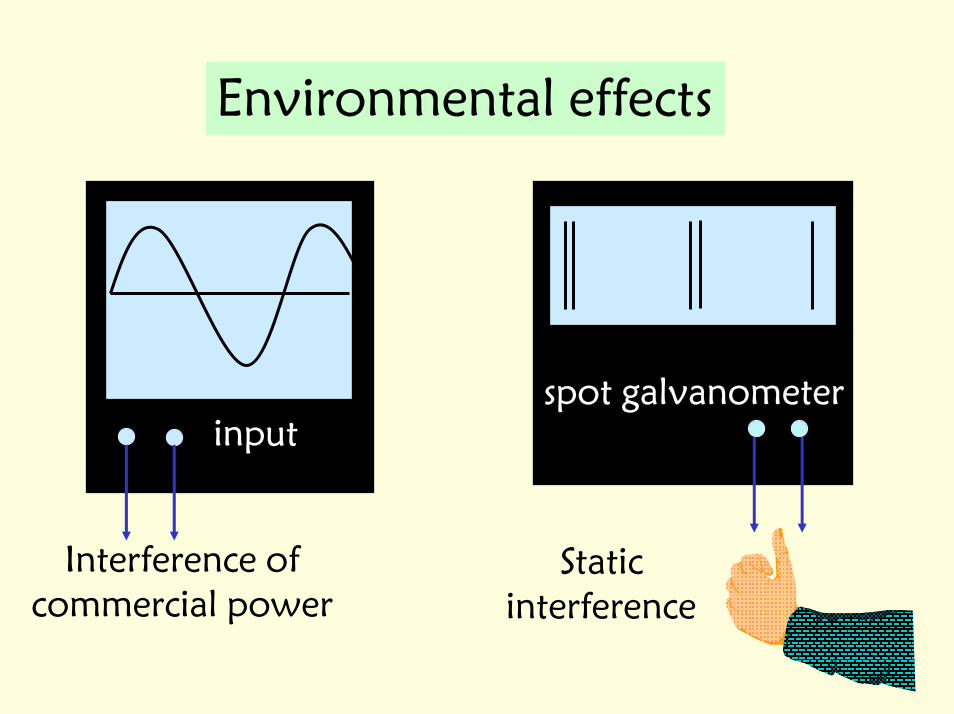
Environmental effects
Interference of commercial power
inputinputspot galvanometerspot galvanometer
Static interference
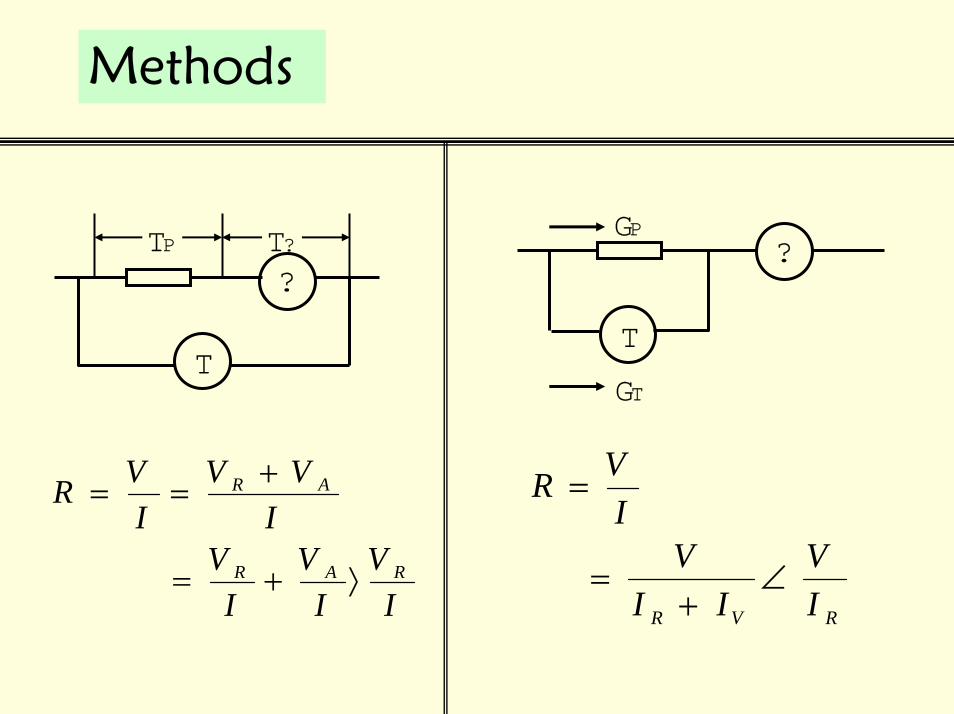
Methods
A
V
IR
IV
A
V
VR VA
R VI
VI I
VIR V R
=
=+
∠
R VI
V VI
VI
VI
VI
R A
R A R
= =+
= + ⟩
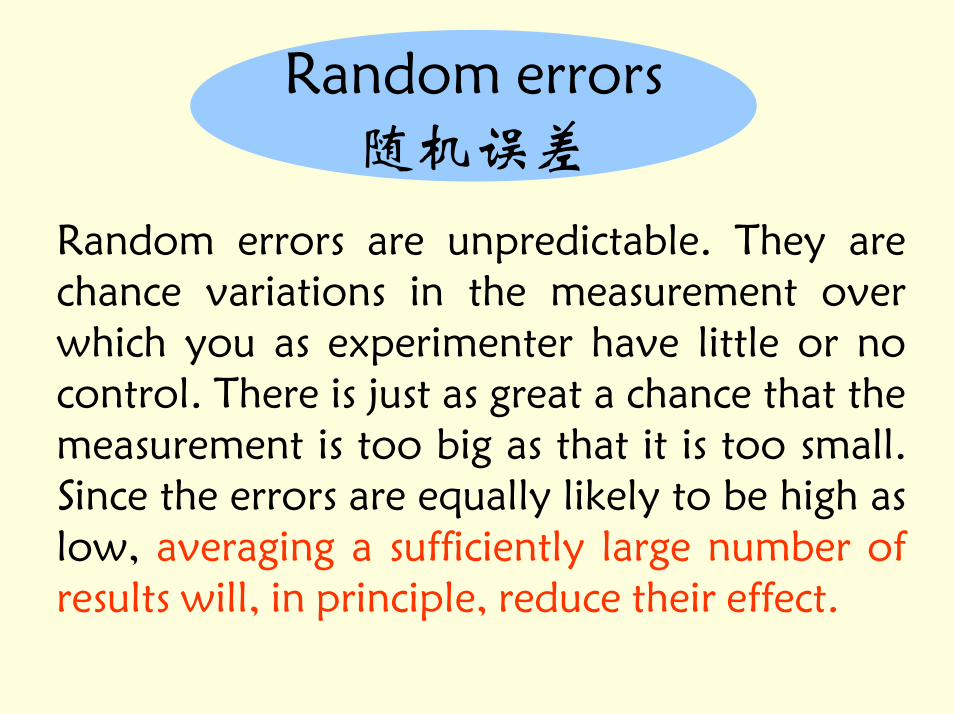
Random errors随机误差
Random errors are unpredictable. They are chance variations in the measurement over which you as experimenter have little or no control. There is just as great a chance that the measurement is too big as that it is too small. Since the errors are equally likely to be high as low, averaging a sufficiently large number of results will, in principle, reduce their effect.
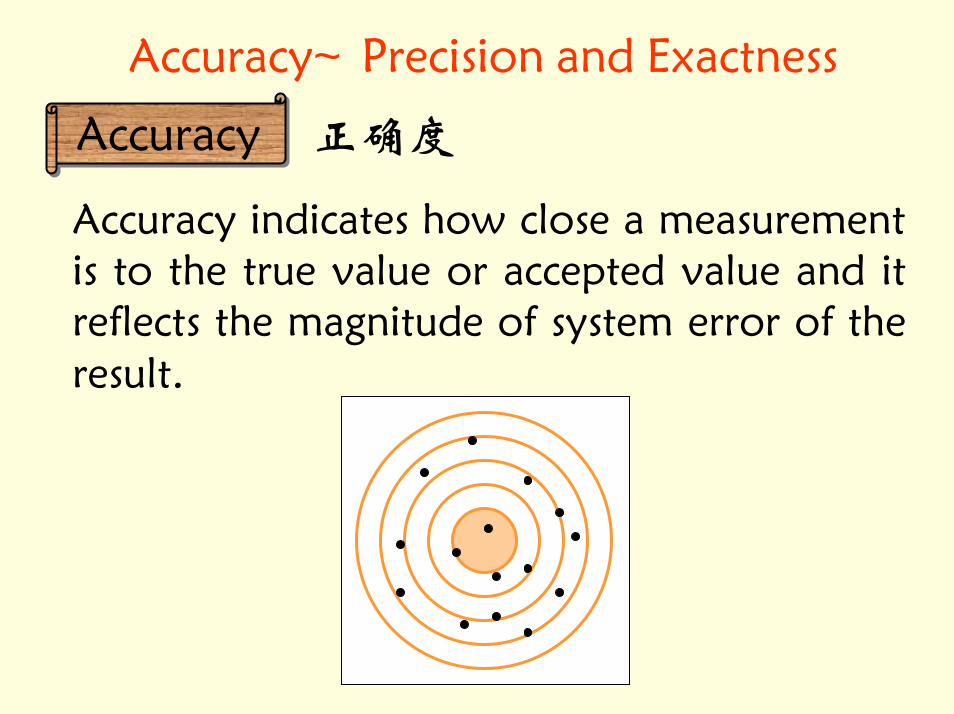
Accuracy、Precision and Exactness
AccuracyAccuracy 正确度
Accuracy indicates how close a measurement is to the true value or accepted value and it reflects the magnitude of system error of the result.

Accuracy、Precision and Exactness
PrecisionPrecision 精密度
Precision indicates how close together or how repeatable the results are and it reflects the random error of the result. A precise measuring instrument will give very nearly the same result each time it is used.
Accuracy、Precision and Exactness
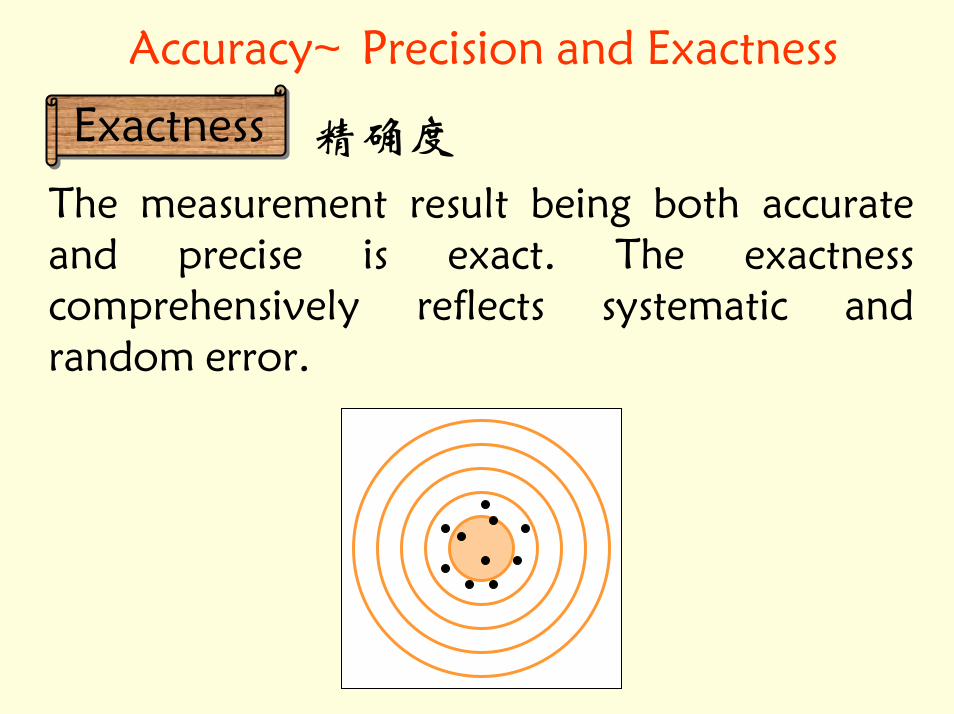
ExactnessExactness 精确度
The measurement result being both accurate and precise is exact. The exactness comprehensively reflects systematic and random error.
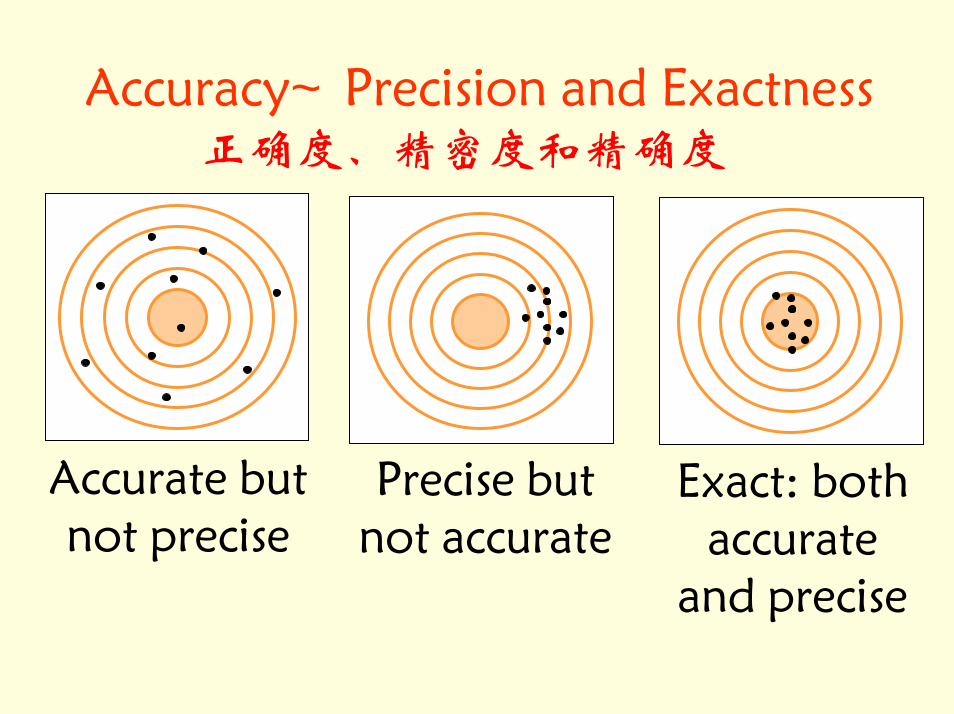
Accuracy、Precision and Exactness正确度、精密度和精确度
Accurate but not precise
Precise but not accurate
Exact: both accurate
and precise
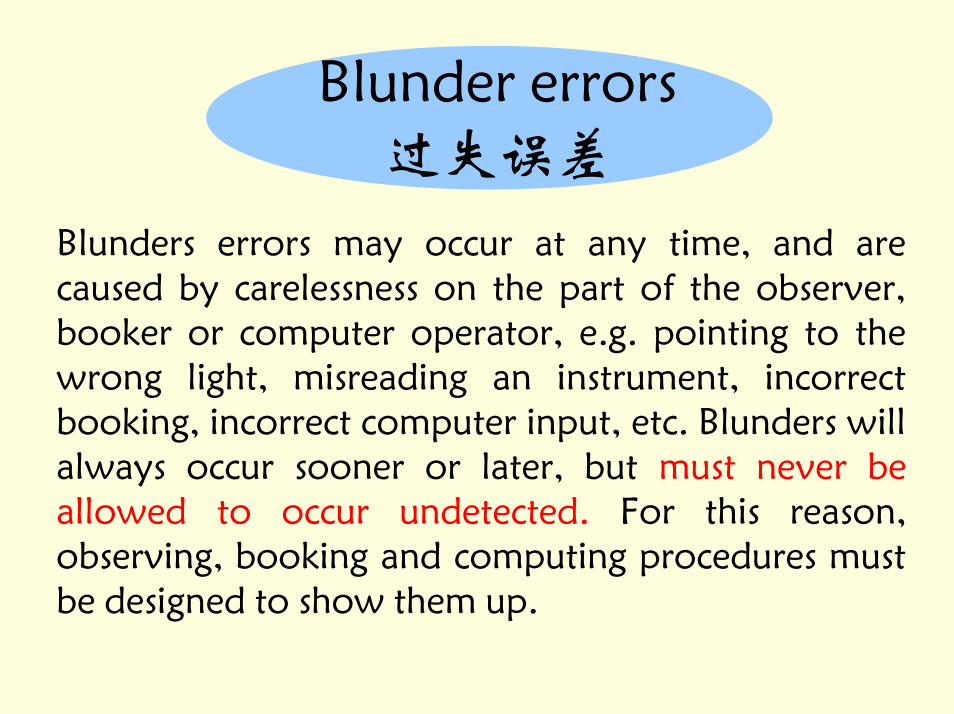
Blunder errors 过失误差
Blunders errors may occur at any time, and are caused by carelessness on the part of the observer, booker or computer operator, e.g. pointing to the wrong light, misreading an instrument, incorrect booking, incorrect computer input, etc. Blunders will always occur sooner or later, but must never be allowed to occur undetected. For this reason, observing, booking and computing procedures must be designed to show them up.
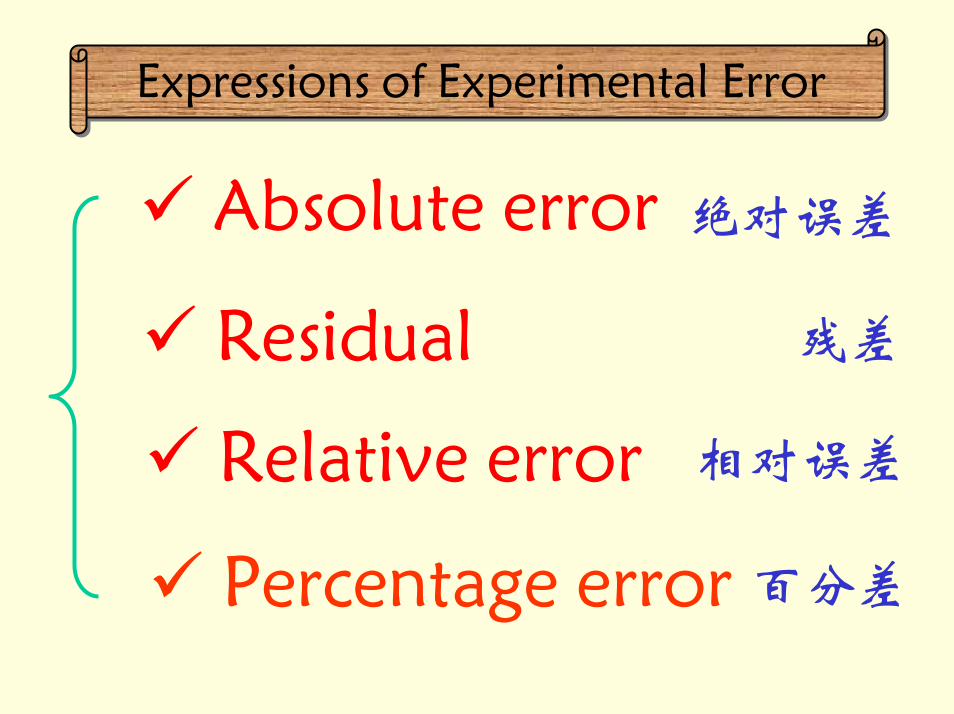
Expressions of Experimental ErrorExpressions of Experimental Error
Absolute error
Residual
Relative error
Percentage error
绝对误差
残差
相对误差
百分差
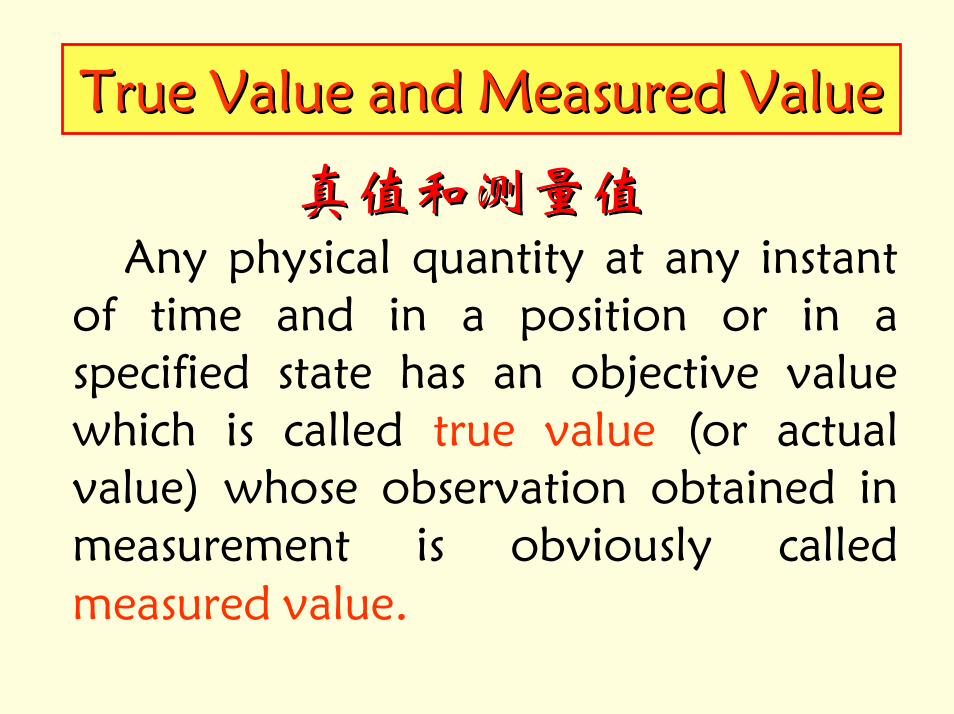
True Value and Measured ValueTrue Value and Measured Value
真值和测量值真值和测量值Any physical quantity at any instant
of time and in a position or in a specified state has an objective value which is called true value (or actual value) whose observation obtained in measurement is obviously called measured value.
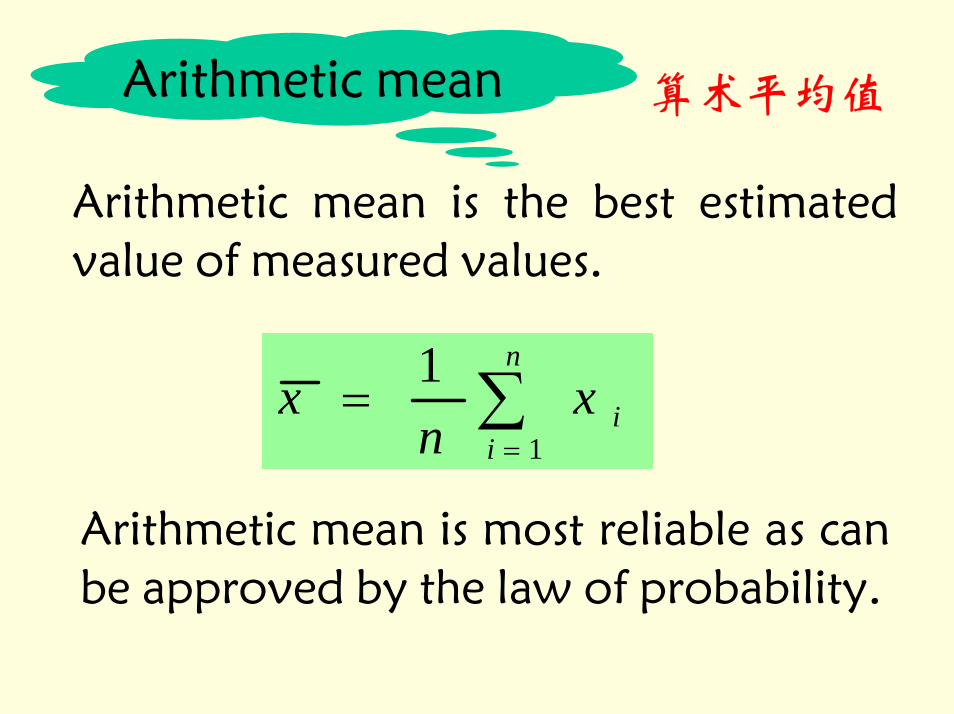
Arithmetic mean 算术平均值
Arithmetic mean is the best estimated value of measured values.
∑=
=n
iix
nx
1
1
Arithmetic mean is most reliable as can be approved by the law of probability.

Absolute error & Residual Absolute error & Residual
0xxx −=∆
)( xxx −=∆
Absolute error means the difference between the measured or inferred value of a quantity and its actual value .
x0x
Since we often take the arithmetic mean as the best value or actual value the actual value we define another expression as residual which represents the algebraic difference between each observation and arithmetic mean .
xx
绝对误差和残差
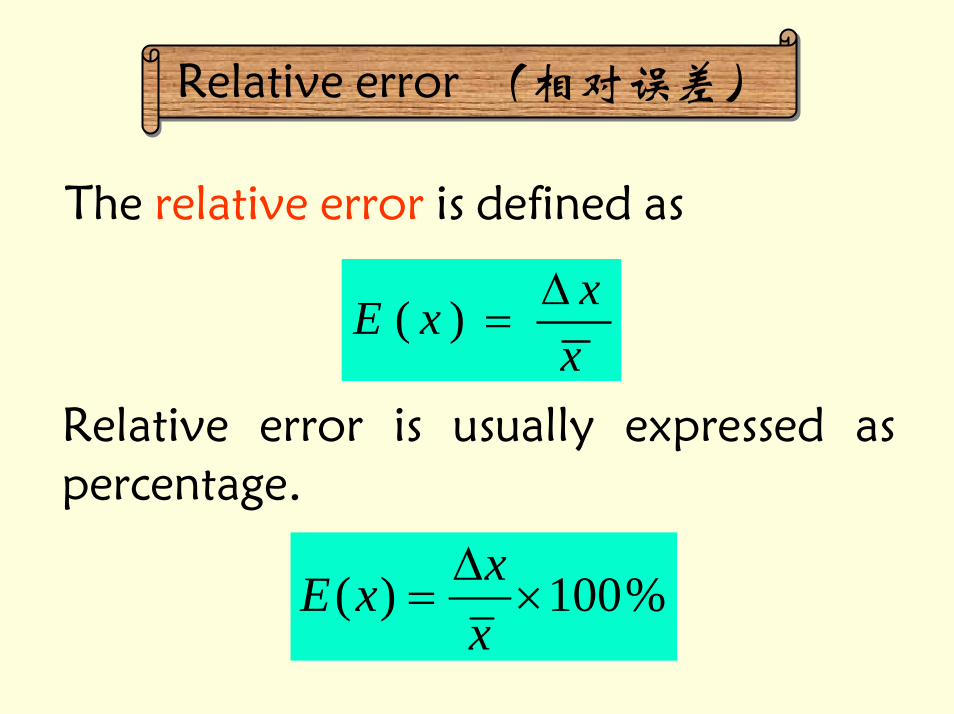
Relative error (相对误差)Relative error (相对误差)
The relative error is defined as
xxxE ∆
=)(
Relative error is usually expressed as percentage.
%100)( ×∆
=xxxE
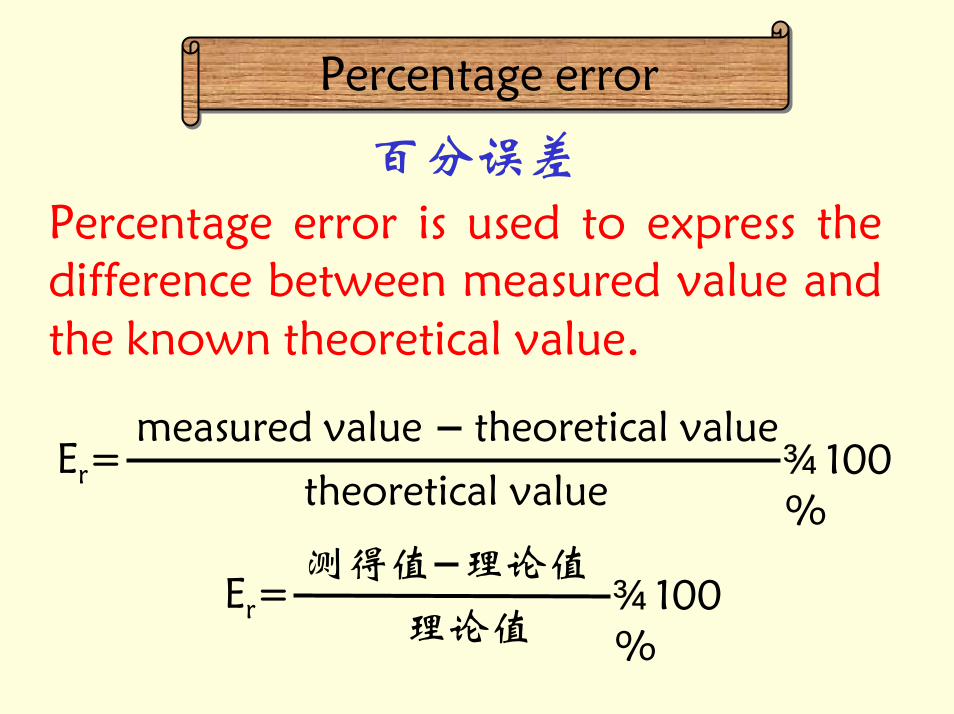
Percentage errorPercentage error
百分误差Percentage error is used to express the difference between measured value and the known theoretical value.
measured value theoretical value
theoretical valueEr= ×100
%测得值 理论值
理论值Er= ×100
%
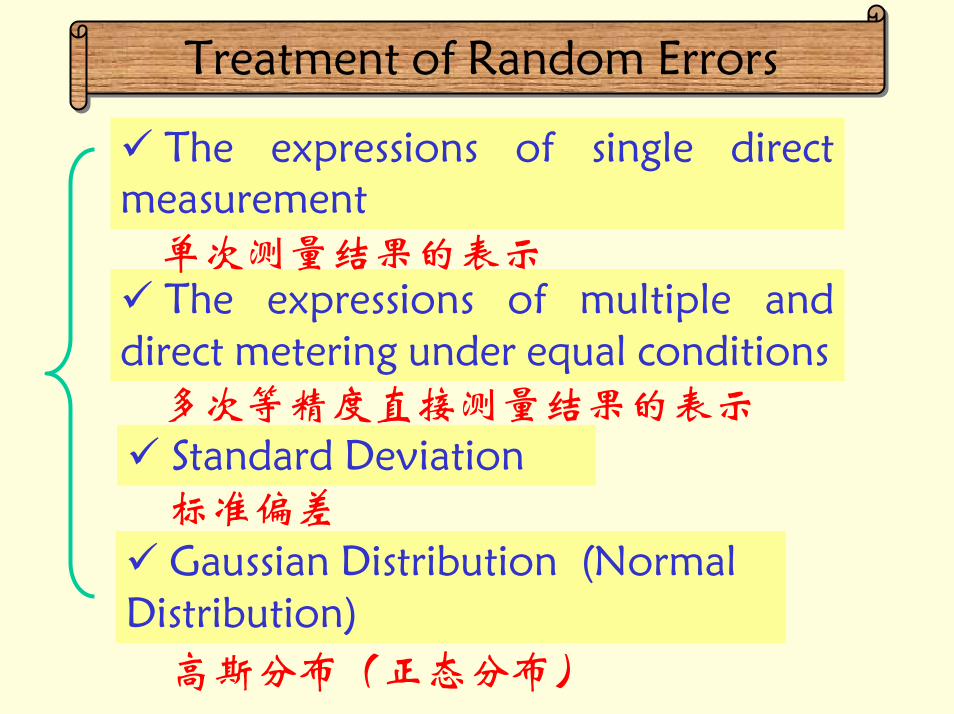
Treatment of Random Errors Treatment of Random Errors
The expressions of single direct measurement
Standard Deviation
Gaussian Distribution (Normal Distribution)
The expressions of multiple and direct metering under equal conditions
单次测量结果的表示
多次等精度直接测量结果的表示
标准偏差
高斯分布(正态分布)
The expressions of multiple and direct metering
under equal conditions
多次等精度直接测量结果的表示
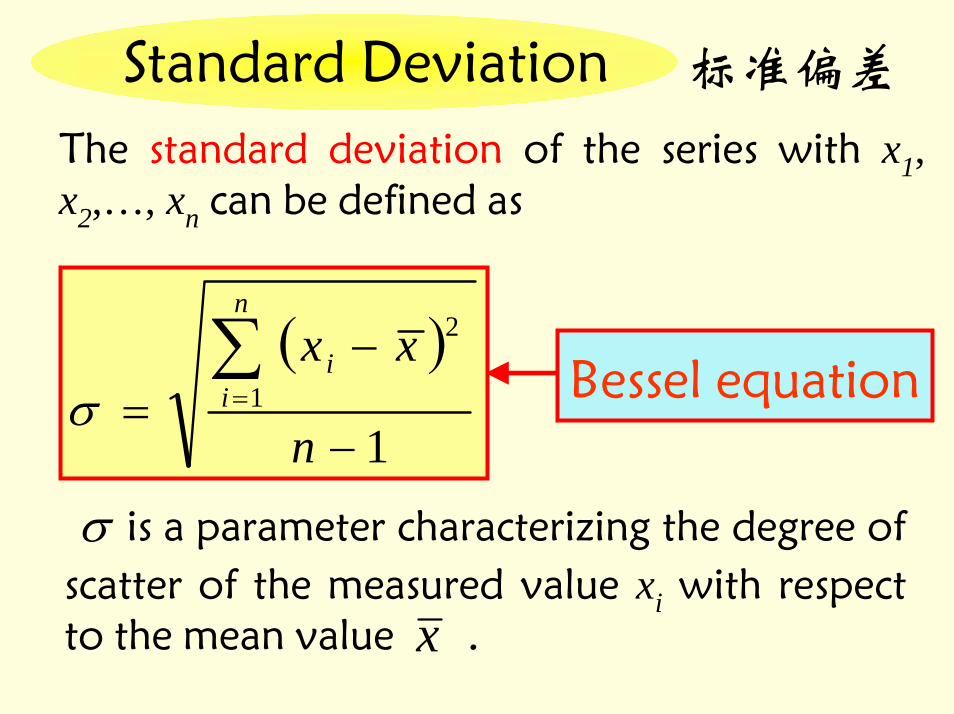
Standard Deviation 标准偏差
The standard deviation of the series with x1, x2,…, xn can be defined as
( )
11
2
−
−=
∑=
n
xxn
ii
σ
is a parameter characterizing the degree of
scatter of the measured value xi with respect to the mean value .
σ
x
Bessel equation

Gaussian Distribution The normal distributions are a very important class
of statistical distributions. All normal distributions are symmetric and have bell-shaped density curves with a single peak.
)(δy
σ+σ− O δσ3+σ3−
Normal distribution curve
Features of normal distributions
Symmetric 对称性
Single-peaked 单峰性
Bounded 有界性
Compensatory抵偿性
高斯分布
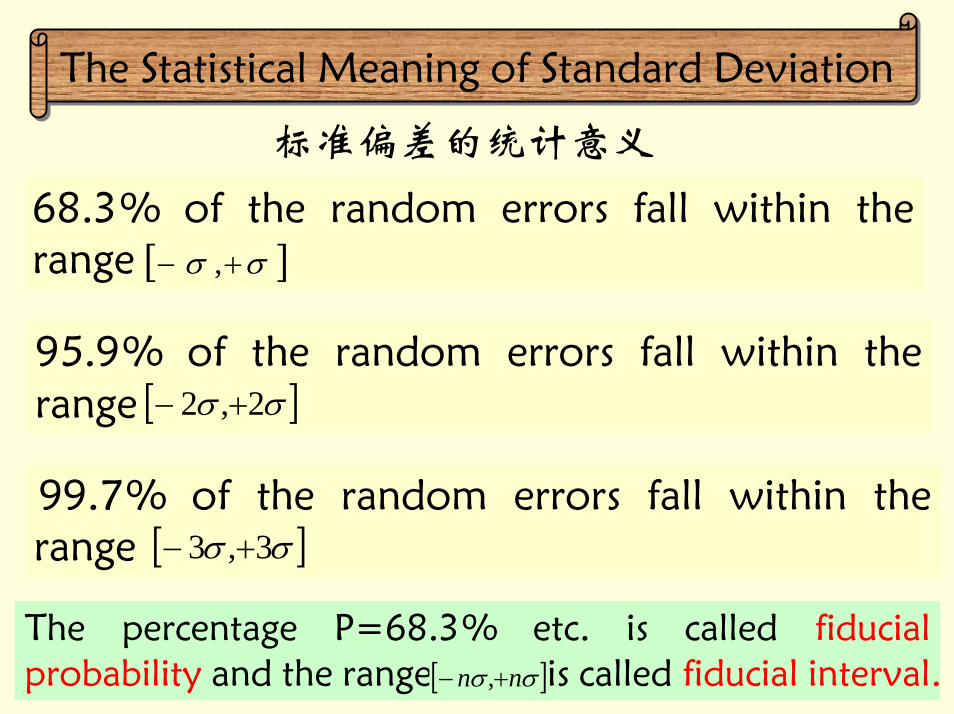
The Statistical Meaning of Standard DeviationThe Statistical Meaning of Standard Deviation
68.3% of the random errors fall within the range [ ]σσ +− ,
标准偏差的统计意义
95.9% of the random errors fall within the range [ ]σσ 2,2 +−
99.7% of the random errors fall within the range [ ]σσ 3,3 +−
The percentage P=68.3% etc. is called fiducial probability and the range is called fiducial interval.[ ]σσ nn +− ,

t-Distribution t-Distribution
When the times of measurements is small, for example less than 10 times, the error distribution of a series of observations will obviously deviate from normal distribution but follow the t-distribution or called student-distribution.
δ
)(δynormal distribution
t-distribution
The curve of t-distribution has lower peak and is narrower in the upper part and wider in the lower part than normal distribution curve.
t-分布

Uncertainty
不确定度

Uncertainty of measurement indicates the confidence level of the measured value and also indicates the dispersion rationally assigned to the measured value. It is a parameter, associated with the result of a measurement that defines the range of the values that could reasonably be attributed to the measured quantity. (合理赋予被测量之值的分散性)
Uncertainty of measurement测量不确定度
The literal meaning is the extent to which the observations are questionable or uncertain because of the existence of measurement errors. (测量值的不确定程度)
The statistical meaning is the estimated range in which the measured quantity seems to occur.(对被测量真值所处范围的估计值)
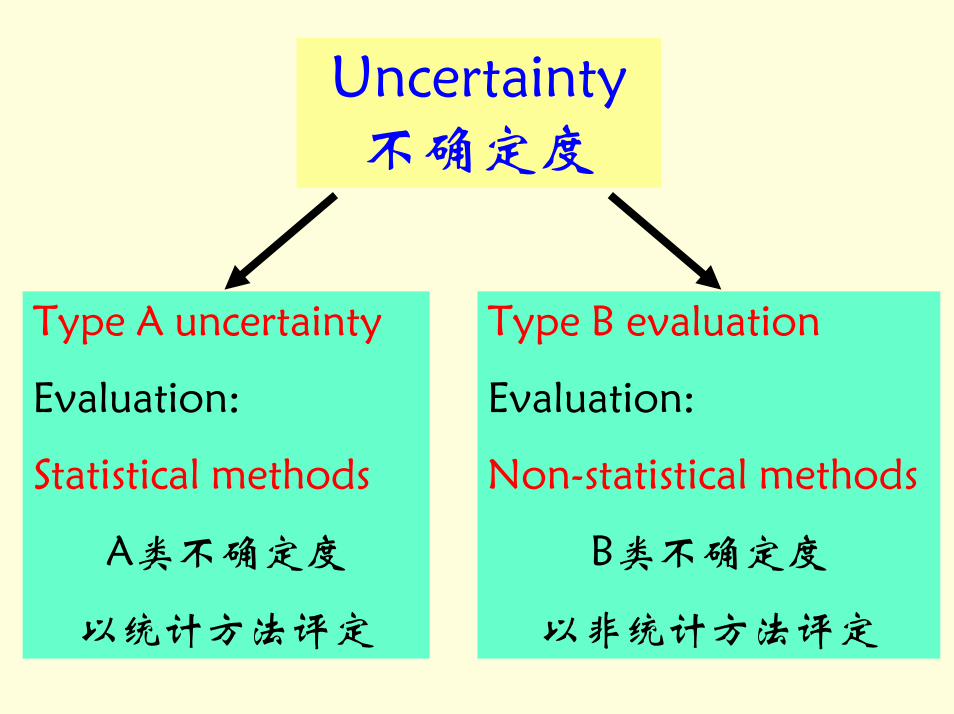
Uncertainty不确定度
Type A uncertainty
Evaluation:
Statistical methods
A类不确定度
以统计方法评定
Type B evaluation
Evaluation:
Non-statistical methods
B类不确定度
以非统计方法评定
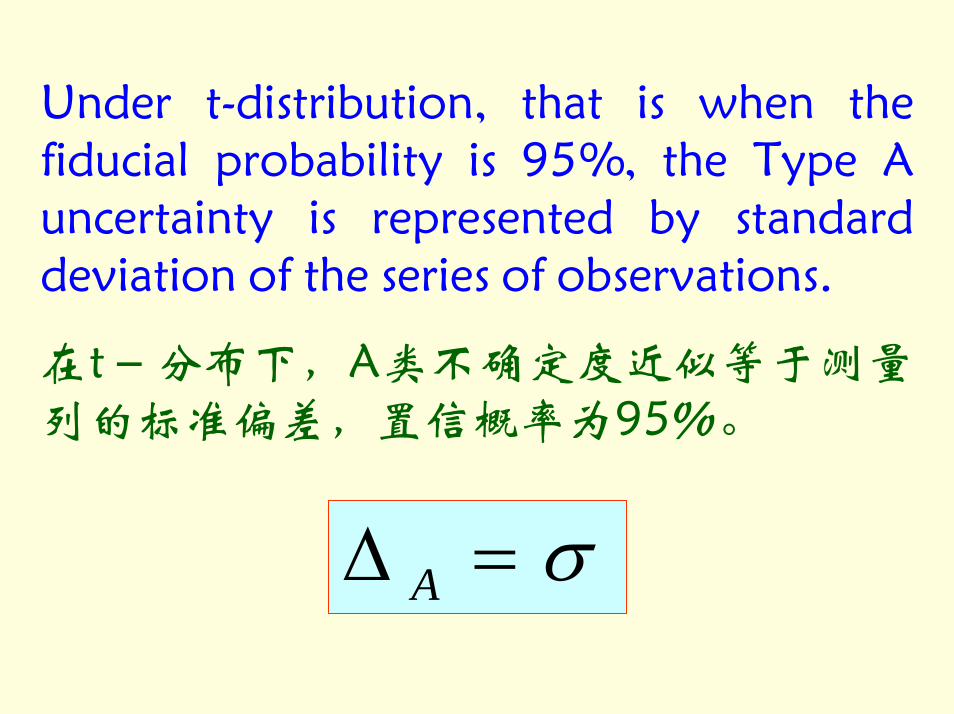
Under t-distribution, that is when the fiducial probability is 95%, the Type A uncertainty is represented by standard deviation of the series of observations.
在t-分布下,A类不确定度近似等于测量列的标准偏差,置信概率为95%。
σ=∆ A
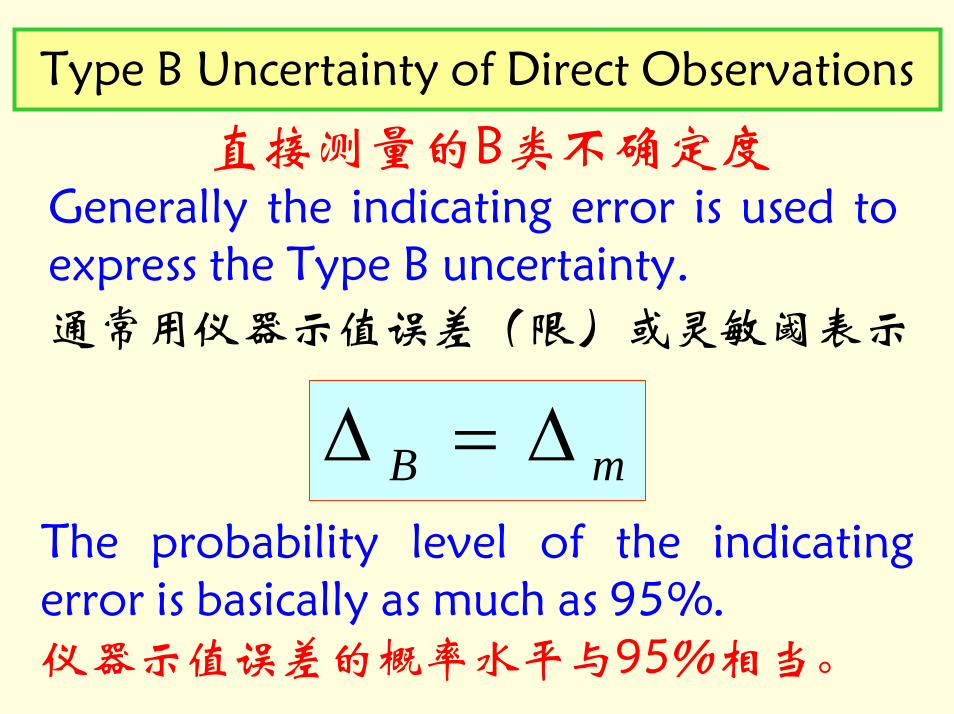
Type B Uncertainty of Direct Observations
直接测量的B类不确定度Generally the indicating error is used to express the Type B uncertainty.
通常用仪器示值误差(限)或灵敏阈表示
mB ∆=∆The probability level of the indicating error is basically as much as 95%.仪器示值误差的概率水平与95%相当。
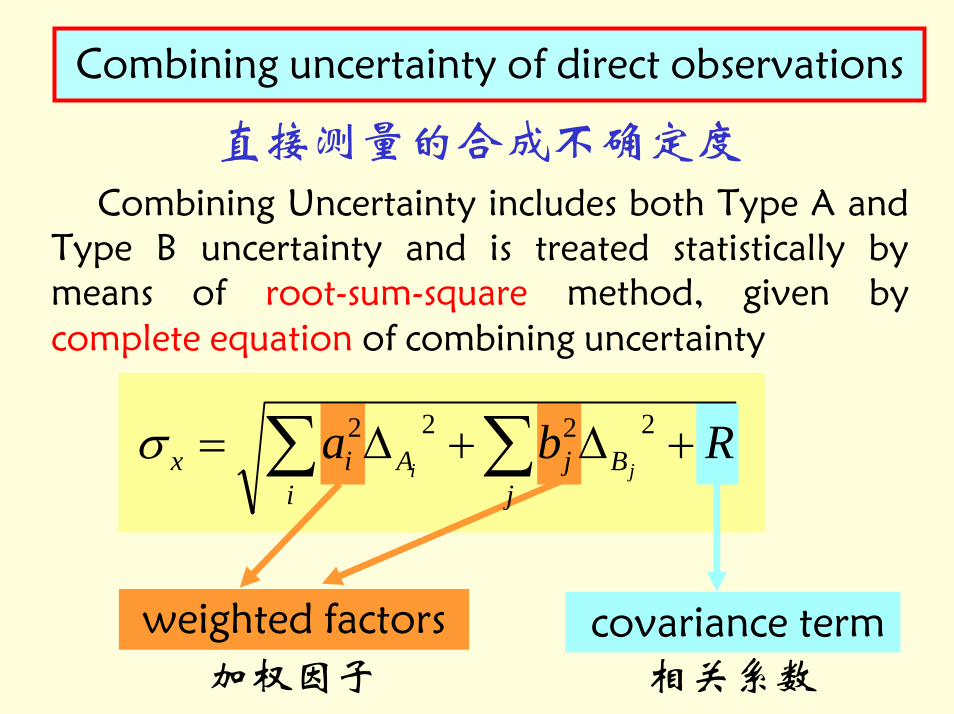
Combining uncertainty of direct observations
直接测量的合成不确定度Combining Uncertainty includes both Type A and
Type B uncertainty and is treated statistically by means of root-sum-square method, given by complete equation of combining uncertainty
weighted factors covariance term
Rbaji B
jjA
iix +∆+∆= ∑∑ 2222σ
加权因子 相关系数
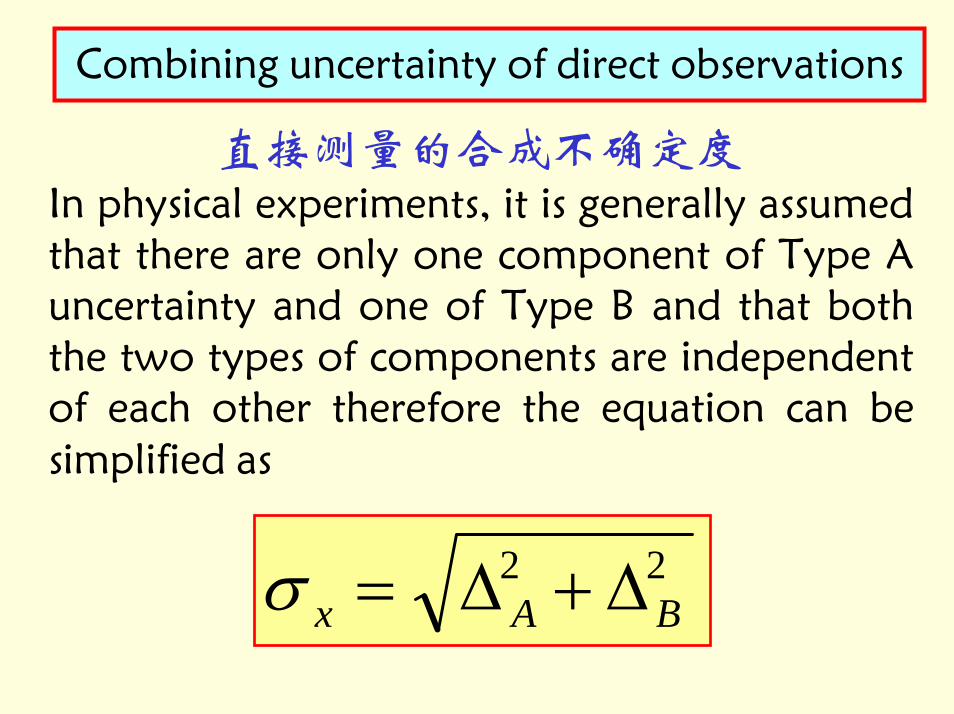
Combining uncertainty of direct observations
直接测量的合成不确定度In physical experiments, it is generally assumed that there are only one component of Type A uncertainty and one of Type B and that both the two types of components are independent of each other therefore the equation can be simplified as
22BAx ∆+∆=σ
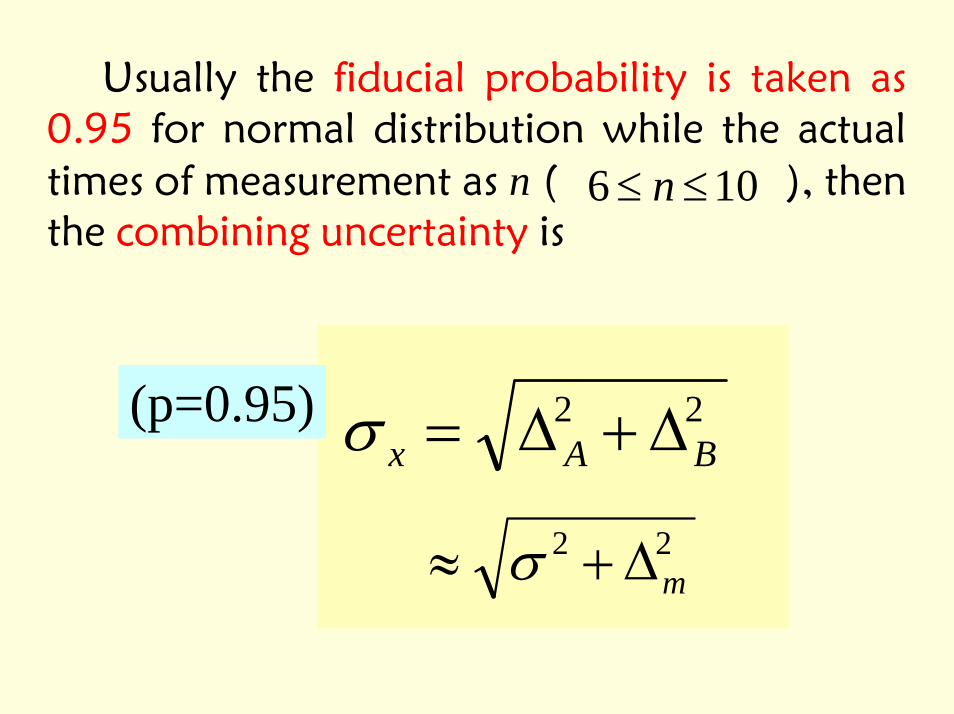
Usually the fiducial probability is taken as 0.95 for normal distribution while the actual times of measurement as n ( ), then the combining uncertainty is
106 ≤≤ n
22BAx ∆+∆=σ
22m∆+≈ σ
(p=0.95)

Notice
The fiducial probability is always taken as 0.95 unless for the especial statements. So generally the combining uncertainty can be calculated as
22mx ∆+= σσ
When p=0.95, it is not necessary to mark the value of fiducial probability.

Expression of the measuring result 测量结果的表示
The result of directly measured quantity can be expressed as
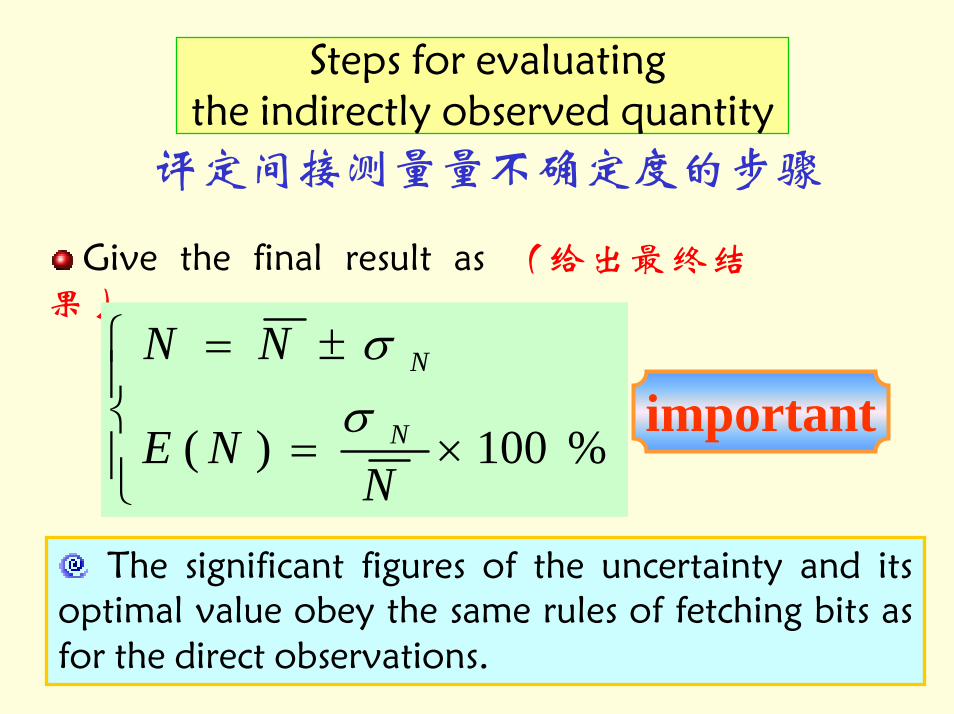
xxX σ±= (unit) IMPORTANT
or as relative uncertainty given by
))(1( xExX ±= (unit) xxE x /)( σ=where
Such expression gives the expected value of the quantity and the fiducial interval for a given fiducial probability.

Steps for evaluating the uncertainty of a direct observed quantity x
评定某直接测量量x不确定度的步骤
Correct the known systematic errors of the data;
Calculate the arithmetic mean of the series of observations take it as the optimal value of the observations;
x修正数据中的可定系统误差
计算测量列的算术平均值作为最佳值
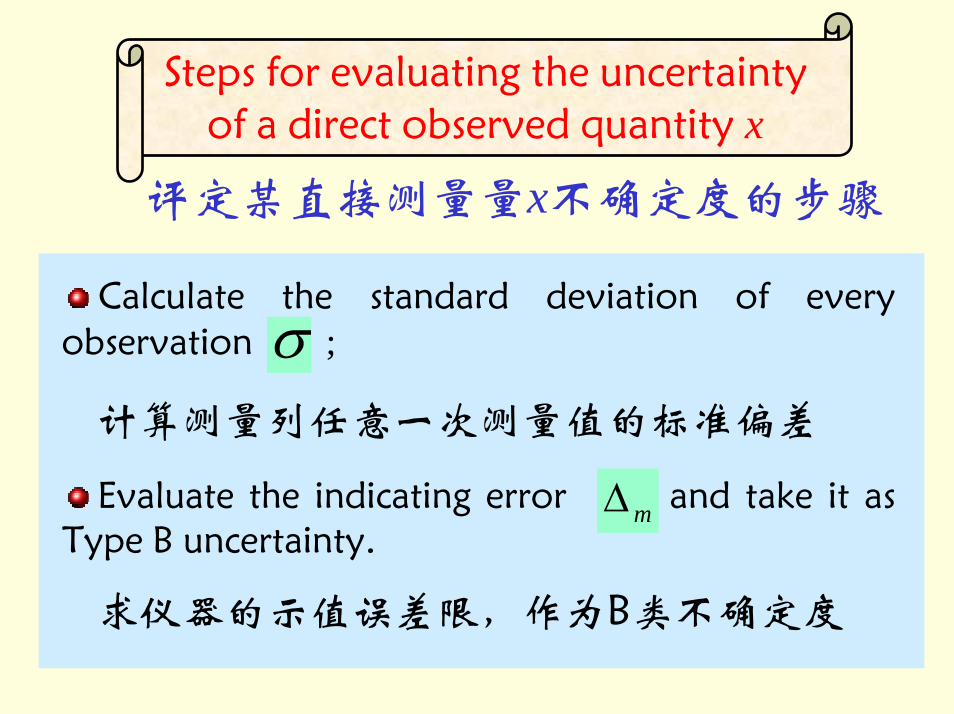
Steps for evaluating the uncertainty of a direct observed quantity x
评定某直接测量量x不确定度的步骤
Calculate the standard deviation of every observation ; σ
Evaluate the indicating error and take it as Type B uncertainty.
m∆
计算测量列任意一次测量值的标准偏差
求仪器的示值误差限,作为B类不确定度
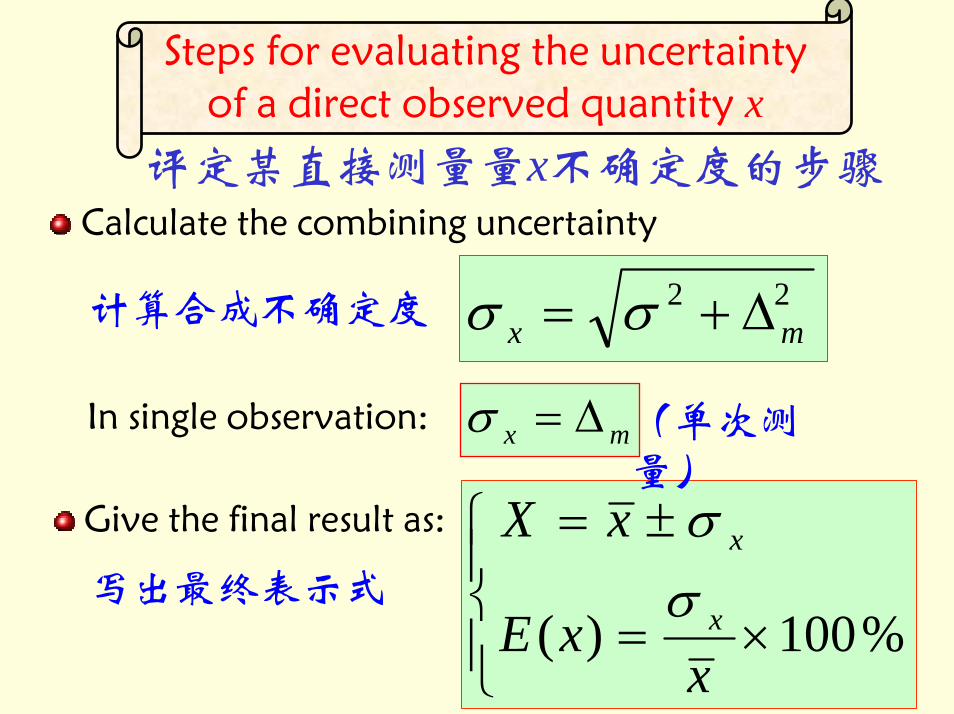
Steps for evaluating the uncertainty of a direct observed quantity x
评定某直接测量量x不确定度的步骤Calculate the combining uncertainty
22mx ∆+= σσ计算合成不确定度
⎪⎩
⎪⎨⎧
×=
±=
%100)(x
xE
xX
x
x
σσ
mx ∆=σIn single observation: (单次测量)
Give the final result as:
写出最终表示式
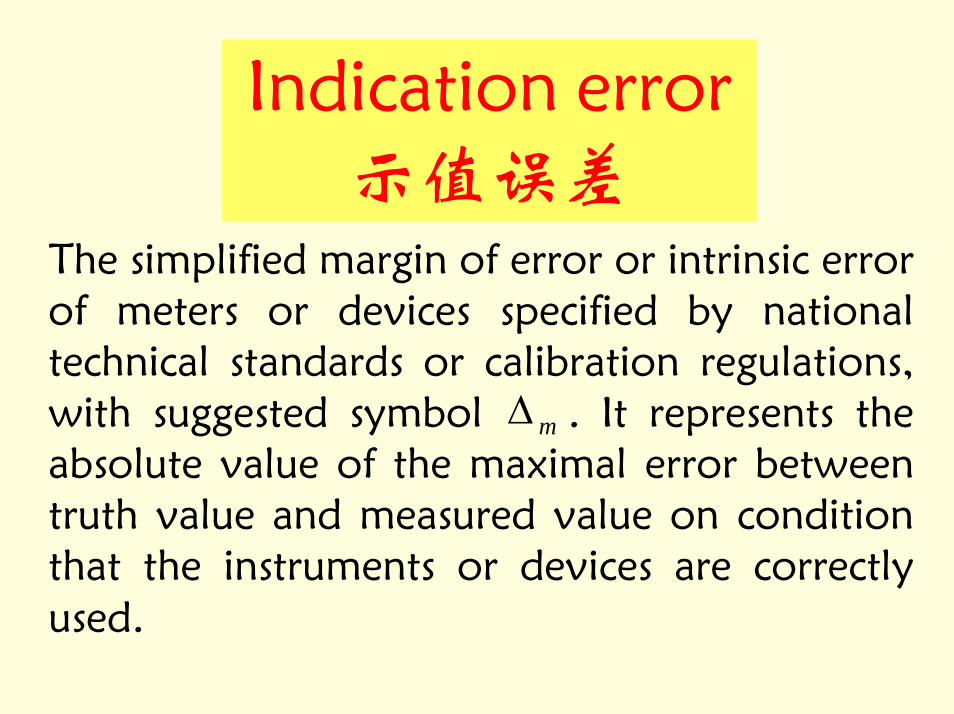
Indication error示值误差
The simplified margin of error or intrinsic error of meters or devices specified by national technical standards or calibration regulations, with suggested symbol . It represents the absolute value of the maximal error between truth value and measured value on condition that the instruments or devices are correctly used.
m∆
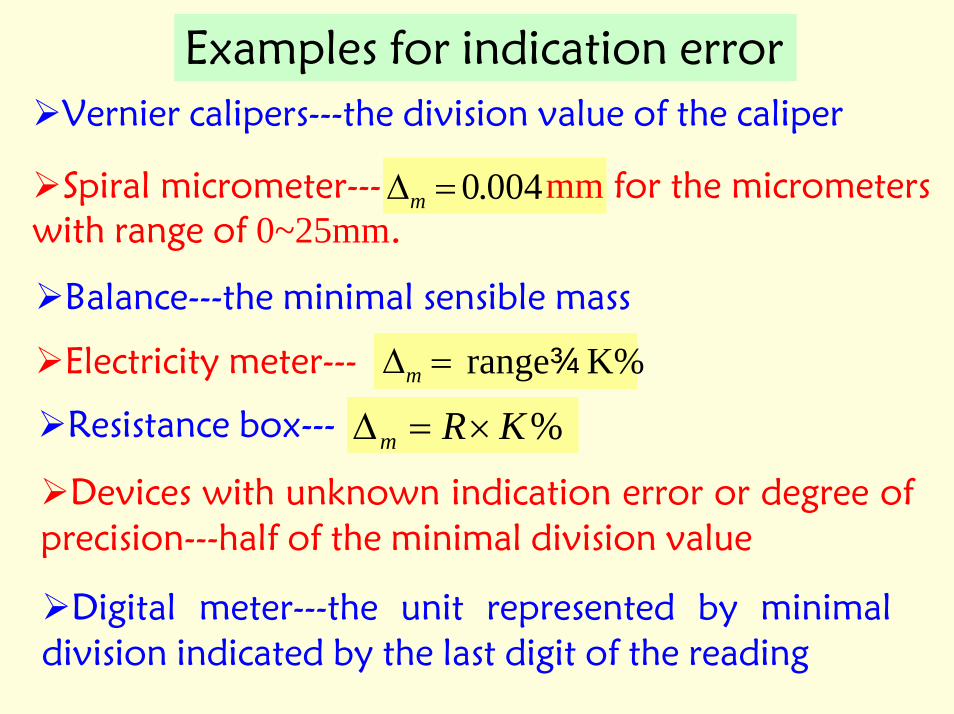
Examples for indication errorVernier calipers---the division value of the caliper
Spiral micrometer--- mm for the micrometers with range of 0~25mm.
004.0=∆m
Balance---the minimal sensible mass
Electricity meter--- range×K%=∆m
%KRm ×=∆Resistance box---
Devices with unknown indication error or degree of precision---half of the minimal division value
Digital meter---the unit represented by minimal division indicated by the last digit of the reading
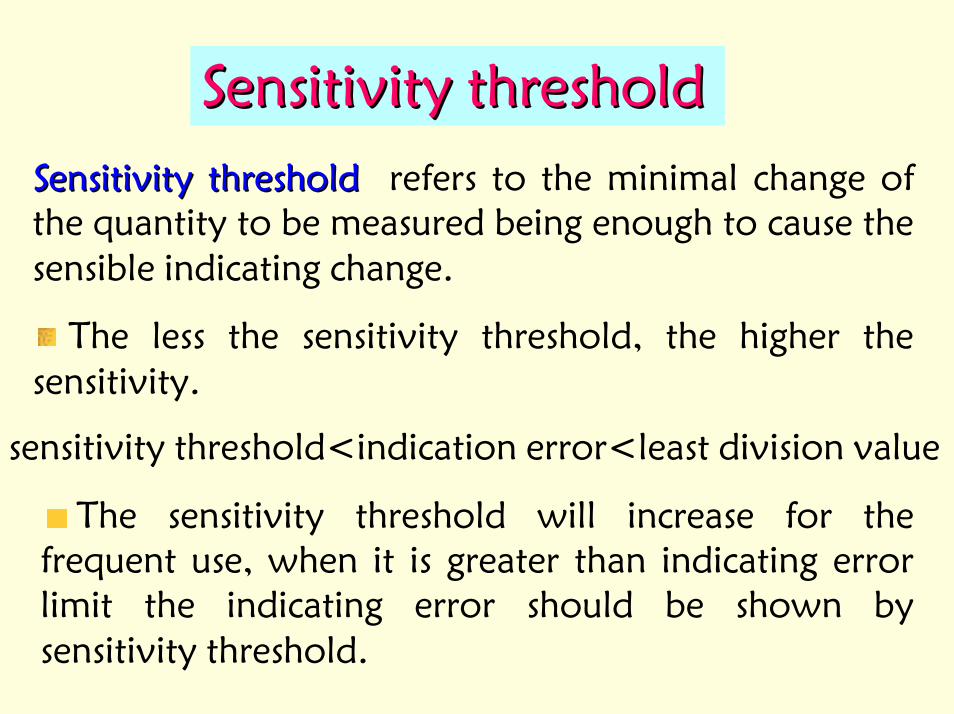
Sensitivity thresholdSensitivity threshold
Sensitivity thresholdSensitivity threshold refers to the minimal change of the quantity to be measured being enough to cause the sensible indicating change.
The less the sensitivity threshold, the higher the sensitivity.
sensitivity threshold<indication error<least division value
The sensitivity threshold will increase for the frequent use, when it is greater than indicating error limit the indicating error should be shown by sensitivity threshold.
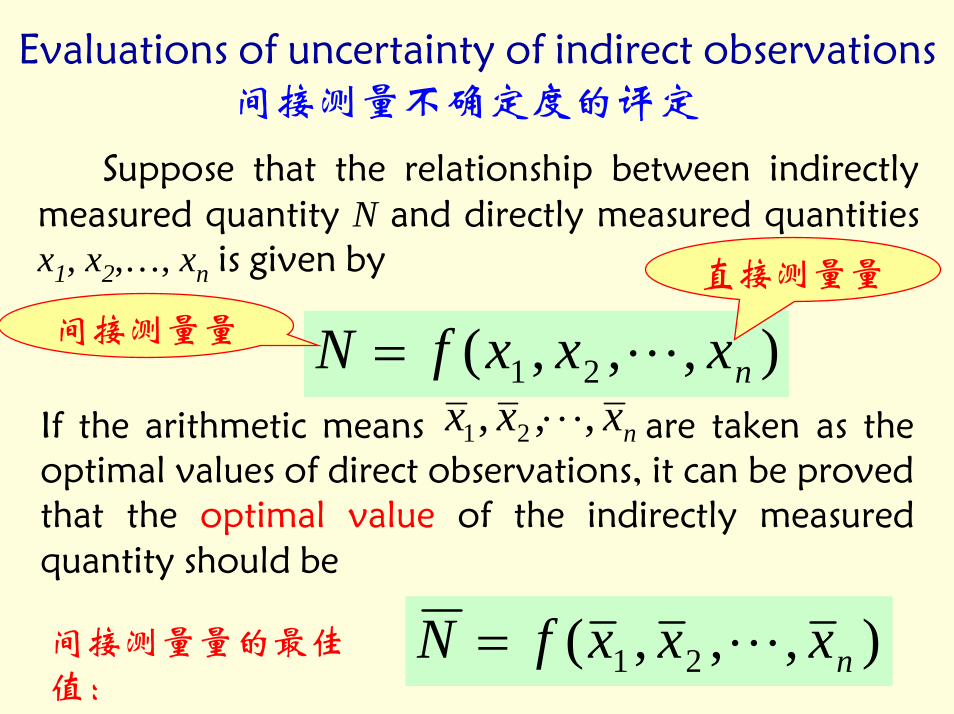
Evaluations of uncertainty of indirect observations间接测量不确定度的评定
Suppose that the relationship between indirectly measured quantity N and directly measured quantities x1, x2,…, xn is given by
),,,( 21 nxxxfN L=If the arithmetic means are taken as the optimal values of direct observations, it can be proved that the optimal value of the indirectly measured quantity should be
间接测量量
直接测量量
nxxx ,,, 21 ⋅⋅⋅
),,,( 21 nxxxfN L=间接测量量的最佳值:
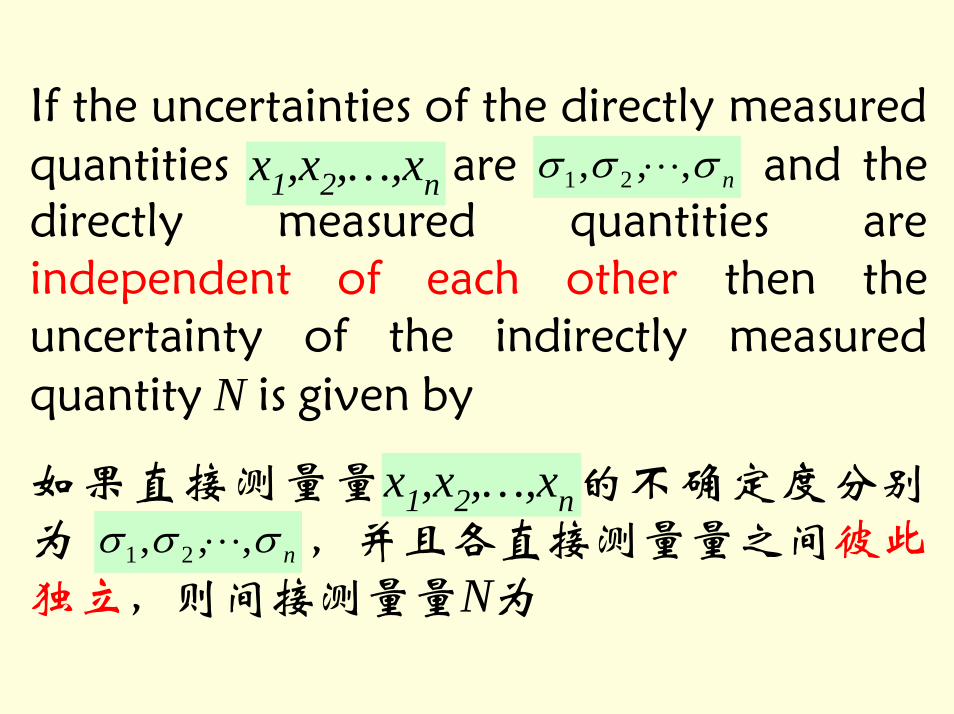
If the uncertainties of the directly measured quantities x1,x2,…,xn are and the directly measured quantities are independent of each other then the uncertainty of the indirectly measured quantity N is given by
如果直接测量量x1,x2,…,xn的不确定度分别为 ,并且各直接测量量之间彼此独立,则间接测量量N为
nσσσ ,,, 21 ⋅⋅⋅
nσσσ ,,, 21 ⋅⋅⋅

Uncertainty of the indirectly measured quantity N
∑= ∂
∂=
n
ii
iN x
f1
2)( σσ
222
2
21
1
)()()( nnxf
xf
xf σσσ
∂∂
+⋅⋅⋅+∂∂
+∂∂
=
∑= ∂
∂==
n
ii
i
N
xf
NNE
1
2)ln()( σσ
Transfer Coefficient 传递系数
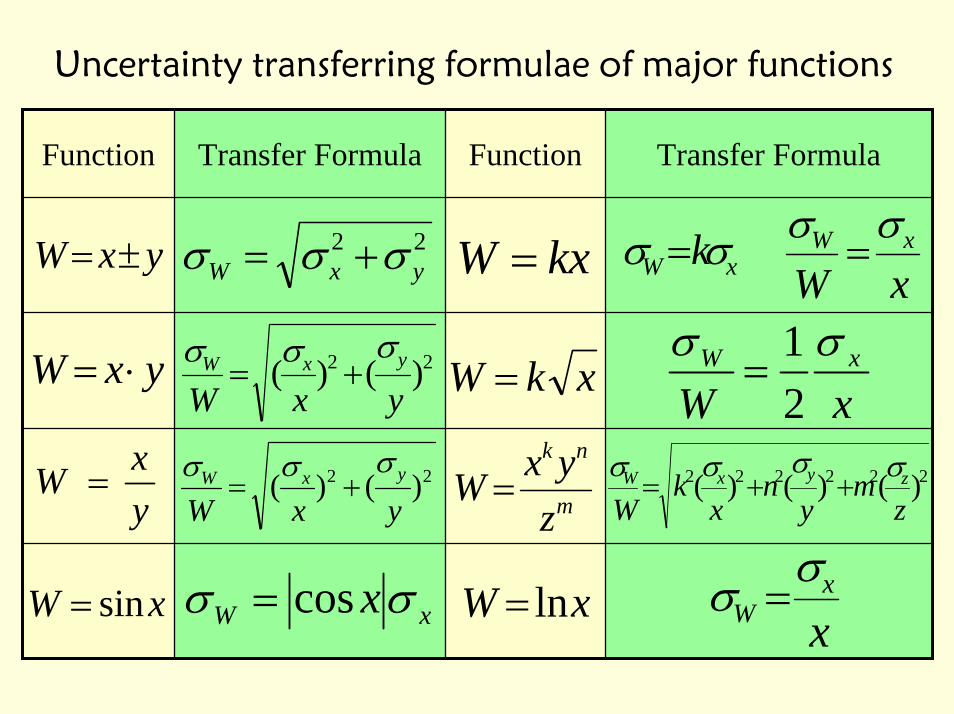
Uncertainty transferring formulae of major functions
Function Transfer Formula Function Transfer Formula
yxW ±=
yxW ⋅=
yxW =
xW sin=
22yxW σσσ +=
22 )()(yxWyxW σσσ
+=
22 )()(yxW
yxW σσσ+=
xW xσσ cos=
kxW = xW kσσ =xW
xW σσ=
xkW = xWxW σσ
21
=
m
nk
zyxW = 222222 )()()(
zm
yn
xk
WzyxW σσσσ
++=
xW ln= xx
Wσσ =
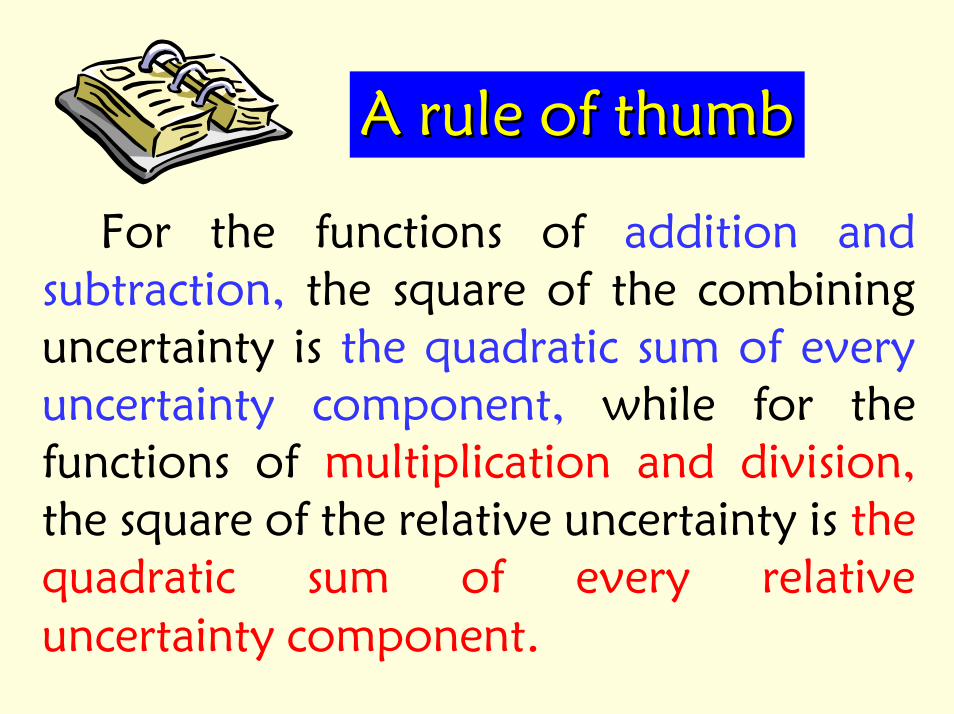
A rule of thumbA rule of thumb
For the functions of addition and subtraction, the square of the combining uncertainty is the quadratic sum of every uncertainty component, while for the functions of multiplication and division,the square of the relative uncertainty is the quadratic sum of every relative uncertainty component.
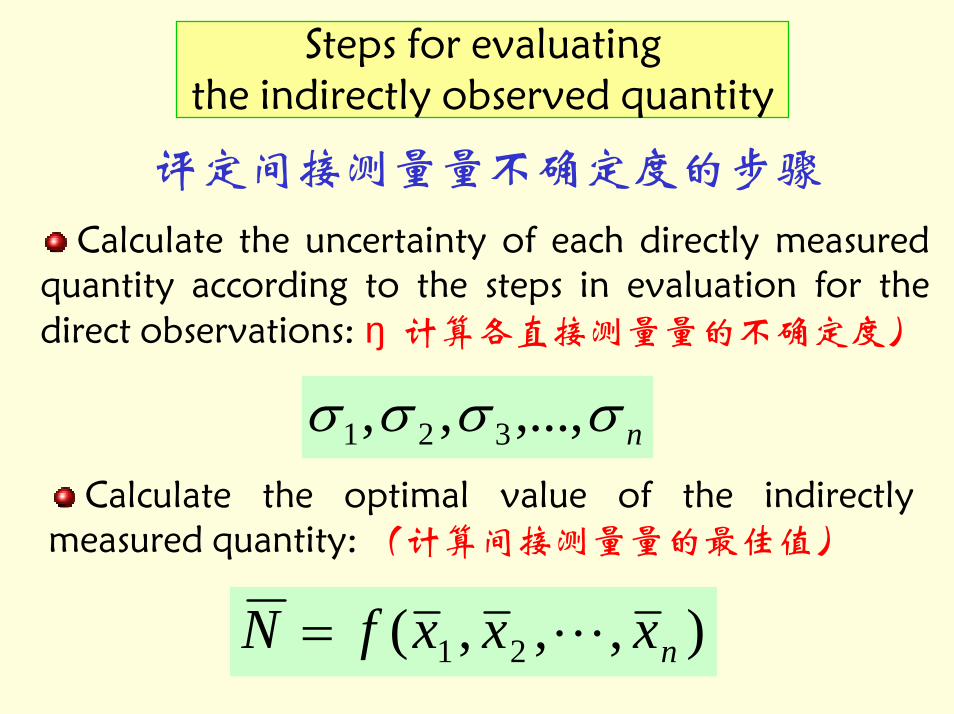
Steps for evaluating the indirectly observed quantity
评定间接测量量不确定度的步骤
Calculate the uncertainty of each directly measured quantity according to the steps in evaluation for the direct observations: (计算各直接测量量的不确定度)
nσσσσ ,...,,, 321
Calculate the optimal value of the indirectly measured quantity: (计算间接测量量的最佳值)
),,,( 21 nxxxfN L=

Steps for evaluating the indirectly observed quantity
评定间接测量量不确定度的步骤Calculate the uncertainty and relative uncertainty
of the indirectly measured quantity N, using the composite equations for uncertainty.
间接测量量的不确定度 ∑
= ∂∂
=n
ii
iN x
f1
2)( σσ
∑= ∂
∂==
n
ii
i
N
xf
NNE
1
2)ln()( σσ
Steps for evaluating the indirectly observed quantity
评定间接测量量不确定度的步骤
Give the final result as (给出最终结果 )
⎪⎩
⎪⎨⎧
×=
±=
%100)(N
NE
NN
N
N
σσ
important
The significant figures of the uncertainty and its optimal value obey the same rules of fetching bits as for the direct observations.

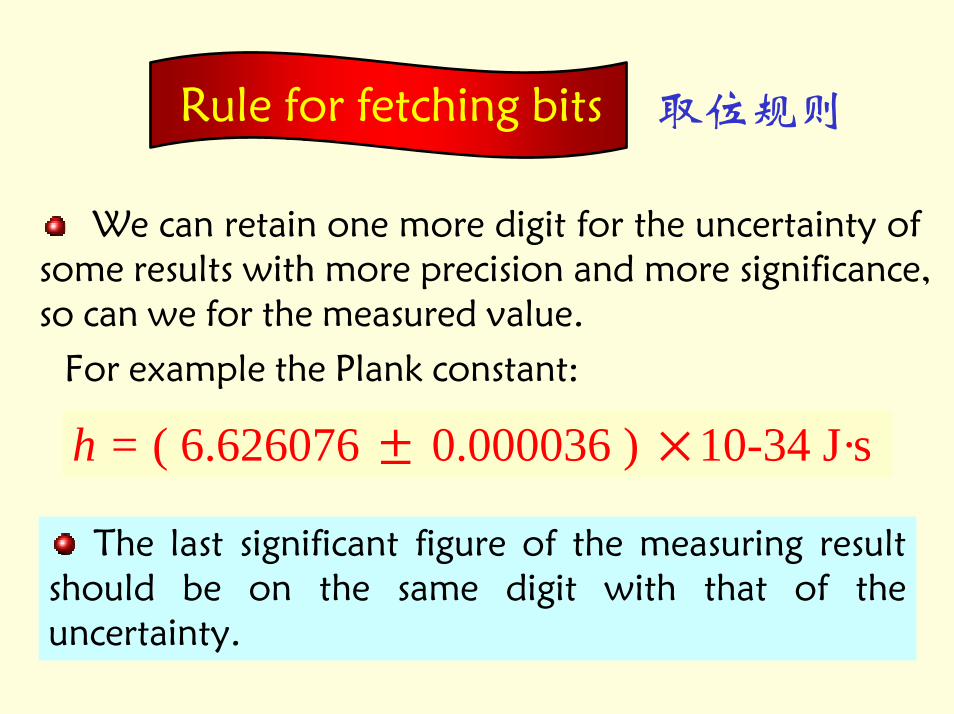
Rule for fetching bits 取位规则
Generally the significant figures of uncertainty or relative uncertainty have one or two digits.
If the most significant figure is larger than or equals 3, the uncertainty should have one digit;
mmD D )008.0136.0( ±=±σ
If the most significant figure is less than 3, the uncertainty should have one or two digits;
mmD D )012.0136.0( ±=±σ
Rule for fetching bits 取位规则
We can retain one more digit for the uncertainty of some results with more precision and more significance, so can we for the measured value.
For example the Plank constant:
h = ( 6.626076 ± 0.000036 ) ×10-34 J·s
The last significant figure of the measuring result should be on the same digit with that of the uncertainty.
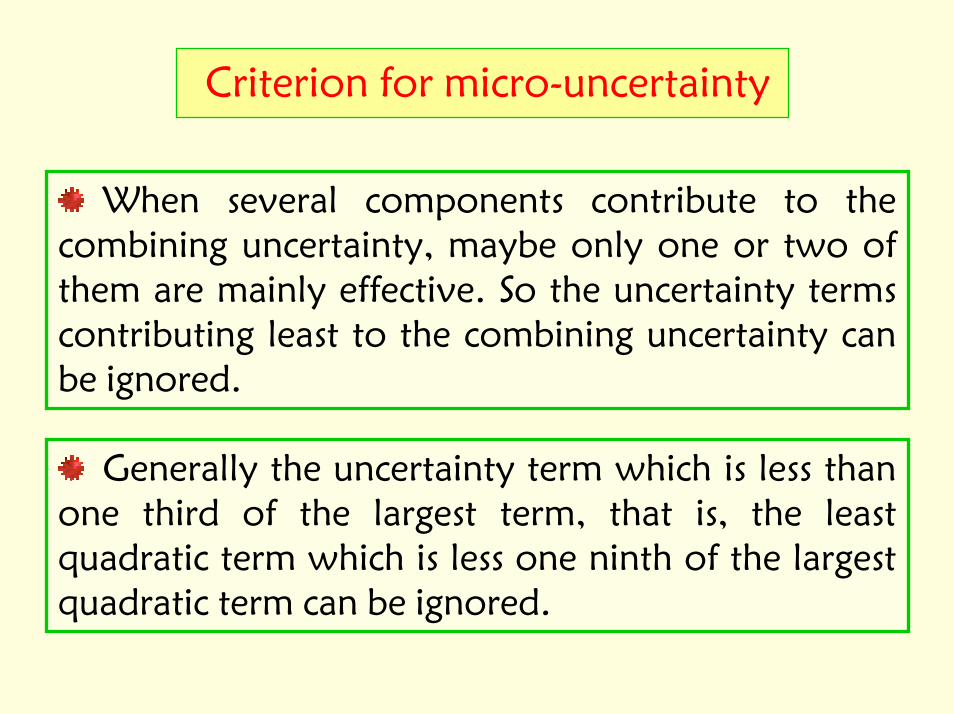
Criterion for micro-uncertainty
When several components contribute to the combining uncertainty, maybe only one or two of them are mainly effective. So the uncertainty terms contributing least to the combining uncertainty can be ignored.
Generally the uncertainty term which is less than one third of the largest term, that is, the least quadratic term which is less one ninth of the largest quadratic term can be ignored.

Methods for data processing
数据处理基本方法
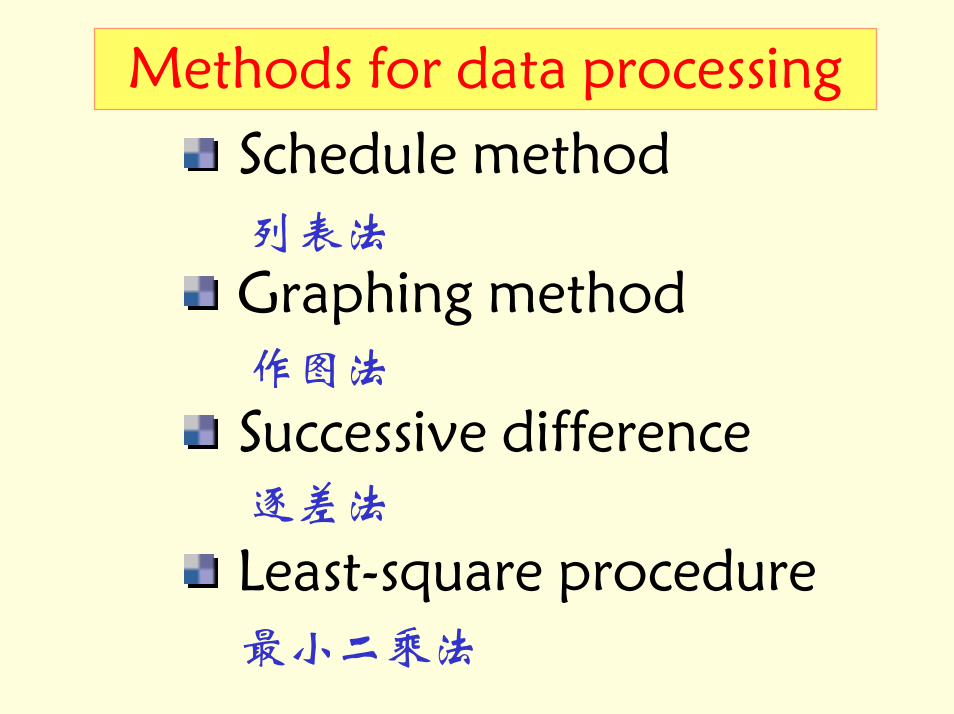
Methods for data processing
Schedule method
Graphing method
Successive difference
Least-square procedure
列表法
作图法
逐差法
最小二乘法
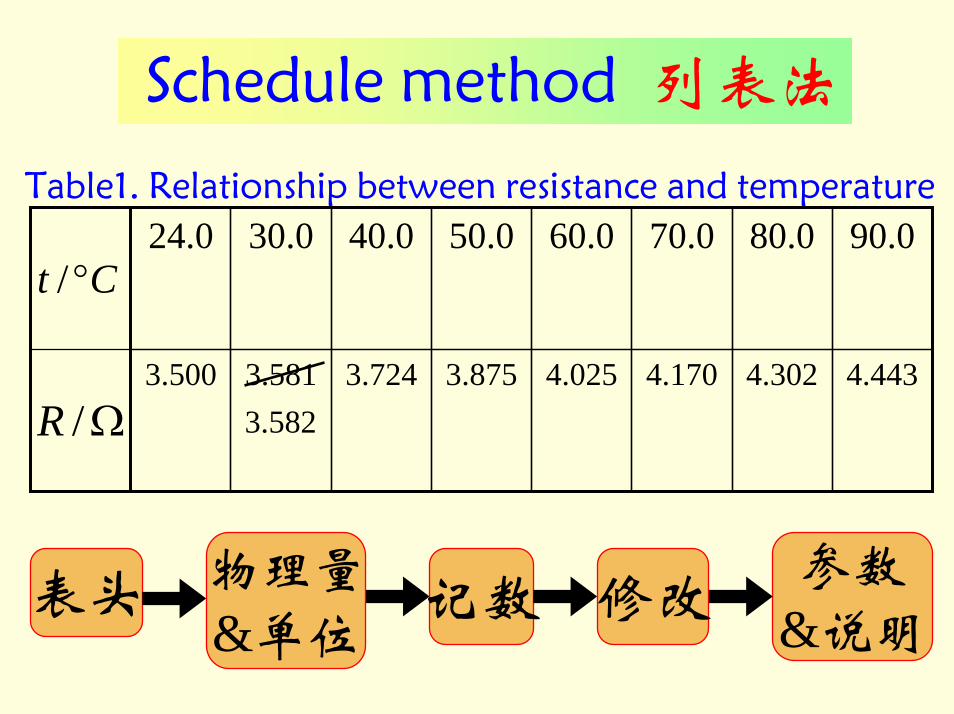
Schedule method 列表法
Table1. Relationship between resistance and temperature
Ct °/
Ω/R
24.0 30.0 40.0 50.0 60.0 70.0 80.0 90.0
3.500 3.581 3.724 3.875 4.025 4.170 4.302 4.4433.582
记数 修改表头 物理量&单位
参数&说明
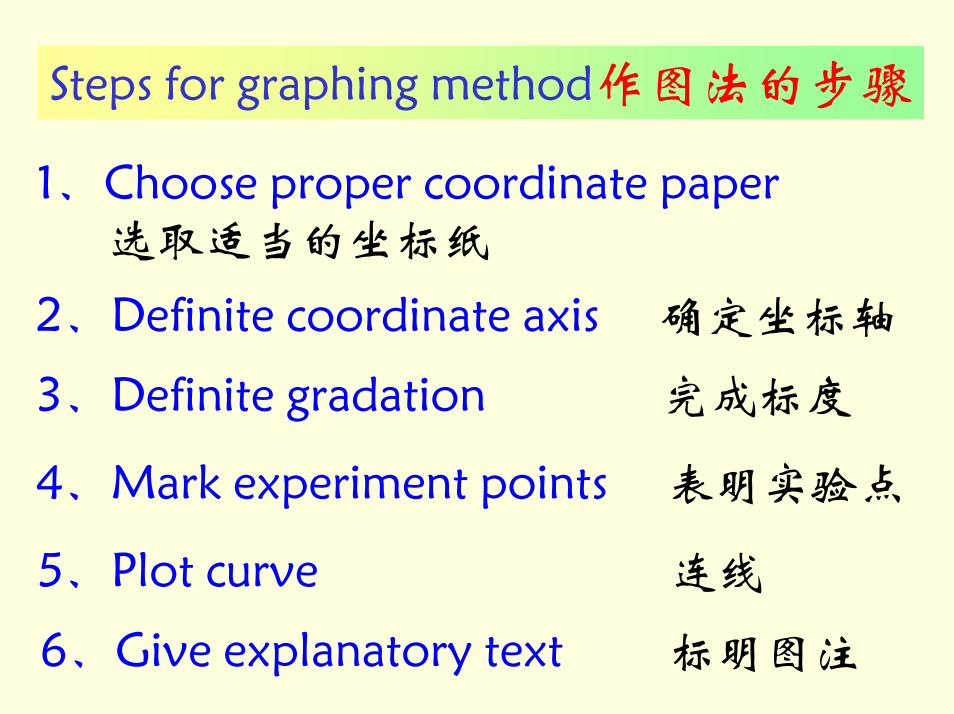
Steps for graphing method作图法的步骤
1、Choose proper coordinate paper选取适当的坐标纸
2、Definite coordinate axis 确定坐标轴
3、Definite gradation 完成标度
4、Mark experiment points 表明实验点
5、Plot curve 连线
6、Give explanatory text 标明图注

Coordinate paper坐标纸Coordinate axis坐标系Gradation标度Experiment points实验点Curve曲线Explanatory text图注 (0,0) 1 2 3 4 5
5
4
3
2
1
X/unit
Y/unit
(x1,y1)
(x2,y2)
Explanatory text
For the line y=ax+b, the slope is given with known points:
Slope斜率
)(12
12 unitxxyyb
−−
=
Intercept截距 The intercept is written as:
)(12
2112 unitxx
yxyxa−−
=
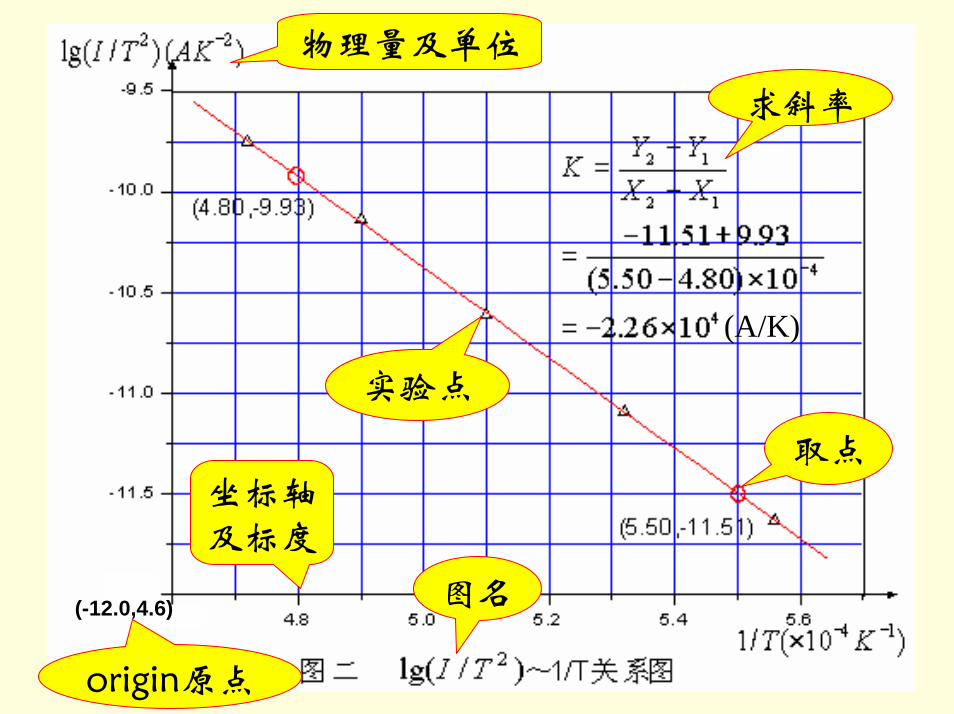
(-12.0,4.6)
(A/K)
物理量及单位
origin原点
坐标轴及标度
实验点
取点
求斜率
图名
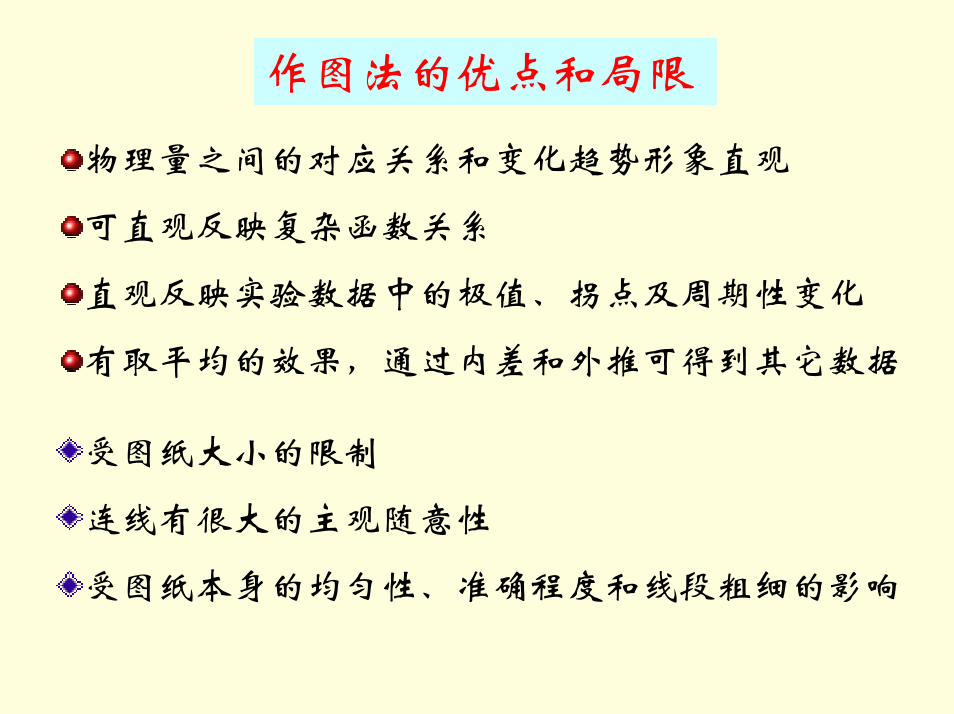
作图法的优点和局限
物理量之间的对应关系和变化趋势形象直观
可直观反映复杂函数关系
直观反映实验数据中的极值、拐点及周期性变化
有取平均的效果,通过内差和外推可得到其它数据
受图纸大小的限制
连线有很大的主观随意性
受图纸本身的均匀性、准确程度和线段粗细的影响
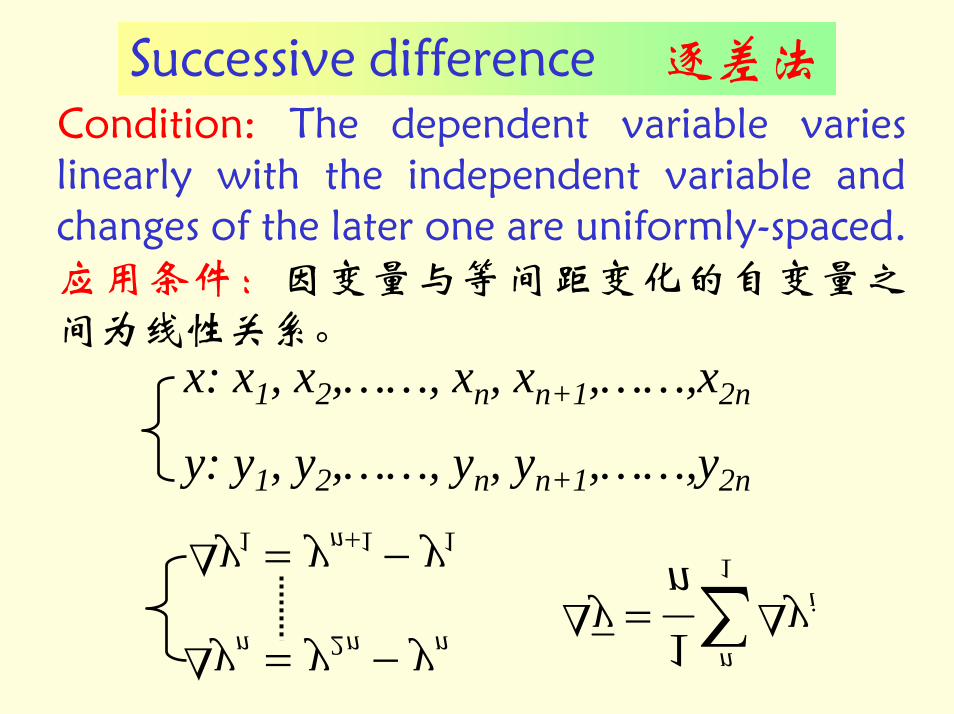
Successive difference 逐差法Condition: The dependent variable varies linearly with the independent variable and changes of the later one are uniformly-spaced.应用条件:因变量与等间距变化的自变量之间为线性关系。
x: x1, x2,……, xn, xn+1,……,x2n
y: y1, y2,……, yn, yn+1,……,y2n111 yyy n −=∆ +
nnn yyy −=∆ 2
∑∆=∆
n
iy
ny
1
1
Least-square procedure 最小二乘法