Math Fundamentals for Statistics I (Math 52) Unit 7 ...€¦ · Math 52 – Unit 7 – Page 1 Math...
35
Math 52 – Unit 7 – Page 1 Math Fundamentals for Statistics I (Math 52) Unit 7: Connections (Graphs, Equations and Inequalities) By Scott Fallstrom and Brent Pickett “The ‘How’ and ‘Whys’ Guys” This work is licensed under a Creative Commons Attribution- NonCommercial-ShareAlike 4.0 International License 3 rd Edition (Summer 2016)
Transcript of Math Fundamentals for Statistics I (Math 52) Unit 7 ...€¦ · Math 52 – Unit 7 – Page 1 Math...

Math 52 – Unit 7 – Page 1
Math Fundamentals for Statistics I (Math 52)
Unit 7: Connections (Graphs, Equations
and Inequalities)
By Scott Fallstrom and Brent Pickett “The ‘How’ and ‘Whys’ Guys”
This work is licensed under a Creative Commons Attribution-
NonCommercial-ShareAlike 4.0 International License 3rd Edition (Summer 2016)

Math 52 – Unit 7 – Page 2
Table of Contents 7.1 Graphing and Functions Revisited ............................................................................................... 3
We saw some graphing concepts in the first unit, and here we review the key pieces. Visually representing relationships is very important in this course and in statistics.
7.2 Basics of Equations and Solutions ................................................................................................. 8 Sometimes, two quantities have exactly the same value, and we call those quantities equal. Writing the relationship is called an equation, and if variables are included in an equation, it is up to us to see what values will actually work and create the equality.
7.3 Multi-Variable Equations and Solutions .................................................................................... 10 What's better than one variable in an equation? If you said more than one, you're right. In fact, these multi-variable equations provide the solutions that we can plot on an x-y graph.
7.4 Multi-Variable Equations; Slope and Intercepts ....................................................................... 12 Being able to find the slope and intercept for lines helps with understanding how the variables relate to each other.
7.5 Making Linear Equations – Part 1 ............................................................................................. 17 Taking the visual information of a graph and turning it back into an equation is a very useful skill in statistics. All it takes is a little practice!
7.6 Solving equations Part 1: The Magic Boxes .............................................................................. 19 Once we have the concept of equations and how to determine if a number is a solution, we create a new tool so that we can actually find the solution. It is a very visual approach and quite a cool one at that. Time to impress your friends!
7.7 Solving Equations Part 2: The Magic of Algebra ..................................................................... 24 The magic boxes are cool, but can we find the solutions without drawing the boxes?
7.8 Making Linear Equations – Part 2 ............................................................................................. 28 Previously we made linear equations from a graph, but now we use the same concepts to build the equations from just two points. It is a bit more abstract, but can be more efficient.
7.9 Modeling Two-Variable Functions ............................................................................................. 29 We model some data to create equations that represent realistic situations. Interpretation of the resulting values is extremely important because in statistics, we need to know how to interpret our results.
7.10 Inequalities .................................................................................................................................. 31 When quantities are not equal, we don't just abandon them. Instead, we create a new concept and we can still graph them. The relationships here form ideas that will be expanded on in Math 95 as well as in statistics.
INDEX (in alphabetical order): ......................................................................................................... 35

Math 52 – Unit 7 – Page 3
7.1 Graphing and Functions Revisited This course began with patterns and in unit 1, we saw how to turn patterns of numbers into graphs. Let’s review a bit of that unit. In this unit, we’ll often refer to the input as the x-coordinate and the output as the y-coordinate. Interactive examples (1): Circle the correct response.
A) For a pattern like dnaan 1 , we called it an (arithmetic or geometric) sequence.
B) For a pattern like dnaan 1 , we called d the common (difference or ratio).
C) If we wanted to find the 10th term, we would substitute 10 in for ( a or n or d ).
D) For a pattern like 1 nn ara , we called it an (arithmetic or geometric) sequence.
E) For a pattern like 1 nn ara , we called r the common (difference or ratio).
F) If we wanted to find the 10th term, we would substitute 10 in for ( a or n or r ).
Interactive examples (2): On the grid, plot the points (2, 5), (– 3, 4), (– 4, –1), (4, – 2), and (0, – 5).
Interactive examples (3): On the grid above, find the coordinates of the following points: A:_______ B:________ C:________ D: ________ Any point with a coordinate of 0 is located on an axis, either the x-axis or y-axis. Are any of the labeled points on an axis? Explain.
x
y
A
B
C
D

Math 52 – Unit 7 – Page 4
EXPLORE (1)! Let’s graph a sequence we’ve had before. It’s an arithmetic sequence formed when the outputs increase by 1 for each term.
On the grid below, graph the points and connect them. What shape is made?
Example (4): In this graph, there are many ways we could represent the relationship between inputs and outputs. Let’s write out the different ways below.
A) As an arithmetic sequence (write the equation)
413113 nanana nnn
B) As an equation representing x and y-coordinates.
44 xynan
C) As a function using function notation:
444 xxfxynan
Using the function notation above, determine 17f .
13417174 fxxf
Input 0 1 2 3 4 5
Output – 4 – 3 – 2 – 1 0 1
x
y

Math 52 – Unit 7 – Page 5
Let’s create a graph and the associated function. The population in California has increased massively over the past century. Here’s a graph giving some information about California population.
Source: Just the Facts: California’s Population, PPIC, 2014.
EXPLORE (2)! Answer the questions about the graph.
A) ** What was the population in 2004?
B) When did the population first reach 30 million? Since this is population, let’s call this function xP , where P is the population measured in millions
of people and x is the number of years after 1900. So if we wrote 40P , this would represent an
input (x-coordinate) of 40 which really means the year 1940. But 40P is really the output that
comes from an input of 40, so 40P is the y-coordinate that has an x-coordinate of 40. We can
approximate this on the graph and it looks like an output of 7.5. So we would write 5.740 P . In order to interpret 5.740 P , we write a sentence that relates the inputs and outputs. The interpretation would be: “In 1940, the population of California was 7.5 million people.” EXPLORE (3)! Find and interpret the following information about the function.
A) ** 16P B) 108P
EXPLORE (4)! Find x to satisfy the condition and interpret the result.
A) ** 10xP B) 31xP
0 20 40 60 80 100 Years after 1900
Math 52 – Unit 7 – Page 6
Let’s try another graph with interpretation. Here’s a chart that shows the relationship between degrees Fahrenheit and Celsius.
Source: mathsclass.net Interactive Examples (5): Answer these questions about the graph.
A) What does the x-axis represent?
B) What does the y-axis represent?
C) The point (10,50) is on the graph. Interpret what this means.
D) The function is given by 325
9 xxF where F is the temperature in degrees Fahrenheit
and x is the temperature in degrees Celsius. Find and interpret 50F .
E) At sea level, water boils at a temperature of 100˚ C. Find and interpret 100F .

Math 52 – Unit 7 – Page 7
EXPLORE (5)! Consider two functions: 12 xxf and 12 xxg . Use your calculator to determine the following:
A) ** 20f
B) 73f
C) ** 8g
D) 12g We could create input/output charts for any function so let’s try another one here. In this case, since the input is plotted on the x-axis, we’ll label it x. And the output is plotted on the y-axis, so we’ll label it y.
EXPLORE (6)! Our new function is given by: 2xxh . Use this function to fill out the rest of the table below. Then graph those points and connect them smoothly. Remember to use parenthesis when plugging in numbers ( ).
x xh
– 2
– 1
0
1
2
A) Does this graph/function look like an arithmetic or geometric graph? Explain.
B) What is the name of a graph like this?
x
y

Math 52 – Unit 7 – Page 8
7.2 Basics of Equations and Solutions Every equation in mathematics is like a sentence when read out loud. These sentences are either true or false, but if variables are included, it’s possible that an equation is true sometimes and false other times. Example (1): Determine whether the following are true or false.
A) 16 = 12 + 4 B) 23 = 50 – 17 C) 42 – 15 = 11 + 16
Solutions: Each of these is either true or false because there are no variables.
A) 16 = 12 + 4 is true. B) 23 = 50 – 17 is false. If written slightly different, we could say that 175023 is true. C) 42 – 15 = 11 + 16 is true because 42 – 15 = 27 and 11 + 16 = 27.
When variables are involved, we need to determine if a particular value will make the equation true or not. A solution to an equation is any number (or numbers) which will make the equation true when substituted for the variable. Example (2): Determine if x = – 4 is a solution for: 1423 x . Solution: We’ll substitute the x-value of – 4 into the equation and check to see if the resulting equation is true.
1423 x becomes 14243 . Notice how we used parenthesis for the substitution. Now we can simplify the left hand side.
14243 becomes 14212 . This resulting equation is true, so we would say that x = – 4 is a solution for: 1423 x . Example (3): Determine if x = 5 is a solution for: 1423 x . Solution: We’ll substitute the x-value of 5 into the equation and check to see if the resulting equation is true.
1423 x becomes 14253 . Notice how we used parenthesis for the substitution. Now we can simplify the left hand side.
14253 becomes 14215 . This resulting equation is false because – 15 + 2 = – 13, so we would say that x = 5 is not a solution for: 1423 x .
Math 52 – Unit 7 – Page 9
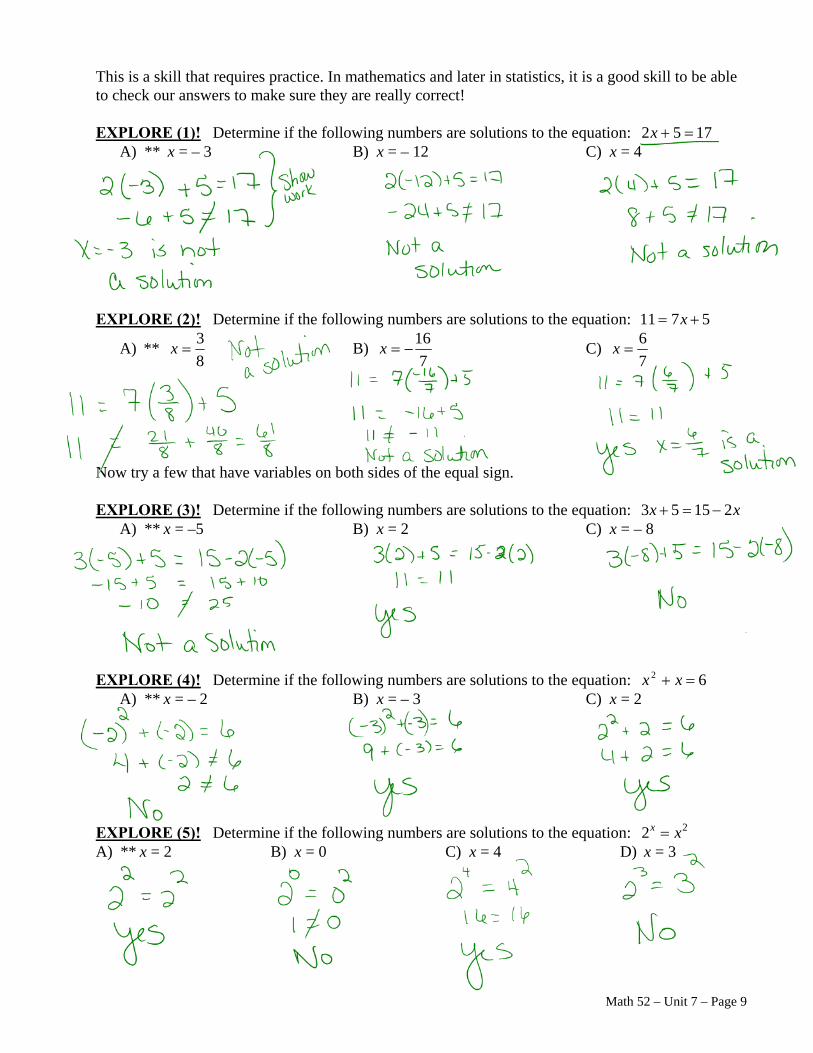
This is a skill that requires practice. In mathematics and later in statistics, it is a good skill to be able to check our answers to make sure they are really correct! EXPLORE (1)! Determine if the following numbers are solutions to the equation: 1752 x
A) ** x = – 3 B) x = – 12 C) x = 4
EXPLORE (2)! Determine if the following numbers are solutions to the equation: 5711 x
A) ** 8
3x B)
7
16x C)
7
6x
Now try a few that have variables on both sides of the equal sign. EXPLORE (3)! Determine if the following numbers are solutions to the equation: xx 21553
A) ** x = –5 B) x = 2 C) x = – 8
EXPLORE (4)! Determine if the following numbers are solutions to the equation: 62 xx
A) ** x = – 2 B) x = – 3 C) x = 2
EXPLORE (5)! Determine if the following numbers are solutions to the equation: 22 xx A) ** x = 2
B) x = 0
C) x = 4
D) x = 3
Math 52 – Unit 7 – Page 10
7.3 Multi-Variable Equations and Solutions When we get into more complicated equations, there could be more than one variable. As an example, we could have 57 xy . For an equation like this, we’ll need to know the values of both variables in order to determine if it is a solution. Remember, a solution to an equation is any number (or numbers) which will make the equation true when substituted for the variable. Example (1): Determine if x = 3 and y = 2 is a solution for: 1232 yx . We’ll substitute the variables into the equation and check to see if the resulting equation is true.
1232 yx becomes 122332 . Notice how we used parenthesis for the substitution. Now we can simplify the left hand side. 122332 becomes 1266 . This resulting equation is true, so we would say that x = 3 and
y = 2 is a solution for: 1232 yx . NOTE: When we are dealing with x and y values, we often write the solution as an ordered pair. Another way to write the result is: (3, 2) is a solution for 1232 yx . Example (2): Determine if (3, – 5) is a solution for: 1834 yx . We’ll substitute the variables into the equation and check to see if the resulting equation is true.
1834 yx becomes 185334 . Notice how we used parenthesis for the substitution. Now we can simplify the left hand side. 185334 becomes 121512 . This resulting equation is false, so we would say that (3, – 5)
is not a solution for: 1834 yx . NOTE: At this stage, we are not “solving” the equation, just determining whether something is or is not a solution. Please make sure you read the directions to make sure you are doing what is asked – sometimes students do something different and are frustrated when they lose points.

Math 52 – Unit 7 – Page 11
EXPLORE (1)! Determine if the following are solutions to the equation: 1232 yx A) ** (0, 4)
B) (5, – 3)
C) (15, – 6)
D) (– 6, 7) EXPLORE (2)! Determine if the following are solutions to the equation: 735 yx
A) ** (6.2, 8)
B) (2, 1)
C)
3
5,
5
2
D) (– 3, – 7)
Can there be more than one solution to an equation? Explain.

Math 52 – Unit 7 – Page 12
7.4 Multi-Variable Equations; Slope and Intercepts Now that we understand that there could be many solutions to some equations, let’s talk about how to find some of those solutions. Here’s a good example: 23 xy . This equation really describes a relationship between the x-values and y-values. The y-value (represented by y) is equal to the x-value multiplied by 3 and then subtract 2. We could see if there is a solution that corresponds to a particular x-value by substituting that value into the equation. Example (1): Find the solution of 23 xy that corresponds to x = 5. We’ll substitute the x-value into the equation first. 23 xy becomes 253 y , which simplifies to 215y . This shows that the y-value is 13 when x = 5. So (5, 13) is a solution to 23 xy . Now let’s check it to make sure. We will verify that (5, 13) is a solution to 23 xy .
23 xy becomes 25313 , which becomes 21513 . Since this last equation is true, then we have confirmed that (5, 13) is a solution to 23 xy . EXPLORE (1)! Find the corresponding y-coordinates and then write the solutions. When finished, graph your solutions and connect them (use a ruler if possible).
A) 32 xy
x y Solution
– 2
0
1
Using the shape you drew, find 2 other solutions from the graph. Describe how to get from one solution to the next solution… there is a pattern!
y
x

Math 52 – Unit 7 – Page 13
EXPLORE (2)! Find the corresponding y-coordinates and then write the solutions. When finished, graph your solutions and connect them (use a ruler if possible).
A) 22
1 xy
x y Solution
– 2
0
4
Using the shape you drew, find 2 other solutions from the graph. Describe how to get from one solution to the next solution… there is a pattern! Based on the last few problems, can you explain why mathematicians have called these types of equations linear equations? A linear equation has solutions that are all on one line. When we draw the line, we can often find other solutions that are different than the other points we found. EXPLORE (3)! What type of sequence do our graphs refer to, arithmetic or geometric? Why?
SLOPE Example (2): In the linear equation 32 xy , how do we move from one solution to the next? Solution: We graphed some points and found others on the line that was drawn. Those points on the graph were: (– 4,– 5), (– 3,– 3), (– 2,– 1), (– 1, 1), (0, 3), (1, 5). Between these points, we move up 2 and right one to get the next point. This was the exact concept from an earlier unit called slope. Slope
was the rate of change and we could represent this slope as x
ym
in change
in change . For this particular
equation, the slope is 1
2m .
y
x

Math 52 – Unit 7 – Page 14
EXPLORE (4)! Find two points and then calculate the slope.
A) ** 145
3 xy ; (5, ___ ) and (0, ____ )
B) 175 xy ; (3, ___ ) and (1, ____ )
Explain what you think the slope of 511 xy is.
INTERCEPTS When graphing points on a line or a curve, if the point is on the y-axis, then we call it a y-intercept. If the point is on the x-axis, then the point is called an x-intercept. Most lines have both types of intercepts. Interactive Example (3): Here’s the graph of the equation 42 xy . Identify all intercepts.
Interactive Example (4): Here’s the graph of the equation 22 xxy . Identify all intercepts.
One important idea about an intercept is that one coordinate must be 0. For an x-intercept, the y-coordinate must be 0. For a y-intercept, the x-coordinate must be 0.
x
y
y
x

Math 52 – Unit 7 – Page 15
EXPLORE (5)! Circle the points that are intercepts – label as x-intercept or y-intercept.
A) ** 0 ,6
B) ** 19 ,6
C) 6 ,1
D) 0 ,83.4
E) 304.0 ,6.1
F) 3 ,0
G) 0 ,0
H) 5 ,5
I) 51 ,0 EXPLORE (6)! What’s the difference between an x-intercept of 5 and an x-coordinate of 5? Give examples of both. So in order to find the y-intercept, we could substitute an x-coordinate of 0 into the equation. EXPLORE (7)! Let’s practice by finding the y-intercept of some linear equations.
A) ** Find the y-intercept of 8.63.12 xy
B) Find the y-intercept of 811
2 xy
Now let’s connect what we’ve learned.
What does the 8 in 85 xy represent?
What does the – 5 in 85 xy represent?
Interactive Example (5): In the equation bmxy , what do all the variables represent? If you know the y-intercept and the slope, can you use that to find other solutions (points)?
Math 52 – Unit 7 – Page 16
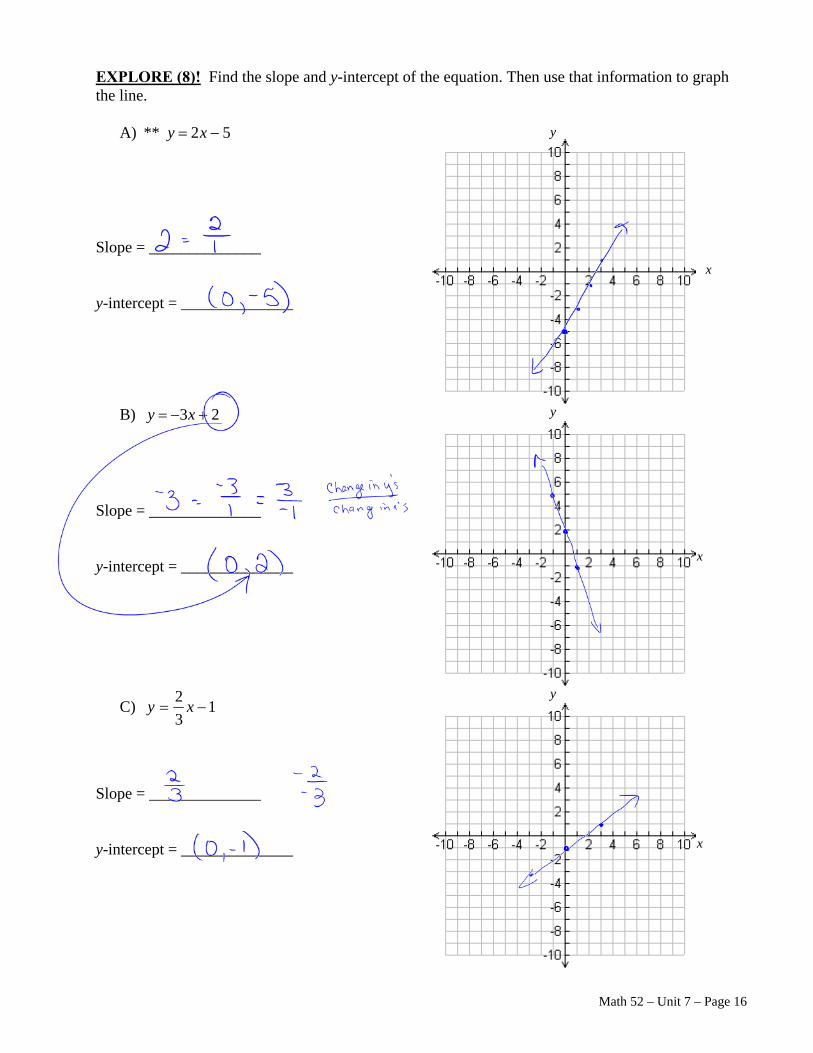
EXPLORE (8)! Find the slope and y-intercept of the equation. Then use that information to graph the line.
A) ** 52 xy Slope = ______________ y-intercept = ______________
B) 23 xy Slope = ______________ y-intercept = ______________
C) 13
2 xy
Slope = ______________ y-intercept = ______________
x
y
y
x
y
x

Math 52 – Unit 7 – Page 17
7.5 Making Linear Equations – Part 1 Now that we can take an equation and create a line from it, let’s reverse that and try to go the other direction. Example (1): Take the graph of the line and create an equation. It will be very helpful to think of the slope and y-intercept. Solution: First, find the y-intercept. That is the point on the y-axis where our line crosses, which is (0,– 2). Second, find the slope of the line. So pick any two points and we can find the slope. Let’s start with the point (0,– 2) and then move until we find another point. The line seems to go through (1,0) but also (2,2) and (3,4). Choose ANY of them! Let’s pick (0,– 2) and (3,4)… but remember that any two of these would work fine. From (0,– 2) to (3,4), think about the change in y-values and the change in x-values. The y-value increases by 6 units and the x-value increases by 3 units.
So our slope is 21
2
3
6m . This is all we need to make the equation of the line: 22 xy .
A line of the form bmxy is said to be in slope-intercept form. Can you see why it is called this? Example (2): Take the graph of the line and create an equation. It will be very helpful to think of the slope and y-intercept. Solution: First, find the y-intercept. That is the point on the y-axis where our line crosses, which is (0,5). Second, find the slope of the line. So pick any two points and we can find the slope. Let’s start with the point (0,5) and then move until we find another point. The line seems to go through (3,4) but also (– 6,7) and (6,3). Choose ANY of them! Let’s pick (0,5) and (– 6 ,7)… but remember that any two of these would work fine. From (0,5) to (– 6 ,7), think about the change in y-values and the change in x-values. The y-value increases by 2 units and the x-value decreases by 6 units.
So our slope is 3
1
6
2
6
2
m . Now make the equation of the line: 5
3
1 xy .
Slope y-intercept
Slope y-intercept

Math 52 – Unit 7 – Page 18
EXPLORE! Find the equation of the lines. Some points with integer coordinates are clearly marked. A) **
B)
C)

Math 52 – Unit 7 – Page 19
7.6 Solving equations Part 1: The Magic Boxes
To this point, we have seen how to check and see if a number is a solution to an equation. But we have not seen how to start with an equation that has a variable and come up with the solution. In Unit 1, we saw techniques to solving problems and one technique was “Guess-and-Check.” While that method can work, it is not very efficient – and it is much harder to guess solutions that are decimals and/or fractions. This section will give us new techniques to find solutions to equations. EXPLORE (1)! Let’s say that you were trying to walk from your house to a friends’ house, and you get these directions.
1. Go out your front door and turn left on Mesa. 2. Walk 1 mile west on Mesa 3. Turn left on El Camino 4. Walk a half mile south on El Camino 5. Turn left into my driveway
It is now your turn to give directions to your friend on how to get to your house from their house. Be specific – remember you’re going back to your house!
1.
2.
3.
4.
5. This idea of undoing directions has a similar concept in mathematics with undoing operations. Example (1): I have a number in mind and I added 5 to the number, then tell you the result. Could you get back to the original number? How? Solution: If you started with a number and added 5, then we could take the result and subtract 5 to get back to the original number. So if the number in mind was 12, then you’d add 5 and get 17. Once you tell me 17, I can subtract 5 to get back to 12, the original number.

Math 52 – Unit 7 – Page 20
Interactive Examples (2): Let’s try a few of the same ideas as we begin this new concept. Start with the first number and work through the steps going left to right.
A) **
B) Interactive Examples (3): Now try some where the only value given is not the first number! Your goal is to fill out all the empty boxes with the correct value. Also, if you’re doing a different operation, draw an arrow and describe the operation to show others what you are doing.
C) **
D)
E)
19 +5 ÷6 ÷4 +15 √
7 ×5 +4 ÷3 – 11 +23
+4 ÷ 3 ×7 + 16
11 6 ÷15
– 35 ×5 – 7 +13
8 ÷ 7
÷ 3 +4 ×3 – 11 11
– 23

Math 52 – Unit 7 – Page 21
EXPLORE (2)! Determine the inverse operation for each operation listed.
Operation Inverse Operation
Addition
Subtraction
Multiplication
Division
Squaring
Taking the opposite
Taking the reciprocal
Now that we see how to “undo” operations, we’ll practice a few. Inverse operations It is this idea that we use in mathematics to evaluate expressions like 3x – 4. In these situations, we would change the value of x and determine the value using the order of operations. We could even write these out with different values of x. Let’s find the value of 3x – 4 for x values of 1, 7, and – 5.
F) **
G)
H) I)
It is also this thinking that we use in mathematics to solve equations like 3x – 4 = 17. This type of thought process can solve some equations quickly. Once again, think of the numbers that will solve the equation for x as the first box and then write out the actual operations, in the order they occur, underneath, and an arrow showing the direction. What did you get as the solution to 3x – 4 = 17? Check your solution in the space below.
17 ×3 – 4
x
×3 – 4
1
×3 – 4
7
×3 – 4
– 5

Math 52 – Unit 7 – Page 22
EXPLORE (3)! Practice using these boxes to solve some equations. Write down the operations you’re doing in the order you’re doing them. Then work backwards to solve them.
A) ** 103
7
x
B) 71314 x
C) 8456 x
D) 84306 x
E) 4
13
x
EXPLORE (4)! These are more complicated and involve more than 2 steps. Practice using these boxes to solve some equations. Write down the operations you’re doing in the order you’re doing them, then work backwards to solve them.
A) 3 2 6 48x Now let’s use the distributive property on the left hand side of part (A) and then solve it again. Use as many boxes as you need.
B) 48186 x

Math 52 – Unit 7 – Page 23
C) 3 10
83
x
Now let’s rewrite the left hand side of part (C) as two fractions and then solve it again.
3
10
3
10
3
3
3
103
x
xx. Use as many boxes as you need.
D) 83
10x
Try this one – think of what you’ve done in the past and try it!
E) 592 x Do we need to distribute multiplication across addition to solve equations? Explain. Are there many ways to solve equations? Explain your answer. Think of the steps needed to solve an equation; do these “magic boxes” give you an idea about how to solve equations?

Math 52 – Unit 7 – Page 24
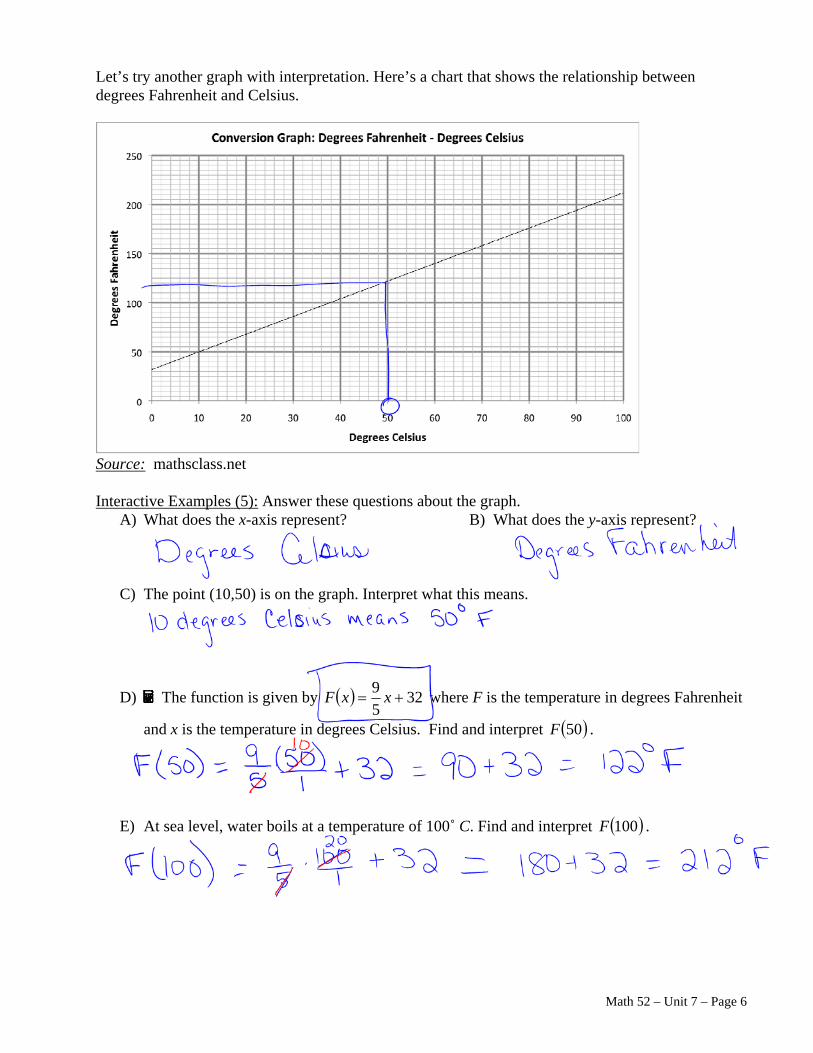
7.7 Solving Equations Part 2: The Magic of Algebra Those boxes were pretty cool, and guess what – you can use them in virtually every situation. At times, math folks prefer that things look more mathematical and they like using a branch of mathematics called Algebra. But where does the word come from and what does it mean? For Love of the Math: The word Algebra comes from the name of a book written by Persian mathematician al-Khwarizmi. The book was titled: “Ilm al-jabr wa’l-mukabala”, and in some languages in the middle east, al-jabr means ‘restoration.’ We often call Algebra now the branch of mathematics that deals with variables and properties – when we deal with numbers and properties, it’s often called Arithmetic. So the unknown quantity needs to be restored back to a known quantity, and the way we figure out what the value of a variable is can be thought of as restoring the value. Fun fact: al-Khwarizmi created processes for solving equations, and his name is the basis for the word algorithm. Math is universal! Algebra gives us a more general perspective and gives us a way to work with unknown quantities. The concept from the boxes section was to undo operations. The properties of algebra are based on these same concepts. We’ll start with some properties that relate to equations (expressions that are equal). Let’s start by thinking of an equal sign as telling us the relationship between two expressions the same way that a pan-balance would tell you the relationship between two quantities. A picture of a pan-balance is to the right. If the quantities are the same, then the pans will be balanced! Now let’s talk about what happens when we do something to the pan balance itself. You could picture this as something as basic as 3 + 4 = 7. Interactive Examples (1): Answer “yes” or “no” to each question.
A) Y N If you added the same quantity to both sides of a balance, would it still remain balanced?
B) Y N If you removed the same quantity from both sides, would it still remain balanced?
C) Y N If you multiplied each side of the balance by the same amount (like putting groups of
that quantity on one pan of the balance over and over), would it still remain balanced?
D) Y N What if you split the amount on each side of the balance into equal sized pieces… would those pieces balance if the original amounts balanced? (This would be like cutting each value in half, or into 5 equal sized pieces.)
Based on our answers above, we can see that the balance won’t change if we use these basic operations. Because we started with an equal sign, we’ll refer to these as the properties of equality. Each time, we’ll start with an equation and then do one of our basic operations to both sides. The result will be an equation that looks different, but has the same solutions as the original! (Looks different, has the same values – just like we’ve done all term.)

Math 52 – Unit 7 – Page 25
The following properties will be used to solve equations; in each case, a is any real number: A) Addition Property of Equality. If we start with yx , then ayax .
B) Subtraction Property of Equality. If we start with yx , then ayax .
C) Multiplication Property of Equality. If we start with yx , then yaxa .
D) Division Property of Equality. If we start with yx , then a
y
a
x . For this property, we
have to restrict the value of a because we know that dividing by 0 is undefined. So 0a .
Here’s an example of how we write this algebraically when solving an equation like 1743 x . 1743 x Take the starting equation and add 4 to both sides. What property?
417443 x Simplify the equation. 213 x Divide both sides by 3. What property?
3
21
3
3
x
Simplify the equation. 7x For Love of the Math: Here’s an interesting point – since a field has only addition and multiplication, we really could always add or multiply and have only two properties of equality. The great thing about algebra is that you could use whatever property you want – your choice! EXPLORE (1)! Solve the following equations using the properties of equality. To move from one equation to the next, we need to justify what we are doing. Each “step” needs a property or a reason.
A) ** 5x – 17 = 18
B) 3x – 2 = 5
C) 3(x – 7) = – 6
D) 93
7
x
This works great if we had a variable on only one side of the equation. But what if we have variables on both sides? Could we use the properties of equality with algebraic quantities instead of just numbers… and thankfully the answer is YES!! Example (2): Solve 5x – 4 = 3x + 20 using our algebraic properties.

Math 52 – Unit 7 – Page 26
20345 xx Subtract 3x from both sides. What property?
2033435 xxxx Simplify the equation. 2042 x Add 4 to both sides. What property? 420442 x Simplify the equation. 242 x Divide both sides by 2. What property?
2
24
2
2
x
Simplify the equation. 12x We can (and should) check this to see if it is a solution. This is a good habit to get in for every problem.
20345 xx 201234125 2036460 5656 . Since this is true, we know that 12 is a solution to the equation! EXPLORE (2)! Solve the following equations using the properties of equality.
A) ** 3x – 4 = 5x – 6
B) 3x – 2 = 5 – 4x
C) 15
23
xx
In this last set, we’ll see that the solutions don’t need to be integers. Practice a few more to be more familiar with them.

Math 52 – Unit 7 – Page 27
EXPLORE (3)! Solve the following equations using the properties of equality. Check your work too!
A) **2(x – 2) = 5x – 6
B) 7
8253
xx
C) 158.31.12.6 xx
Math 52 – Unit 7 – Page 28
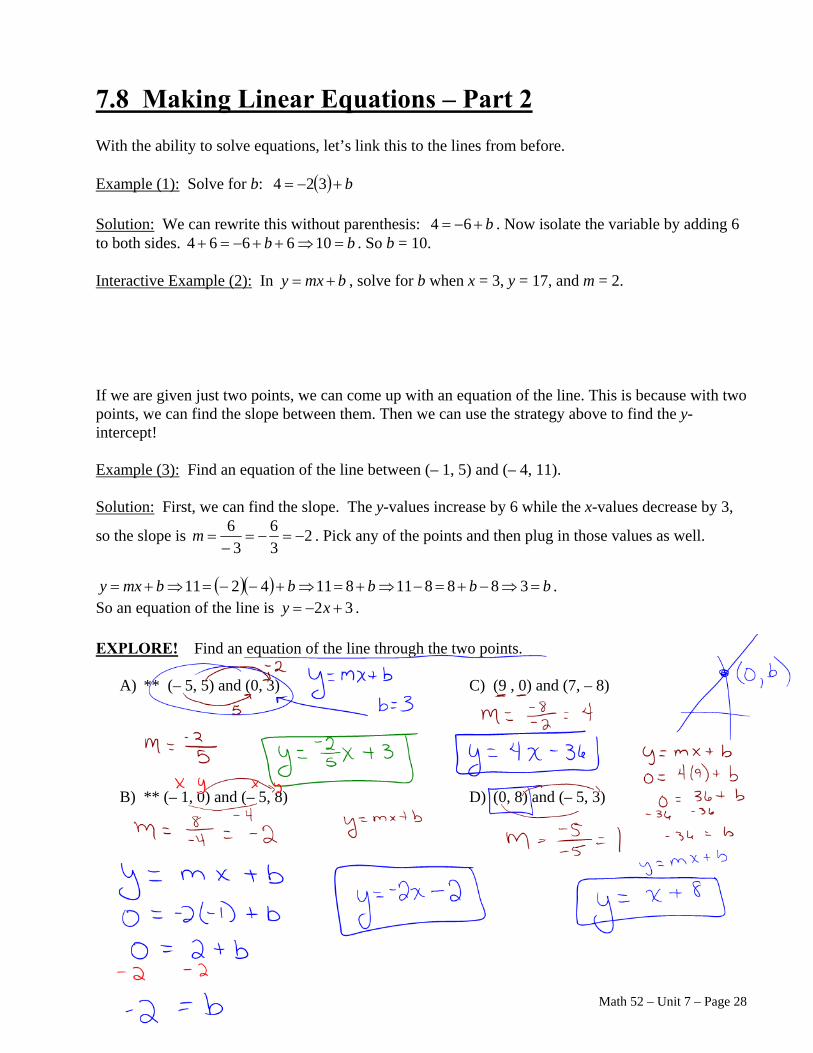
7.8 Making Linear Equations – Part 2 With the ability to solve equations, let’s link this to the lines from before. Example (1): Solve for b: b 324 Solution: We can rewrite this without parenthesis: b 64 . Now isolate the variable by adding 6 to both sides. bb 106664 . So b = 10. Interactive Example (2): In bmxy , solve for b when x = 3, y = 17, and m = 2. If we are given just two points, we can come up with an equation of the line. This is because with two points, we can find the slope between them. Then we can use the strategy above to find the y-intercept! Example (3): Find an equation of the line between (– 1, 5) and (– 4, 11). Solution: First, we can find the slope. The y-values increase by 6 while the x-values decrease by 3,
so the slope is 23
6
3
6
m . Pick any of the points and then plug in those values as well.
bbbbbmxy 3888118114211 .
So an equation of the line is 32 xy . EXPLORE! Find an equation of the line through the two points.
A) ** (– 5, 5) and (0, 3)
B) ** (– 1, 0) and (– 5, 8)
C) (9 , 0) and (7, – 8)
D) (0, 8) and (– 5, 3)

Math 52 – Unit 7 – Page 29
7.9 Modeling Two-Variable Functions Now we can apply our skill with equations and functions to problems that arise outside of a math class. Here’s one that came up recently at a new arcade. Playing new games on huge screens with their friends, kids can even play online with others around the world. However, the screens are expensive so the arcade charges $5 for each kid to enter. If you want to play some games, it costs $3 per game. Interactive Examples: To help us get a feel for the way this cost works, let’s check a few situations.
A) Write out the first few terms to represent the number of games played. What happens to the cost each time we play one more game?
B) What type of a sequence is this?
C) Can we find a formula for this type of sequence? Since the cost depends on the number of games played, we have a function that relates cost, C, in dollars to the number of games played, x. Our formula as a function becomes: xxC 35 . EXPLORE (1)! Find the following and interpret the results.
A) 12C
B) 73C
C) 5C
D) What x makes 26xC ?
E) Find and interpret the y-intercept and slope of this function.

Math 52 – Unit 7 – Page 30
EXPLORE (2)! The value of a car is represented by xxV 000,3000,28 , where V(x) models the value of the car in dollars when it is x years old. Based on the formula found here, find and interpret the following:
A) 8V
B) 0V
C) 5V
D) What value of x makes 0xV ?
E) Find and interpret the y-intercept and slope of this function. EXPLORE (3)! Let’s visit a different arcade. Here the cost to play is modeled by xxC 210 .
Let x represent the number of games and xC represent the cost in dollars. Based on the formula found here, find and interpret the following:
A) 12C
B) 73C
C) 5C
D) What x makes 26xC ?
E) Find and interpret the y-intercept and slope of this function. EXPLORE (4)! Now compare to the original arcade. Which arcade is better? Explain your reasoning.

Math 52 – Unit 7 – Page 31
7.10 Inequalities
Not every situation has exact values and could create an equation. Some examples are:
Here’s some questions about these signs.
For the first sign – is it okay if the capacity is 600 pounds? For the second – is it okay if you are 20 years old? What about exactly 21 years old? For the last sign, if someone is 28 inches tall is that okay? What about exactly 34 inches?
For real life situations that aren’t exact, mathematicians use inequalities. Here’s how the signs would look with inequalities.
1. Maximum capacity of 750 pounds means: 750C . 2. At least 21 years of age would be: 21A . 3. Taller than 34 inches would be: 34H .
The symbols have been used before, so remember what they mean.
Symbol Meaning Example Greater than 34H means H is greater than 34 but could not be equal to 34.
Greater than or
equal to 21A means A is greater than or equal to 21. A could be greater
than (like 40) or equal to (like 21). Less than 17M means M is less than – 17 but could not be equal to – 17.
Less than or
equal to 750C means C is less than or equal to 750. A could be less than
(like – 40) or equal to (like 750). = Equal to J = 3.2 means that J is exactly 3.2 and could not be more or less.
Not equal to P 1.7 means that P is not equal to 1.7; it could be more than 1.7 or less than 1.7, but not exactly 1.7.
In English, we often use other phrases to represent these inequalities. Create an inequality that would go with each “slang” phrase.
Slang Variable Mathematical Expression Blood alcohol level higher than 0.08% ** B No more than 20 people allowed. ** P Fewer than 500 students were in attendance. S This classroom can hold at most 38 students. S For your baby to gain weight, she must consume at least 700 calories per day.
C
Between 20 and 50 people ride this bus each day. P Between 15 and 70 ants are on this cheese, inclusive. A
Math 52 – Unit 7 – Page 32
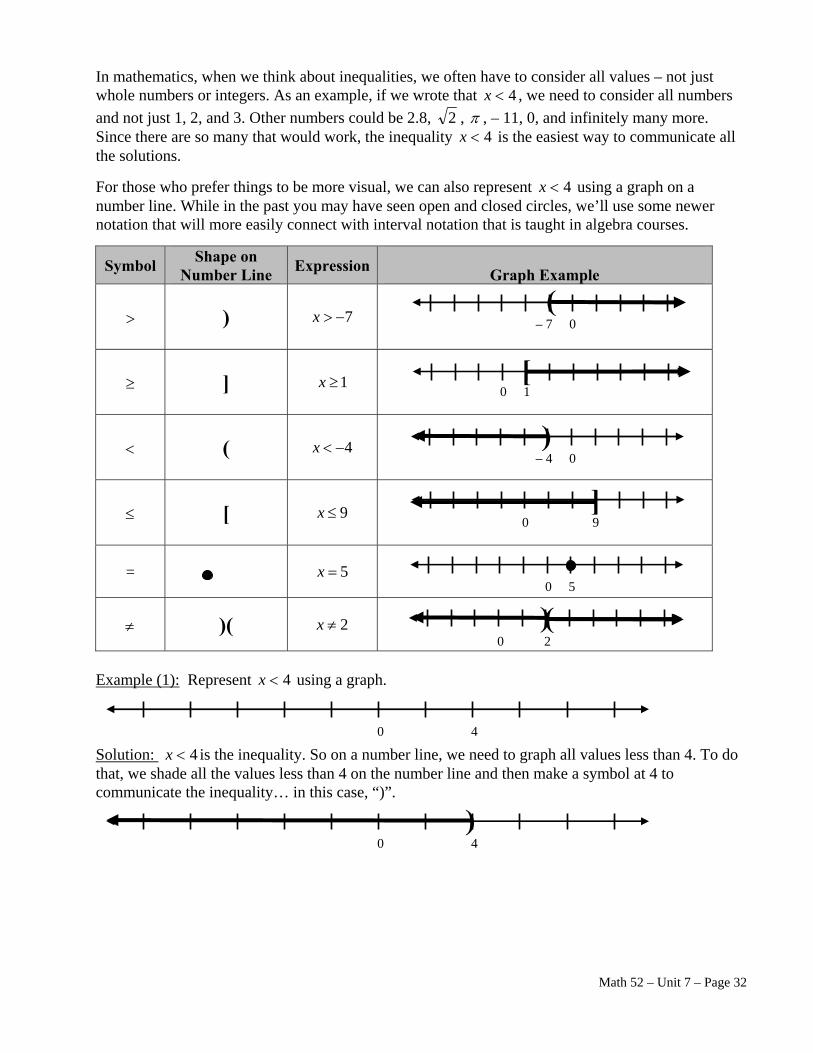
In mathematics, when we think about inequalities, we often have to consider all values – not just whole numbers or integers. As an example, if we wrote that 4x , we need to consider all numbers
and not just 1, 2, and 3. Other numbers could be 2.8, 2 , , – 11, 0, and infinitely many more. Since there are so many that would work, the inequality 4x is the easiest way to communicate all the solutions.
For those who prefer things to be more visual, we can also represent 4x using a graph on a number line. While in the past you may have seen open and closed circles, we’ll use some newer notation that will more easily connect with interval notation that is taught in algebra courses.
Symbol Shape on
Number Line Expression
Graph Example
) 7x
] 1x
( 4x
[ 9x
=
5x
)( 2x
Example (1): Represent 4x using a graph. Solution: 4x is the inequality. So on a number line, we need to graph all values less than 4. To do that, we shade all the values less than 4 on the number line and then make a symbol at 4 to communicate the inequality… in this case, “)”.
0 4
0 4 )
– 7 0 (
0 1 [
– 4 0 )
0 9 ]
0 5
0 2
) (

Math 52 – Unit 7 – Page 33
EXPLORE (1)! Try some on your own. Answer with a graph.
A) 2x
B) 4.1x
C) 11x
D) 3x
E) 7.4x
F) 7x
0 1
0 1
0 3
0 1
0 2
0 1

Math 52 – Unit 7 – Page 34
Now we’ll try to write the interval notation for certain graphs. Example (2): Find the verbal description for the graph.
The graph describes all numbers less than 20. Interactive Example (3): Find the verbal description for the graph. EXPLORE (2)! Try some on your own; describe the solution in words.
A)
B)
C)
D)
E)
NOTE: A graph with two portions can be seen in real life. An example would be blood pressure. If the systolic blood pressure is above 140 or less than 75, there may be health problems.
) 0 20
[ – 5 0 30
– 13 0
] (
)
) (
– 3 0 3
[ ) 0 5
[ 0 7 14
( 0 2
) [ )
( ) 75 140

Math 52 – Unit 7 – Page 35
INDEX (in alphabetical order):
Addition Property of Equality ....................... 25 Algebra .......................................................... 24 axis .................................................................. 3 Division Property of Equality ....................... 25 inequalities .................................................... 31 inverse operation ........................................... 21 linear equation ............................................... 13 Multiplication Property of Equality .............. 25 not a solution ................................................... 8 properties of equality .................................... 24 slope .............................................................. 13
slope-intercept form ...................................... 17 solution ...................................................... 8, 10 Subtraction Property of Equality ................... 25 undoing operations ........................................ 19 x-axis ............................................................... 3 x-coordinate ..................................................... 3 x-intercept ...................................................... 14 y-axis ............................................................... 3 y-coordinate ..................................................... 3 y-intercept ...................................................... 14