
Master’s Programme in Mechanical Engineering
104
Master’s Programme in Mechanical Engineering The effects of static strain aging on the mechanical performance of nodular cast iron Ville Björklund Master’s Thesis 2021
Transcript of Master’s Programme in Mechanical Engineering
Master’s Programme in Mechanical Engineering
The effects of static strain aging onthe mechanical performance ofnodular cast iron
Ville Björklund
Master’s Thesis2021
Tekijä Ville BjörklundTyön nimi Staattisen myötövanhenemisen vaikutukset pallografiittivaluraudanmekaanisiin ominaisuuksiinMaisteriohjelma Konetekniikka (Mechanical Engineering) Koodi ENG25Työn valvoja Professor Sven BossuytTyön ohjaaja(t) Professor Hannu HänninenPäivämäärä 30.7.2021 Sivumäärä 90+7 Kieli EnglantiTiivistelmäKBS-3 loppusijoituskonseptissa käytetty ydinpolttoaine on tarkoitus sijoittaa suuriinkuparikapseleihin, jotka haudataan syvälle peruskallioon. Kapselin pääasiallinen kuromaakantava elementti on tarkoitus valmistaa EN-GJS-400-15U ferriittisestä pallografiitti-valuraudasta (PGR). Loppusijoitusolosuhteiden takia herää kysymys myötövanhenemisenmahdollisista vaikutuksista sisäosan kestävyyteen, joita ei ole tutkittu nykyiselläänriittävästi. Tässä diplomityössä käsitellään staattisen myötövanhenemisen vaikutuksiasisäosassakäytettävän PGR:n mekanisiin ominaisuuksiin ja sisäosan kestävyyteen.Staattista myötövanhenemista tutkittiin esivenyttämällä materiaalista valmistettujavetosauvoja 1 %, 2 % ja 3 % nimellisiin venymiin. Esivenytettyjä näytteitä ikäännytettiin erilämpötiloissa, jotka vaihtelivat huoneenlämpötilasta 400 ℃-asteeseen. Staattinenmyötövanheneminen (SSA) toi korostuneen myötörajan esiin materiaalin jännitys-venymäkäyrissä kaikilla tutkituilla esivenymillä, kaikissa tutkituissa lämpötiloissa jakaikilla tutkituilla ikäännytysajoilla, vaikka vastaanotetussa tilassaan tutkittu materiaalimyöti tasaisesti ilman korostunutta myötörajaa. Esivenymän suurentaminen nostimateriaalin myötörajaa enemmän verrattuna matalampiin esivenymiin. Maksimaalinenmyötölujuus saavutettiin jo yhden päivän ikäännytyksellä 100 ℃-asteen lämpötilassa jatätä pidempi 11 päivän ikäännytys ja/tai ikäännytyslämpötilan nostaminen 200 ℃-asteeseen ei vaikuttanut myötölujuuteen merkittävästi. Korkeammissa 300 ℃ ja 400 ℃lämpötiloissa myötölujuus nousi vähemmän ja myötörajasta tuli selvästi vähemmänkorostunut kuin matalammissa lämpötiloissa. Esivenyttämättömien testisauvojenikäännytyksellä ei ollut vaikutusta materiaalin käyttäytymiseen.Digitaalista kuvakorrelaatiota käytettiin venymien paikallistumisen tutkimiseenvanhennetuilla testisauvoilla. SSA ilmeni testisauvoissa venymien Lüders-nauha-tyyppisenä paikallistumisena myötörajan ympärillä. Tyypillisistä Lüders-nauhoistapoiketen useiden deformaationauhojen samanaikainen muodostuminen esti nauhojenliikkeen mittapituuden läpi johtaen ennenaikaisiin jännityskeskittymiin ja lopultamurtumaanAvainsanat Käytetty ydinpolttoaine; pallografiittivalurauta; staattinenmyötövanheneminen

Author Ville BjörklundTitle of thesis The effects of static strain aging on the mechanical performance ofnodular cast ironMaster programme Mechanical Engineering Code ENG25Thesis supervisor Sven BossuytThesis advisor(s) Hannu HänninnenDate 30.7.2021 Number of pages 90+7 Language EnglishAbstractFinland and Sweden are amongst the first countries moving forward with the plansregarding geological disposal of spent nuclear fuel. Spent nuclear fuel is intended to beplaced in long-term geological repositories in accordance with the KBS-3 method wherethe spent nuclear fuel is placed in large copper canisters that are sealed and buried deepin the bed rock. The load-bearing element in these canisters is an insert made of nodularcast iron of grade EN-GJS-400-15U. Questions regarding the possible role of strain agingin the material properties of the cast iron insert in the repository conditions have beenlargely overlooked and have not been thoroughly studied yet. This thesis explores thephenomenon of static strain aging in the nodular cast iron to be used for this application,and its effects on the mechanical performance of the material.Static strain aging was studied by pre-straining tensile specimens made from the givenmaterial to 1 %, 2 % and 3 % nominal strains. The pre-strained specimens were aged atvarious temperatures ranging from room temperature (RT) to 400 ℃ for varying times.The static strain aging brought pronounced yield point to the material for all studied pre-strain levels, temperatures, and aging times despite the as received material behavingsmoothly with no pronounced yield point. Increasing the pre-strain raised the yieldstrength of the material more compared to lower pre-strain. The maximum yield strengthlevels were already achieved with aging in 100 ℃ for 1 day and aging at highertemperature of 200 ℃ and/or increasing aging time to 11 days had no significant effecton the yield strength. Aging at higher temperatures of 300 ℃ and 400 ℃ resulted inlower increase in yield strength and the yield point became less pronounced as the agingtemperature was raised over 200 ℃. Aging non-pre-strained specimens had no effect onthe yielding behavior compared to as received material.Digital image correlation was used to study how the static strain aging affect the strainlocalization in the material. Strain aging was found to manifest as formation of complexLüders bands at the onset of yielding. Formation of multiple bands inhibited the bandpropagation and lead to premature localization of strain in these areas, which lead toearlier fracture.Keywords Spent nuclear fuel; ductile cast iron; static strain aging
ContentsSymbols and abbreviations ..................................................................................................................i
Symbols ............................................................................................................................................iAbbreviations ...................................................................................................................................i
1 Introduction ............................................................................................................................... 12 Literature review........................................................................................................................ 2
2.1 Nuclear waste program and KBS-3 .................................................................................... 22.1.1 Excavation damage zones and fracture growth in bedrock....................................... 32.1.2 Canister design........................................................................................................... 42.1.3 Insert manufacturing.................................................................................................. 52.1.4 Insert microstructure and possible defects ............................................................... 62.1.5 Non-destructive testing of the cast iron insert .......................................................... 92.1.6 Residual stresses in the insert.................................................................................... 92.1.7 Loads affecting the insert......................................................................................... 132.1.8 Mechanical testing of the insert .............................................................................. 172.1.9 Finite element analyses of the insert....................................................................... 202.1.10 Mechanical failure process and failure criteria of the insert ................................... 242.1.11 Temperature inside the canister.............................................................................. 25
2.2 Plasticity of crystalline materials...................................................................................... 262.2.1 Dislocations .............................................................................................................. 262.2.2 Diffusion ................................................................................................................... 272.2.3 Dislocation locking ................................................................................................... 29
2.3 Strain aging....................................................................................................................... 302.3.1 The role of temperature in strain aging ................................................................... 322.3.2 The effects of aging time.......................................................................................... 332.3.3 The role of strain in strain aging .............................................................................. 342.3.4 Grain size and solute atoms ..................................................................................... 35
2.4 Other possible embrittlement mechanisms the insert.................................................... 352.4.1 Hydrogen embrittlement ......................................................................................... 352.4.2 Radiation embrittlement.......................................................................................... 36
3 Methods ................................................................................................................................... 383.1 Material and sample preparation .................................................................................... 383.2 Experimental methods..................................................................................................... 393.3 Digital image correlation (DIC) ......................................................................................... 40

4 Results ...................................................................................................................................... 424.1 CERT ................................................................................................................................. 424.2 DIC .................................................................................................................................... 524.3 Microstructure ................................................................................................................. 684.4 Casting defects and crack initiation ................................................................................. 724.5 Break before yielding ....................................................................................................... 74
5 Discussion................................................................................................................................. 816 Conclusion................................................................................................................................ 857 References................................................................................................................................ 868 Appendices............................................................................................................................... 91
8.1 Appendix 1. Speckle patterns used for the DIC experiments .......................................... 91

i
Symbols and abbreviationsSymbols𝐴 total cross-sectional area of the dislocations per unit area of matrix𝐴𝑔𝑡 Elongation at maximum force𝐴𝑡 Elongation at fracture𝑐 Concentration𝑐0 Defect concentration a long way from dislocation𝛿 Thickness of grain boundary𝑑 grain size𝐷0 Maximal diffusion coefficient𝐷𝑎 Apparent diffusivity trough crystal𝐷𝑔 Diffusion coefficient trough grain boundary𝐷 Diffusion coefficient trough lattice𝐷 Diffusion coefficient trough dislocation𝐸 Interaction energy𝐽 Diffusion flux (chapter 2.2.2)/ J-integral (chapter 2.1.10)𝐽 𝑎 J-integral value for postulated crack𝐽2𝑚𝑚 J-integral value corresponding to 2 mm stable crack growth𝐾 Fracture toughness in mode I loading𝑄 Activation energy𝑅 Universal gas constant𝑆 𝐽 Safety factor in ASME code used for J-integral analysis𝑆 𝐾 Safety factor in ASME code (value changes depending on application)𝑇 Temperature𝑇𝑚 Melting temperatureAbbreviationsASME The American Society of Mechanical EngineeringBCC Body-centered cubicBWR Boiling water reactorCERT Constant extension rate tensile testingDCI Ductile cast ironDHD Deep hole drillingDIC Digital image correlationDSA Dynamic strain agingEBS Engineered barrier system
ii
EDZ Excavation damage zone𝐸𝐷𝑍 Construction induced excavation damage zone𝐸𝐷𝑍𝑆 Stress induced excavation damage zoneEDS Energy-dispersive X-ray spectroscopyEPR European Pressurised Water ReactorFCC Face-centered cubicFE Finite elementICHD Incremental Center-Hole DrillingKBS-3 Kärnbränslesäkerhet-3NDT Non-destructive testingPWR Pressurised water reactorSEM Scanning electron microscope/microscopySKB Svensk kärnbränslehantering ABSSA Static strain aging
1
1 IntroductionThe spent nuclear fuel from nuclear power plants in Finland and Sweden is planned to bedisposed using the method called KBS-3 (kärnbränslesäkerhet 3). In this method largecopper canisters are used to seal the spent nuclear fuel after which the canisters are buriedin crystalline bedrock and surrounded with layer of bentonite clay. The method is based onthe general theory that radioactive deposit in the bedrock can be present for tens of thousandsof years without harming the health of human populations. The repository is designed to lastat least 100 000 years to ensure safe nuclear decay of the spent fuel without causingenvironmental harm.The copper canisters are comprised of the outer copper shell with welded copper lid, innercast iron insert with steel tube cassette inside and steel lid. The copper shell is used mainlyfor its corrosion resistance and high ductility which ensures the integrity of the shell in therepository conditions. The cast iron insert is the main load bearing structure in the canister,and it should withstand the environmental mechanical loads that it is subjected to. Thecanister insert can experience yielding due to rock shear movements along fractures in thebedrock that cross the canister hole.The nuclear decay of the fuel rods causes the temperature to rise inside the insert. Theestimated maximum temperature in the middle of the fuel rod bundle inside the cast ironinsert is about 230 ℃ according to worst case calculations and the temperature at the edgeof the bundle is around 30 ℃ lower [1]. In theory this heating of the insert enables thepossibility for dynamic and static strain aging in the cast iron insert if the canister insert issubjected to yielding in the repository. The phenomena of strain aging are known for longtime, but they are still not thoroughly understood. Strain aging has been studied more insteels than cast irons. The same principles should, apply for cast irons and steels but somedifferences are still to be expected. For example, the different silicon contents in thematerials change the activation energy of the carbon diffusion [2]. This can affect thetemperature ranges and strain conditions where the aging can occur. Some studies on thedynamic strain aging effects on the ductile cast iron grade planned to be used in the inserthave already been conducted [3]. However, studies regarding of the static strain aging of thespecific cast iron grade in the repository conditions have not been conducted and thephenomenon should be studied further. In this study the static strain aging of the cast ironinsert over a range of conditions spanning those predicted for the repository is examined.
2
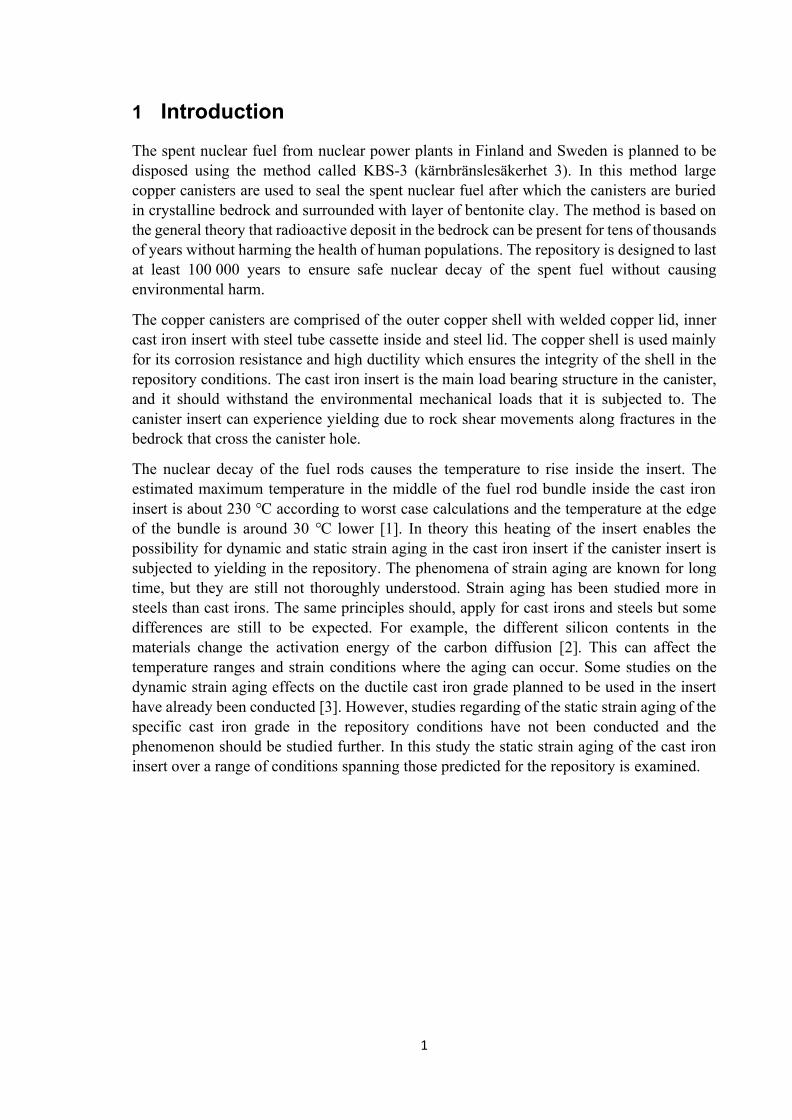
2 Literature review2.1 Nuclear waste program and KBS-3The KBS-3 method is developed by Swedish Nuclear Fuel and Waste ManagementCompany SKB. The Finnish nuclear waste management company Posiva and Swedish SKBintend to use this method for long term nuclear waste disposal in Finland and Sweden. TheKBS-3 method consists of three main protective barriers: the copper canister, bentonite claybuffer and crystalline bedrock (figure 1). The copper canisters containing the spent nuclearfuel are buried approximately 500 meters deep to the bedrock and the empty space in thedeposition holes is filled with bentonite clay. Finally, the tunnel leading to the depositionhole is backfilled with bentonite clay. [4][5]
Figure 1 Illustration of the KSB-3 method [5]Each of the barriers have their own safety functions. The safety functions of the differentparts in the engineered barrier system (EBS) in Posiva’s repository concept are as follows[6]:
1) The main safety function of the canister is to ensure the prolonged containment ofthe spent nuclear fuel. This function is mainly dependent on the mechanical strengthand load bearing capabilities of the canister as well as the corrosion resistance.2) The safety functions of the bentonite buffer are:a. Provide favorable and predictable conditions regarding the mechanical,geochemical and hydrogeological conditions for the canister and protect thecanister from external processes that could compromise its safety functionsand the containment of the spent nuclear fuel.b. Limit the release of the radionuclides if the canister fails.3) The safety functions of the deposition tunnel back fill and plug are to:a. Contribute to favorable and predictable mechanical, geochemical andhydrogeological conditions for the buffer and the canister.b. Limit the release of radionuclides if the canister fails.
3
c. Contribute to the mechanical stability of the host rock in the vicinity of thedeposition tunnels.4) The safety functions of the backfill of underground openings are to:a. Assure that the long-term isolation of the repository from the surfaceenvironment and normal habitats for humans and other biota is notcompromised.b. Limit the inflow to and release of harmful substances from the repository.2.1.1 Excavation damage zones and fracture growth in bedrockWhen considering the possibility of strain aging in the cast iron canister insert it is importantto understand the environmental causes for the possible loading scenarios that are imposedon the canister. The different loading scenarios affecting the canister and the possibleoccasions where actual plastic straining of the cast iron insert can occur are reviewed insection: 2.1.7 “Loads affecting the insert”.When the repositories are designed the deposition, holes are located so that they do notintersect natural fractures of the rock mass. This is essential to avoid the possibility of rockshear movements larger than 50 mm across the canister. However, the rock mass around thedeposition hole and the tunnel is affected by the excavation damage that is caused by theconstruction. In the area affected by the excavation damage the rock strength is significantlyreduced and the hydraulic conductivity is increased. This zone is called excavation damagezone (EDZ) which can be further divided into two different zones: construction induced𝐸𝐷𝑍 and stress induced 𝐸𝐷𝑍𝑆 zone. The EDZ increases the risk for different types of rockdamage mechanisms such as rock shear and spalling which in turn can affect the integrity ofthe disposal canister.[7]In-situ experiments in Olkiluoto site have shown that the anisotropic rock masses canexperience structurally controlled failure at the lithological borders. In this failure mode theweakest plane fails causing stress relaxation and preventing further progressive failure. Inall experiments sub critical fracture growth was observed after boring the test holes. Thefracture propagation was observed in two weeks to 18-month period after the boring. TheKBS-3V method was found to be prone to initiation of new fractures sometime after theexcavation, whereas the KBS-3H method was not. However, after 60 years of disposal,fracture initiation can be expected in both vertical and horizontal repositories. Based on theexperiments two-fold failure criterion consisting of 40 MPa for rock mass damage onset and90 MPa for rock mass strength have been proposed.[7]The probability for critical rock shear movements in the repository sites during deposition isvery low. It is estimated that out of 6000 canisters approximately 4 canisters would be inunsuitable locations where the rock shear amplitude could reach 5 cm. Possibility for evenhigher rock shears has also been studied. Out of 6000 canisters approximately 0.5 canisterswould be subjected to rock shear of 10 cm which would correspond to about 0.12 failedcanisters over 1 000 000 year period due to the low probability of earthquakes. The risk forthe rock shear is directly proportional to the number of unsuitable canister positions and isthus 8 times higher for the 5 cm criterion [8]. In later studies the probability for 5 cm orlarger shear occurring has been even lower and the mean number of canisters expected to be

4
in critical positions out of 6000 canisters was less than 0.11 in Forsmark site for 5 cm shearcriterion [9].2.1.2 Canister designThe canister is the primary and most important barrier between the environment and thespent nuclear fuel. The canister is expected to effectively limit the release of the radioactivesubstances to the environment for minimum of 100 000 years. To ensure that this comestrue, the canister should remain sealed and intact with very good reliability in the repositoryconditions.The canister consists of the outer copper shell and massive cast iron insert. The outer shellof the canister is made of copper because copper has some important properties that make itsuitable for the outer layer. The material chosen for the outer shell is Cu-OFP (oxygen freecopper alloyed with 30-100 ppm phosphorus). This type of copper has very high ductilityand good corrosion resistance, which are critical in order the ensure that the canister remainssealed and intact in the repository. However, the outer shell does not have good load bearingcapabilities. The main function of the cast iron insert is to be the load bearing element in thecanister design. Additionally, the cast iron insert helps to shield the radiation inside.
Figure 2. Exploded view of the canister components. The components from left to right are: copper overpack, castiron insert, steel lid, screw for the lid, copper lid.[10]There are three different types of canisters for different reactor types since the fuel elementsin the reactors have different geometry. The BWR, PWR and VVER-440 canisters arepresented in figure 3. The canister dimensions vary depending on the type. The outerdiameter of the canister is the same 1.05 m for all canister types, but the total length varies.The lengths of the VVER-440, BWR and PWR canisters are 3.552 m, 4.75 m and 5.223 mrespectively.[6]

5
Figure 3 Three different canister types from left to right: VVER-440, BWR and EPR/PWR [6]2.1.3 Insert manufacturingThe cast iron insert is manufactured by casting. The channels in the cast iron insert areformed when the iron is cast around steel tube cassette in a mold.The steel tubes are manufactured from cold formed steel plates with welding or are directlyhot formed. The hot formed steel tube material should fulfil the requirements in EN 10210-1 S355J2H and the cold formed steel plates should fulfil the requirements in EN 10219-1S355J2H. The steel tube cassette is manufactured by welding the steel tubes together withsupport plates. The support plates and flat bars that are used to manufacture the cassette aremade of EN 100250 S235JRG2 steel. The steel cassette structure for BWR insert is presentedin figure 4.[10][11]
Figure 4 The steel cassette construction for BWR insert.[11]
6
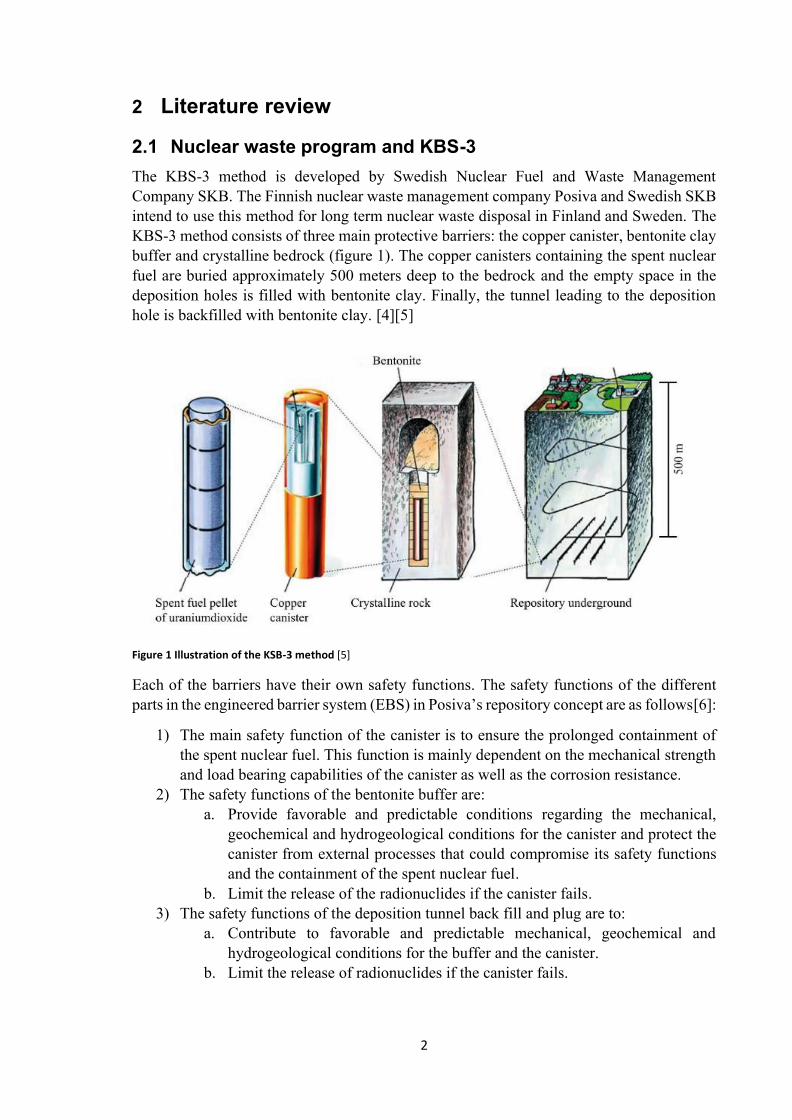
The insert is manufactured from EN-GJS-400-15U nodular cast iron by casting. Before thecasting process, the steel channels are filled with sand to avoid deformation of the steel tubesdue to the melt pressure of the cast. The casting method may vary between foundries, butthe casting molds used are made of either sand or steel. The molds can be filled from the topof the insert or from the bottom of the insert by leading the molten metal through a channeldown to the bottom of the canister. These methods are referred as top pouring and bottompouring, respectively. During the casting, the temperature of the melt is monitored closely,and the acceptable melt temperature is between 1310 ℃ and 1370 ℃. The filling of thecasting mold takes approximately 1 minute. After the casting process the insert is cooleddown in the casting mold for few days after which the steel channels are emptied and sandblasted. The excess material from the top of the canister is cut off and the channels of theinsert are inspected by moving specific gauge along the length of the channels. The insert isthen pre-machined and machined to its final dimensions. [11][12]2.1.4 Insert microstructure and possible defectsThe material properties are tested after the manufacturing by tensile testing. Tensile testingis done for test samples cut from the top of the insert as well as for cast-on samples. Thesamples cut from top of the insert are usually tested by a third party. The samples cut fromthe top represent the worst material properties of the insert rather reliably, since all the slagin the cast tends to float upwards. For this reason, the top samples are used to verify theconformity of the insert. The cast-on samples are not representative of the real cast and onlywork as indication of the result due to the much faster cooling rate in the samples. [12][13]The samples that showed the lowest and largest elongations in the tensile tests are inspectedwith optical microscopy to ensure that the microstructure is typical for nodular cast iron. Themicrostructure should in all positions be minimum of 80% of graphite forms V and VI asspecified in standard EN ISO 945 and should not include any graphite of forms I and II.Typical microstructure of the insert is shown in figure 5.[12][13]
Figure 5 Micrograph from the insert. Ferritic matrix with graphite nodules of form V and IV.[12]

7
In large casts like the cast iron insert it should be considered that the microstructure in thewhole cast is likely not entirely homogeneous. Dahlberg et al. found there to be a systematicvariation in the mechanical properties between the different sample positions of the cast ironinsert and between separate inserts [14]. While the effect on elastic and initial plasticproperties was found to be minimal, the effect on the elongation to fracture was significant.The differences can be explained by the local variations in graphite nodule sizes and thenodule density. Samples containing higher than average concentration of graphite nodulesgenerally tend to fracture at lower strain. Additionally, possible local defects in the cast canhave impact on the mechanical properties.There are several different types of defects that can be present in the cast iron insert. Thedifferent defect types and their detection in non-destructive testing (NDT) are explained inthe research of Pitkänen [11].Shrinkage cavities are cavities inside the cast with dendritic walls that is caused by localtemperature centrum in the cast. The shrinkage cavity usually occurs in areas where the castsolidifies the last.Shrinkage pores are small defects that are formed in similar manner to shrinkage cavities,but instead of one big void smaller pores are formed inside the cast. The pores affect themechanical properties of the material. At the porous area, the ductility and strength of thecast are negatively affected.Blowholes are essentially voids or bubbles in the cast caused by gas in the liquid of cast.The blowholes can vary in size but are usually between 2-20 mm in diameter. Similarly topores, blowholes affect the strength of the material negativelyPinholes are also cavities caused by gas inside the cast but are mainly located at the surfaceof the cast. The pin holes can be open or closed and are usually 1-100 mm in size.Shrinkage cavities, shrinkage pores, blowholes and pinholes can all be detected withultrasonic inspection.Slag, oxide, and sand inclusions are defects that are caused by impurities that end up in thecast. Slag inclusion is formed usually from magnesium oxide, magnesium sulfide or enrichedmagnesium slag that is present in the molten metal. In sand inclusion the sand particles areusually from the sand mold. These defects cannot usually be detected with ultrasonicinspection and are instead usually detected in metallographic samples.Elephant skin is round stretched cavity along the surface of the cast which look likewrinkled elephant skin.Cracks can form in the insert due to the loads that it is subjected to. In mechanical testingthe cracks usually initiate near the steel tubes in the cast.Low nodularity is specified as a defect type because it can substantially decrease theductility toughness of the cast. If the cast iron insert has graphite nodules of forms V an IVless than 80 % or has any graphite of forms I and II according to standard EN ISO 945, it isconsidered to have low nodularity. The low nodularity is possible to detect with ultrasonictesting. However, the ultrasonic detection of low nodularity is challenging because low
8
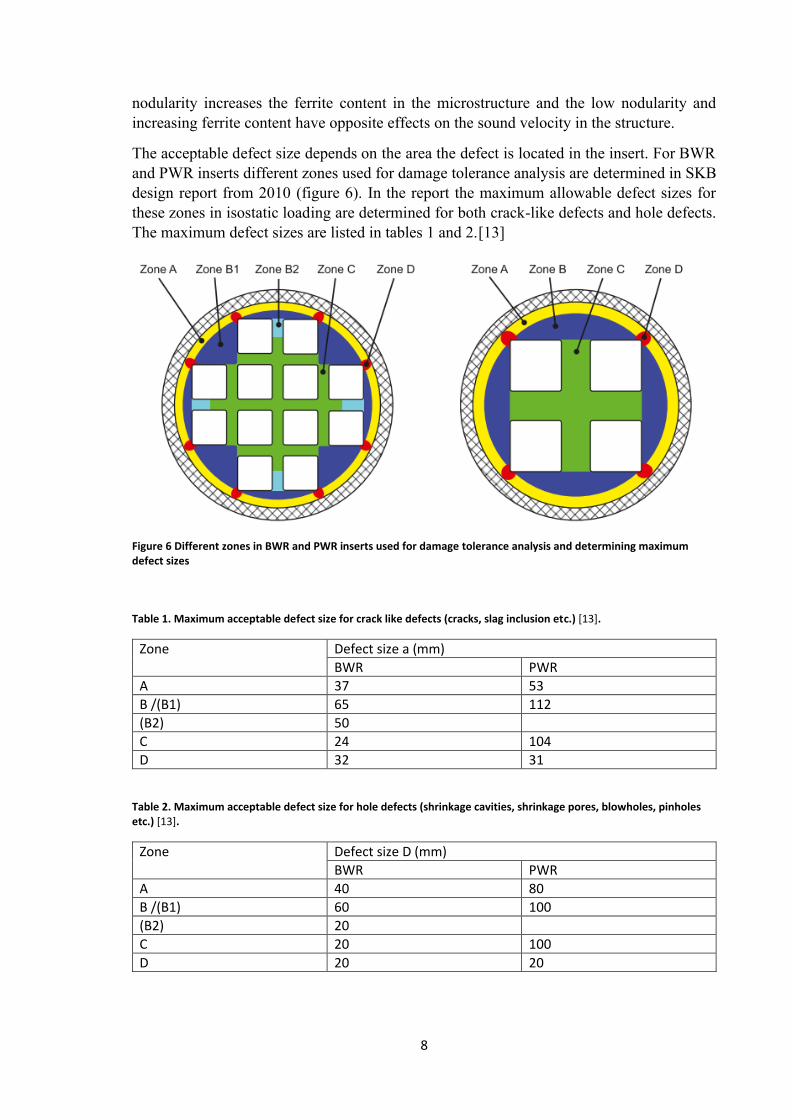
nodularity increases the ferrite content in the microstructure and the low nodularity andincreasing ferrite content have opposite effects on the sound velocity in the structure.The acceptable defect size depends on the area the defect is located in the insert. For BWRand PWR inserts different zones used for damage tolerance analysis are determined in SKBdesign report from 2010 (figure 6). In the report the maximum allowable defect sizes forthese zones in isostatic loading are determined for both crack-like defects and hole defects.The maximum defect sizes are listed in tables 1 and 2.[13]
Figure 6 Different zones in BWR and PWR inserts used for damage tolerance analysis and determining maximumdefect sizes
Table 1. Maximum acceptable defect size for crack like defects (cracks, slag inclusion etc.) [13].Zone Defect size a (mm)BWR PWRA 37 53B /(B1) 65 112(B2) 50C 24 104D 32 31
Table 2. Maximum acceptable defect size for hole defects (shrinkage cavities, shrinkage pores, blowholes, pinholesetc.) [13].Zone Defect size D (mm)BWR PWRA 40 80B /(B1) 60 100(B2) 20C 20 100D 20 20

9
2.1.5 Non-destructive testing of the cast iron insertThe NDT testing of the insert is carried out in multiple steps. The first inspections are doneby the supplier. Ultrasonic testing and magnetic particle testing are used in the first step.These inspections are mainly done to get the permission to deliver the parts to minimize therisk that the parts are rejected in the later manufacturing steps.[15]The final inspections are done in the canister factory and are carried out in two steps. Theultrasonic testing is done after the pre-machining step when there is still excess material onthe insert surface. This methodology ensures that the whole final volume of the insert willbe inspected as the sensitivity of ultrasonic testing near the surface is not good. Aftermachining the insert to its final size specific surface inspection techniques are used. Thesurface inspection consists of eddy current inspection and magnetic particle inspection.[15]The ultrasonic testing is the main technique for testing the insert and detecting volumetricdefects. Three different ultrasonic techniques are used to inspect different parts of the insert.The ultrasonic methods are normal inspection, angle inspection and transmission inspection.The normal incidence inspection is the primary testing method of the cast iron insert and itcovers the volume from the surface to the depth of around 200 mm. The angular wavetechnique is used as complementary technique to inspect defects the main axis of which isin the radial-circumferential plane. The covered volume is from the surface of the insert tothe depth of 50 mm. The transmission inspection method is used to inspect the strips betweenthe channel tubes in the insert. The different volumes inspected with the ultrasonic testingmethods are shown in figure 7.[15]
Figure 7 Different inspection techniques for BWR insert depending on the volume that is being inspected. Angleinspection (violet), normal inspection (green) and transmission inspection (yellow).2.1.6 Residual stresses in the insertThere will be some residual stresses present in the insert after the casting process. Theresidual stresses form when the cast cools down unevenly. The cast iron insert cools downfaster at the surface of the insert and near the channel tubes than in the thicker parts of thecast. When thicker parts of the cast cool down the shrinking of the melt iron causes tensionin the thicker sections of the cast, and thus causes compression in the outer cylindricalsurface of the insert.

10
For measuring the residual stresses mainly the Deep Hole Drilling (DHD) technique hasbeen used. The DHD technique is semi-invasive measurement technique that is based onmechanical strain relief. In the DHD technique reference bushes are attached to the front andback surfaces of the component at measurement points. Then a reference hole with diameter1.5 mm or 3 mm is gun drilled trough the component and the reference bushes. The diameterof the reference hole is then measured along the full thickness of the component using airprobe. The measurements are done in increments of 0.2 mm along the length of the hole and22.5-degree increments along the axis of the hole. After the hole is measured a 5mm or 10mm diameter core including the reference hole is machined out from the component usingelectro discharge machining after which the reference hole is measured again through thewhole depth using the same increments as before.Bowman et al. measured the residual stresses in a BWR insert using the DHD technique. Forthe measurements a 980 mm long piece of the BWR insert, cut from 1310 mm – 2290 mmsection from the bottom was used. The diameter of the insert section was roughly 960 mm.The test specimen was provided by POSIVA.The measurement location can be seen in figure 8. It should be noted that unlike themeasurements 1,2 and 3 the measurements 4 and 5 were not drilled radially inwards so the‘hoop’ stress in these measurements refers to the combination of radial and hoop stress. Themeasurement results from the report of Bowman [16] are compiled below:Measurement 1: The axial residual stress started at 10 MPa at the surface and increased to58 MPa peak at 2 mm deep. The hoop stress started at 25 MPa and also increased sharply totensile peak of 57 MPa at 2 mm deep. From here the values fluctuated and decreased tocompression achieving compressive peaks of -34 MPa in axial direction and -60 MPa inhoop direction at 37.8 mm deep in the cast iron/ steel tube interface. The axial residual stressin the steel tube part fluctuated between minimum value of 93 MPa and maximum value of118 MPa. The maximum hoop stress in the steel tube section was 51 MPa and the minimumwas 18 MPa.Measurement 2: The residual stress was found to start at compressive peak of -62 MPa inaxial direction and -41 MPa in hoop direction. The stresses then increased to tensile peaksof 4 MPa and 11 MPa in axial and hoop direction, respectively, at the depth of 5.4mm. Afterthe peak at 5.4 mm deep the axial and hoop stresses fluctuated in the error bound with thehoop stress averaging 12 MPa higher than axial stress. At the cast iron/steel tube interfacethere was axial peak of -5.1 MPa. The hoop stress had tensile peak of 17 MPa at 18.6 mmdeep and it reduced to 2.3 MPa in the cast iron/ steel tube interface. In the steel tube section,the axial residual stress fluctuated between minimum of 15 MPa and maximum of 72 MPa.In the steel tube the hoop stress fluctuated between compressive value of -61 MPa and tensilevalue of 16 MPa.Measurement 3: The axial residual stress started at compressive peak of about -113 MPawhich was the highest measured axial stress in the cast iron. The stress then increased to -14MPa at 20 mm. The axial stress achieved tensile peak of about 10 MPa at 273.8 mm. Thehoop stress started with compressive peak of about -80 MPa which was also the highest hoopstress measured in the cast. The hoop stress increased sharply to about 0 MPa at 21.4 mm
11
and achieved tensile peak of 25 MPa at 277 mm. After the tensile peaks the axial and hoopstress values fluctuated.Measurement 4: The residual stress was found to start with compressive peak of -38 MPaand -35 MPa in axial and ‘hoop’ directions, respectively, and then to increase to tensile peaksof 12 MPa and 6 MPa at the depth of 8.8 mm. The values then lowered again to compressionachieving compressive peak values of -39 MPa in axial direction and -34 MPa in ‘hoop’direction at the depth of 84.4 mm. In the steel tube section the maximum axial stress wasfound to be 69 MPa and the minimum value 55 MPa. The hoop stress was compressive inthe steel tube section with peak value of -43 MPa and then increased to -11 MPa at the lastmeasurement point.Measurement 5: The axial residual stress was 66 MPa at the first steel tube/cast ironinterface 9.2 mm deep. In the cast iron part, the axial stress was in compression and therewas compressive peak of -20 MPa at start at 11.4mm. The axial stress then increased to -2MPa at 14.2 mm and then fluctuated around zero in the remaining of the cast iron section.The ‘hoop’ stress was 0 MPa at the steel tube/cast iron interface 9.2 mm deep. In the castiron part, the ‘hoop’ stress started at 25 MPa 11.4 mm deep and then decreased to 16 MPaat 36.4 mm deep. The value then rose to the maximum of 34 MPa at 66.4 mm deep. Theaxial stresses in the first steel tube section fluctuated between minimum tensile value of 51MPa and maximum value of 81 MPa. The ‘hoop’ stress fluctuated between minimum valueof 0 MPa and maximum of 41 MPa. In the second steel tube section the maximum axialstress was 71 MPa and minimum was 31 MPa. The ‘hoop’ stress in the second steel tubesection fluctuated between minimum of 4 MPa and maximum of 41 MPa.Overall, the axial and hoop stresses behaved very similarly in the cast iron. All themeasurement locations showed compressive peak stresses close to the surface of the insertwith the exception of measurement location 1. Generally, after the compressive stress peaksthe stresses tended to increase sharply to tension and most of the measurements showedtensile stress peaks before 20 mm deep. The peak compressive residual stresses were foundto be -113MPa and -80 MPa in the axial and hoop direction, respectively. These stresseswere found at the surface region of the cast iron insert at the measurement location 3.Maximum tensile residual stresses were found 2 mm deep from the surface of measurementlocation 1. The residual stresses were 58 MPa in the axial direction and 57 MPa in the hoopdirection. [16]Although the stresses in the cast iron are in the focus it is worth noting that in addition to thepeaks on the surface of the insert there were high residual stress peaks in the steel tubesection. There are clearly stress concentrations at the steel tube sections and some relativelyhigh peaks were also measured at the cast iron/steel tube interfaces. The axial stresses in thesteel tubes were higher than hoop or ‘hoop’ stresses in all measured locations. The maximumaxial stress measure in the steel tubes was 118 MPa near the cast iron/steel tube interfaceand it was measured from location 1. Maximum tensile hoop stress was 64 MPa in the innersurface of the steel tube measured from location 1 and compressive hoop stress of -61 MPawas found in the cast iron/ steel tube interface at measurement location 2. The most notablepeaks measured directly at the cast iron/steel tube interface were -60 MPa hoop stress atmeasurement location 1 and 66 MPa axial tensile stress measured at location 5.[16]

12
Figure 8 BWR insert cross section showing the measurement locations. Dimensions are in mm.[16]Shipsha performed assessment on the residual stresses of BWR- and PWR-inserts. Theevaluation is based on the previous reports. For the measurements in the reports, DHD andIncremental Center-Hole Drilling (ICHD) methods were used. Based on the evaluation ofShipsha, a pessimistic maximum tensile residual stress of 90 MPa can be assumed in thehoop direction for PWR insert when measured between the steel channels. In BWR insertpessimistic assumption for maximum hoop stress is 60 MPa along the ligament from steeltube corner to the outer surface of the insert.[17]It should be noted that the overall accuracy of the DHD method is +/-30 MPa which meansthat many of the characteristic features in the measured residual stresses can be consideredto be measurement fluctuations rather than actual changes in the stress field. This accuracyis not valid for the first 1 mm of the surface and the stresses cannot be reliably measured inthat region.[16]The compressive residual stress in the surface of the insert can be beneficial due to thetendency of closing small surface cracks. The compressive stresses can also be beneficial inthe case where the canister is subjected to bending as higher applied tensile stresses areneeded to cause yielding. The residual stresses are sometimes considered to have nomeaningful impact on the higher loading cases of the insert since the residual stresses arethought to disappear as the insert is subjected to yielding.[6][18] However, this is amisunderstanding and not entirely true, since residual stresses are added to the external loadsand will determine the location where the yielding starts and the local ductility determinesif yielding continues so that the whole insert will yield or if cracking initiates first.

13
The residual stresses can cause local yielding in the insert when combined with the possiblecompressive loads the insert is subjected to in repository conditions. Additionally, it isprobable that some permanent local yielding already occurs during the solidification of thecast due to the uneven cooling and shrinking. In theory the small local yielding could enablethe strain aging to occur readily without external yielding scenario like rock shearmovements.2.1.7 Loads affecting the insertThe loads that affect the canister are mainly external loads. There are some possible internalload cases that can affect the canister, but these are so small that they can be ignored whenexamining the mechanical loads. The nuclear fuel rods produce helium gas when decaying,which can increase the internal pressure inside the canister, but the possible pressure increaseis negligible compared to external loads. The other internal load case is related to thecorrosion of the cast iron insert which can produce hydrogen gas. This process can only takeplace if residual water comes with the fuel elements and is enhanced when the canister isleaking and filling with water. A maximum amount of cooling water that will come with thefuel elements is estimated to be 0.6 liter per canister. Additional pressure inside the canisteris also caused by the growing corrosion products of iron like magnetite and other iron oxides.Residual water trapped inside the canister during the encapsulation may produce nitric acidsin the presence of nitrogen gas which could cause corrosion. However, this effect can beeffectively reduced or avoided by the drying process of the fuel assemblies and using argonas the gas inside the canister instead of air. [6][19]The suitable depth for the repository has been demonstrated to be between 400 - 500 m andthe nominal depth of the Olkiluoto repository site is set to be 420m [6][10]. The externalloads affecting the canister in these conditions are due to the environment and the bentonitelayer surrounding the canister in the repository. The design load of the canister is set to 50MPa isostatic load consisting of groundwater pressure of 40 MPa and swelling pressure of10 MPa from the bentonite buffer.As the bentonite buffer starts to wet the bentonite starts swelling. The wetting process cantake up to hundreds of years at dry sites. At the end of the wetting phase when the bentoniteis fully saturated with water the bentonite layer will cause isostatic pressure load on thecanister since further swelling is prevented due to the confinement. The load from thebentonite can vary in the range of 3-10 MPa and can be unevenly distributed due to unevenwetting and variation in hole dimensions. In the long-term calcium rich ground water canlead to the sodium ions of the bentonite to change with calcium ions which can increase themaximum swelling pressure up to 15 MPa. However, this ion changing process can takethousands of years.[10][6]The bentonite swelling can cause asymmetrical loading on the canister in different ways.During the water saturation period the water can saturate the bentonite clay unevenlydepending on where the water will intrude the deposition hole. The water saturation causesradial swelling pressure on the canister and thus the uneven wetting causes uneven loaddistribution on the canister. In the uneven loading scenarios, the canister can be thought toact as freely supported beam since the canister is over 5 times longer than its diameter. Theworst-case loading scenario during the wetting phase is demonstrated in figure 9. This load

14
case only occurs during the period the water saturation is incomplete. The load distributionduring the water saturation is triangular when the water is assumed to be from axial crack asthe wetting and the resulting swelling pressure will vary depending on the distance from thefracture. Most of the deposition holes will fully saturate in the first 2000 years of thedeposition. Very pessimistic upper limit for the full saturation is 10 000 years.[10][20]
Figure 9 Worst loading case of the canister due to the temporary uneven swelling. The canister is tilted 90 degrees toillustrate the case as freely supported beam. [20]The deposition hole is not necessarily perfect, and it can be asymmetrical. The worstswelling pressure occurs in case where the deposition hole is banana shaped. After the watersaturation there may still remain uneven loading on the canister. During this phase onlyfactors that affect the bentonite buffer density for horizontal cross section of the canister cancause uneven loading. The density difference can be due to imperfections in the bore holegeometry and rock fallout in critical part of the bore hole. In the worst-case scenario boththe banana shaped hole and rock fallout cause uneven load on the canister. This load case isillustrated in figure 10.

15
Figure 10 The stress distribution visualized in the combined load case of banana shaped hole and rock fallout in themiddle of the canister. The cross-section of B-B can be seen in the right. The cross-section of A-A is mirrored B-B.[10]
During the glacial period the repository site is covered by thick layer of ice. This thick layerof ice can increase the basic ground water pressure of 5 MPa by 35 MPa. This pressure alongwith the swelling pressure of bentonite will add up to 50 MPa load which is the set designlimit for the canister. The first glacial period is thought to begin after approximately 50 000years. During the glacial period the temperature inside the canister will be lower, but staybetween 0 ℃ and 20 ℃. [10]In rare cases the releasing of stresses in the bedrock can cause shear type rock movement inthe bedrock subjecting canister to bending. The shearing can initiate due to earthquakes ordue to glacially induced faulting. It has been estimated that the possible earthquakes in thevicinity of the repository should not affect the canister integrity if the repository is placedrespect distance away of the deformation zone that could host major earthquakes and thecanister holes are not intersected by large fractures. The glacially induced faulting can occurdue to deglaciation that causes crustal de-loading or glacial advancement that causesincreased crustal loading. The bentonite buffer’s function is to soften the impact of the rockshear movement and distribute the loading more evenly. The swelling pressure of thebentonite is directly correlated to the maximum shear loading because the pressure affectsthe bentonite buffer stiffness.

16
Due to the long timespan of the deposition the possible rock shear could occur in multipleways. There could be one large rock displacement or there could be several smallerdisplacements that cumulate to larger displacement due to repeated earthquakes. Thefrequency of possible smaller slips is limited to the frequency of earthquakes that couldtrigger the event. It is argued that during the period of million years only two earthquakeswith sufficient magnitude to initiate shearing, could occur in the Forsmark site, thus onlytwo successive rock shear events on one fracture need to be assessed. It is consideredunlikely to have even one large earthquake at the site and possibility for two or more largeearthquakes happening at the same area is even smaller.[9]It is estimated that maximum of 5 cm rock shear with velocity of 1 m/s can occur in therepository. The rock shearing could occur in multiple different planes. The maximum strainrate in the insert during the rock shear is estimated to be 0.5 1/s. This is based on Raiko etal. assumption that the maximum strain is 2% and the 5 cm rock shear takes 0.05 s at thevelocity of 1 m/s. The maximum average strain rate is 0.02/0.05s = 0.4 1/s.[6]In some other studies maximum strain rates for the insert were found to be 0.33 1/s and 0.211/s. However, these studies also used 0.5 1/s as the pessimistic upper limit for the strainrate.[10]It is worth noting that the 5 cm rock shear criterion is not an absolute maximum rock shearthat could occur at the repository site. The 5 cm is the acceptable upper limit for the rockshear that the canister is expected to handle with good probability without failure and therepository is designed so that exceeding 5 cm shear is very unlikely. In practice the maximumof 5 cm rock shear can be ensured by using respect distances to the possible earthquake sitesand by examining the deposition holes and making sure they are not intersected by largefractures [9].The rock shear scenario has been studied for larger shear displacements as well, but it hasbeen noticed that larger displacements are not safe. Börgesson et al. studied the rock shearfor 10 cm and 20 cm rock shear movement in different shear directions and with differentbentonite buffer densities as well as for different bentonite types (Ca-bentonite and Na-bentonite) [21]. Particularly in the Ca-bentonite case with higher buffer densities and 20 cmshear displacement, high deformations up to 13% were observed in the simulation resultswhich is very close to the fracture strains of the material and very excessive compared to therequired ductility minimum of 3% true plastic strain presented in [10].A probabilistic approach has been used for analyzing the possible canister failures due torock shear movements. The probability of canister failure due to rock shear movements wasstudied by Dillström for rock shear movements of 1-10 cm [22]. It was found that theprobability of failure in a canister experiencing 5 cm rock shear was between ∗ −4 and
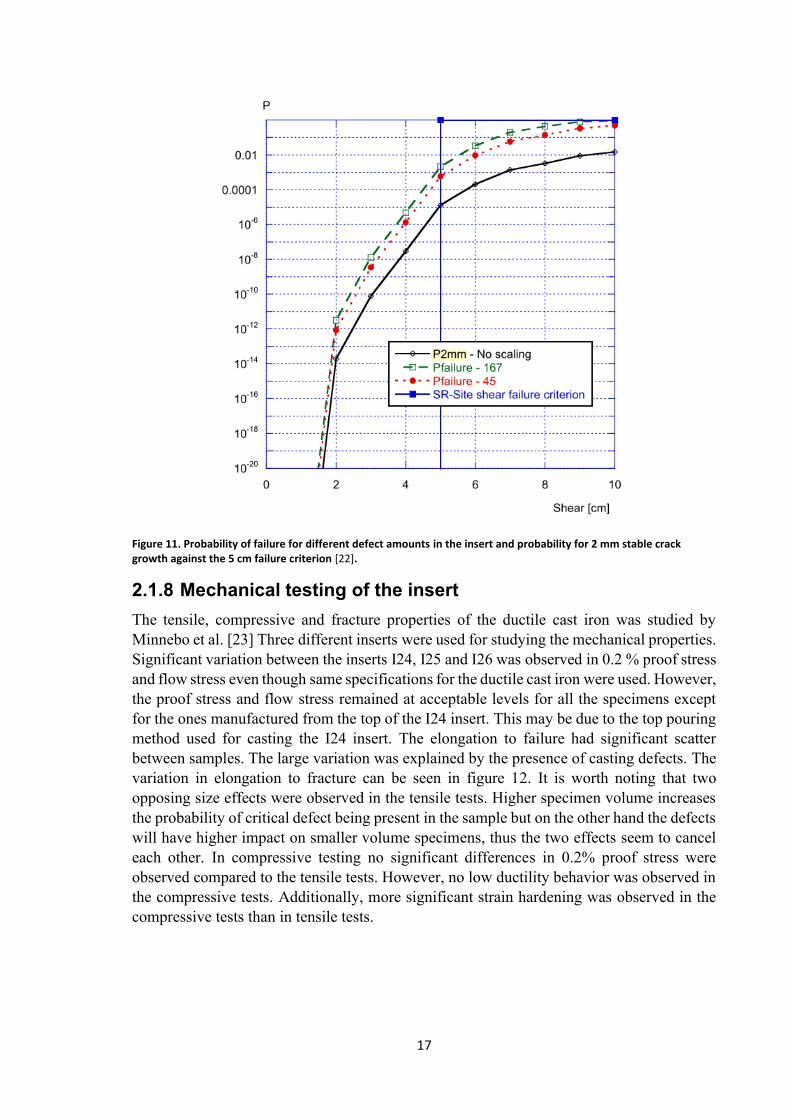
∗ −3. The probability of failure quickly raises to unacceptable levels when the rockshear displacement increases over 5 cm. The probability of failure for different size rockshear movements is presented in figure 11.
17
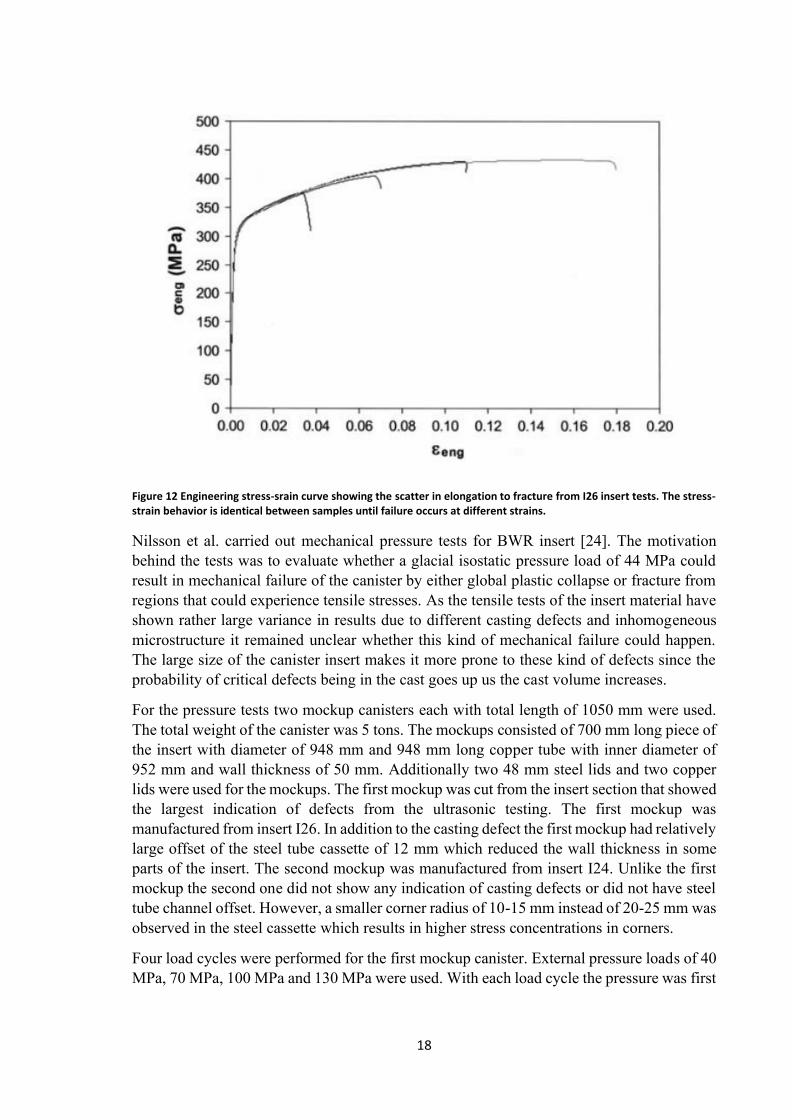
Figure 11. Probability of failure for different defect amounts in the insert and probability for 2 mm stable crackgrowth against the 5 cm failure criterion [22].2.1.8 Mechanical testing of the insertThe tensile, compressive and fracture properties of the ductile cast iron was studied byMinnebo et al. [23] Three different inserts were used for studying the mechanical properties.Significant variation between the inserts I24, I25 and I26 was observed in 0.2 % proof stressand flow stress even though same specifications for the ductile cast iron were used. However,the proof stress and flow stress remained at acceptable levels for all the specimens exceptfor the ones manufactured from the top of the I24 insert. This may be due to the top pouringmethod used for casting the I24 insert. The elongation to failure had significant scatterbetween samples. The large variation was explained by the presence of casting defects. Thevariation in elongation to fracture can be seen in figure 12. It is worth noting that twoopposing size effects were observed in the tensile tests. Higher specimen volume increasesthe probability of critical defect being present in the sample but on the other hand the defectswill have higher impact on smaller volume specimens, thus the two effects seem to canceleach other. In compressive testing no significant differences in 0.2% proof stress wereobserved compared to the tensile tests. However, no low ductility behavior was observed inthe compressive tests. Additionally, more significant strain hardening was observed in thecompressive tests than in tensile tests.
18
Figure 12 Engineering stress-srain curve showing the scatter in elongation to fracture from I26 insert tests. The stress-strain behavior is identical between samples until failure occurs at different strains.Nilsson et al. carried out mechanical pressure tests for BWR insert [24]. The motivationbehind the tests was to evaluate whether a glacial isostatic pressure load of 44 MPa couldresult in mechanical failure of the canister by either global plastic collapse or fracture fromregions that could experience tensile stresses. As the tensile tests of the insert material haveshown rather large variance in results due to different casting defects and inhomogeneousmicrostructure it remained unclear whether this kind of mechanical failure could happen.The large size of the canister insert makes it more prone to these kind of defects since theprobability of critical defects being in the cast goes up us the cast volume increases.For the pressure tests two mockup canisters each with total length of 1050 mm were used.The total weight of the canister was 5 tons. The mockups consisted of 700 mm long piece ofthe insert with diameter of 948 mm and 948 mm long copper tube with inner diameter of952 mm and wall thickness of 50 mm. Additionally two 48 mm steel lids and two copperlids were used for the mockups. The first mockup was cut from the insert section that showedthe largest indication of defects from the ultrasonic testing. The first mockup wasmanufactured from insert I26. In addition to the casting defect the first mockup had relativelylarge offset of the steel tube cassette of 12 mm which reduced the wall thickness in someparts of the insert. The second mockup was manufactured from insert I24. Unlike the firstmockup the second one did not show any indication of casting defects or did not have steeltube channel offset. However, a smaller corner radius of 10-15 mm instead of 20-25 mm wasobserved in the steel cassette which results in higher stress concentrations in corners.Four load cycles were performed for the first mockup canister. External pressure loads of 40MPa, 70 MPa, 100 MPa and 130 MPa were used. With each load cycle the pressure was first
19
steadily increased to the final value and then held for 120 seconds after which the canisterwas unloaded rapidly. Radial plastic deformation of 5 mm was observed after the 100 MPaloading. After the 130 MPa pressure cycle the first mockup showed substantial plastic radialdeformation of 20 mm. During the 130 MPa holding the cold isostatic press pumped morefluid into the press, indicating that the canister continued to deform during the holding time.The first mock-up canister remained intact after the four loading scenarios. The highestdeformation occurred at the site of lowest wall thickness. A partial debonding and bucklingof the steel tubes was observed as result of the plastic deformation. The fact that plasticdeformation occurred already at 100 MPa pressure which is lower than the predicted pressurein FE modelling is probably due to the 12 mm channel offset in the first mockup canister aswell as due to the higher yield and tensile stress used in the FE model.For the second mockup the same four loading cycles were applied. Additionally, a fifthloading cycle was applied with the intent to load the canister until failure. The observedresults up to the 130 MPa pressure were similar than in the tests of the first mock-up canister.Some additional deformation compared to the first mockup was seen during the loadingbetween 40 and 70 MPa and the deformation was more symmetrical than in the first mockup.The more symmetrical deformation is probably due to the symmetrical placement of the steeltube cassette unlike in the first mock-up. At 139 MPa a loud bang was heard in the test afterwhich the pressure immediately dropped. The test was interrupted immediately after this.The results show that the canister experienced a global plastic collapse with largedeformation in the insert and the steel channels. The maximum indentation observed wasalmost 200 mm and the insert showed large and very asymmetric deformation after thecollapse. Partial debonding of the steel tubes is also seen in the second mock-up.The crack growth under isostatic pressure load was also studied by Nilsson et al. as part ofthe pressure tests [24]. Dye penetrant testing was used to identify possible cracks in thesurface regions. The dye penetrant testing revealed some surface cracks in the indented partsof the insert surface. Radiographic inspection showed multiple cracks in the steel tube castiron interface with maximum length of about 40 mm. To get further information about thecrack depth and propagation mode the part was cut into smaller pieces and examined withultrasonic testing. The crack depth was estimated to be about 10 mm which was confirmedwith metallographic examinations. The crack depth of 10mm is close to the depth of theregion of tensile stresses. Further examination with scanning electron microscope (SEM)revealed details of the crack tip morphology and the crack propagation method. Stretchingof the material ahead of the crack tip was shown, which led to separation of graphite nodulesfrom the ferritic matrix, forming voids around the graphite nodules. The crack thenpropagated through the voids by coalescence of the voids at the crack tip.As summary it was found that in isostatic pressure testing the cracking of the insert mainlyinitiates near the steel channels in areas where the insert is subjected to tension and plasticdeformation. The cracks are mostly initiated at larger subsurface inclusions near these areasand the cracks grew by stable tearing. The further crack growth is suppressed due to thecrack growth resistance of the material and/or the fact that only small area near the channelis in tension, thus the crack arrests when trying to propagate into the compressive region.[24]

20
In later journal paper of Nilsson et al. the same pressure tests were reported and additionallythe effects of the test near the steel channel corners were examined. Based on FE-analysisthe cracking in the insert at the cassette corner area was expected to be very unlikely.However, inspection of the insert in the corner regions showed that several cracks wereformed during the isostatic loading. Two macro-cracks parallel to the channel corner wereobserved. The area where the cacks initiated showed significantly smaller graphite nodulesize than the rest of the wall thickness. The cracks propagated to the area with consistentlylarger and more deformed graphite nodules and the crack propagation mechanism showedformation of microcracks at the matrix grain facets in front of the crack tip, which thencoalesced together. However, the cracks quickly arrested in the compression after growth ofa couple of millimeters. The morphology of the cracks was different than in the tensileregions and resembled intergranular brittle fracture. The authors attributed the crack growthto be driven by the shear stress in the corner region.[25]2.1.9 Finite element analyses of the insertFE analysis for Isostatic loadingMany different finite element analyses have been conducted for the isostatic loading case.Ikonen performed a mechanical analysis for VVER 440, BWR and EPR canisters. Finiteelement model with steel tubes described as separate element to the insert with 5 mmeccentric offset of the steel tube cassette was used for the analysis. The copper layer was notincluded in the analysis since reliable data for long-term creep of copper under isostatic loadwas not available that time. This means that in practice the copper layer should provide extramargin against failure. The BWR insert was found to collapse at external pressure of 90.2MPa which means that the safety margin is around 2.1 if the design load is 44 MPa.[26]The plastic collapse was studied with finite element modelling by Nilson et al. prior to themechanical pressure tests of the mock-up canisters. For the FE-analysis a slightly differentgeometry was used for the mockup canisters that was based on earlier mockup design. In themodel the canister length was 1400 mm instead of 1050 mm that was used in the finalpressure tests. The longer canister results in slightly higher strains and stresses according tothe preliminary parameter studies. 1500 mm experienced 14% strain and 519 MPa effectivestress and 1000 mm insert experienced 11% strain and 479 MPa effective stress. In the FE-analysis the copper canister was found to yield at external pressure of 10 MPa and the insertwas found to yield at external pressure of 110 MPa. According to the simulations some localyielding already occurs at the corners of the insert for external pressure of 44 MPa. However,a global plastic collapse only occurred at external pressure of 130 MPa. During the plasticdeformation only parts of the steel tubes and the cast iron close to the steel tubes experiencestensile stresses. These are the critical areas for crack growth assuming that the cracks couldonly propagate in tension. The results of the actual mechanical testing of this paper arereviewed in chapter “Mechanical testing of the insert”. [24]Martin et al. studied the plastic collapse of the canister under isostatic load. 3D and 2D finiteelement models built based on shorter mockup canister were used for analysis. 2D planestrain model resulted in lower collapse pressures than the 3D model. 2D plane strain modelwas used as the reference model for the studies. The authors note that the results of the 3Dmodels approach the 2D model results as the canister length increases. The plane strain

21
model was found to experience plastic collapse at 112 MPa external pressure when the steeltube cassette was offset by 12 mm. In the collapse scenario the steel tube cassette wasmodeled as separate element not bonded to the cast iron insert with frictionless contactassumed between the cassette and insert. The copper shell was also included in this modelwith frictionless contact assumed between the copper shell and the insert. The steel tubecassette was debonded due to the tendency of some of the steel tubes to debond in themechanical tests that have been conducted. As the debonding will reduce the overall canisterstiffness this modeled case represents the worst case scenario. [27]In later studies of Hernelind the plastic collapse was studied with detailed finite elementmodel. All details are included in the model for the steel tubes and insert for BWR and PWRcanisters. The steel channel tubes were connected by welded support plates. In the model thesupport plates, base plate and the base screws were glued to the cast iron insert. The steel lidwas fixed to the center via screw. The screws were simplified as cylindrical shapes and somesmall holes in the original drawing were left out of the model. Nominal dimensions with thesteel tube cassette in the center was used as reference model for both BWR and PWR inserts.Additionally, case with the steel tube cassette moved 10 mm off-center according tomanufacturing tolerances was modeled. The BWR insert was found to collapse at around 97MPa of external pressure and the manufacturing tolerances did not have any meaningfuleffect on the collapse pressure. When cylindrical defect was included in the model and yieldsurface was reduced the collapse pressure decreased to around 85 MPa. The same results forPWR insert were 116 MPa and 104 MPa, respectively.[28]FE analysis for uneven loading scenarioBörgesson et al. investigated the uneven swelling scenarios of the canister. The maximumbending stress in the insert for the wetting phase was calculated to be 105 MPa. Forasymmetrical loading after the full saturation of the bentonite buffer the maximum bendingstress in the insert was calculated to be 111.5 MPa. Saturation densities of 𝑘𝑔 𝑚3and
𝑘𝑔 𝑚3 were used for this load case. These densities corresponded to swellingpressures of 𝜎1 𝑘𝑃𝑎 and 𝜎2 𝑘𝑃𝑎 (figure 9). For the wetting phase bentonitebuffer density of 𝑘𝑔 𝑚3 was used.[20]The asymmetric loading case caused by the banana shaped hole and rock fallout have beensimulated by Börgesson and Hernelind [29]. For the finite element analysis saturationdensities 𝑘𝑔 𝑚3and 𝑘𝑔 𝑚3 were used. These are close to the values derivedearlier by Börgesson [20].The maximum axial tensile stress was found to be about 78 MPawhile the maximum principle stress was about 79 MPa. These values are much lower thanthe analytically derived result of 111.5 MPa axial load. The stresses are well below the yieldstress of the cast iron and any yielding should not occur during this asymmetrical loading.[29]FE analysis for rock shear case
Various finite element analyses for the rock shear case have been performed thus far.Different models that have varying geometries, mesh designs, buffer properties, shear planesetc. have been used. Damage tolerance analyses for varying bentonite buffer densities have

22
been conducted where 0 ℃ temperature was assumed for the cast iron insert. For thebentonite buffer 1950, 2000, 2022, and 2050 𝑘𝑔 𝑚3densities were evaluated.[10]Hernelind studied the rock shear case and its effect on the bentonite buffer and the canister.The effect of the shear movement on the canister insert was evaluated through finite elementmodelling using somewhat simplified geometry. The shear case was studied for 5 cm and 10cm rock shear movements. The highest value for the plastic strain in the insert was found tobe 1% and the highest stress occurring in the insert was 340 MPa in 5 cm rock shear case.For 10 cm shear case the corresponding numbers were 1.9 % and 357 MPa, respectively.These are, however, the cases where the rock shear is affecting the canister simultaneouslywith the glacial pressure of 30 MPa. If the glacial pressure is not affecting the canister duringthe rock shear, the maximum values for the strain and stress are 0.5% and 321 MPa for 5 cmrock shear and 1.6 % and 351 MPa for 10 cm rock shear. The largest strain is located at theinsert edge close to the corner of the steel tube cassette. The strain distribution can be seenin figure 13. [30]Based on these results Raiko et al. noted that the maximum effective stress of 340 MPa inthe case of 5 cm rock shear corresponds to 2.55 % plastic strain on the static uniaxial stress-strain curve for cast iron. Even though the highest amount of plastic strain occurs in the casewhere the glacial load is present, it is not the most detrimental loading scenario for the castiron insert as the compressive glacial load decreases the maximum axial tensile stress in theinsert. The maximum axial tensile stress is detrimental for the possible crack growth in theinsert, and thus the damage tolerance analyses are calculated without the glacial load. [18]
Figure 13 Plastic strain distribution in the insert for the 5 cm rock shear case with 2050 kg/m3 bentonite claybuffer.[30]Later Hernelind conducted further rock shear analyses for PWR- and BWR-inserts usingmodels that included a much more detailed geometry. The model consisted of the cast ironinsert, the steel lid and the copper canister surrounded by the bentonite buffer. Only half ofthe canister is modeled due to symmetry and the mesh is generated using mostly 8-noded
23
hexahedral shapes and some 6-noded wedge elements. The model size is defined byapproximately 126 000 elements and 160 000 nodes. For the model that takes manufacturingtolerances in to account the maximum plastic strain of 2.7 % and maximum Mises stress of401 MPa were observed for the BWR insert in the 5 cm rock shear case at 3/4 canister height.The maximum axial stress in this case was 395 MPa. For the model that did not account forthe effect of manufacturing tolerances the maximum plastic strain was found to be 1.5 %and maximum Mises stress was found to be 392 MPa in the same 5 cm rock shear scenario.The maximum axial stress was 395 MPa also for this model. For the PWR insert consideringthe manufacturing tolerances also somewhat increased the strain in the insert. However, forPWR insert the strains and stresses are smaller. For the model that takes manufacturingtolerances in to account the maximum strain was 1.4 % in the 5 cm rock shear case, while itwas 0.74 % in the case where the tolerances were not accounted for. The maximum Misesstresses were 349 and 329 MPa, respectively. The maximum axial stresses were very similarbetween the models like in the BWR insert and they were 330 and 333 MPa.[31]Dillström studied the effect of the rock shear case on the cast iron insert and compared theeffect of different meshes between Hernelinds original and updated models [30][31].Dillström concludes that similar stresses were found in the original and updated models inthe most important regions. The updated models have higher localised stresses due to themesh design, but they are not entirely accurate, since the mesh grids are not designed to beused in damage tolerance analysis. Many of the stress consentrations can be explained bythe use of wedge elements and some of the stress concentrations can be disregarded as theneighbouring elements have substantially lower stresses. The maximum stress in the axialdirection for the original global model presented in Hernelind’s paper was found to be 333.2MPa. The maximum axial stress is located at the outer surface of the canister insert. Thestress distribution can be seen in figure 12.[32]Similar maximum strains have been found in the later studies and reasonable ductility limitof 3% true plastic strain for the cast iron insert when safety factor is taken into account ispresented by Jonsson et al.[10].

24
Figure 14. Axial stresses in BWR-insert for 5 cm rock shear load at 3/4 of the canister height for bentonite bufferdensity of 2050 kg/m3. [32]2.1.10 Mechanical failure process and failure criteria of the insertThere are three different types of failure processes that may occur for the cast iron insert.The insert may experience plastic collapse, crack initiation, or exceed the acceptable plasticstrain.The design target of the insert against isostatic pressure load is 50 MPa. The criteria for thedesign load should not exceed 2/3 of the maximum load of the insert. The mock-up cast ironinserts of small size have been studied and loaded to failure. In the studies the inserts collapsebetween 130 and 140 MPa. This is more than double the design target of the insert.[10] Thepressure tests by Nilsson et al. [24] are reviewed more in detail in chapter “Mechanicaltesting of the insert”.In the case of load-controlled load case like the isostatic loading 𝐾 𝑐 data, based on crackinitiation is used for the damage tolerance analysis. A crack initiation in the insert is notallowed for load-controlled loading scenarios. The safety factor of 𝑆 𝐾 is used whichis the requirement for normal operational load from ASME Code.For the crack initiation in the case of displacement-controlled load the damage toleranceanalysis is based on J-integral analysis. A crack initiation can be allowed in the case ofdisplacement-controlled load. The stable crack growth criterion for the cast iron insert is:
𝐽 𝑎𝐽2𝑚𝑚 (1)

25
Where 𝐽 𝑎 is the J-integral value for postulated crack, 𝐽2𝑚𝑚 is the J-integral value thatcorrespond to 2 mm stable crack growth in fracture toughness tests and 2 is the safety factorthat corresponds to safety margin of 𝑆 𝐾 for emergency load event in ASME code.The discrepancy in the safety factor comes from the relationships between 𝐽 and 𝐾 whichfollows 𝐽 ∼ 𝐾2 . Due to this the safety factor used in J-integral analysis should be of form𝑆 𝐽 𝑆 𝐾
2. The rock shear case is classified as low probability case due to the fact thatonly 4 canisters out of 6000 are expected to be subjected to shearing of 5 cm (chapter: “Excavation damage zone and crack growth in bedrock”). [10][6]The rock shear case is the only situation where the DCI insert could be subjected tosignificant plastic deformation. The worst case for the rock shear case is estimated to occurwhen the shear plane is at 75% of canister height perpendicular to the axis of the canister.The canister is required to withstand 5 cm rock shear with a velocity of 1 m/s [6]. In the caseof this type of rock shear the BWR and PWR inserts are subjected to 0.5% plastic strain. Inthe case of 10 cm rock shear the strain is 1.7%. When taking the safety factor in to accountthe acceptable requirement for the ductility of the insert is 3% true plastic strain at distanceof 100 mm or more from the middle of the cast iron insert cross-section. For distancessmaller than 100 mm from the center point of the cross-section there are no ductilityrequirements. [10]2.1.11 Temperature inside the canisterThe fuel rods are stored in pools at the nuclear power plants before the encapsulation anddisposal process. Appropriate decay heat is usually achieved in between 30 to 50 years afterwhich the fuel elements are ready for disposal [6]. The decay heat power of the fuel decreasesrapidly as time passes. It is estimated that the decay heat power halves in the first 50 years[33].At the actual deposition the maximum surface temperature of the canister is reached about20 years after the start of deposition. The temperature stays near the maximum value foranother 40 years until it starts to slowly decrease after 60 years of deposition. After 600 yearsthe outer surface temperature of the canister will be below 50 ℃ [6]. The elevatedtemperature and heat generation is estimated to be relevant only during the first 1000 yearsof the deposition [6].Ikonen modeled and studied the temperature inside the disposal canister in his work. Themaximum allowable temperature of external surface of the canister is limited to 100 ℃. Theinitial heat powers of the canisters were set to 1700 W, 1830 W and 1370 W for the BWR,EPR and VVER 440 fuel elements, respectively. In the study it is estimated that in thisreference case the maximum temperature in the middle of fuel rod bundle for BWR, EPRand VVER 440 fuel are 213 ℃, 229℃ and 233℃, respectively. The maximum temperaturein the cast iron insert in this reference case was 193 ℃ for BWR insert and 190 ℃ for EPRinsert. Ikonen also modeled the worst-case scenario for the temperatures. In the worst casethe maximum temperature of the outer surface of the canister was set to 120 ℃ which ismore than the design specification and the heat powers of the fuel elements were set to 1.2times of the values in reference case. Additionally, more pessimistic values for the copper

26
emissivity, conductivity of steel, conductivity of cast iron and fuel rod surface emissivitywere used. In the aforementioned case, the temperature inside the fuel rods rose to 286 ℃ inBWR canister and to 304 ℃ inside the EPR canister. These temperatures correspond tomaximum cast iron insert temperatures of 264℃ and 261℃, respectively. The temperaturesin both the reference and worst-case models are rather pessimistic since the modelling wasbased on the assumption that the gap between the copper shell and the cast iron insert is invacuum and the only heat transfer mechanisms are thermal radiation and conduction betweenthe metal parts. The reference case temperatures were also modeled in a case where the gapbetween the copper shell and the insert is filled with argon, thus allowing convection andbetter heat transfer. In this case the maximum temperature reached inside the fuel rod was145 ℃ in BWR canister and 170 ℃ in EPR canister. These fuel rod temperatures correspondto cast iron insert temperatures of 115℃ and 114℃ in BWR and EPR canisters, respectively.[1]Raiko repeated some of the thermal analyses using different assumptions that moreaccurately represent the evolution of the canister temperature. Maximum temperature of 95℃ for the outer surface of the canister and 1700 W decay power for all the fuel elementswas assumed. Additionally, 36 𝑊 𝑚2 𝐾 thermal conductivity was used for the cast ironinsert. For the gap between the insert and copper shell width of 1.5 mm was used withemissivity of 0.22 and 0.6 for copper and cast iron surfaces respectively. The insert is filledwith argon whose thermal conductivity is 0.018 𝑊 𝑚2 𝐾. The conductivity used for airwas 0.030 𝑊 𝑚2 𝐾. The maximum temperatures of the fuel rods were 193℃ and 166℃,when the gap between the copper shell and the cast iron insert was vacuum or filled with air.The corresponding insert temperatures were 139℃ and 103 ℃. [6]In a later report maximum fuel temperature for the fuel elements was found to be 147.1-203.0 ℃, when the pessimistic temperature of 100 ℃ was used for the copper tube and decaypower of the fuel elements was 1700 W. These temperatures corresponded to 112.7-118.1℃ temperature for the cast iron insert. In conclusion, the temperature of the insert shouldnot raise above 125 ℃
℃ [10]2.2 Plasticity of crystalline materials2.2.1 DislocationsCrystalline materials contain structural line defects that run through the crystals. These linedefects are called dislocations. Dislocations enable the deformation of the material whilemaintaining its basic crystal structure. The movement and multiplication of dislocationsunder external stress usually manifests as plastic deformation of material. There is clearcorrelation between plastic deformation and dislocation density and the dislocation densityincreases as the plastic deformation increases. The dislocation density of material is usuallyexpressed as total length of the dislocation line per unit volume. A well annealed metalusually contains about 10 to 12 𝑚 of dislocation line per cubic meter, whereas heavilycold rolled metals typically contain somewhere between 14 and 15 𝑚 of dislocation lineper cubic meter.
27
A dislocation is defined with the help of a Burgers circuit. A Burgers circuit is essentially apath between atoms in the lattice that forms a closed loop. When the circuit arounddislocation is repeated in dislocation free crystal the circuit will not form closed loop. Thevector that is required to close the circuit in perfect crystal is called Burgers vector. Thereare two general types of dislocations, edge dislocations and screw dislocations. When thedislocation line is normal to the slip direction the dislocation is called an edge dislocationand when the dislocation line is parallel to the slip direction the dislocation is called a screwdislocation. In other words, in edge dislocations the Burgers vector is normal to thedislocation line and in screw dislocations the Burgers vector is parallel to the dislocationline.There are two basic types of dislocation movement, glide and climb. Glide occurs when thedislocation moves in a plane that contains its line and Burgers vector, and climb occurs whenthe dislocation moves out of the glide surface. Dislocation that is able to glide is calledglissile, and dislocation that is not able to glide is called sessile. Slip is the most commonmanifestation of deformation in crystalline material and it occurs when multiple dislocationsglide. The slip occurs in specific planes in the crystal lattice and the slip plane is usually theplane with highest density of atoms. The slip direction corresponds to the shortest latticetranslation vector. For example, in body centered cubic (BCC) material like ferrite the slipusually occurs in the closed-packed plane of {110} and the slip direction is [111]. However,the slip is more complex in BCC crystals than for example in FCC crystal, since the slip hasalso been observed in {112} and {123} planes [34].Due to the different possible slip planes in the same [111] slip direction the slip might occurin different {110} planes or combination of {110} and {112} planes, depending on theapplied stress, which is why the observed slip lines often appear as wavy and ill-defined.The active slip plane depends on multiple factors such as crystal orientation, composition,temperature and strain rate. For example, iron alloyed with silicon or iron deformed in lowtemperature seems to be restricted to specific {110} slip plane.[35]2.2.2 DiffusionIt is critical to understand diffusion when dealing with physical metallurgy especially atelevated temperatures. Diffusion is based on phenomena where atoms move from higherconcentration regions towards lower concentration regions. Even though the individualatomic movements are random, the atoms continue to redistribute until the materialcomposition is uniform. This is because there are more atoms to move down to concentrationgradient than there is to move up. This is known as Fick’s first law of diffusion:
𝐽 −𝐷𝑑𝑐𝑑𝑥
(2)
Where J is the diffusional flux, D is the diffusion coefficient and c is concertation, thus 𝑑𝑐𝑑𝑥
isthe concertation gradient. The diffusional flux represents the number of atoms diffusing inunit time across unit area.
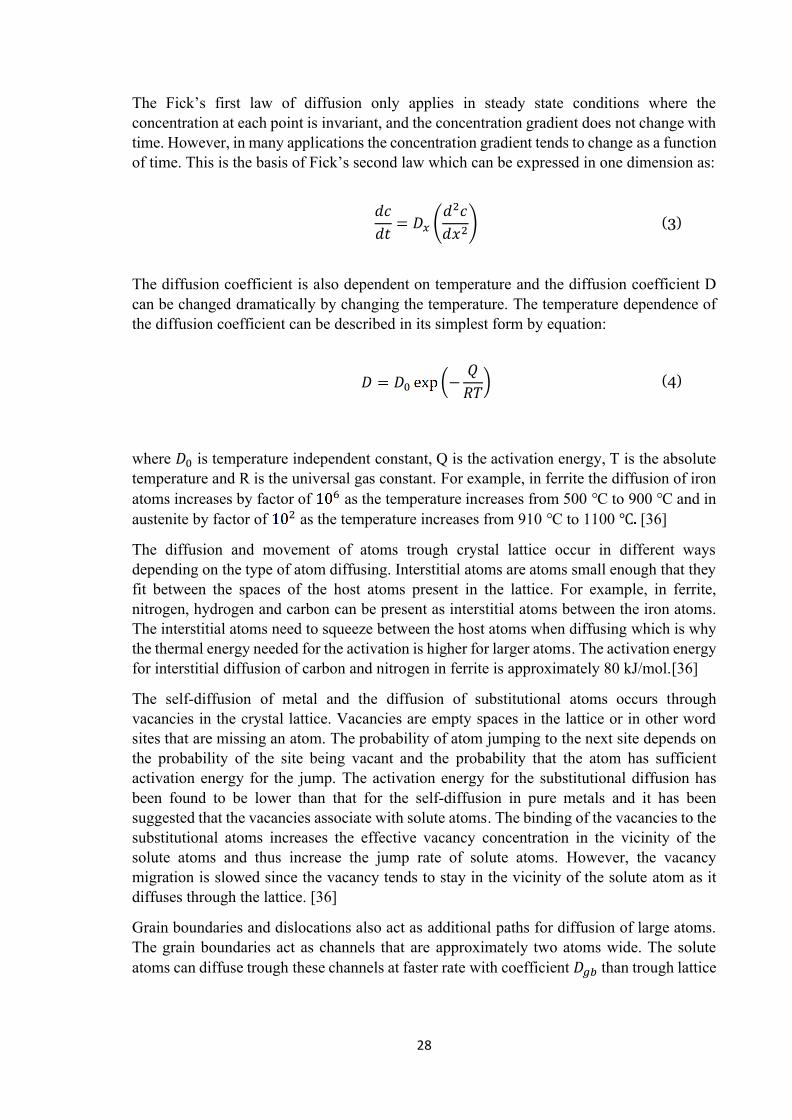
28
The Fick’s first law of diffusion only applies in steady state conditions where theconcentration at each point is invariant, and the concentration gradient does not change withtime. However, in many applications the concentration gradient tends to change as a functionof time. This is the basis of Fick’s second law which can be expressed in one dimension as:𝑑𝑐𝑑𝑡
𝐷𝑥𝑑2𝑐𝑑𝑥2 (3)
The diffusion coefficient is also dependent on temperature and the diffusion coefficient Dcan be changed dramatically by changing the temperature. The temperature dependence ofthe diffusion coefficient can be described in its simplest form by equation:
𝐷 𝐷0 −𝑄
𝑅𝑇(4)
where 𝐷0 is temperature independent constant, Q is the activation energy, T is the absolutetemperature and R is the universal gas constant. For example, in ferrite the diffusion of ironatoms increases by factor of 6 as the temperature increases from 500 ℃ to 900 ℃ and inaustenite by factor of 2 as the temperature increases from 910 ℃ to 1100℃ [36]The diffusion and movement of atoms trough crystal lattice occur in different waysdepending on the type of atom diffusing. Interstitial atoms are atoms small enough that theyfit between the spaces of the host atoms present in the lattice. For example, in ferrite,nitrogen, hydrogen and carbon can be present as interstitial atoms between the iron atoms.The interstitial atoms need to squeeze between the host atoms when diffusing which is whythe thermal energy needed for the activation is higher for larger atoms. The activation energyfor interstitial diffusion of carbon and nitrogen in ferrite is approximately 80 kJ/mol.[36]The self-diffusion of metal and the diffusion of substitutional atoms occurs throughvacancies in the crystal lattice. Vacancies are empty spaces in the lattice or in other wordsites that are missing an atom. The probability of atom jumping to the next site depends onthe probability of the site being vacant and the probability that the atom has sufficientactivation energy for the jump. The activation energy for the substitutional diffusion hasbeen found to be lower than that for the self-diffusion in pure metals and it has beensuggested that the vacancies associate with solute atoms. The binding of the vacancies to thesubstitutional atoms increases the effective vacancy concentration in the vicinity of thesolute atoms and thus increase the jump rate of solute atoms. However, the vacancymigration is slowed since the vacancy tends to stay in the vicinity of the solute atom as itdiffuses through the lattice. [36]Grain boundaries and dislocations also act as additional paths for diffusion of large atoms.The grain boundaries act as channels that are approximately two atoms wide. The soluteatoms can diffuse trough these channels at faster rate with coefficient 𝐷𝑔 than trough lattice

29
with coefficient 𝐷 . If the grain size is 𝑑 and the grain boundary thickness is 𝛿 the totaldiffusion flux can be described as sum of both contributions:
𝐽 − 𝐷 𝐷𝑔𝛿𝑑
𝑑𝑐𝑑𝑥
(5)
Where the effective diffusion coefficient is:
𝐷 𝐷 𝐷𝑔𝛿𝑑
(6)
Similarly, the cores of dislocations can act as pipes through which the solute atoms candiffuse faster with coefficient 𝐷 . The contribution of the dislocations to the total fluxdepends on the relative cross-sectional area of dislocations and matrix. The apparentdiffusivity trough crystal can be described by equation:
𝐷𝑎 𝐷 𝐷 𝐴 (7)
Where A is the total cross-sectional area of the dislocations per unit area of matrix. [36]2.2.3 Dislocation lockingDifferent point defects like vacancies and substitutional interstitials interact withdislocations in the material. The point defect in the crystal causes surrounding stress fieldthat interacts with the dislocation and increases or decreases the elastic strain energy of thecrystal. The change in the strain energy is called the interaction energy 𝐸 .[37]The energy of point defects in crystalline structure changes in the vicinity of dislocations by𝐸 . The equilibrium defect concentration 𝑐 changes from the concentration value 𝑐0 far fromthe dislocation. The defect concentration 𝑐 at a point 𝑥 𝑦 is:
𝑐 𝑥 𝑦 𝑐0 −𝐸 𝑥 𝑦 𝑘𝑇 (8)
The point defects tend to congregate in regions where the interaction energy 𝐸 is large andnegative which leads to areas with higher concentration of solute atoms forming in thematerial. These dense atmospheres of solute atoms are called Cottrell atmospheres. At theoccupied site where 𝐸 is large, negative extra work will be required to separate thedislocation from the solutes. This means that extra stress is required to make the crystal slip,thus making the materials stronger. To form these atmospheres, the temperature needs to besufficient for solute migration to occur in the material. However, if the temperature is toohigh, the atmospheres can “evaporate” into the solvent matrix due to entropy contribution tothe free energy. Dense atmospheres of 𝑐 ≥ can be expected even in material with diluteequilibrium defect concentration of 𝑐0 at temperatures of 𝑇 𝑇𝑚 where 𝑇𝑚 isthe melting temperature, in regions where −𝐸 ≥ 𝑘𝑇𝑚. This mechanism of dislocation

30
locking is behind the phenomenon called strain aging, which is discussed more in detail inthe next section.[37]2.3 Strain agingStrain aging is an embrittlement and hardening mechanism of cast irons and carbon steelsthat happens in specific conditions that are a combination of plastic strain and temperature.The strain aging can either occur during the plastic deformation or after the plasticdeformation. If the aging occurs during the plastic deformation it is called dynamic strainaging (DSA). Strain aging that occurs after the plastic deformation is called static strainaging (SSA). Cottrell and Bilby proposed in 1949 that strain aging is the result of diffusionof carbon or nitrogen atoms that collect around dislocations formed during the plasticdeformation [38]. The carbon and nitrogen atoms around the dislocations increase the stressneeded to move the dislocation, effectively immobilizing the dislocation. Today thismechanism is generally accepted to be behind the strain aging. Strain aging increases thehardness of the material while simultaneously reducing the ductility. Strain aging usuallymanifests as an increase of tensile strength of the material, negative strain rate sensitivity inDSA, and reduction in total elongation to fracture.Static strain aging occurs when the material is strained beyond its yield point and thenunloaded. The diffusion of carbon and nitrogen atoms leads to migration to the strain fieldsof dislocations since this results in an overall reduction in strain energy. This causes thesolute atoms to gather around the dislocations forming interstitial concentrations oratmospheres called Cottrell atmospheres. Due to the solute atom concentrations, extra stressis required to move the dislocations and the dislocations are locked in place. This is usuallyseen as sharpening of the yield point and increase in yield strength. If high enough stress isapplied to the dislocation, it can be separated from solute atoms allowing it to move againand be unaffected by the solutes. However, if the material is subjected to sufficient heat afterthis and left to age for sufficient amount of time, the solute atoms diffuse back to thedislocation re-introducing the locking effect.[39][37]The breakaway of dislocation from the Cottrell atmospheres is somewhat controversial asthe cause of the sharp yield point in strain-aged material. An alternative theory has beenproposed suggesting that once the atmospheres have formed they stay locked and theyielding phenomenon is caused by newly formed dislocation and their movement. There isprobably not one correct theory and the precise mechanism behind the yield pointphenomenon depends on the effectiveness of the dislocation pinning. If the dislocationpinning is weak the yielding can probably occur due to unpinning of the dislocations but ifthe dislocations are effectively locked by interstitial atmospheres or precipitates the yieldpoint phenomenon is probably the result of new rapidly formed dislocations.[39]The amount of carbon and nitrogen needed for severe strain aging to occur is very small ataround 0.002 wt% for carbon and 0.001-0.002 wt% for nitrogen. However, dislocationpinning and strain aging can occur at even lower solute concentrations. As low as −6 wt%of carbon is sufficient to introduce one interstitial atom per atomic plane along thedislocation lines present for dislocation density of −12 𝑚−2, which is typical for annealediron. The static strain aging can readily occur at temperature range of only 20-150 ℃ due tothe diffusion of carbon and nitrogen being very rapid in iron compared to other solutes. [39]

31
Codd et al. studied the dislocation locking in ferritic iron and found that nitrogen locking issubstantially stronger than carbon locking. The locking was found to affect the ductile-brittletransition temperature so that stronger locking results in a higher transitiontemperature. Elastic and chemical interactions between the solutes and dislocations aresuggested as the reason for the differing locking effects. The elastic interaction is caused byresidual chemical bonding between the dislocation and the impurity atom. [40]Dynamic strain aging occurs when the material is subjected to yielding at elevatedtemperature. The elevated temperature increases the carbon and nitrogen diffusion rate andenables the locking to occur during the deformation. When the test specimens are deformedat a constant deformation rate, sharp changes in stress can be observed in the stress-straincurve. These abrupt movements are usually referred as serrations, serrated plastic flow orjerky flow. The term jerky flow refers to lower temperature flow that manifests as smallirregularities in the stress-strain curve, while the term serration refers to larger and moreregular stress changes in the stress-strain curve that occur at higher temperatures [41]. Theserrated yielding is also called the Portevin-Le Chatelier effect. The serrations are caused bythe fast dislocation locking. The diffusion of the interstitial or substitutional locking elementsis fast enough that the dislocations lock and release multiple times during the constantdeformation rate. During the serrated yielding the deformation is inhomogeneous in spaceas well as time. [37]Mouri et al. have studied dynamic strain aging in nodular cast iron. The fatigue and tensilebehavior of ductile cast iron varies depending on the temperature range. The fatiguebehaviors can be divided to three different temperature ranges. In the temperature range of20 - 127℃ the dislocation velocities are faster than the diffusion of carbon atoms. In therange of 127 - 300℃ the dislocation and diffusion speed of the carbon atoms are compatible.Above 300℃ the carbon diffusion is faster than the rate of the dislocation movement. Thedynamic strain aging occurs in the temperature range of 127 - 300℃ and already at lowstress levels [3][42]. However, for static strain aging of ductile cast iron specific temperaturerange is not available from literature.Static strain aging has been widely used in automotive industry to strengthen the steel framesof the cars. Usually in automotive industry this process is called bake hardening, which is ahigh temperature static strain aging process usually applied in the temperature range ofaround 150-200℃. The higher strength of these bake hardening steels allows the car framesto be constructed using thinner gauges while maintaining the strength. This results in weightsaving, thus contributing to fuel economy. The basic concept of bake hardening, and staticstrain aging is illustrated in figure 15.

32
Figure 15 Schematic explaining the concept of bake hardening by stress-strain curve. The solute carbon atoms diffuseto the regions of dislocations formed during the plastic deformation inducing Cottrell locking.[43]Although effects of static strain aging (SSA) has been quite extensively studied on steels[44][45] it has not been studied on cast irons. Same principles should apply between the castirons and steels. However, the different silicon content in the materials changes the activationenergy of carbon diffusion [2]. This can affect the conditions such as temperature ranges andpre-strains where SSA can occur. The rest of this chapter deals only with static strain aging.2.3.1 The role of temperature in strain agingIncreasing aging temperature tends to increase the strain aging effect. Because increasingtemperature accelerates the diffusion of solutes in the material the strain aging occurs morerapidly in higher temperatures. However, at higher temperatures it is possible to induce over-aging in the material. When overaged, the material becomes softer and the ductility of thematerial increases rather than decreases. Gündüz studied static strain aging behavior of dualphase steel and found that over-aging occurred at 150℃, 200℃ and 250 ℃ agingtemperatures [46]. Ramazani et al. studied bake hardening effect in FP600 and TRIP700steels and found no over-aging to occur in the TRIP700 steel when aged in 220 ℃, whileDP600 steel showed evidence of the over-aging phenomenon at 170 ℃ temperature [43].There is not much literature about this over-aging phenomenon in cast irons, but due to thehigher silicon content it is reasonable to assume that this happens at higher temperatures thanwith steels. Lui and Chao studied high temperature properties of spheroidal graphite castiron and found that it is prone to intermediate temperature embrittlement [47]. The ductilityminimum of the cast iron was found to be around 400 ℃ and the embrittlement temperaturewas between 300-400 ℃ for creep rupture, fatigue- and tensile tests. The same temperature

33
range for carbon steels is between 150-250 ℃ [47]. These results indicate that the over-agingphenomena may occur at 300-400℃ range in ductile cast irons.De et al. studied static strain aging behavior of ultra-low carbon bake hardening steels [48].According to the study there seems to be an incubation period at the start of the strain agingwhere the yield point elongation does not occur. In the paper the incubation period observedwas 30 minutes for all pre-strain levels used. However, the incubation period depended onthe aging temperature and the period became shorter as the aging temperature was increased.In the study it was found that the yield point elongation (YPE) increased after the incubationperiod until approximately 1000 minutes of aging. After this point the YPE saturated andremained constant or dropped slightly with further aging. With 1% pre-strain smalladditional increase in yield stress was observed after the first aging stage with temperatureshigher than 140 ℃. According to the authors this might be due to a low temperature carbideformation or solute atom clustering. Similar results on the strain aging have been observedin other studies according to the review paper of Baker et al. [49].2.3.2 The effects of aging timeIt is important to note that strain aging is not a linear process as a function of time. Usuallyas time passes there are several distinct hardening stages where the yield strength increasesat different rates. The number of distinct stages and the nature of the hardening stages canvary depending on the material and aging methodology used. However, there are usuallysome similarities that can be observed between different studies. The first aging stage isalmost always attributed to the formation and saturation of Cottrell atmospheres and thefollowing stages are usually results of further carbon clustering or low temperature carbideformation.In bake hardening steels at least four different stages for the strain aging behavior have beenobserved in the study of Vasilyev et al. [50]. In the study very sensitive internal frictionmeasurements and dynamic Young’s modulus measurements were carried out in order totrack the complicated strain aging process in the studied steel. The changes in the Young’smodulus are very small due to strain aging but allow the quantitative measurement of strainaging process over time without destructive testing. The first stage where the Young’smodulus increases rapidly was observed in all temperatures. In the second stage the Young’smodulus increased much slower than in the first stage and decreased slightly at the end ofthe second stage. This effect is probably due to the atmospheres at the dislocations saturating,thus stopping the further pinning of dislocations. While this happens some desegregation ofcarbon atoms from the grain boundaries takes place explaining the decrease in Young’smodulus. At the third stage at room temperature and at 50 ℃ the Young’s modulus increasesagain. However, different pattern can be observed in 70 ℃ and 100℃ aging temperatures,where a more complex pattern of increasing and subsequently decreasing seems to behappening. The desegregation process contributing to the negative Young’s modulus changeis thermally activated and is seen to be most pronounced at the 100℃ temperature. At thestart of the fourth stage increase in Young’s modulus can be observed in all agingtemperatures. However, at 100 ℃ aging temperature this is followed by a continuousdecrease in Young’s modulus as the aging is continued further.
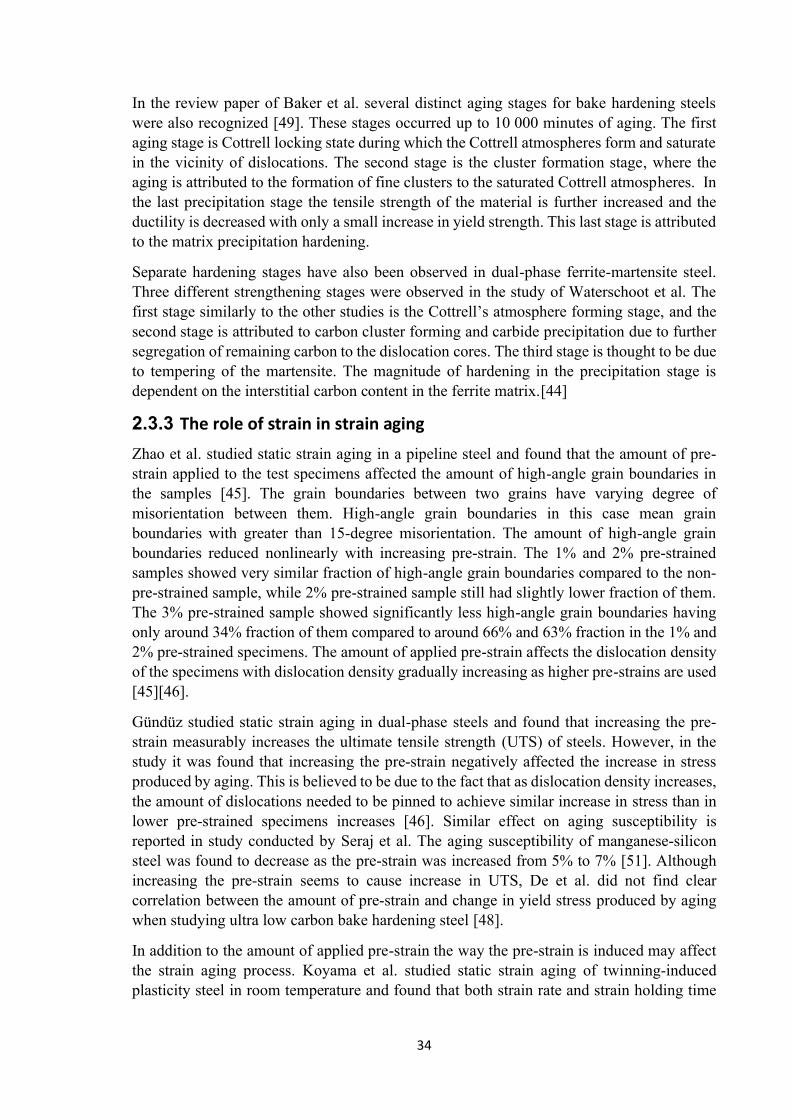
34
In the review paper of Baker et al. several distinct aging stages for bake hardening steelswere also recognized [49]. These stages occurred up to 10 000 minutes of aging. The firstaging stage is Cottrell locking state during which the Cottrell atmospheres form and saturatein the vicinity of dislocations. The second stage is the cluster formation stage, where theaging is attributed to the formation of fine clusters to the saturated Cottrell atmospheres. Inthe last precipitation stage the tensile strength of the material is further increased and theductility is decreased with only a small increase in yield strength. This last stage is attributedto the matrix precipitation hardening.Separate hardening stages have also been observed in dual-phase ferrite-martensite steel.Three different strengthening stages were observed in the study of Waterschoot et al. Thefirst stage similarly to the other studies is the Cottrell’s atmosphere forming stage, and thesecond stage is attributed to carbon cluster forming and carbide precipitation due to furthersegregation of remaining carbon to the dislocation cores. The third stage is thought to be dueto tempering of the martensite. The magnitude of hardening in the precipitation stage isdependent on the interstitial carbon content in the ferrite matrix.[44]2.3.3 The role of strain in strain agingZhao et al. studied static strain aging in a pipeline steel and found that the amount of pre-strain applied to the test specimens affected the amount of high-angle grain boundaries inthe samples [45]. The grain boundaries between two grains have varying degree ofmisorientation between them. High-angle grain boundaries in this case mean grainboundaries with greater than 15-degree misorientation. The amount of high-angle grainboundaries reduced nonlinearly with increasing pre-strain. The 1% and 2% pre-strainedsamples showed very similar fraction of high-angle grain boundaries compared to the non-pre-strained sample, while 2% pre-strained sample still had slightly lower fraction of them.The 3% pre-strained sample showed significantly less high-angle grain boundaries havingonly around 34% fraction of them compared to around 66% and 63% fraction in the 1% and2% pre-strained specimens. The amount of applied pre-strain affects the dislocation densityof the specimens with dislocation density gradually increasing as higher pre-strains are used[45][46].Gündüz studied static strain aging in dual-phase steels and found that increasing the pre-strain measurably increases the ultimate tensile strength (UTS) of steels. However, in thestudy it was found that increasing the pre-strain negatively affected the increase in stressproduced by aging. This is believed to be due to the fact that as dislocation density increases,the amount of dislocations needed to be pinned to achieve similar increase in stress than inlower pre-strained specimens increases [46]. Similar effect on aging susceptibility isreported in study conducted by Seraj et al. The aging susceptibility of manganese-siliconsteel was found to decrease as the pre-strain was increased from 5% to 7% [51]. Althoughincreasing the pre-strain seems to cause increase in UTS, De et al. did not find clearcorrelation between the amount of pre-strain and change in yield stress produced by agingwhen studying ultra low carbon bake hardening steel [48].In addition to the amount of applied pre-strain the way the pre-strain is induced may affectthe strain aging process. Koyama et al. studied static strain aging of twinning-inducedplasticity steel in room temperature and found that both strain rate and strain holding time

35
had impact on the level of strain aging that occurred. The change in true stress was found toincrease linearly as the strain rate or strain holding time increased logarithmically. Theauthors found that increasing the amount of pre-strain had roughly exponential effect on thechange in true stress. The authors credit these effects mostly to be caused by dynamic strainaging during the pre-straining, carbon segregation to dislocations and re-ordering of carbonunder external stress. [52]2.3.4 Grain size and solute atomsBaker et al. did literature review on bake hardening steels[49]. The paper examines factorsaffecting the high temperature strain aging process called bake hardening. There seems tobe no clear consensus on the effect of grain size in this process. The effect of ferrite grainsize on the bake hardening properties of steels have been studied. Generally, studies indicatethat finer grain size increases the bake hardening properties of steels. However, multipleother studies do not find correlation between grain size and bake hardening response.According to the review of Baker et al. [49] low solute atom content is essential in order tokeep the bake hardening steel stable at ambient temperatures. The excess carbon levels arekept between 15-25 wt.-ppm to ensure the stability at ambient temperatures. Higherconcentrations of solute atoms increase the level of strain aging response and allow theprocess to occur at lower temperatures, thus allowing aging to happen at room temperature.This is because higher number of solute atoms is available to pin the existing dislocationsand the formation of Cottrell atmospheres is more rapid due to higher solute atom content.2.4 Other possible embrittlement mechanisms the insertIn addition to strain aging there are other embrittlement mechanisms that could affect thecast iron insert in the repository. Although this thesis focuses on strain aging and morespecifically on static strain aging it is important to be familiar with other notable forms ofembrittlement that could affect the canister insert in the repository especially when themechanisms could affect the insert simultaneously and synergistically. The synergisticeffects of these mechanisms are not well known.2.4.1 Hydrogen embrittlementIt is well known that hydrogen can diffuse into metals and cause embrittlement of thematerial. It has been found that the susceptibility for hydrogen embrittlement increases asthe ferrite content of the material increases.[53] For this reason the hydrogen embrittlementis important to consider when studying the ductile cast iron with fully ferritic matrix.The effects of internal hydrogen in ductile cast iron have been previously studied byMatsunaga et al. In the study it was found that hydrogen charging resulted in markeddecrease in the percentage reduction of area. Most of the hydrogen was found to be diffusiveand segregate at the graphite/ferrite matrix interface and in cementite of pearlite. The fracturemechanism was found to change due to the hydrogen charging and there appeared to beinterconnecting cracks between neighboring graphite nodules unlike in the fully ductilefracture of the as received material. [54]Hydrogen embrittlement in the canister insert material has been previously studied byForsström et al.[55] and Sahiluoma et al. [56]. In both studies the hydrogen charging was

36
found to markedly reduce the total elongation of the material as well as reduce the time tofracture in constant load testing. In both studies the complete change of fracture mechanismwas observed, and the matrix of the hydrogen charged specimens was found to crack bybrittle cleavage fracture mechanism.In the work of Sahiluoma the hydrogen uptake of the cast iron was found to increasemarkedly during plastic deformation. The hydrogen charging reduced the elongation tofracture and time to fracture in slow strain rate testing and in constant load testing. In thermaldesorption spectroscopy (TDS) two distinct peaks for hydrogen desorption were observed,one between 400 and 500 K and one at 600 K with heating rate of 10 K/min. The authorattributed the lower temperature peak between 400 and 500 K to correspond to hydrogentrapped at small voids and cracks in the ferrite matrix and at the interface of graphite nodules.The Higher temperature peak at 600 K was attributed to the hydrogen trapped in the graphitenodules.[56] In the study of Forsström et al. the hydrogen desorption was found to manifestin three different peaks at temperature of 400 K, 500 K and 700 K with heating rate of 6K/min. The peak at 400 K was found to shift to 450 K under load and when the absorbedhydrogen content is increased significantly. The peak at 500 K was found to shift towards560 K with hydrogen charging but had no significant response to increased loading.[55]2.4.2 Radiation embrittlementAs the nuclear fuel decays, it emits radiation that can have impact on the canister structure.The ionizing radiation can cause damage in the crystalline structure of the cast iron insert,possibly contributing to redistribution of atoms and rejection of solute atoms from thecrystal. This could affect the chemical composition of the insert and may increase the risk offailure.The effects of neutron-irradiation have been studied extensively on the steel alloys and weldmetals used in the nuclear reactor pressure vessels (RPVs). The growing understanding ofthe phenomenon has caused closing of at least one facility. There are several differentmechanisms behind the radiation embrittlement. One of the mechanisms is the generation ofpoint defects such as interstitials and vacancies and dislocation loops in the material. It hasbeen shown that these defects are mostly repaired by diffusion but over time the defects canaccumulate and alter the material properties. Other important hardening mechanism is thedevelopment of Cu-rich nanoclusters or precipitates in the material, which is accelerated bythe neutron irradiation induced high vacancy concentration. In steels it has been found thatthe alloy content is strongly correlated with the level of neutron embrittlement and thetendency for the neutron embrittlement can be reduced or eliminated in certain temperaturesby reduction of the residual element content in the material. Copper has been found to be thesingle most harmful alloying element regarding the cluster formation, but nickel andmanganese have later been found to also exacerbate the formation of the Cu-richnanoclusters synergistically. As the diffusion can repair most of the defects induce byneutron irradiation, the embrittlement effects are lesser in higher temperatures and get moresevere as the irradiation temperature is lowered.[57]The hardening and embrittlement which is induced by clustering of Cu particles is wellknown in pressurized water reactors that are mostly composed of alpha ferrite. [58] Thestudies of Brissonneau et al. raised concerns that similar aging process due to radiation

37
enhanced solute clustering could occur in the cast iron and lead to degradation of themechanical properties of the insert [59]. However, later report by Olsson et al. studying theirradiation induced Cu clustering in cast iron FeCu alloy found that no hardening due to Cuprecipitation occurred in the cast iron during one week of electron irradiation. In the studythe acceleration rate was estimated to be 2750 meaning that the one week irradiation wouldcorrespond to 45 years in the storage conditions.[58] The safety regarding irradiationinduced Cu precipitation was also confirmed in the work of Chang. In the study no Cuprecipitation was found in the cast iron samples after one week of 2 MeV electronirradiation.[60] In latest report regarding irradiation induced damage in the insert it wasconcluded that the irradiation should have no significant impact on the mechanical propertiesafter 10 000 years.[61]
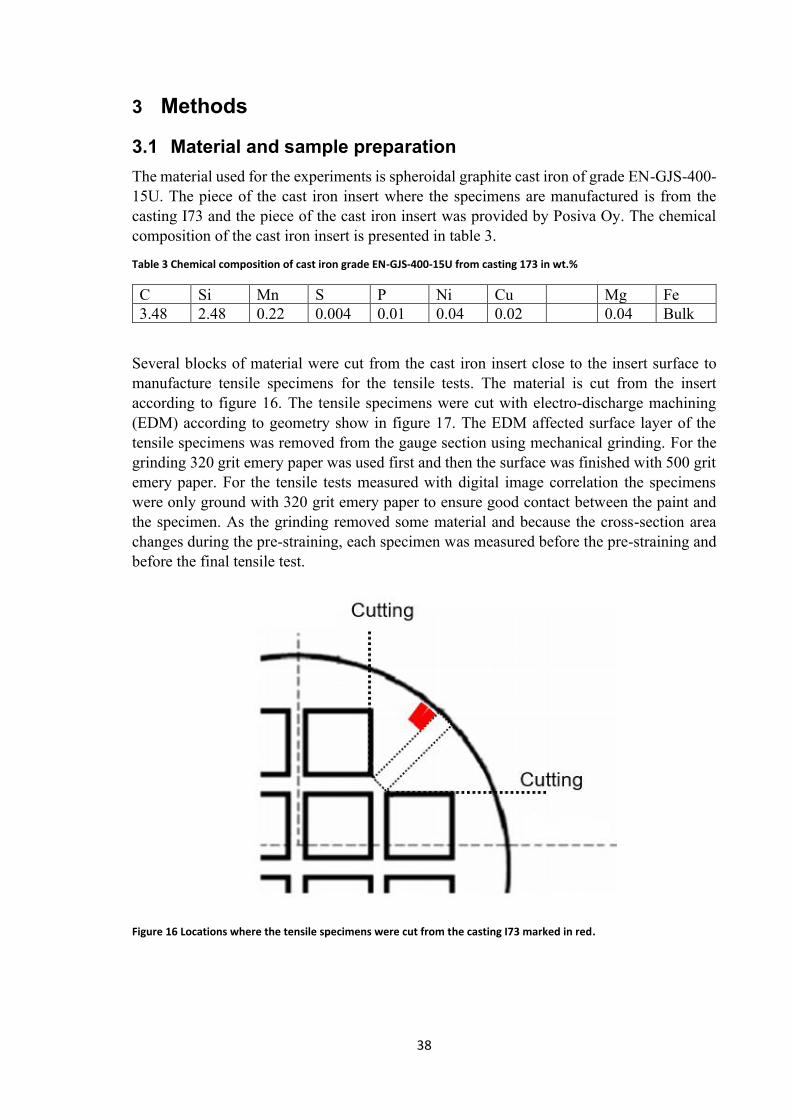
38
3 Methods3.1 Material and sample preparationThe material used for the experiments is spheroidal graphite cast iron of grade EN-GJS-400-15U. The piece of the cast iron insert where the specimens are manufactured is from thecasting I73 and the piece of the cast iron insert was provided by Posiva Oy. The chemicalcomposition of the cast iron insert is presented in table 3.Table 3 Chemical composition of cast iron grade EN-GJS-400-15U from casting 173 in wt.%C Si Mn S P Ni Cu Mg Fe3.48 2.48 0.22 0.004 0.01 0.04 0.02 0.04 Bulk
Several blocks of material were cut from the cast iron insert close to the insert surface tomanufacture tensile specimens for the tensile tests. The material is cut from the insertaccording to figure 16. The tensile specimens were cut with electro-discharge machining(EDM) according to geometry show in figure 17. The EDM affected surface layer of thetensile specimens was removed from the gauge section using mechanical grinding. For thegrinding 320 grit emery paper was used first and then the surface was finished with 500 gritemery paper. For the tensile tests measured with digital image correlation the specimenswere only ground with 320 grit emery paper to ensure good contact between the paint andthe specimen. As the grinding removed some material and because the cross-section areachanges during the pre-straining, each specimen was measured before the pre-straining andbefore the final tensile test.
Figure 16 Locations where the tensile specimens were cut from the casting I73 marked in red.

39
Figure 17 Tensile specimen geometry3.2 Experimental methodsConstant extension rate tensile testing (CERT) was used for the tensile specimens in roomtemperature. The extension was measured with an extensometer. To observe the referencebehavior of the as-received material a basic tensile test was conducted. The other specimenswere first strained to the nominal pre-strain of 1%, 2% or 3% with constant extension rateof 0.016 mm/s and then the load was removed with constant speed of 0.10 mm/s. Thespecimens were strained a little over the nominal strain to achieve plastic strain that is closeto the nominal value. The specimens were strained to total strain of 1.15%, 2.15% and3.15%. The samples were then aged at room temperature, 100 ℃, 200 ℃, 300 ℃ and 400℃ for different durations to induce static strain aging. For the 100 ℃ and 200 ℃ agedspecimens aging times of 1 day and 11 days were used. 300 ℃ and 400 ℃ specimens wereaged for 1 day. Additionally, two specimens were aged at 100 ℃ and at 200 ℃ without pre-straining them first to study if any aging would occur in the specimens due to possibleresidual strains. The room temperature samples were aged for even longer time of 84 days.After the aging treatment the specimens were removed from the furnace and cooled down inroom temperature for 30 min to 1 hour. After the specimens were cooled down tensile testswere conducted with the same constant extension rate of 0.016 mm/s. The tensile tests weredone during the same day after removing the samples from the furnace to minimize thepossibility of further aging at room temperature.It should be noted that during the 11-day aging process for the 100 ℃ and 200 ℃ specimensthere was an approximately two-hour power outage that occurred, during which the heattreatment furnaces were shut down. During this time, the temperature inside the furnacesdropped somewhat significantly, by about 20 ℃ in the 100 ℃ furnace and by an unknownamount in the 200 ℃ furnace. However, it is quite safe to assume that the possible effects ofthis are minimal and negligible in such prolonged aging.The microstructural samples for specimens 1 and 11 were cut from the wide ends of thetensile specimens after the tensile testing was conducted. The other microstructural sampleswere cut from the as received material in locations that correspond to the locations where allthe tensile specimens were cut from (Same distance from the insert surface right next to thespecimens). The specimens were hot mounted using Struers multifast resin and preparedusing wet grinding with up to 2400 grit paper and then polished using diamond paste firstwith 3-micron particle size and then 1 micron particle size. For the etching of the samplesurfaces 2% Nital solution was used.

40
3.3 Digital image correlation (DIC)Digital image correlation is optical method that is used to measure the full-field coordinatesand displacements from the surface of the test specimen by taking a sequence of images ofa pattern on the surface of specimen. For accurate measurement the pattern on the surface ofthe specimen, whether it is applied or not, should accurately follow the deformation of thematerial. This is the fundamental assumption behind the whole measurement process. Theimages taken from the pattern can be used to generate full field coordinates of the shape,motion and deformation of the test piece and the coordinate fields can in turn be used tocalculate displacements, strains, strain rates, velocities and curvatures. [62]The main benefit of the full field measurements compared to traditional point measurementswith strain gauges is that the full field measurements enable the measurement of localizeddeformation and gives more information of how the strain evolves in the specimen duringtesting.As the whole DIC measurement is based on the assumption that the pattern accuratelyfollows the deformation of the specimen, the pattern is the most essential part to successfulDIC data. For optimal measurements, the pattern feature size should be 3-5 pixels regardlessof whether the pattern is light or dark. In local DIC the coordinate point depends on a smallsubset of the image in the vicinity of the given point. Each measurement point is centeredinside a subset. Each subset should contain enough information so that it can be distinguishedfrom all the other subsets in the region-of-interest. A subset should include a minimum ofthree features of the pattern in all directions. The spacing between the measurement pointsis called step size.[62]DIC was carried out on some samples to obtain full field strain measurements of the strainaged specimens. A reference tensile test in room temperature as well as pre-straining andtensile testing of strain aged specimens were conducted using DIC. The software used forthe DIC measurements was Vic-3D.For the DIC tests the speckle pattern was applied with spray paint. A white base coat of paintwas sprayed to the specimen surface to increase contrast and black spray paint was used toapply the small speckles to the specimen surface. A laser printed tattoo paper was first usedto apply the pattern for the reference tensile test but, the usage of the tattoo paper was rejecteddue to it not following the deformation of the specimens accurately. Excessive stretching ofthe tattoo paper was observed at locations where there were no visible signs of localizedyielding. All the DIC experiments that are reported in results were carried out using spraypainted speckle patterns.A reference tensile test for the as received material was carried out using constant crossheadspeed of 0.016 mm/s. Additionally three specimens were pre-strained to 1%, 2% and 3%nominal pre-strain while the deformation was measured with DIC. As the strain data fromthe DIC measurements is not available live during the tensile testing a predeterminedcrosshead displacement was used to induce the specified amount of pre-strain. Crossheaddisplacements of 0.95 mm, 1.3mm and 1.7 mm were used to achieve the nominal strains of1%, 2% and 3%. These crosshead values are approximations based on data from the previoustests. After this the specimens were aged at 100 ℃ for 1 day. Finally, CERT using DIC was
41
conducted for the specimens with same crosshead speed of 0.016 mm/s. The speckle patternwas removed from the specimen surface with acetone before the aging. After the aging wascompleted the base paint coat and speckle pattern was reapplied to the specimen surface.The DIC images were recorded every 500 milliseconds during the tensile tests. For the DICcalculations subset size of 23 pixels and step size of 5 pixels was used for all the samples.The spatial resolution of the images was between 48 and 49 pixels/mm. As the crossheadspeed was quite slow and data acquisition rate was quite high the DIC calculations for thetensile experiments were done using every 12th image from all the captured images to reducenoise in the data. Additional DIC calculation was made using all the captured images toexamine the strain localization at the start of the yielding (after yield point) since the timeinterval of 6 seconds between every 12th image was too long to closely follow how the strainsdevelop during the onset of yielding. This calculation was also used to plot the stress-strainand stress-time curves of the experiments. For the pre-straining and unloading the DICcalculations were done using every 6th image from all the captured images because the totaldisplacements were so much smaller than in the tensile experiments that every 12th imagewould have included too little data.In materials with yield point the plastic deformation usually nucleates as a band at certainlocation and propagates uniformly at a front through the specimen during the yield plateauor Lüders strain. These bands are referred to as Lüders bands. The formation of Lüders bandsoccurs at the onset of plastic deformation in the material. Although the band propagatingtrough the specimen at front is the typical behavior, the development of Lüders bands canalso be more complex and less uniform in some cases. The complex arrays of Lüders bandsare often referred as stretcher strains but they are still Lüders bands.[39]In this work all localized bands of deformation in the specimens are referred as Lüders bands.The digital image correlation allows tracking the nucleation and propagation of possibleLüders bands in the tensile specimens. The DIC method enables us to see where thedeformation starts in the different specimens (i.e. where the Lüders bands nucleate) and howthe plastic deformation propagates trough the material and finally how the plasticdeformation localizes before leading to fracture.

42
4 Results4.1 CERTPre-strainingThe stress-strain curves of pre-straining and unloading of all the specimens compared to thereference tensile test are shown in figures 18-21. From the figures it is evident that theyielding behavior of the as-received material is almost identical to the pre-strainedspecimens in the pre-straining region. The yielding is smooth and typical for ductile cast ironwithout a clear yield point.
Figure 18 Pre-straining and and unloading of specimens 2,3,4,5,6 and 7 presented in stress-strain curves and comparedto the reference tensile test of specimen 1.
Figure 19 Pre-straining and and unloading of specimens 8,9,10,12,13 and 15 presented in stress-strain curves andcompared to the reference tensile test of specimen 1.
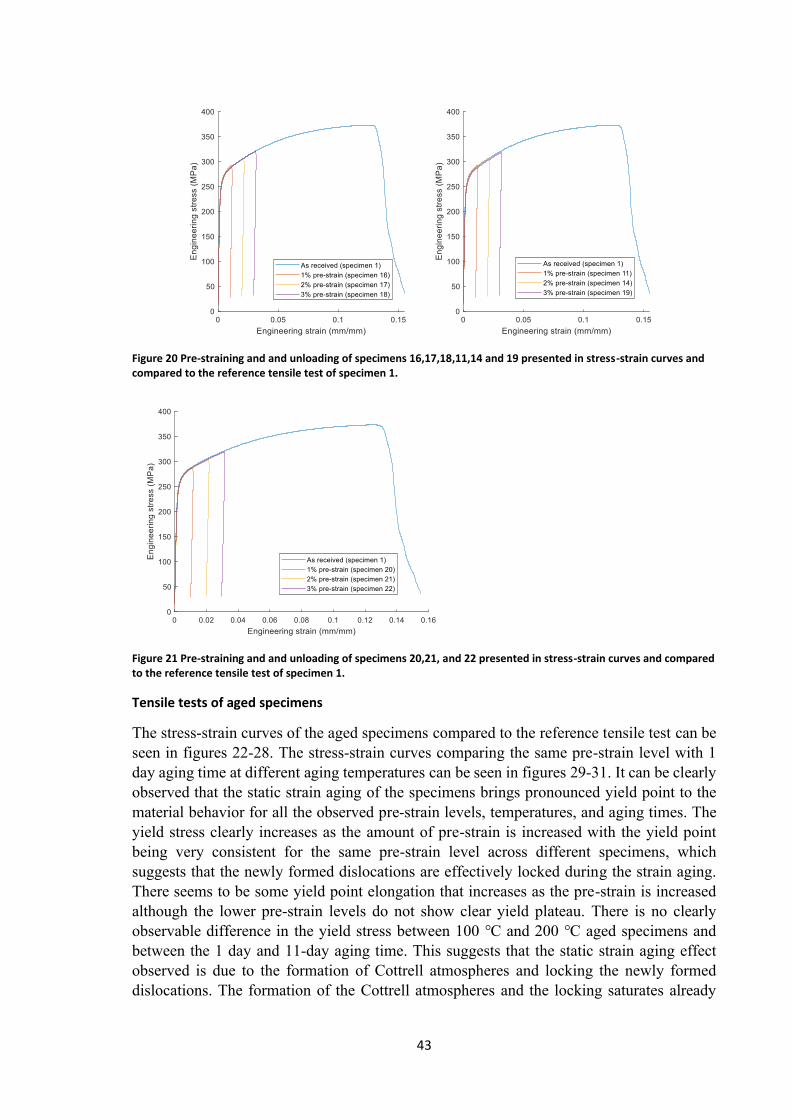
43
Figure 20 Pre-straining and and unloading of specimens 16,17,18,11,14 and 19 presented in stress-strain curves andcompared to the reference tensile test of specimen 1.
Figure 21 Pre-straining and and unloading of specimens 20,21, and 22 presented in stress-strain curves and comparedto the reference tensile test of specimen 1.Tensile tests of aged specimensThe stress-strain curves of the aged specimens compared to the reference tensile test can beseen in figures 22-28. The stress-strain curves comparing the same pre-strain level with 1day aging time at different aging temperatures can be seen in figures 29-31. It can be clearlyobserved that the static strain aging of the specimens brings pronounced yield point to thematerial behavior for all the observed pre-strain levels, temperatures, and aging times. Theyield stress clearly increases as the amount of pre-strain is increased with the yield pointbeing very consistent for the same pre-strain level across different specimens, whichsuggests that the newly formed dislocations are effectively locked during the strain aging.There seems to be some yield point elongation that increases as the pre-strain is increasedalthough the lower pre-strain levels do not show clear yield plateau. There is no clearlyobservable difference in the yield stress between 100 ℃ and 200 ℃ aged specimens andbetween the 1 day and 11-day aging time. This suggests that the static strain aging effectobserved is due to the formation of Cottrell atmospheres and locking the newly formeddislocations. The formation of the Cottrell atmospheres and the locking saturates already

44
during the 1-day aging period at temperature of 100 ℃. From figures 29-31 it seems thataging in 300 ℃ and 400 ℃ results in a lower increase of the yield stress compared to agingat 100 ℃ and 200 ℃ and after aging at 400 ℃ the yield point is clearly less pronounced.The differences in the yield point increase between the 300 ℃ aged specimens compared tothe 100 ℃ and 200 ℃ aged specimens gets larger when the pre-strain is increased. Thespecimens aged at room temperature show significantly smaller increase in the yield stressthan the specimens aged at 100℃ and 200 ℃. The increase in yield stress is similar to thesamples aged at 300 ℃.The effects of the aging on the total elongation of the specimens cannot be accurately judged,because the material seems to have a lot of variation between specimens when it comes tothe total elongation. However, by combining the results it is clear that the strain agingreduces the total elongation to some extent even when the pre-straining is taken into account.During the testing some small pores were visible on the surface of some of the specimens. Itshould be noted that some of the specimens fractured outside of the extensometer gaugelength, which can be seen in the stress-strain curves as the elastic stress returns to zero instraight line after the fracture point.The specimens aged at room temperature seem to have better total elongations than thespecimens aged at higher temperatures. It should be noted that although the yield strengthlevels of the specimens aged at RT and 300 ℃ are similar the RT specimens seem to havebetter elongation to fracture and slightly lower strain-hardening rate. The variation in thetotal elongation of the specimens is probably partly due to various casting defects present inthe material as well as the difference in the microstructure in different parts of the cast.
Figure 22 CERT stress-strain curve for specimens aged at 100℃ for 1 day.
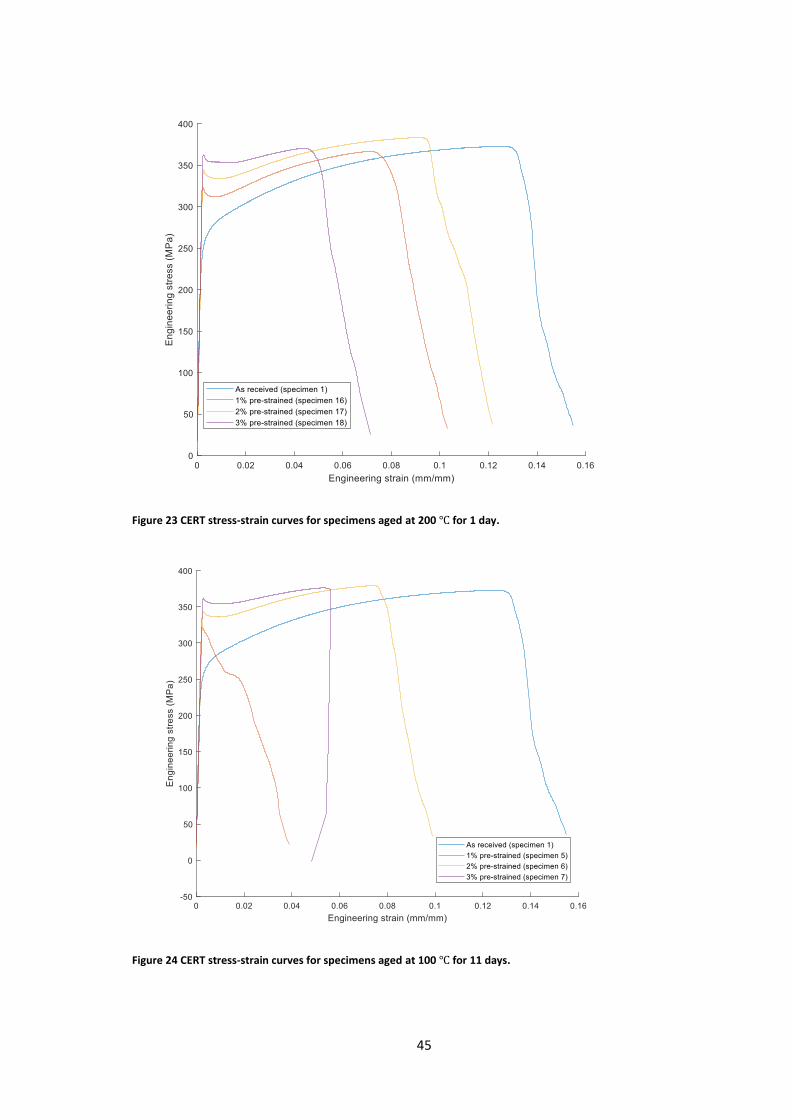
45
Figure 23 CERT stress-strain curves for specimens aged at 200℃ for 1 day.
Figure 24 CERT stress-strain curves for specimens aged at 100℃ for 11 days.
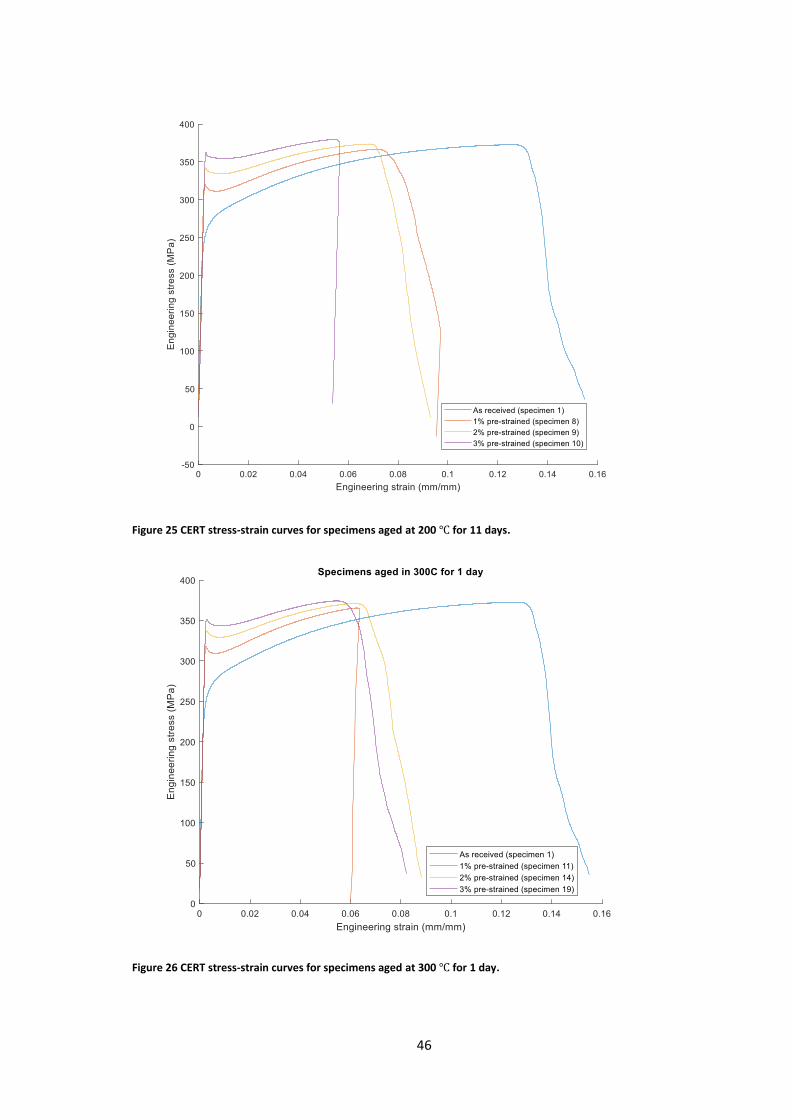
46
Figure 25 CERT stress-strain curves for specimens aged at 200℃ for 11 days.
Figure 26 CERT stress-strain curves for specimens aged at 300℃ for 1 day.
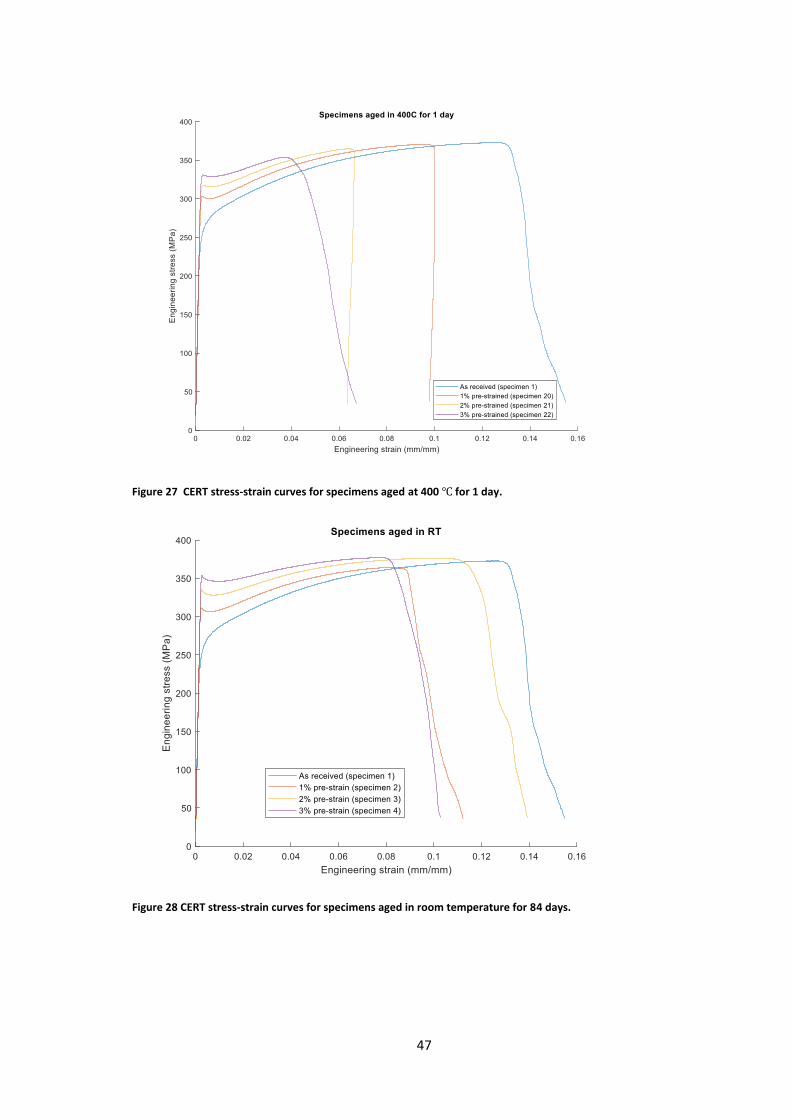
47
Figure 27 CERT stress-strain curves for specimens aged at 400℃ for 1 day.
Figure 28 CERT stress-strain curves for specimens aged in room temperature for 84 days.

48
Figure 29 CERT stress strain curves for 1% pre-strained samples aged for 1 day in different temperatures.
Figure 30 CERT stress strain curves for 2% pre-strained samples aged for 1 day in different temperatures.

49
Figure 31 CERT stress strain curves for 3% pre-strained samples aged for 1 day at different temperatures.
The CERT results of the non-pre-strained and aged samples compared to the as receivedmaterial are shown in figure 32. The aged specimens follow almost identical yieldingbehavior compared to each other and to the reference tensile test done at room temperature,until each specimen fractures at different elongation. There is no clearly observable agingthat occurs without pre-straining in these specimens. The difference in elongation to fracturecan be explained by the natural scatter in the material. The small differences in the 0.2%proof stress are probably due to the small differences in the microstructure of the material ormeasurement error rather than the aging. The two aged specimens are located closer to thesurface of the insert than the as-received specimen.

50
Figure 32 Stress-strain curves of non pre-strained samples aged at 100℃ and 200℃ for 1 day compared toasreceived material.
The results of the tensile experiments are combined in table 4. The yield ratio (YS/UTS)increases remarkably as the result of static strain aging. The yield ratio seems to increase asthe pre-strain is increased rising to values of over 0.95 for the 3% pre-strained samples. Theyield ratio changes quite drastically even at the pre-strain levels of 1%, increasing over 20%compared to the reference sample. The increase in yield ratio seems to be lower for thespecimens that are aged at 400 ℃ and 300 ℃. However, the difference between thespecimens aged at 300 ℃, 200℃ and 100℃ is small and can be attributed to the variationsbetween the specimens.The yield stress increase produced by aging seems to get larger as the pre-strain is increased.However, when aged in 400 ℃ for 1 day the yield stress increase produced by aging getssmaller as the pre-strain is increased.Instead of total elongation at fracture the elongation at the highest stress/force is reportedsince some of the specimens fractured outside the gauge length of the extensometer and theextensometer data after the elongation starts to localize is not available for all the specimens.However, it is worth noting that by looking at the graphs the uniform elongation 𝐴𝑔𝑡(elongation at maximum force) and the elongation at fracture 𝐴𝑡 are in practice very close toeach other for the studied material. The 𝐴𝑔𝑡 value in this case just makes possible to comparethe data between specimens without approximations.

51
Table 4 CERT resultsPre-strain SpecimenID Agingtemperature (℃)
Aging time(h) Yield Stress(MPa) Ultimatetensilestrength(MPA)
Yieldratio Increasein yieldstressproducedby aging(MPa)
Elongation atmaximumforce 𝐴𝑔𝑡(%)0 % (asreceived) 1 - - 264 373 0.708 12.5
1 %
2 25 2016 311 364 0.854 23 8.412 100 24 323 373 0.866 32 8.05 262.5 322 322 1 33 0.2416 200 24 323 367 0.880 31 7.18 262.5 321 367 0.875 31 7.111 300 24 318 365 0.871 27 6.220 400 24 304 370 0.822 15 9.6
2 %
3 25 2016 336 376 0.894 31 10.113 100 24 344 364 0.945 36 5.56 262.5 344 379 0.908 37 7.417 200 24 345 383 0.901 38 9.29 262.5 342 374 0.914 38 6.914 300 24 337 371 0.908 30 6.321 400 24 317 365 0.868 13 6.4
3 %
4 25 2016 353 377 0.936 34 7.615 100 24 364 383 0.950 41 7.07 262.5 363 376 0.965 39 5.418 200 24 363 370 0.981 43 4.510 262.5 362 380 0.953 43 5.519 300 24 352 374 0.941 34 5.422 400 24 331 354 0.935 12 3.8

52
4.2 DICPre-straining the samplesThe full-field strain measurements from the pre-straining and unloading of the specimensare shown in figures 33-35. Each of the images show five snapshots of the strainmeasurements during the pre-straining. The first four snapshots show the strainmeasurements as the specimen is loaded and the final image shows the remaining strainsafter the specimen is unloaded. For specimen 29 the time during the last snapshot is notavailable since the returning crosshead speed for the unloading was mistakenly set to aslower value and the DIC measurements were paused during the unloading. However, theDIC measurements were continued after the unloading and the final snapshot shows theremaining strains after the specimens is completely unloaded.
Figure 33 Full-field strain measurements of specimen 24 showing the strain in Y-direction (eyy) at different timesduring the 1% pre-straining process.
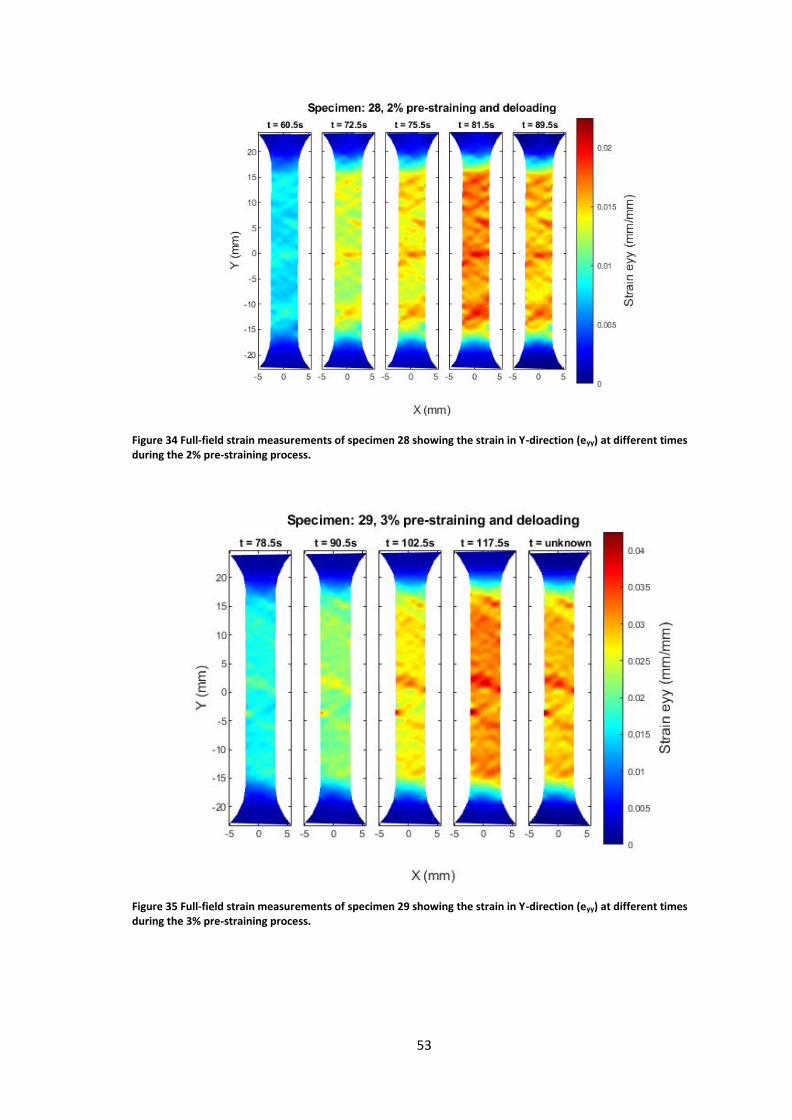
53
Figure 34 Full-field strain measurements of specimen 28 showing the strain in Y-direction (eyy) at different timesduring the 2% pre-straining process.
Figure 35 Full-field strain measurements of specimen 29 showing the strain in Y-direction (eyy) at different timesduring the 3% pre-straining process.
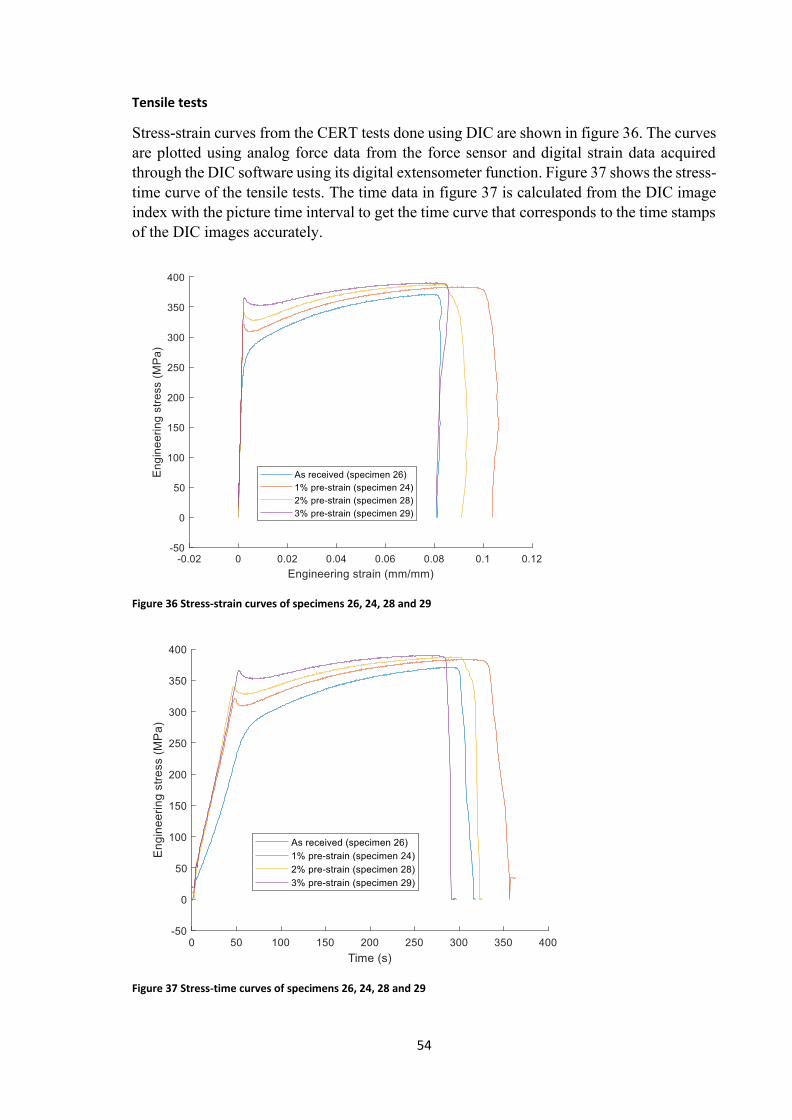
54
Tensile testsStress-strain curves from the CERT tests done using DIC are shown in figure 36. The curvesare plotted using analog force data from the force sensor and digital strain data acquiredthrough the DIC software using its digital extensometer function. Figure 37 shows the stress-time curve of the tensile tests. The time data in figure 37 is calculated from the DIC imageindex with the picture time interval to get the time curve that corresponds to the time stampsof the DIC images accurately.
Figure 36 Stress-strain curves of specimens 26, 24, 28 and 29
Figure 37 Stress-time curves of specimens 26, 24, 28 and 29

55
Figures 38-41 show the full-field strain measurements after the onset of yielding in eachspecimen. Fig. 38 shows the deformation of the as received specimen after the onset ofyielding. As expected, there is no Lüders deformation in the specimen 26 as the specimenyields continuously without pronounced yield point. The deformation in specimen 26 seemto nucleate from the specimen shoulders but after that the deformation will quickly propagatethrough the whole gauge length. The start of the uniform elongation is almost instantaneous.There is no clear Lüders bands observed in specimen 26 and instead the deformation seemsto appear as large amount of non-defined diffuse bands that randomly develop throughoutthe gauge length resulting in uniform elongation shortly after the onset of yielding.
Figure 38 Full-field strain measurements of specimen 26 after the yielding starts. The figure shows fast nucleation ofmultiple diffuse deformation bands across the whole gauge length indicating the absence of Lüders effect andimmediate start of uniform elongation.Fig. 39 shows the full-field strain measurements of the specimen 24 after aging. Thespecimen 24 seems to have Lüders deformation to some extent. The deformation is muchmore localized than in the as received specimen as multiple distinct Lüders bands seem tonucleate from both specimen ends. However, the effect is not very typical Lüdersdeformation as there is no clear band fronts propagating trough the gauge length, but thebands seem to get stuck shortly after nucleation causing strain localizations in these areas.

56
Figure 39 Full-field strain measurements of specimen 24 after the yield point showing complex nucleation of andpropagation of multiple Lüders bands.Fig. 40 shows the strain measurements of specimen 28 after the yield point. The specimen28 shows Lüders effect to higher extent as there seems to be distinct Lüders band nucleatingfrom one end of the gauge length and propagating towards the other end of the specimen.However, the Lüders band does not seem to have definite front as there is no clear frontbetween un yielded and yielded material. The band front seems to be diffuse as the materialyields more inside the band than at the front. This Lüders band seems to get stuck at aroundthird of the gauge length not propagating further. The other end of the specimen does notshow typical Lüders type deformation and the yielding starts similarly to the as receivedmaterial with some diffuse type Lüders bands forming randomly across the specimen untilsomewhat uniform strain field across the whole gauge length is achieved.
Figure 40 Full-strain measurements of specimen 28 after the yield point clearly showing the formation andpropagation of diffuse Lüders band. The Lüders band nucleates from the bottom end of the gauge length and quicklypropagates through the entire gauge length after which the uniform deformation in the strain hardening regionacross the whole gauge length starts.
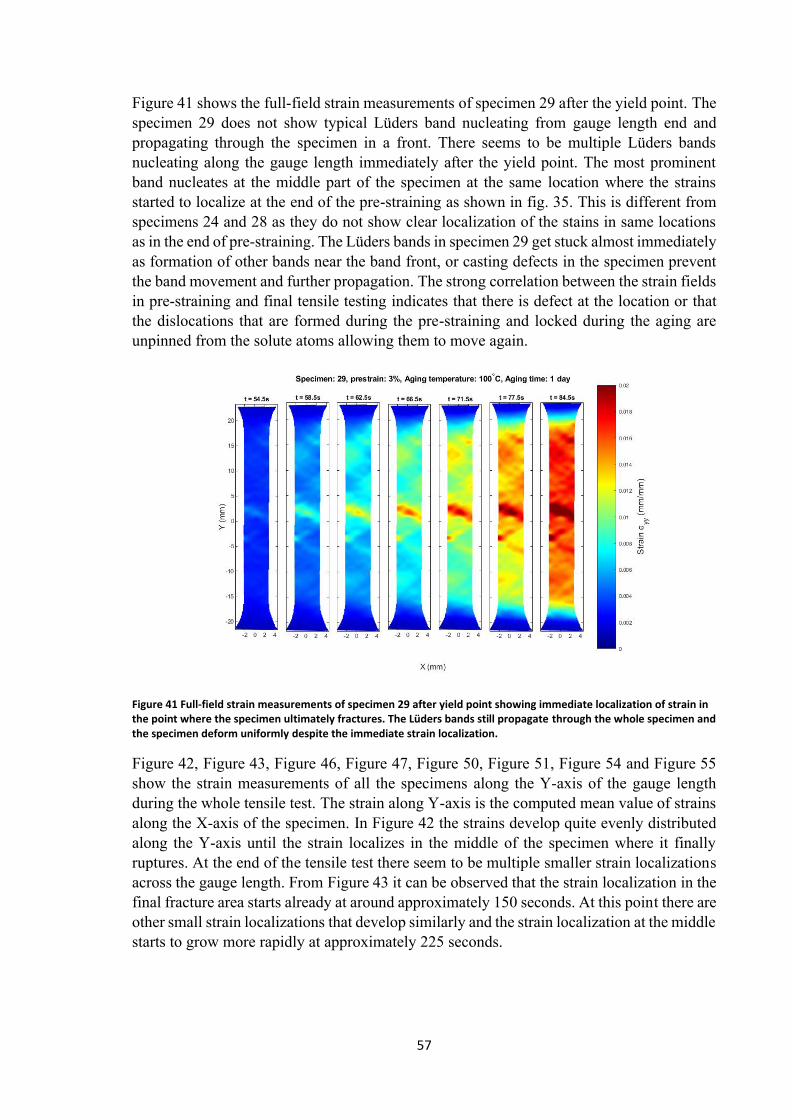
57
Figure 41 shows the full-field strain measurements of specimen 29 after the yield point. Thespecimen 29 does not show typical Lüders band nucleating from gauge length end andpropagating through the specimen in a front. There seems to be multiple Lüders bandsnucleating along the gauge length immediately after the yield point. The most prominentband nucleates at the middle part of the specimen at the same location where the strainsstarted to localize at the end of the pre-straining as shown in fig. 35. This is different fromspecimens 24 and 28 as they do not show clear localization of the stains in same locationsas in the end of pre-straining. The Lüders bands in specimen 29 get stuck almost immediatelyas formation of other bands near the band front, or casting defects in the specimen preventthe band movement and further propagation. The strong correlation between the strain fieldsin pre-straining and final tensile testing indicates that there is defect at the location or thatthe dislocations that are formed during the pre-straining and locked during the aging areunpinned from the solute atoms allowing them to move again.
Figure 41 Full-field strain measurements of specimen 29 after yield point showing immediate localization of strain inthe point where the specimen ultimately fractures. The Lüders bands still propagate through the whole specimen andthe specimen deform uniformly despite the immediate strain localization.Figure 42, Figure 43, Figure 46, Figure 47, Figure 50, Figure 51, Figure 54 and Figure 55show the strain measurements of all the specimens along the Y-axis of the gauge lengthduring the whole tensile test. The strain along Y-axis is the computed mean value of strainsalong the X-axis of the specimen. In Figure 42 the strains develop quite evenly distributedalong the Y-axis until the strain localizes in the middle of the specimen where it finallyruptures. At the end of the tensile test there seem to be multiple smaller strain localizationsacross the gauge length. From Figure 43 it can be observed that the strain localization in thefinal fracture area starts already at around approximately 150 seconds. At this point there areother small strain localizations that develop similarly and the strain localization at the middlestarts to grow more rapidly at approximately 225 seconds.
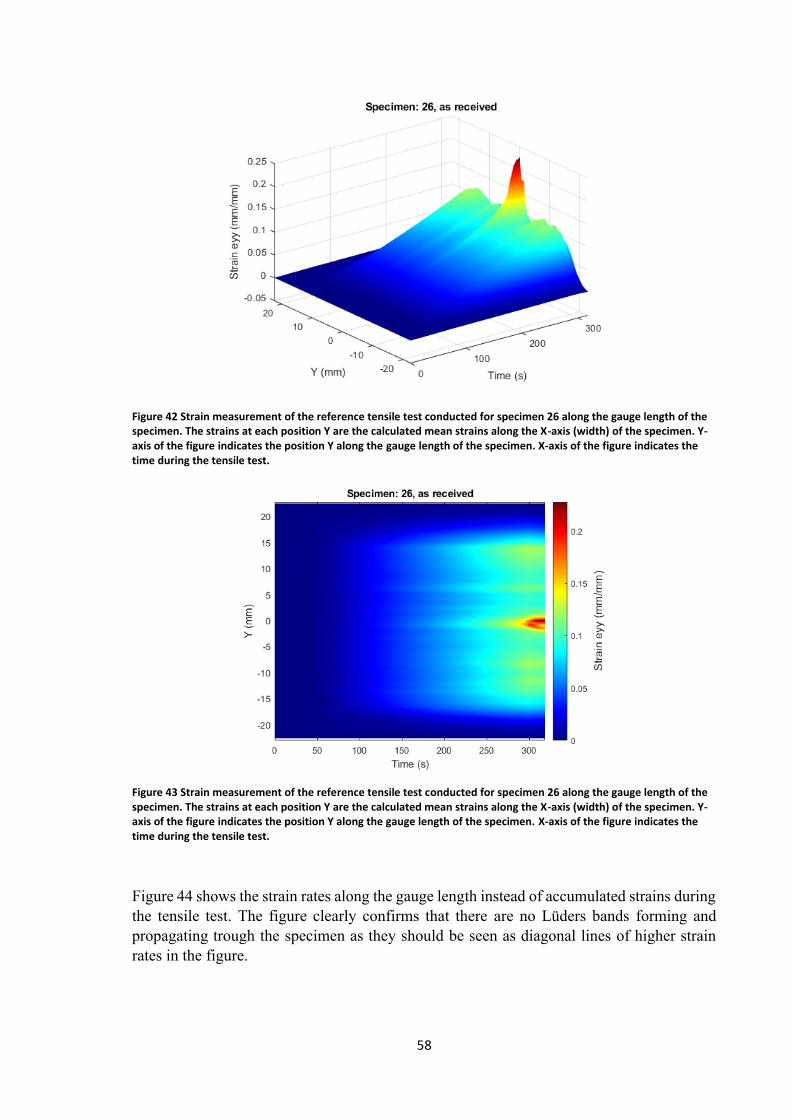
58
Figure 42 Strain measurement of the reference tensile test conducted for specimen 26 along the gauge length of thespecimen. The strains at each position Y are the calculated mean strains along the X-axis (width) of the specimen. Y-axis of the figure indicates the position Y along the gauge length of the specimen. X-axis of the figure indicates thetime during the tensile test.
Figure 43 Strain measurement of the reference tensile test conducted for specimen 26 along the gauge length of thespecimen. The strains at each position Y are the calculated mean strains along the X-axis (width) of the specimen. Y-axis of the figure indicates the position Y along the gauge length of the specimen. X-axis of the figure indicates thetime during the tensile test.
Figure 44 shows the strain rates along the gauge length instead of accumulated strains duringthe tensile test. The figure clearly confirms that there are no Lüders bands forming andpropagating trough the specimen as they should be seen as diagonal lines of higher strainrates in the figure.

59
Figure 44 Strain rate measurement of the reference tensile test conducted for specimen 26 along the gauge length ofthe specimen. The strain rate at each position Y is the calculated mean strain rate along the X-axis (width) of thespecimen. Y-axis of the figure indicates the position Y along the gauge length of the specimen. X-axis of the figureindicates the time during the tensile test.Figure 45 shows the full-field strain measurements at the end of the tensile test, visualizingthe nucleation and propagation of the final fracture. The multiple smaller strain localizationsare also clearly visible in the figure.
Figure 45 Full-field strain measurements of specimen 26 at the time t. Color indicates the level of strain in Y-diretion(eyy).
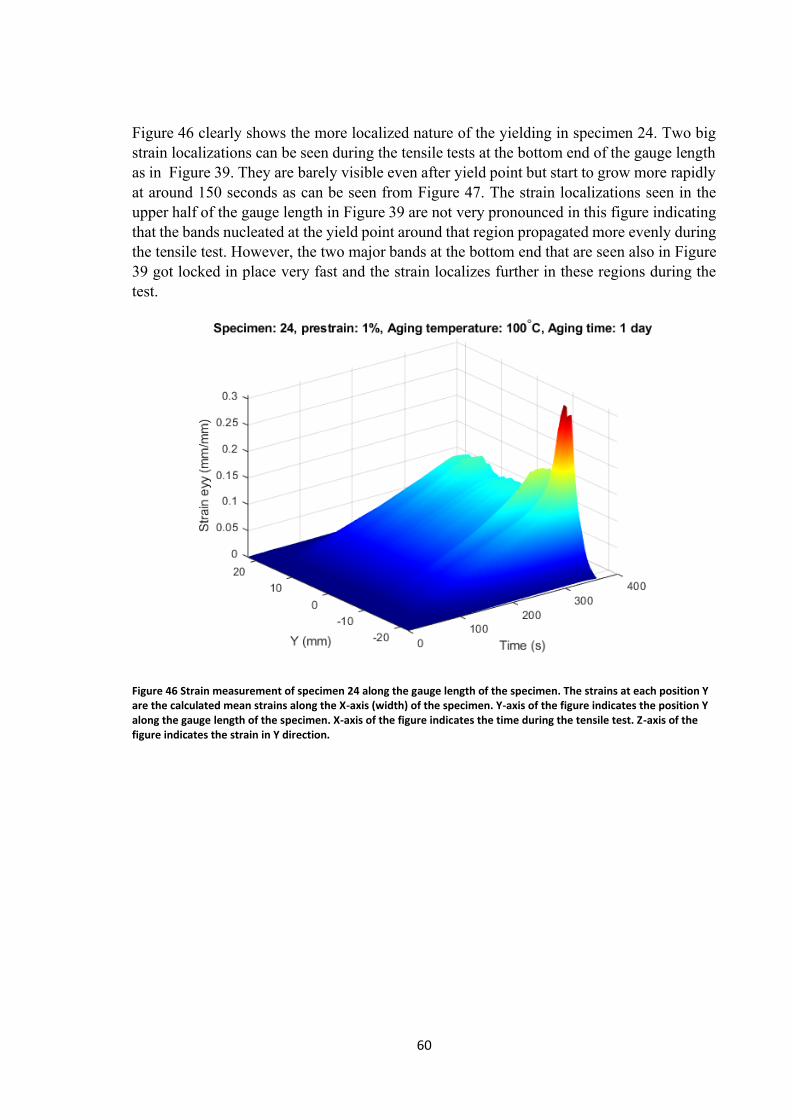
60
Figure 46 clearly shows the more localized nature of the yielding in specimen 24. Two bigstrain localizations can be seen during the tensile tests at the bottom end of the gauge lengthas in Figure 39. They are barely visible even after yield point but start to grow more rapidlyat around 150 seconds as can be seen from Figure 47. The strain localizations seen in theupper half of the gauge length in Figure 39 are not very pronounced in this figure indicatingthat the bands nucleated at the yield point around that region propagated more evenly duringthe tensile test. However, the two major bands at the bottom end that are seen also in Figure39 got locked in place very fast and the strain localizes further in these regions during thetest.
Figure 46 Strain measurement of specimen 24 along the gauge length of the specimen. The strains at each position Yare the calculated mean strains along the X-axis (width) of the specimen. Y-axis of the figure indicates the position Yalong the gauge length of the specimen. X-axis of the figure indicates the time during the tensile test. Z-axis of thefigure indicates the strain in Y direction.

61
Figure 47 Strain measurement of specimen 24 during the tensile test. The strains at each position Y are the calculatedmean strains along the X-axis (width) of the specimen. Y-axis of the figure indicates the position Y along the gaugelength of the specimen. X-axis of the figure indicates the time during the tensile test. The strain in Y-direction (eyy) isindicated in color.Figure 48 shows the strain rates along the gauge length during the tensile experiment. Thefigure confirms that most of the strain localizations do not propagate through the gaugelength. There is one vague Lüders band that nucleates from the upper part of the specimenand propagates trough the gauge length until it gets stuck to Lüders band/strain localizationat the bottom part of the gauge length.
Figure 48 Strain rate measurements of specimen 24 during the tensile test. The strain rate at each position Y is thecalculated mean strain rate along X-axis of the specimen.

62
Figure 49 shows how the final fracture propagates in specimen 24. It can be clearly seen thatthe crack nucleates at the site where one of the major Lüders bands first nucleated aroundthe yield point and got stuck shortly after the nucleation.
Figure 49 Full field strain measurements of specimen 24 at the time t during the tensile test. Color indicates the levelof strain in Y-diretion (eyy).The yielding behavior in specimen 28 is much different during the tensile test from thespecimen 24. From Figure 50 we can see that the yielding behavior is much more even acrossthe whole gauge length. From Figure 51 it can be vaguely seen that the yielding starts frombottom end of the gauge length at the yield point and propagates towards the other end ofthe specimen as was observed in Figure 40. However, after the propagation the yielding isvery uniform across the whole gauge length compared to specimen 24. From Figure 51multiple small strain localizations can be observed after around 150 seconds but strangelythe most prominent strain localizations are not the ones leading to the final fracture.

63
Figure 50 Strain measurement of specimen 28 during the tensile test. The strains at each position Y are the calculatedmean strains along the X-axis (width) of the specimen. Y-axis of the figure indicates the position Y along the gaugelength of the specimen. X-axis of the figure indicates the time during the tensile test. Z-axis of the figure indicates thestrain in Y-direction (eyy).
Figure 51 Strain measurement of specimen 28 during the tensile test. The strains at each position Y are the calculatedmean strains along the X-axis (width) of the specimen. Y-axis of the figure indicates the position Y along the gaugelength of the specimen. X-axis of the figure indicates the time during the tensile test. Color indicates the strain in Y-direction (eyy).
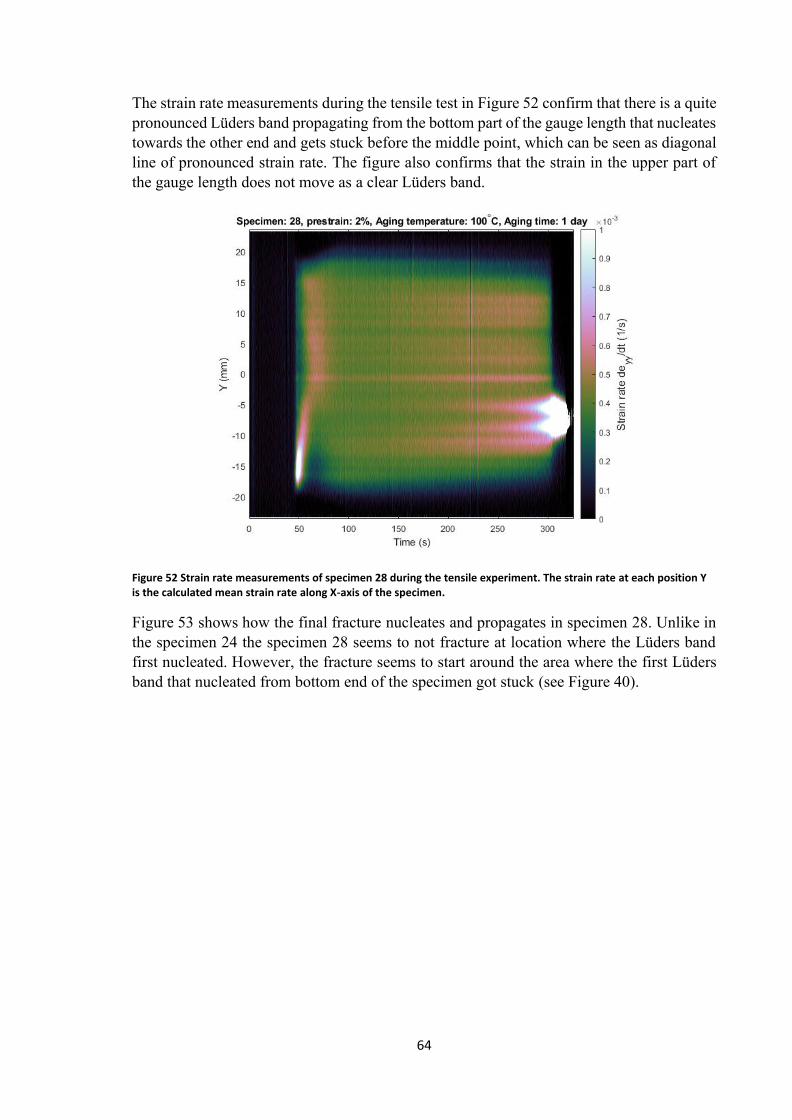
64
The strain rate measurements during the tensile test in Figure 52 confirm that there is a quitepronounced Lüders band propagating from the bottom part of the gauge length that nucleatestowards the other end and gets stuck before the middle point, which can be seen as diagonalline of pronounced strain rate. The figure also confirms that the strain in the upper part ofthe gauge length does not move as a clear Lüders band.
Figure 52 Strain rate measurements of specimen 28 during the tensile experiment. The strain rate at each position Yis the calculated mean strain rate along X-axis of the specimen.Figure 53 shows how the final fracture nucleates and propagates in specimen 28. Unlike inthe specimen 24 the specimen 28 seems to not fracture at location where the Lüders bandfirst nucleated. However, the fracture seems to start around the area where the first Lüdersband that nucleated from bottom end of the specimen got stuck (see Figure 40).
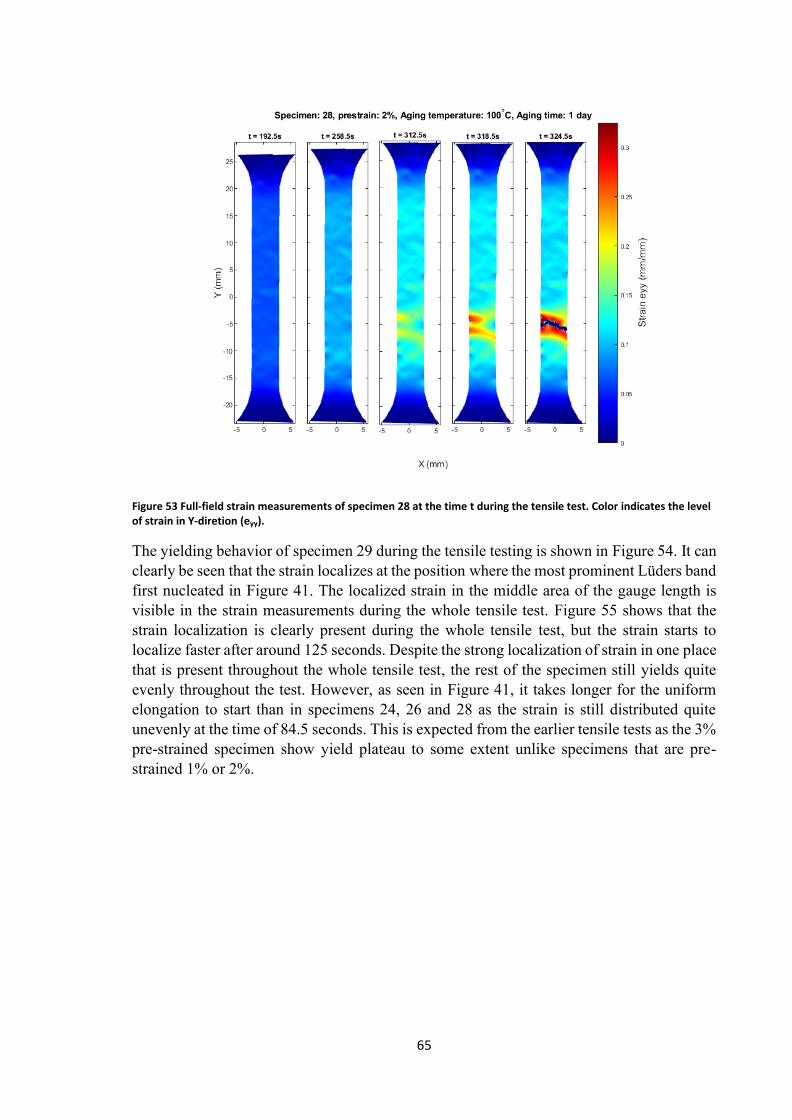
65
Figure 53 Full-field strain measurements of specimen 28 at the time t during the tensile test. Color indicates the levelof strain in Y-diretion (eyy).The yielding behavior of specimen 29 during the tensile testing is shown in Figure 54. It canclearly be seen that the strain localizes at the position where the most prominent Lüders bandfirst nucleated in Figure 41. The localized strain in the middle area of the gauge length isvisible in the strain measurements during the whole tensile test. Figure 55 shows that thestrain localization is clearly present during the whole tensile test, but the strain starts tolocalize faster after around 125 seconds. Despite the strong localization of strain in one placethat is present throughout the whole tensile test, the rest of the specimen still yields quiteevenly throughout the test. However, as seen in Figure 41, it takes longer for the uniformelongation to start than in specimens 24, 26 and 28 as the strain is still distributed quiteunevenly at the time of 84.5 seconds. This is expected from the earlier tensile tests as the 3%pre-strained specimen show yield plateau to some extent unlike specimens that are pre-strained 1% or 2%.
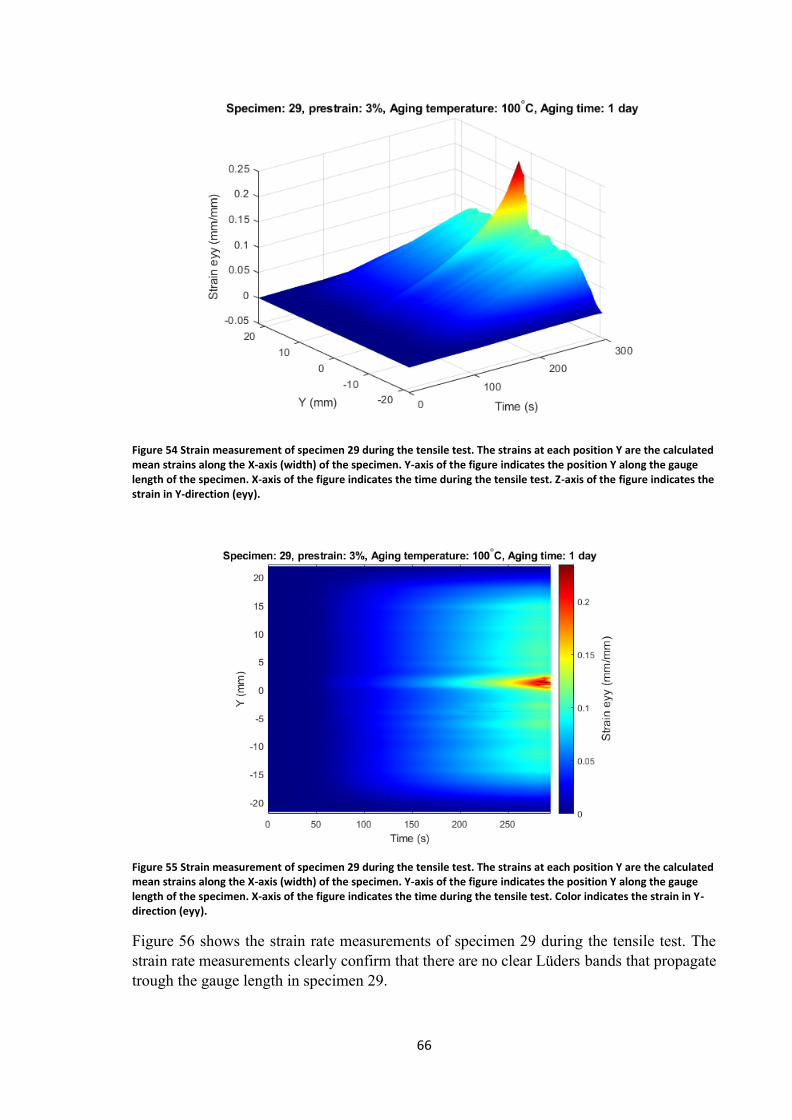
66
Figure 54 Strain measurement of specimen 29 during the tensile test. The strains at each position Y are the calculatedmean strains along the X-axis (width) of the specimen. Y-axis of the figure indicates the position Y along the gaugelength of the specimen. X-axis of the figure indicates the time during the tensile test. Z-axis of the figure indicates thestrain in Y-direction (eyy).
Figure 55 Strain measurement of specimen 29 during the tensile test. The strains at each position Y are the calculatedmean strains along the X-axis (width) of the specimen. Y-axis of the figure indicates the position Y along the gaugelength of the specimen. X-axis of the figure indicates the time during the tensile test. Color indicates the strain in Y-direction (eyy).Figure 56 shows the strain rate measurements of specimen 29 during the tensile test. Thestrain rate measurements clearly confirm that there are no clear Lüders bands that propagatetrough the gauge length in specimen 29.

67
Figure 56 Strain rate measurements of specimen 28 during the tensile experiment. The strain rate at each position Yis the calculated mean strain rate along X-axis of the specimen. There are no clear diagonal lines of increased strainrate which indicate the absence typical Lüders bands that propagate trough the gauge length as front.Figure 57 shows the strain measurements at the end of the tensile test in specimen 29. Thecrack nucleates in the site where the most prominent Lüders band nucleated at the start ofyielding. The other Lüders bands in the vicinity of the most prominent one can also be seenas smaller strain localizations at the time of fracture.
Figure 57 Full-field strain measurements of specimen 29 at the time t during the tensile test. Color indicates the levelof strain in Y-diretion (eyy).

68
4.3 MicrostructureA sample from specimens 1 and 11 was prepared for microstructural analysis. The specimens1 and 11 are from the opposing extremes of the block from which the specimens weremanufactured regarding radial distance of the specimen from the middle of the cast. Thedistance between the specimens in the cast is about 33 mm. The microstructure of thespecimen 1 can be seen from Figure 58. The microstructure is well in line with previousexaminations from literature [12] and fulfills the requirement of graphite nodules being atleast 80% of forms V and VI according to standard EN ISO 945. However, a more generallook at the microstructure with lower magnification reveals the very inhomogeneous natureof the material with the graphite nodule density and size varying remarkably within onesmall sample. The inhomogeneous microstructure can be seen from Figure 59. Specimen 11seems to have notably bigger nodule size than specimen 1 and has also clearly morehomogeneous graphite nodule distribution and size. Specimen 11 microstructure can be seenfrom Figure 60 and Figure 61. It should be noted that specimen 1 is unaged specimen andspecimen 11 is aged in 300 ℃ for 1 day. The more homogeneous graphite nodule distributionand larger graphite nodule size might be partly due to the diffusion of graphite during theaging process. However, the temperature of 300 ℃ is still relatively low when consideringthe microstructure and is expected to have very small effect on the graphite noduledistribution and size.
Figure 58 Micrograph from specimen 1 showing typical microstructure for the cast iron insert.

69
Figure 59 Micrograph from specimen 1 showing the inhomogeneous nature of the material.
Figure 60 Micrograph from specimen 11.
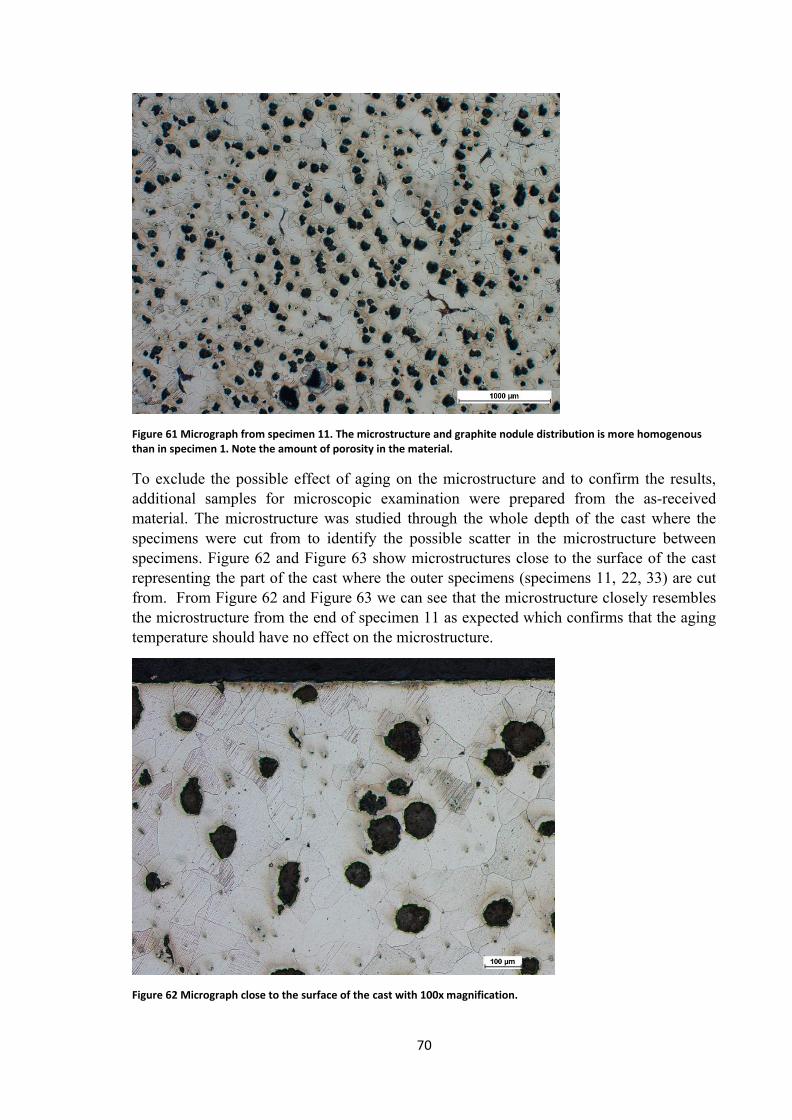
70
Figure 61 Micrograph from specimen 11. The microstructure and graphite nodule distribution is more homogenousthan in specimen 1. Note the amount of porosity in the material.To exclude the possible effect of aging on the microstructure and to confirm the results,additional samples for microscopic examination were prepared from the as-receivedmaterial. The microstructure was studied through the whole depth of the cast where thespecimens were cut from to identify the possible scatter in the microstructure betweenspecimens. Figure 62 and Figure 63 show microstructures close to the surface of the castrepresenting the part of the cast where the outer specimens (specimens 11, 22, 33) are cutfrom. From Figure 62 and Figure 63 we can see that the microstructure closely resemblesthe microstructure from the end of specimen 11 as expected which confirms that the agingtemperature should have no effect on the microstructure.
Figure 62 Micrograph close to the surface of the cast with 100x magnification.

71
Figure 63 Micrograph from close to the surface of the cast with 25x magnification.Figure 64 and Figure 65 show microstructure which correspond to the specimens that are cutfurthest away from the surface (specimens 1, 12, 23). The microstructure in Figure 64 is verysimilar to the microstructure from the specimen 1 seen in Figure 58 as expected. However,the lower magnification image in Figure 65 looks more homogeneous than themicrostructure in Figure 59 regarding the size and distribution of the graphite nodules. Thisconfirms that there is natural scatter in the material.
Figure 64 Micrograph from part of the cast corresponding to the specimens cut furthest from the surface with 100xmagnification.

72
Figure 65 Micrograph from part of the cast corresponding to the specimens cut furthest from the surface with 25xmagnifications.4.4 Casting defects and crack initiationIn some specimens the low pre-strain values were already enough to detect some smalllocalization of deformation and in some specimens even visible cracking initiated during thepre-straining. There was also visible pores or cavities in several specimen surfaces after thespecimens were ground. In specimen 18 visible crack was observed before the final tensiletest. A macro photograph of the crack can be seen in Figure 66. In specimen 22 there weresome pores or cavities visible in the surface of the specimen and some visible deformationcould be observed as seen in Figure 67. Specimens 11 and 21 also had some visible pores.Example of visible pores in specimen 11 can be seen in Figure 68. The differences in thecolors of the specimens are due to the different temperatures they were aged at. Specimen18 was aged at 200 ℃ while specimen 22 was aged at 400 ℃. The specimen 11 was not yetpre-strained nor aged when taking the picture.

73
Figure 66 Visible crack on the surface of the specimen 18 after the 3 % pre-straining.
Figure 67 Visible deformation and pores on the surface of specimen 22 after 3 % pre-straining.
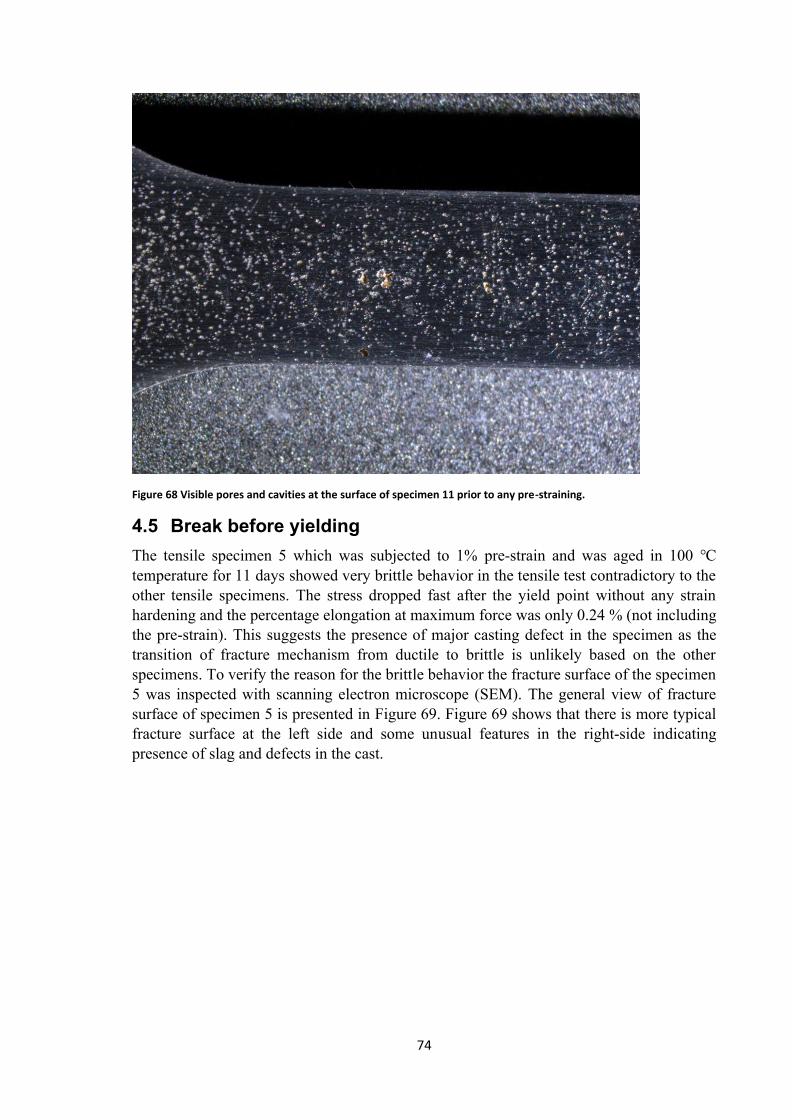
74
Figure 68 Visible pores and cavities at the surface of specimen 11 prior to any pre-straining.4.5 Break before yieldingThe tensile specimen 5 which was subjected to 1% pre-strain and was aged in 100 ℃temperature for 11 days showed very brittle behavior in the tensile test contradictory to theother tensile specimens. The stress dropped fast after the yield point without any strainhardening and the percentage elongation at maximum force was only 0.24 % (not includingthe pre-strain). This suggests the presence of major casting defect in the specimen as thetransition of fracture mechanism from ductile to brittle is unlikely based on the otherspecimens. To verify the reason for the brittle behavior the fracture surface of the specimen5 was inspected with scanning electron microscope (SEM). The general view of fracturesurface of specimen 5 is presented in Figure 69. Figure 69 shows that there is more typicalfracture surface at the left side and some unusual features in the right-side indicatingpresence of slag and defects in the cast.

75
Figure 69 Fracture surface of specimen 5 showing typical ductile fracture in the left. Right side shows some unusualfeatures indicating impurities and defects in the cast.Figure 70 shows the fracture surface more closely from the left side of the surface shown inFigure 69. Figure 70 clearly confirms that the fracture mechanism is fully ductile a s there isclear cavities around the graphite nodules and dimple pattern in the ferritic matrix.
Figure 70 Fracture surface of specimen 5. a) general view showing cavities around graphite nodules and b) showingdimple pattern in the ferritic matrixFigure 71 shows closer view of the unusual parts of the fracture surface. There is clearlysome indication and features pointing towards ductile fracture but also areas that are clearly
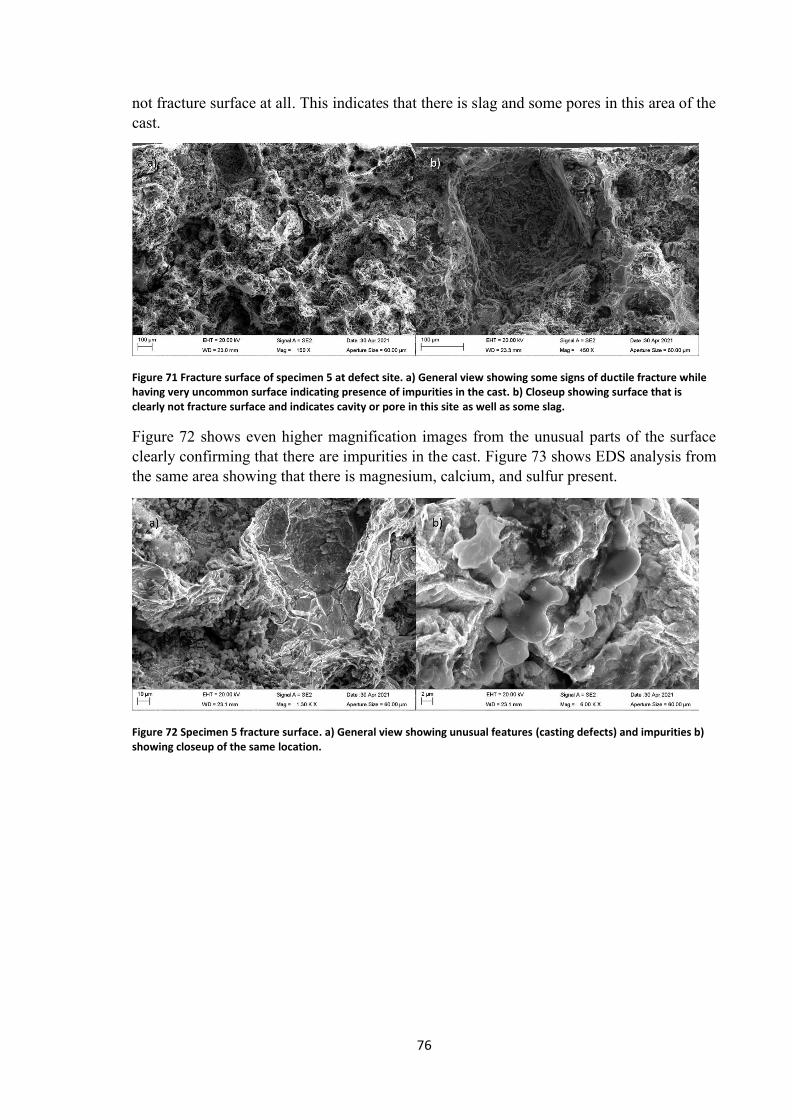
76
not fracture surface at all. This indicates that there is slag and some pores in this area of thecast.
Figure 71 Fracture surface of specimen 5 at defect site. a) General view showing some signs of ductile fracture whilehaving very uncommon surface indicating presence of impurities in the cast. b) Closeup showing surface that isclearly not fracture surface and indicates cavity or pore in this site as well as some slag.Figure 72 shows even higher magnification images from the unusual parts of the surfaceclearly confirming that there are impurities in the cast. Figure 73 shows EDS analysis fromthe same area showing that there is magnesium, calcium, and sulfur present.
Figure 72 Specimen 5 fracture surface. a) General view showing unusual features (casting defects) and impurities b)showing closeup of the same location.

77
Figure 73 EDS analysis of impurities from specimen 5 fracture surface indicating presence of Mg, Ca and S.Few other specimens in addition to specimen 5 were also studied with SEM to identify if thestrain aging has some effect on the fracture mechanism and to identify reason for differentyielding behaviors. The studied specimens were specimen 1 specimen 22 and specimen 29.Specimen 1 is the as received material, specimen 22 was pre-strained for 3% and aged at400 ℃ for 1 day and showed low uniform elongation of 3.8 %. Specimen 29 is the 3% pre-strained specimen aged in 100 ℃ for 1 day that was studied with DIC and showed fastlocalization of strains at the onset of yielding.Figure 74 shows the fracture surface of the specimen 1. The fracture surface show largecavities in the ferritic matrix around the graphite nodules as well as dimple pattern in theferritic ligaments which are typical for fully ductile fracture. The specimen fracture surfaceis homogeneous not showing presence of any major defects or impurities.
Figure 74 Fracture surface of specimen 1. a) General view of the fracture surface showing large cavities around thegraphite nodules. b) Closeup from another part of the fracture surface showing small dimples in the ferritic ligamentFigure 75 shows the fracture surface of the specimen 22 from area that represents majorityof the fracture surface. Like in specimen 1 there are clear cavities around the graphite nodulesas well as dimple pattern in the ferrite. The fracture mechanism is fully ductile. However,the fracture surface of 22 is not as homogeneous as the fracture surface of the specimens 1which indicates presence of some impurities in the cast. Figure 76 shows the fracture surfaceof specimen 22 in location where there is clear defect in the cast. The closeup shows very

78
smooth surface that is clearly not part of the actual fracture surface and indicates a presenceof cavity or pore in this region. The presence of casting defects and impurities explain thelower elongation in this specimen.
Figure 75 Fracture surface of specimen 22. a) General view of the fracture surface. b) Closeup of at the same positionshowing dimple pattern in the ferritic ligaments.
Figure 76 Fracture surface of specimen 22 at defect site. a) General view of defect site. b) Closeup of the defectshowing very smooth surface indicating a presence of cavity or pore in this location.Figure 77 shows part of fracture surface of the specimen 29. The fracture surface showssimilar features to the other samples and the fracture mechanism is clearly ductile. There aresmall white spots present in the figure which indicate presence of some impurities in thecast. Figure 78 shows different part of the fracture surface of the specimen 29. There isclearly some casting defects and impurities present at this location. These may partly explainthe fast localization of strain in this specimen.
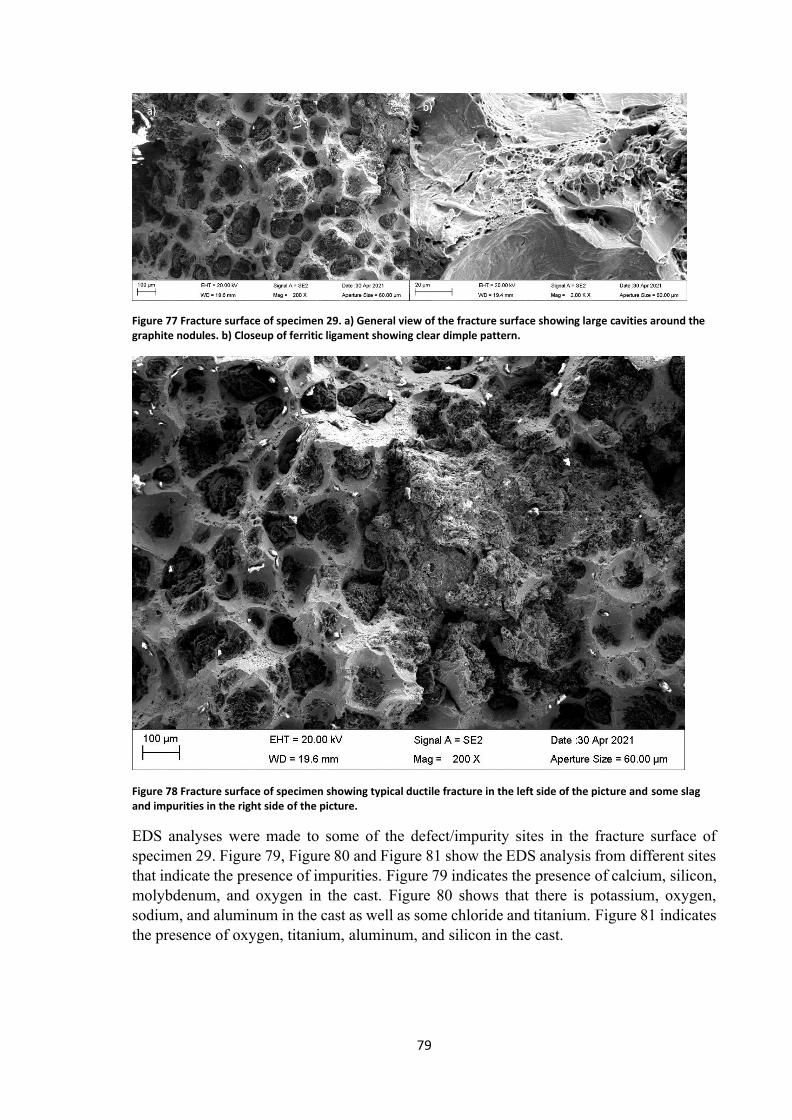
79
Figure 77 Fracture surface of specimen 29. a) General view of the fracture surface showing large cavities around thegraphite nodules. b) Closeup of ferritic ligament showing clear dimple pattern.
Figure 78 Fracture surface of specimen showing typical ductile fracture in the left side of the picture and some slagand impurities in the right side of the picture.EDS analyses were made to some of the defect/impurity sites in the fracture surface ofspecimen 29. Figure 79, Figure 80 and Figure 81 show the EDS analysis from different sitesthat indicate the presence of impurities. Figure 79 indicates the presence of calcium, silicon,molybdenum, and oxygen in the cast. Figure 80 shows that there is potassium, oxygen,sodium, and aluminum in the cast as well as some chloride and titanium. Figure 81 indicatesthe presence of oxygen, titanium, aluminum, and silicon in the cast.

80
Figure 79 Specimen 29 EDS analysis indicating presence of Si, Ca, Mo and O in the cast.
Figure 80 Specimen 29 EDS analysis indicating presence of K, O, Na, Si, and Al. The EDS analysis also gives small peaksfor Ti and Cl.
Figure 81 Specimen 29 EDS analysis indicating some O, Ti, Al and Si in the cast.
81
5 DiscussionThis study clearly shows the inhomogeneous nature of the studied material. Due to unevencooling of the cast and different casting defects present in the cast the specimens show quitedifferent behavior when approaching the limits of the material. The non-homogeneousmicrostructure is also easily observed from the micrographs presented in this work.However, it is interesting to note that even with the presence of casting defects and scatterin the microstructure the yielding behavior is very predictable up to a certain point. Evenafter the strain aging the yield behavior is very predictable until the material suddenlyfractures. This confirms that the graphite nodule size and distribution does not have animpact on the process of static strain aging and the static strain aging process is clearly aprocess that occurs in the ferritic matrix due to the interstitial solutes diffusing into the newlyformed dislocations.The aging process seems to be similar in the temperature range between 100 ℃ and 200 ℃.The fact that there is no clearly observable difference in the yielding behavior betweenspecimens aged at 100 ℃ and specimens aged at 200 ℃ regardless of the aging time, whilethere is a small observable difference in samples aged at 200 ℃ and 300 ℃ which becomesmore pronounced at the temperature of 400 ℃, suggests that the aging process changes atthe higher temperatures of 300 ℃ and 400℃. Due to this the data from the highertemperature tests is likely not applicable to the conditions the insert is subjected to in therepository. It should also be noted that the results shows that the increase in yield strength islower in the specimens that are aged in 200 ℃ for 11 days than in the specimens aged in 200℃ only for 1 day indicating possible over-aging. However, the difference is very small anddue to the small sample size, it is statistically insignificant and could be attributed tomeasurement error and scatter in the material properties. Whether similar aging to the highertemperature specimens aged at 300 ℃ and 400 ℃ could occur in lower temperatures of 200℃, 100 ℃ or even lower for aging times longer than 11 days is not clear and should bestudied further.The yield stress increase produced by the aging gets larger as the pre-strain is increased forall the specimens except for the specimens that are aged in 400℃ for 1 day. This is somewhatcontradictory with some of the reports found in literature regarding steels where the stressproduced by aging is usually negatively correlated with increasing pre-strain. (See chapter:2.3.3 The role of strain in strain aging).All the strain aged samples show remarkable increase in the yield ratio (YS/UTS). In general,a good engineering practice is not to use material with yield ratio over 0.8. The yield ratio inthe reference tensile test is around 0.71, but strain aging with all the pre-strains and agingtemperatures raises the yield ratio over 0.8. For pre-strain level of 2% the yield ratio raisesover 0.9 in all the cases except one and for pre-strain level of 3% the yield ratio gets evenhigher and close to 1.The static strain aging lowers the total elongation of the material even when the amount pre-strain is considered in the total elongation. This is probably due the fact that the strainslocalize differently in the strain aged specimens than in the as received specimen. The DICresults show that there seems to be multiple distinct Lüders bands propagating in the strain
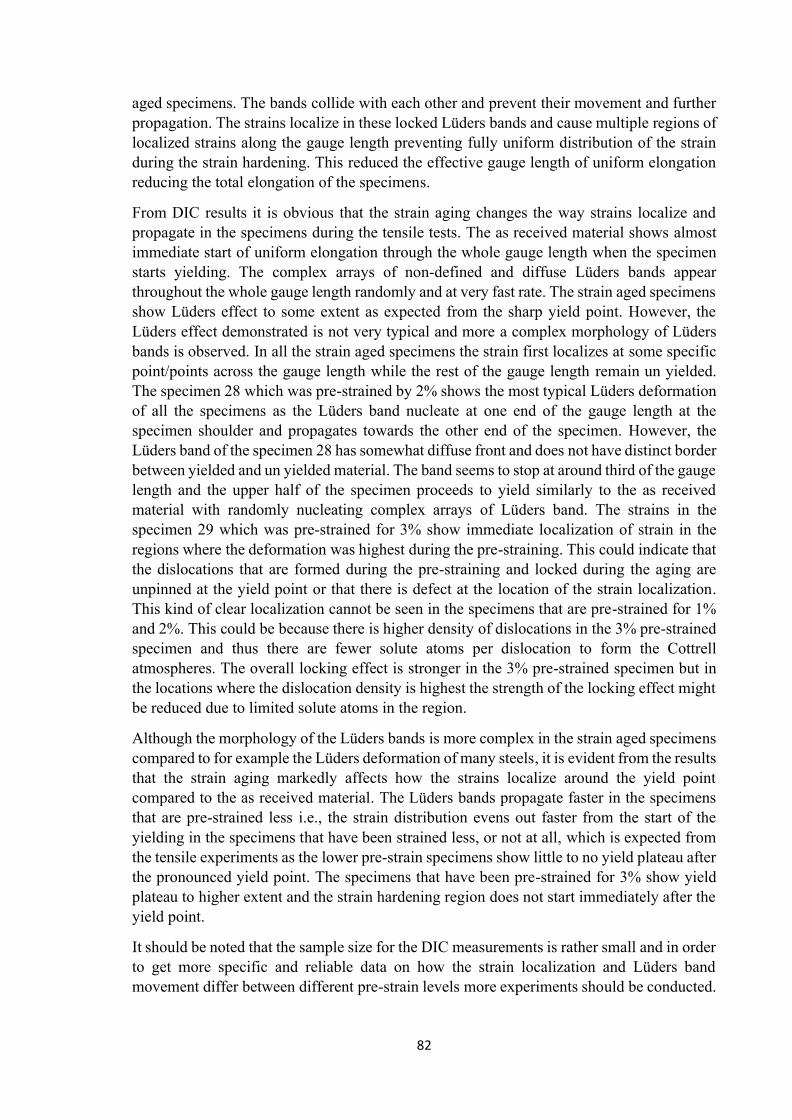
82
aged specimens. The bands collide with each other and prevent their movement and furtherpropagation. The strains localize in these locked Lüders bands and cause multiple regions oflocalized strains along the gauge length preventing fully uniform distribution of the strainduring the strain hardening. This reduced the effective gauge length of uniform elongationreducing the total elongation of the specimens.From DIC results it is obvious that the strain aging changes the way strains localize andpropagate in the specimens during the tensile tests. The as received material shows almostimmediate start of uniform elongation through the whole gauge length when the specimenstarts yielding. The complex arrays of non-defined and diffuse Lüders bands appearthroughout the whole gauge length randomly and at very fast rate. The strain aged specimensshow Lüders effect to some extent as expected from the sharp yield point. However, theLüders effect demonstrated is not very typical and more a complex morphology of Lüdersbands is observed. In all the strain aged specimens the strain first localizes at some specificpoint/points across the gauge length while the rest of the gauge length remain un yielded.The specimen 28 which was pre-strained by 2% shows the most typical Lüders deformationof all the specimens as the Lüders band nucleate at one end of the gauge length at thespecimen shoulder and propagates towards the other end of the specimen. However, theLüders band of the specimen 28 has somewhat diffuse front and does not have distinct borderbetween yielded and un yielded material. The band seems to stop at around third of the gaugelength and the upper half of the specimen proceeds to yield similarly to the as receivedmaterial with randomly nucleating complex arrays of Lüders band. The strains in thespecimen 29 which was pre-strained for 3% show immediate localization of strain in theregions where the deformation was highest during the pre-straining. This could indicate thatthe dislocations that are formed during the pre-straining and locked during the aging areunpinned at the yield point or that there is defect at the location of the strain localization.This kind of clear localization cannot be seen in the specimens that are pre-strained for 1%and 2%. This could be because there is higher density of dislocations in the 3% pre-strainedspecimen and thus there are fewer solute atoms per dislocation to form the Cottrellatmospheres. The overall locking effect is stronger in the 3% pre-strained specimen but inthe locations where the dislocation density is highest the strength of the locking effect mightbe reduced due to limited solute atoms in the region.Although the morphology of the Lüders bands is more complex in the strain aged specimenscompared to for example the Lüders deformation of many steels, it is evident from the resultsthat the strain aging markedly affects how the strains localize around the yield pointcompared to the as received material. The Lüders bands propagate faster in the specimensthat are pre-strained less i.e., the strain distribution evens out faster from the start of theyielding in the specimens that have been strained less, or not at all, which is expected fromthe tensile experiments as the lower pre-strain specimens show little to no yield plateau afterthe pronounced yield point. The specimens that have been pre-strained for 3% show yieldplateau to higher extent and the strain hardening region does not start immediately after theyield point.It should be noted that the sample size for the DIC measurements is rather small and in orderto get more specific and reliable data on how the strain localization and Lüders bandmovement differ between different pre-strain levels more experiments should be conducted.

83
This is especially true for the studied material as there is casting defects and natural scatterin the microstructure, which will probably have significant impact on the strain fields. Therealso remains the question regarding the repeatability of the DIC measurements as the specklepattern is always slightly different when applied with spray paint. This makes repeated testsmore important. It seems like the spray paint gives quite reliable results, but it would alwaysbe better to develop entirely repeatable patterning method to get more reliable data.Despite the observed hardening and embrittlement of the material due to static strain agingthe fracture mechanism does not change. All the fracture surfaces that were examined in thisthesis showed signs of typical ductile fracture despite the strain aging. Even the specimenthat fractured before yielding showed signs of ductile fracture.The pre-strain levels used for this study are in line with the possible strains that the canisterinsert might be imposed to in the repository conditions due to rock shear movement.Although the higher pre-strains of 2% and 3% are very pessimistic and not likely to occur inpractice. It is also demonstrated that static strain aging does not occur without externalyielding in the cast iron insert at 100 ℃ and 200℃ temperatures. This means that the canisterwould need to be subjected to two rock shear movement that cause yielding for static strainaging to have impact on the mechanical properties during the rock shear movement. This isvery unlikely. Additionally, all the strain aged specimens except for one (specimen 5) fulfillthe minimum ductility requirement of 3% plastic strain. This means that even if two rockshear movements would occur for the same canister, the canister is likely to survive themwithout failing, despite the static strain aging occurring after the first rock shear movement.However, as demonstrated in this work, although unlikely, it is possible that the materialbreaks before yielding after SSA has occurred. This is probably due to the contribution ofcasting defects and impurities in the cast together with the static strain aging effect. However,global failure in the insert would be very unlikely because of casting defects and strain aging.In this study it was demonstrated that even small plastic deformation of around 1% causesmarked strain aging effect on the material even with moderate temperatures and moderateaging times. Static strain aging occurs readily already at room temperature for the studiedmaterial. These findings are important as they confirm that SSA is likely to occur to somedegree in the repository conditions and the effects of strain aging on the cast iron insertshould be considered further. It is especially important to consider the possible synergisticeffects of other possible embrittlement mechanism such as hydrogen embrittlement thatcould work synergistically with strain aging and cause the insert to become very brittle. Theeffect of static strain aging and hydrogen embrittlement seem to be very different, and theyseem to affect the material through very different mechanisms. Unlike static strain aging,introducing hydrogen to the material will not cause yield point phenomenon to occur.Additionally, it has been demonstrated that the insert material will break by brittle cleavagefracture when loaded with hydrogen (see section: “2.4.1 Hydrogen embrittlement”) unlikethe SSA specimens. However, these phenomena manifest somewhat similarly reducing thetotal elongation of the material and the synergistic effect of strain aging and hydrogenembrittlement could be dramatic due to the different mechanism affecting the material andthus should be studied.
84
In this study the effect of different strain rate during the strain aging was not considered. Asa result, there remains some question regarding the dynamic strain aging of the cast ironinsert. In the repository conditions the canister can be subjected to wide variety of differentstrain rates due to the long time span and different types of rock movements. This couldresult in dynamic strain aging occurring already at low and moderate temperatures. Therehave been some studies regarding the dynamic strain aging of cast iron, but the strain ratedependency has not been studied yet in this material and whether the DSA occurs already atlower temperatures below 125 ℃ when the stain rate is low enough has not beendemonstrated.

85
6 ConclusionIn this paper the static strain aging in DCI was studied. The main findings are compiledbelow:- The SSA specimens pre-strained for 1%, 2% and 3% all showed pronounced yield pointalthough the as received material yielded smoothly with no pronounced yield point. There isno yield plateau observed in the SSA specimens pre-strained for 1% or 2% but some yieldplateau can be observed in the specimens pre-strained for 3% to some extent.- The stress produced by aging increased as the pre-strain was increased for all the specimensexcept for the specimens that were aged in 400 ℃ for 1 day. In the aforementioned groupthe stress produced by aging decreased slightly when pre-strain was increased.-The strain aging behavior was predictable between all the specimens. The yield strengthand the tensile strength increased when the pre-strain was increased. There was noobservable difference in the yield stress and tensile stress of the specimens when they wereaged in 100 and 200 ℃ for 1 day and 11 days. The formation of Cottrell atmospheres seemsto saturate already at 100 ℃ when aged for 1 day and the longer aging of 11 did not havedifferent effect.-The yield point is clearly less pronounced, and the yield strength increases less when thespecimens are aged in temperatures between 300 and 400 ℃. This indicates that the agingprocess changes, and the Cottrell atmospheres probably partly “evaporate” back to thesolvent matrix reducing the dislocation locking effect.- The fracture mechanism stays ductile in all the specimens despite the level of strain aging.-From the DIC results the SSA specimens show more localized yielding behavior around theyield point compared to the as received material. The as received material starts to yielduniformly with no clear deformation bands while the SSA specimens show nucleation ofLüders bands at the yield point.-The higher pre-strain levels cause the localization of the strains to higher degree. For thepre-strain level of 3% the strain seems to immediately localize to the points that showedmost deformation during the pre-straining process, indicating unlocking of the dislocations.

86
7 References[1] K. Ikonen, “Fuel Temperature in Disposal Canisters Fuel Temperature in DisposalCanisters,” Posiva Working Report 2006-19, Posiva OY, Olkiluoto, Finland, p. 47,2006.[2] S. F. Chen, T. S. Lui, and L. . Chen, “Dynamid Strain Ageing of Ferritic SpheroidalGraphite Cast Iron in the Temperature Range 300K-700K.” 1993 Available:DOI:https://doi.org/10.11279/imono.65.7_535.[3] H. Mouri, M. Hayashi, and W. Wunderlich, “Effect of dynamic strain aging onisothermal (473 ) low cycle fatigue of ferritic ductile cast iron.”Mater. Trans.vol.50. no. 8.pp. 1935–1940. 2009. ISSN:13459678. Available:DOI:10.2320/matertrans.MRA2008482.[4] Posiva and SKB, “Safety functions, performance targets and technical designrequirements for a KBS-3V repository Conclusions and recommendations from ajoint SKB and Posiva working group.,” Posiva SKB Report 01, Eurajoki, Finland, p.120, 2017.[5] P. Eriksson, “Strategy , adaptive design and quality control of bentonite materialsfor a KBS-3 repository,” SKB Technical Report TR-20-03, 2020.[6] H. Raiko, “Canister Design 2012,” Posiva Report 2012-13, Posiva OY, Eurajoki,Finland, p. 156, 2012 ISBN:978-951-652-194-0.[7] T. Siren, “Excavation damage zones , fracture mechanics simulation and in situstrength of migmatitic gneiss and pegmatitic granite at the nuclear waste disposalsite in Olkiluoto , Western Finland,” 2015 ISBN:978-952-60-65-17-5.[8] SKB - Svensk Kärnbränslehantering AB, “Design premises for a KBS-3Vrepository based on results from the safety assessment SR-Can and some subsequentanalyses,” SKB Technical Report TR-09-22, p. 44, 2009.[9] SKB - Svensk Kärnbränslehantering AB, “Long-term Safety for the FinalRepository for Spent Nuclear Fuel at Forsmark,” SKB Technical Report TR-11-01,vol. 2, Stockholm, Sweden, 2011.[10] M. Jonsson and L. Emilsson, “Mechanical design analysis for the canister,” PosivaSKB Report 04, Eurajoki, Finland, p. 147, 2018.[11] J. Pitkänen, “Inspection of Disposal Canisters Components,” Posiva Report 2012-35, Eurajoki, Finland, 2013 ISBN:978-951-652-216-9.[12] H. Raiko, T. Jalonen, L. Nolvi, B. Pastina, J. Pitkänen, and T. Salonen, “CanisterProduction Line 2012: Design, Production and initial state of the canister,” PosivaReport 2012-16, Eurajoki, Finland, p. 174, 2012 ISBN:978-951-652-197-1.[13] Swedish Nuclear Fuel and Waste Management Company (SKB), “Design,production and initial state of the canister,” SKB Technical Report TR-10-14,Stockholm, Sweden, p. 111, 2010.[14] C. F. O. Dahlberg, M. Öberg, and J. Faleskog, “Continuum modeling of nodular castiron using a porous plastic model with pressure-sensitive matrix — Experiments ,
87
model calibration & verification Continuum modeling of nodular cast iron using aporous plastic model with pressure-sensitive matrix — Expe.” 2015 Available:DOI:10.13140/RG.2.1.2426.1840.[15] U. Ronneteg and T. Grybäck, “Non-destructive testing of canister components andwelds Summary,” SKBdoc 1434744, p. 127, 2014 ISBN:5561752014.[16] D. A. Bowman and E. J. Kingston, “DHD residual stress measurements within thecast iron insert of a radioactive waste canister,” Client : POSIVA Report No .: R11-001 – Version 3, 2013.[17] A. Shipsha, “Evaluation of residual stress measurements. Effect of measuredresidual stresses on damage tolerance of cast iron PWR- and BWR-inserts,”Inspecta Technical Report No. 50018390-1, no. 2, Inspecta Technology AB,Stockholm, Sweden, 2015.[18] H. Raiko, H. Rydén, and M. Johansson, “Design analysis report for the canister,”SKB Technical Report TR-10-28, p. 80, 2010.[19] B. Miller and N. Marcos, “Process Report – FEPs and Scenarios for a Spent FuelRepository at Olkiluoto,” Posiva Report 2007-12, Posiva OY, Eurajoki, Finland, p.274, 2007 ISBN:978-951-652-162-9.[20] L. Börgesson, C. Technology, A. B. L. Johannesson, A. B. Heikki, and R. Vtt,“Uneven swelling pressure on the canister simplified load cases derived fromuneven wetting, rock contours and buffer density distribution 1206894,” SKBdoc1206894, p. 27, 2009.[21] L. Börgesson, C. T. Ab, J. Hernelind, and E. Ab, “Earthquake induced rock shearthrough a deposition hole the damage caused to the canister,” SKB Technical ReportTR-06-43, Stockholm, Sweden, p. 42, 2006.[22] P. Dillström and L. Alverlind, “Probabilistic analysis of BWR canister inserts forspent nuclear fuel in the case of,” Inspecta Technical Report No.50014130-1, no. 5,Stockholm, Sweden.[23] P. Minnebo, K. F. Nilsson, and D. Blagoeva, “Tensile, compression and fractureproperties of thick-walled ductile cast oron components.”J. Mater. Eng.Perform.vol. 16. no. 1.pp. 35–45. 2007. ISSN:10599495. Available:DOI:10.1007/s11665-006-9005-z.[24] K.-F. Nilsson, F. Lofaj, M. Burström, C.-G. Andersson, and SKB, “Pressure tests oftwo KBS-3 canister mock-ups,” SKB Technical Report TR-05-18, 2005.[25] K. F. Nilsson, M. Burström, F. Lofaj, and C. G. Andersson, “Failure of spentnuclear fuel canister mock-ups at isostatic pressure.”Eng. Fail. Anal.vol. 14. no.1.pp. 47–62. 2007. ISSN:13506307. Available:DOI:10.1016/j.engfailanal.2006.01.005.[26] K. Ikonen, “Mechanical Analysis of Cylindrical Part of Canisters for Spent NuclearFuel Mechanical Analysis of Cylindrical Part of Canisters for Spent Nuclear Fuel,”Posiva Working Report 2005-12, Posiva OY, Olkiluoto, Finland, 2005.[27] O. Martin, K. F. Nilsson, and N. Jakšić, “Numerical simulation of plastic collapse ofcopper-cast iron canister for spent nuclear fuel.”Eng. Fail. Anal.vol. 16. no. 1.pp.

88
225–241. 2009. ISSN:13506307. Available: DOI:10.1016/j.engfailanal.2008.03.005.[28] J. Hernelind, E. Ab, L. Å. Qa, and J. Sarnet, “Hydrostatic pressure for detailed BWR/ PWR-canisters Abstract Sammanfattning,” SKBdoc 1454226, Stockholm, Sweden,2015.[29] L. Börgesson and J. Hernelind, “Earthquake induced rock shear through a depositionhole - Part 2,” pp. 1–65, 2013.[30] J. Hernelind, “Modelling and analysis of canister and buffer for earthqake inducedrock shear and glacial load,” SKB Technical Report TR-10-34, Stockholm, Sweden,p. 124, 2010.[31] J. Hernelind and E. Ab, “Detailed models for PWR- and BWR-canisters forEarthquake induced rock shearing Abstract,” SKB Public Report SKBdoc 1415152,no. 2, Stockholm, Sweden, p. 193, 2014.[32] P. Dillström, “Damage tolerance analysis of BWR-canister inserts for spent nuclearfuel in the case of an earthquake induced rock shear load – Influence of using moredetailed models,” Inspecta Technical Report No.5000264-1, Stockholm, Sweden, p.44, 2015.[33] K. Ikonen and H. Raiko, “Thermal dimensioning of spent fuel repository,” PosivaWorking Report 2009-69, Eurajoki, Finland, p. 76, 2012.[34] R. E. Smallman and A. H. W. Ngan, Modern Physical Metallurgy. Oxford: ElsevierScience & Technology, 2013.[35] D. Hull and D. J. Bacon, Introduction to Dislocations, 5th ed. Elsevier Science &Technology, 2011 ISBN:9780080966731.[36] R. E. Smallman and A. H. W. Ngan, “7 Diffusion,” in Modern Physical Metallurgy,Elsevier Science & Technology, 2013 ISBN:9780080982236.[37] D. J. B. Hull, Derek, “10 . 5 SOLUTE ATMOSPHERES AND YIELDPHENOMENA,” in Introduction to Dislocations, 5th ed., 2011, pp. 220–227ISBN:9780080966731.[38] A. H. Cottrell and B. A. Bilby, “Dislocation theory of yielding and strain ageing ofiron.”Proc. Phys. Soc. Sect. A.vol. 62. no. 1.pp. 49–62. 1949. ISSN:03701298.Available: DOI:10.1088/0370-1298/62/1/308.[39] H. Bhadeshia and R. Honeycombe, Steels: Microstructure and Properties, 4th ed.Elsevier Science & Technology, 2017 ISBN:9780081002728.[40] I. Codd and N. J. Petch, “Dislocation-locking by carbon, nitrogen and boron in α-iron.”Philos. Mag. A J. Theor. Exp. Appl. Phys.vol. 5. no. 49.pp. 30–42. 1960.ISSN:00318086. Available: DOI:https://doi.org/10.1080/14786436008241198.[41] D. Caillard, “Dynamic strain ageing in iron alloys: The shielding effect ofcarbon.”Acta Mater.vol. 112.pp. 273–284. 2016 Available:DOI:https://doi.org/10.1016/j.actamat.2016.04.018.[42] H. Mouri, W. Wunderlich, and M. Hayashi, “New aspects about reduced LCF-lifetime of spherical ductile cast iron due to dynamic strain aging at intermediatetemperatures.”J. Nucl. Mater.vol. 389. no. 1.pp. 137–141. 2009 Available:

89
DOI:https://doi.org/10.1016/j.jnucmat.2009.01.018.[43] A. Ramazani, S. Bruehl, T. Gerber, W. Bleck, and U. Prahl, “Quantification of bakehardening effect in DP600 and TRIP700 steels.”Mater. Des.vol. 57.pp. 479–486.2014. ISSN:18734197. Available: DOI:10.1016/j.matdes.2014.01.001.[44] T. Waterschoot, A. K. De, S. Vandeputte, and B. C. de Cooman, “Static strain agingphenomena in cold-rolled dual-phase steels.”Metall. Mater. Trans. A Phys. Metall.Mater. Sci.vol. 34. no. 13.pp. 781–791. 2003. ISSN:10735623. Available:DOI:10.1007/s11661-003-1006-z.[45] W. Zhao, M. Chen, S. Chen, and J. Qu, “Static strain aging behavior of an X100pipeline steel.”Mater. Sci. Eng. A.vol. 550.pp. 418–422. 2012. ISSN:09215093.Available: DOI:10.1016/j.msea.2012.04.095.[46] S. Gündüz, “Static strain ageing behaviour of dual phase steels.”Mater. Sci. Eng.A.vol. 486. no. 1–2.pp. 63–71. 2008. ISSN:09215093. Available:DOI:10.1016/j.msea.2007.08.056.[47] T. S. Lui and C. G. Chao, “High-temperature properties of ferritic spheroidalgraphite cast iron.”J. Mater. Sci.vol. 24. no. 7.pp. 2503–2507. 1989.ISSN:00222461. Available: DOI:10.1007/BF01174520.[48] A. K. De, S. Vandeputte, and B. C. De Cooman, “Static strain aging behavior ofultra low carbon bake hardening steel.”Scr. Mater.vol. 41. no. 8.pp. 831–837. 1999Available: DOI:10.1016/S1359-6462(99)00232-8.[49] L. J. Baker, S. R. Daniel, and J. D. Parker, “Metallurgy and processing of ultralowcarbon bake hardening steels.”Mater. Sci. Technol.vol. 18. no. 4.pp. 355–368. 2002.ISSN:02670836. Available: DOI:10.1179/026708302225002452.[50] A. A. Vasilyev, H. C. Lee, and N. L. Kuzmin, “Nature of strain aging stages in bakehardening steel for automotive application.”Mater. Sci. Eng. A.vol. 485. no. 1–2.pp.282–289. 2008. ISSN:09215093. Available: DOI:10.1016/j.msea.2007.07.075.[51] P. Seraj and S. Serajzadeh, “Static Strain Aging Behavior of a Manganese-SiliconSteel After Single and Multi-stage Straining.”J. Mater. Eng. Perform.vol. 25. no.3.pp. 1047–1055. 2016. ISSN:15441024. Available: DOI:10.1007/s11665-016-1906-x.[52] M. Koyama, E. Akiyama, and K. Tsuzaki, “Factors affecting static strain agingunder stress at room temperature in a Fe-Mn-C twinning-induced plasticitysteel.”Tetsu-To-Hagane/Journal Iron Steel Inst. Japan.vol. 100. no. 9.pp. 1123–1131. 2014. ISSN:00211575. Available: DOI:10.2355/tetsutohagane.100.1123.[53] B. R. S. Silva, F. Salvio, and D. S. Santos, “Hydrogen Embrittlement in SuperDuplex Stainless Steel Tubes UNS S32750 Under Mechanical Stress.”Int. Hydrog.Conf. (IHC 2012).no. January.pp. 245–254. 2014 Available:DOI:10.1115/1.860298_ch26.[54] H. Matsunaga, T. Usuda, K. Yanase, and M. Endo, “Ductility loss in ductile castiron with internal hydrogen.”Metall. Mater. Trans. A Phys. Metall. Mater. Sci.vol.45. no. 3.pp. 1315–1326. 2014. ISSN:10735623. Available: DOI:10.1007/s11661-013-2109-9 ISBN:1166101321099.

90
[55] A. Forsström, Y. Yagodzinskyy, and H. Hänninen, “Hydrogen effects onmechanical performance of nodular cast iron.”Corros. Rev. 2019. ISSN:03346005.Available: DOI:10.1515/corrrev-2019-0007.[56] P. Sahiluoma, Y. Yagodzinskyy, A. Forsström, H. Hänninen, and S. Bossuyt,“Hydrogen embrittlement of nodular cast iron.”Mater. Corros.vol. 72. no. 1–2.pp.245–254. 2021. ISSN:15214176. Available: DOI:10.1002/maco.202011682.[57] R. W. Hertzberg, R. P. Vinci, and J. L. Hertzberg, Deformation and fracturemechanics of engineering materials. Hoboken, NJ : Wiley, 2013.[58] P. Olsson et al., “Electron irradiation accelerated Cu-precipitation experiment –Testing of canister insert cast iron and an FeCu model alloy,” SKB Technical ReportR-13-50, p. 18, 2013.[59] L. Brissonneau, A. Barbu, and J. L. Bocquet, “Radiation effects on the mechanicalproperties and long term ageing of spent fuel storage containers,” in The 14thinternational symposium on the packaging and transportation of radioactivematerials. Conference proceedings, 2004.[60] Z. Chang, “Multiscale modelling of radiation-enhanced diffusion phenomena inmetals,” 2015 ISBN:9789175954950.[61] Q. Yang, E. Toijer, and P. Olsson, “Analysis of radiation damage in the KBS-3canister materials,” SKB Techical Report, p. 27, 2019.[62] R. Bigger et al., “A Good Practices Guide for Digital Image Correlation,”International Digital Image Correlation Society, p. 94, 2018 Available:DOI:10.32720/idics/gpg.ed1.

91
8 Appendices8.1 Appendix 1. Speckle patterns used for the DIC experiments
Figure 82 Specimen 24 speckle pattern for pre-straining

92
Figure 83 Specimen 28 speckle pattern for pre-straining

93
Figure 84 Specimen 29 speckle pattern for pre-straining

94
Figure 85 Specimen 26 speckle pattern for tensile test
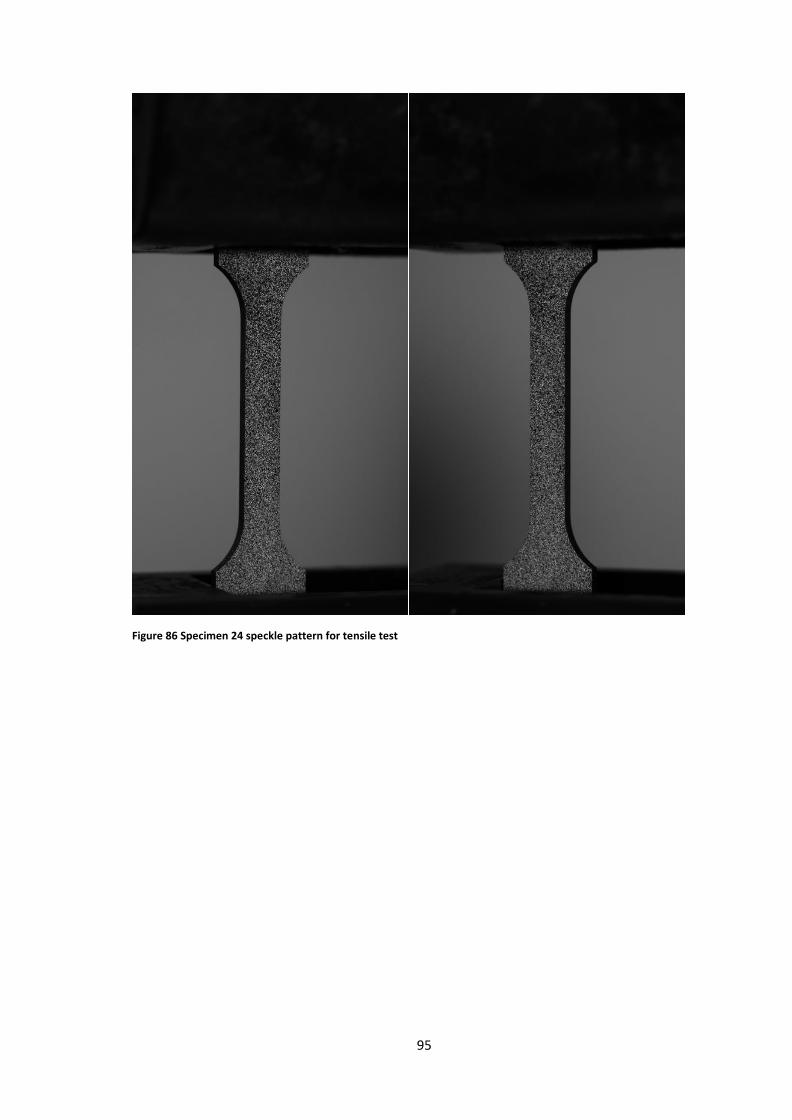
95
Figure 86 Specimen 24 speckle pattern for tensile test

96
Figure 87 Specimen 28 speckle pattern for tensile test
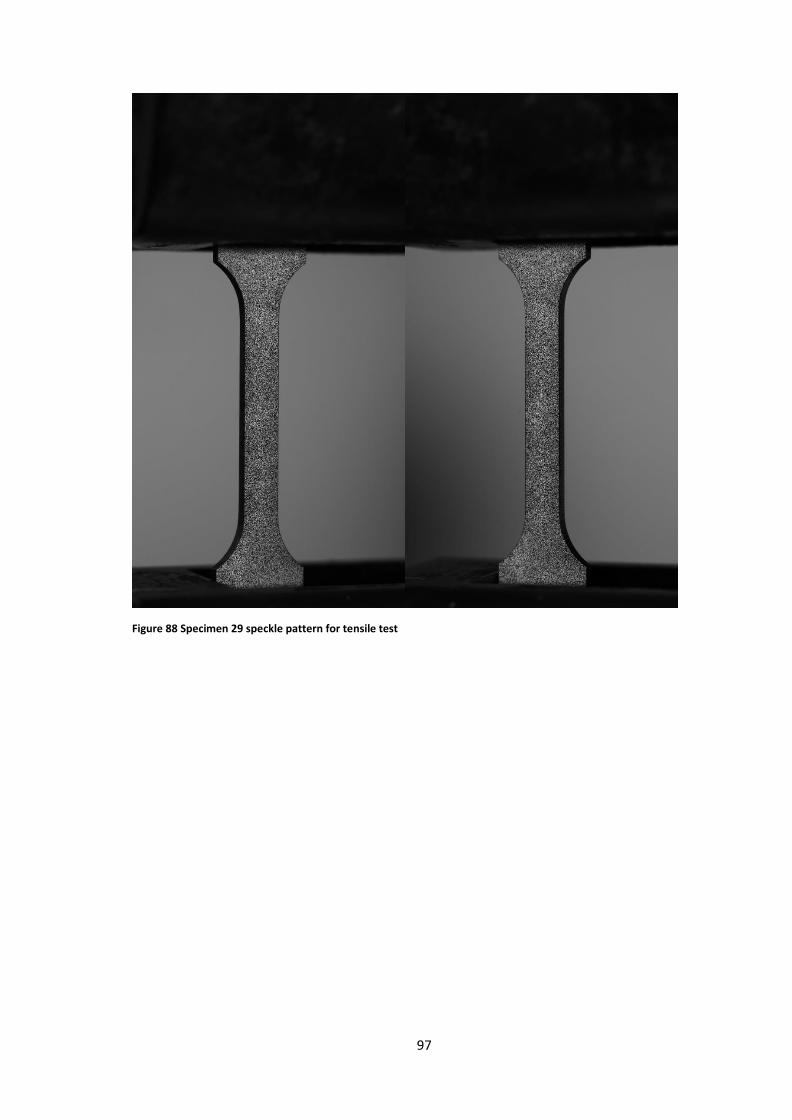
97
Figure 88 Specimen 29 speckle pattern for tensile test