Management practices: Are not for profits...
48
1 Management practices: Are not‐for‐profits different? 1 Josse Delfgaauw (Erasmus University Rotterdam and Tinbergen Institute) 2 Robert Dur (Erasmus University Rotterdam and Tinbergen Institute) Carol Propper (University of Bristol and Imperial College, London) Sarah Smith (University of Bristol) This version – July 2012 Abstract Recent studies have demonstrated the importance of management practices for firm performance. In this paper, we focus on management practices in not‐for‐profits (NFPs) and examine how they compare with those of for‐profits (FPs) in the same industry, both in terms of their quality and their relation with performance. Using a tried and tested survey of management practices, we find that NFPs score lower on the overall management score than FPs, but nevertheless perform as well as FPs in terms of productivity and quality. We find little evidence for systematic differences between NFPs and FPs in how management practices affect performance. Lastly, we present a theory, consistent with our empirical findings, predicting that management quality will be lower in NFPs compared to FPs but that outputs may not be worse if managers are heterogeneous in ability and altruism. Key words: not‐for‐profits, management, impure altruism. JEL‐Codes: H8, J24, J45, L33 1 Thanks are due to the Economic and Social Research Council who provided funding under the grant to the Centre for Market and Public Organisation, to the Nuffield Foundation who provided co-funding for the survey and to Nick Bloom, Rebecca Homkes, John McCormack, Leroy White and the management students for help with setting up and running the survey. We thank the associate editor and three anonymous referees for their helpful comments. All errors are our own. 2 Corresponding author. E-mail: [email protected] . Tel: +31-10-4082902. Fax: +31-10-4089161.
Transcript of Management practices: Are not for profits...

1
Management practices: Are not‐for‐profits different?1
Josse Delfgaauw (Erasmus University Rotterdam and Tinbergen Institute)2
Robert Dur (Erasmus University Rotterdam and Tinbergen Institute)
Carol Propper (University of Bristol and Imperial College, London)
Sarah Smith (University of Bristol)
This version – July 2012
Abstract
Recent studies have demonstrated the importance of management practices for firm
performance. In this paper, we focus on management practices in not‐for‐profits (NFPs) and
examine how they compare with those of for‐profits (FPs) in the same industry, both in terms
of their quality and their relation with performance. Using a tried and tested survey of
management practices, we find that NFPs score lower on the overall management score than
FPs, but nevertheless perform as well as FPs in terms of productivity and quality. We find little
evidence for systematic differences between NFPs and FPs in how management practices affect
performance. Lastly, we present a theory, consistent with our empirical findings, predicting that
management quality will be lower in NFPs compared to FPs but that outputs may not be worse
if managers are heterogeneous in ability and altruism.
Key words: not‐for‐profits, management, impure altruism.
JEL‐Codes: H8, J24, J45, L33
1 Thanks are due to the Economic and Social Research Council who provided funding under the grant to the Centre for Market and Public Organisation, to the Nuffield Foundation who provided co-funding for the survey and to Nick Bloom, Rebecca Homkes, John McCormack, Leroy White and the management students for help with setting up and running the survey. We thank the associate editor and three anonymous referees for their helpful comments. All errors are our own. 2 Corresponding author. E-mail: [email protected]. Tel: +31-10-4082902. Fax: +31-10-4089161.
2
1. Introduction
Economists have long been interested in how managers might use incentive pay to increase
worker output. Recently, interest has focused more broadly on the role of human resource
management and, specifically, on management practices (for an overview see Bloom and Van
Reenen, 2010). It is argued that there are good and bad management practices and there is
growing evidence that differences in managerial practices explain part of the long‐standing
heterogeneity between firms in performance (Bloom and Van Reenen, 2007 and 2010, Black
and Lynch 2001).
Work to date has focused primarily on the for‐profit sector. Less attention has been paid to
management practices in the not‐for‐profit sector or how they compare, both in terms of their
quality and their importance in terms of driving performance, with the for‐profit sector. This
seems important to look at as there are reasons to expect differences between the two sectors.
First, there may be differences in the quality of the people the two sectors can attract for
managerial positions which may impact directly on management quality. Second, there may be
differences in the motivation of managers and workers (and in particular the degree of
altruism) that may affect the importance of management practices for outcomes in the two
sectors. For example, Besley and Ghatak (2005) show that impure altruism in workers leads to
sorting across mission‐ and non‐mission oriented firms and that the use of high‐powered
incentives is less appropriate in mission‐oriented firms. Gregg et al. (2011) present some
empirical evidence that workers in the non‐profit sector are more likely to donate their labour.
Similarly, the presence of impure altruism may mean that management practices do not have
the same bite in the not‐for‐profit sector as in the for‐profit sector.
This is the focus of the present paper. We collect unique survey data to make a direct
comparison of management practices in the not‐for‐profit (NFP) and for‐profit (FP) sectors.
More specifically, we use the management practice instrument developed by Bloom and Van
Reenen (2007) and apply it to two industries in the UK in which NFPs operate widely and
compete with FPs. We compare the management practice scores (which have been assumed in
previous work to capture management quality) across NFPs and FPs in a sample of around 160
3
organisations in the nursing home and fostering/adoption agency industries. We find that NFPs
score lower than FPs on the overall management practice score (although this difference is
small and not statistically significant). We find, however, a significant difference on a key
dimension of management practices – NFPs score lower in terms of use of incentives. When we
look at indicators of outcomes, however, we do not find that NFPs perform worse. In fact, both
in terms of productivity and in terms of quality, NFPs perform slightly better than FPs, although
the differences are not statistically significant.
One possible interpretation of this finding is that “good management” varies across the NFP
and FP sectors – and that a single survey tool cannot be used to measure management quality.
For instance, Francois (2007) argues that firms that are involved in the production of social
services may leave labor uncontracted and unsupervised so as to encourage labor donations by
intrinsically motivated workers. Other studies have pointed to a negative effect of incentive
provision on the social‐status benefits that performing pro‐social tasks may yield (Benabou and
Tirole 2006, Carpenter and Myers 2010). Such concerns may be stronger in NFPs as compared to
FPs, and so NFPs may do better in terms of output despite their more lax management style as
compared to FPs. However, when we look at the relationship between the management
practice scores and outcomes in our data, there is little evidence of systematic differences by
sector. For quality, we find a stronger link between management practice scores and
performance in FPs as compared to NFPs. For productivity, however, the link between
management practice scores and performance is stronger among NFPs. Neither of these
differences in the effects of management quality on outcomes between FPs and NFPs is
statistically significant.
Instead, our preferred interpretation rests on self‐selection of agents with differing managerial
skills and differing altruism into the FP‐ and NFP‐sectors. Integrating key elements from earlier
models developed by Glaeser and Schleifer (2001), Besley and Ghatak (2005), and Benabou and
Tirole (2006), we develop a simple model that is able to explain why differences in management
quality can persist between for‐profit and not‐for‐profit organizations even when they are
competing within the same industry. We show that agents who decide to set up a NFP
4
organization will be drawn from the top of the altruism distribution and the bottom of the
managerial ability distribution. The reason is simple: switching to NFP status imposes a
constraint on the distribution of profits to the agent, which is more costly for high‐ability agents
who achieve higher profits and less costly for highly altruistic agents who enjoy making
donations.
One clear implication from the model, which is consistent with our findings is that, despite the
negative sorting of managerial talent, NFP organizations may not necessarily achieve lower
output (broadly defined) because of the use of retained profits to further the organization's
objectives. This works to increase output and can counterbalance the output effect of lower
managerial ability. The implication is that NFP managers will never be as management savvy,
but that this may matter less in terms of outcomes.3
The paper is organized as follows. The next section describes the organizations in our sample
and the management practices survey, while section 3 presents the main empirical findings.
Section 4 sets out our basic model and presents the key theoretical results. Section 5 concludes
with a discussion of the main findings.
2. Management practices survey
2.1 The organizations
We collected detailed information on management practices from more than 200
fostering/adoption agencies and nursing care homes. These represent the two largest
industries within residential social care in the UK. Both agencies and homes operate in
competitive, market‐driven environments, composed of a mix of FP and NFP organizations that
directly compete against each other either for business from local government children’s
services in the case of fostering agencies or from consumers in the case of care homes.
3 Relatedly, Delfgaauw and Dur (2010) develop a model of self-selection of managers into public and private sector organizations where managers differ in ability and public service motivation. Bandiera et al. (2010) study sorting of managers into family firms and firms with distributed ownership, assuming that the owners of family firms derive utility from exercising power. In contrast to these papers, differences in nonpecuniary utility between organizational forms arise endogenously in our model.

5
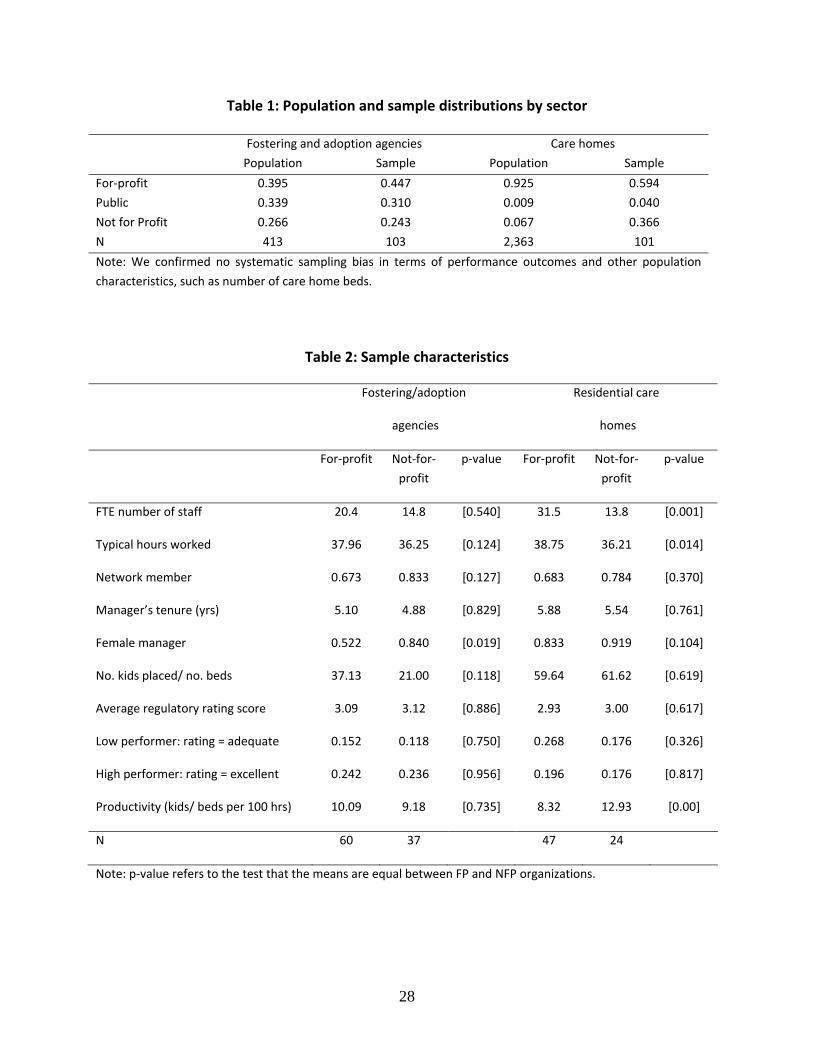
The prevalence of the different sectors (including the public sector) in the two industries is
shown in Table 1 below. Our sampling frame for adoption and fostering agencies was English‐
based members of the British Association of Adoption and Fostering, a trade body that
represents more than 90 per cent of all agencies in the industry. For care homes, we sampled
from the population of residential care homes for the elderly in England with 40 or more beds,
information which is available from the regulator (the Care Quality Commission). The three
sectors – public, FP, and NFP – are fairly equally represented among fostering/adoption
agencies, and this is broadly reflected in our sample, but we focus on FPs and NFPs because
public sector agencies play a different role in that they have primary responsibility for placing
all children in care. Thus while public agencies directly compete with FP and NFP agencies to
recruit carers, they do not compete directly for business in terms of placing children. All three
sectors are also present in the care homes industry and all directly compete for customers, but
there are very few public sector care homes in the population and in our sample. We
deliberately over‐sampled NFP homes in this industry in order to achieve a reasonable sub‐
sample size.
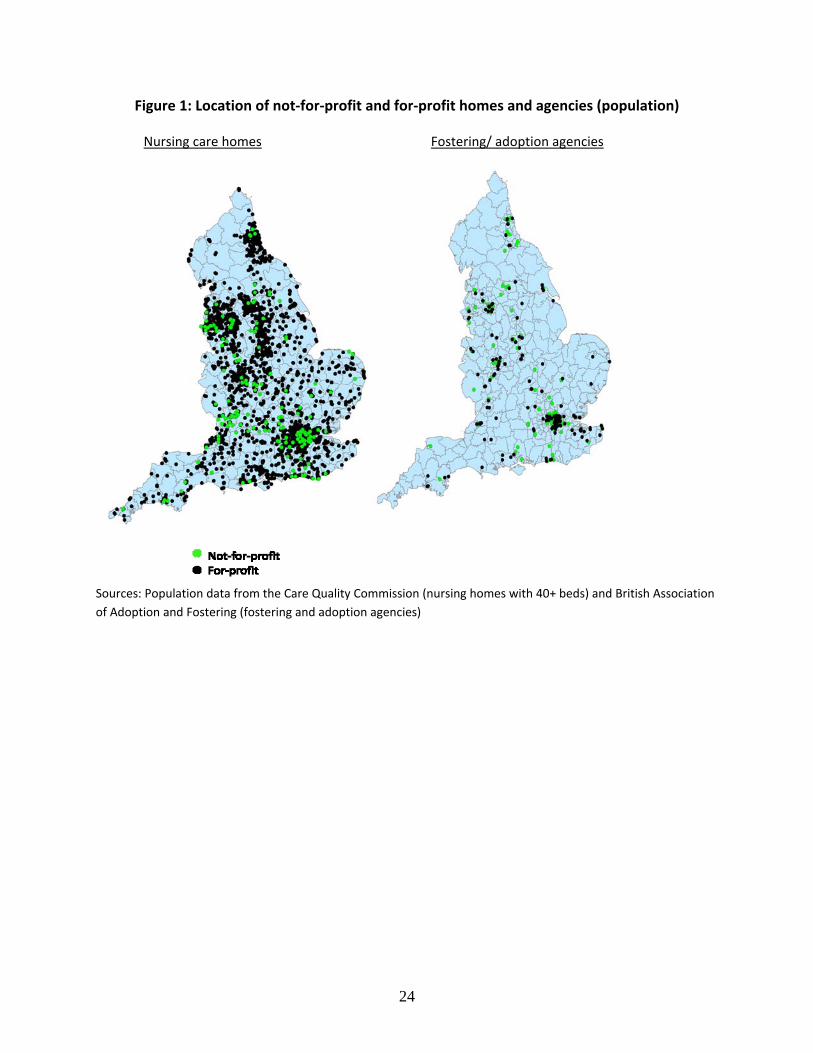
Figure 1 maps the geographical location of the population of fostering agencies and care homes
to show that both FP and NFP providers are evenly distributed across the country. While there
are obvious concentrations of providers coinciding with the areas of high population density, it
is not the case that either provider type is concentrated in a particular location.
Table 2 provides further information on the characteristics of organizations in both industries
(fostering and adoption agencies/ care homes) across the two sectors. Note that most of the
information (with the exception of the number of beds in care homes and the regulatory rating)
was collected as part of the survey. Not‐for‐profit organizations are typically smaller and, in the
case of the care homes, the difference in means is statistically significant at the 5 per cent level.
Typically, workers in the NFP sector work fewer hours. A significantly higher proportion of
managers are female in both not‐for‐profit agencies and homes but the manager’s tenure in
the post is similar in both sectors.
6
2.2 The management practices survey
To measure the quality of management practices we use an existing methodology that has
been used in manufacturing (Bloom and Van Reenen, 2007) and health (Bloom et al., 2010).
Using an existing methodology has a number of advantages. First, the survey has been
extensively tried and tested, successfully being used to survey several thousands of
organizations in more than 20 different countries. Second, following the same methodology
and using a common set of indicators allows us to set our results in a wider context.
At the core of the Bloom and Van Reenen survey is a set of 18 indicators of management
practices, grouped into four subcategories:
Operations – three indicators assessing whether processes are standardized and are
being continuously improved;
Monitoring – five indicators on the extent to which performance is tracked and
monitored within the organization and reviewed and followed with staff members, and
the clarity and comparability of performance within the organization;
Targets – five indicators covering target balance, inter‐connection, horizon, stretch, and
accountability;
Incentives – five indicators assessing the extent to which the organization rewards and
promotes high performers and deals with poor performers and how the organization
retains and attracts talented individuals.
The operations indicators (and related questions) are fairly specific to each industry and
required adaptation from the original survey to fostering/adoption agencies (where we
included two indicators) and care homes (where we included four indicators). The remaining 15
indicators (and associated questions) used to capture monitoring, targets, and incentives are
much more general and could be applied almost identically to fostering/adoption and care
homes as in the earlier studies of manufacturing firms and hospitals. We therefore focus our
analysis on these 15 indicators which are directly comparable with the earlier studies. Finally,
the survey also collects some limited background information on each organization.
7
The full set of indicators and related questions is provided in the Appendix, together with
information on the scoring methodology. From this it should be clear that the survey is not
designed as a simple question‐answer survey. Instead, each indicator has a set of related
questions designed to allow the interviewer to make a reasonable assessment of the quality of
management practices in the organization. This is based on open questions (i.e. “can you tell
me how you promote your employees”) – together with examples – rather than closed
questions (i.e. “do you promote your employees on tenure [yes/no]?”). The prompting
questions (and examples) are designed to allow the interviewer to understand the actual
management practices in the organization. For each indicator, the interviewer reports a score
between 1 and 5, a higher score indicating a better performance. The interviews were
conducted with the managers of homes/agencies (the most common titles were general
manager, care home manager, and team manager).
The majority of the 200 interviews were carried out in Summer 2010 by six MSc management
students from the University of Bristol.4 Training for the interviewers was provided by the
manager from the original London School of Economics management survey team, ensuring
that our responses should be broadly comparable with those for other sectors using the same
methodology. All interviews were independently double‐scored by two interviewers – one
conducting the interview, the other listening in. Any differences in scores were then discussed
and reconciled at the end of the interview. This double‐scoring was to ensure that the
interviews and scoring are comparable across interviewers, although our regression analysis
additionally controls for interviewer fixed effects, as well as the time of day the interviews were
done. Each interview took between 45 – 60 minutes.
To ensure unbiased responses we used a double‐blind survey methodology. Interviews were
conducted by telephone without the respondents being aware in advance that they were being
scored, making it more likely that the interviews genuinely captured actual management
practices. The interviewers were also not told anything about the organization’s performance
4 The response rates towards the end of the survey period were negatively affected by swine flu, which peaked in the last week of July 2010. A top‐up sample of 35 interviews was therefore collected by two LSE students in Spring 2011.
8
(or sector) in advance of the interview and this was derived from independent sources post
interview. Thus interviewers were not scoring in line with their perception of the quality of the
organization.
3. Results
3. 1 Comparison with management practices across industries
The use of a similar survey tool to previous studies with a common set of core indicators allows
us to make some high‐level comparisons between management practice scores across
industries. Using previous work in Bloom and Van Reenen (2007) and Bloom et al. (2010) we
can compare fostering/ adoption agencies and care homes with UK manufacturing firms and UK
hospitals. We focus on the 15 individual indicators that are the most directly comparable across
all the studies (covering monitoring, targets and incentives).
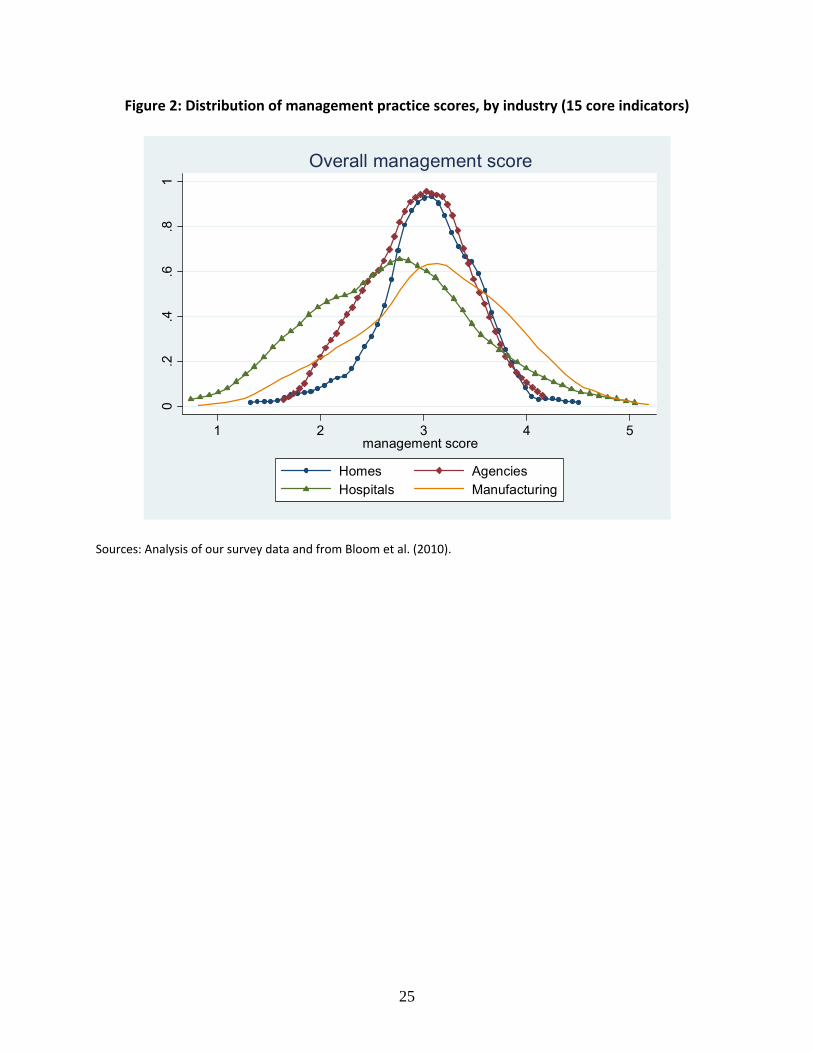
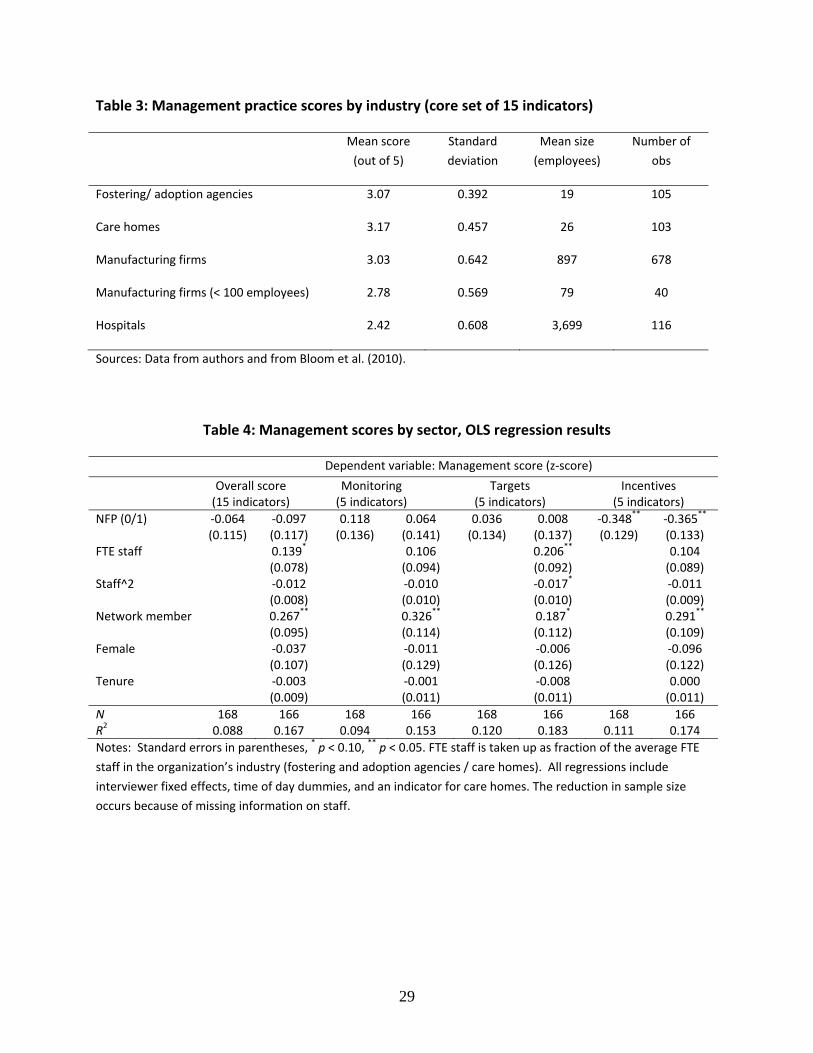
Table 3 provides basic summary statistics, while Figure 2 shows the full distribution of scores for
each industry. Average management practice scores for agencies and homes are slightly higher
than those for the sample of manufacturing firms, and substantially higher than for hospitals.
The distribution of scores for agencies and homes is also much more compressed than that for
both manufacturing firms and hospitals. Looking at Figure 2, there are no agencies and homes
with very low management practice scores; compared to manufacturing firms, there are also no
stellar performers. Three‐quarters of all homes and agencies receive an average management
score between 2.5 and 3.5, compared to 58 per cent of manufacturing firms and half of all
hospitals.
What could explain these differences in management practice scores across industries? We are
confident that the difference is genuine and is not arising because of differences in
methodology. The questions are almost identical to those used in the earlier studies and the
interviewers for our survey were trained in interviewing and scoring by the manager of the LSE
team and additionally did observations on interviews being conducted at the LSE to validate
their scoring methodology.
9
It is clear from Table 3 that the organizations in our survey are much smaller than those in
previous studies (as shown by the average number of employees), although Table 3 also shows
that, at least among manufacturing firms, smaller firms typically score lower.
Another difference is that both the agencies and homes are subject to numerous regulations
defining minimum standards for both processes and outcomes.5 The standards are enforced
through regular inspections and backed by financial penalties and in the worst cases, removal
of registration (for example in the financial year 2008, 30 homes had their registrations
cancelled, while a further 10 received fines). This regulatory regime may help to drive up – or
out – the bottom tail of the distribution. Of course, hospitals are also regulated; a key
difference here may be the differing level of process complexity.
Possibly harder to explain is why there are fewer high scorers among our sample of homes and
agencies; it may suggest that, beyond a certain level, there is little or no return to investing in
management practices in these industries.
3.2 Not‐for‐profit and for‐profit management compared
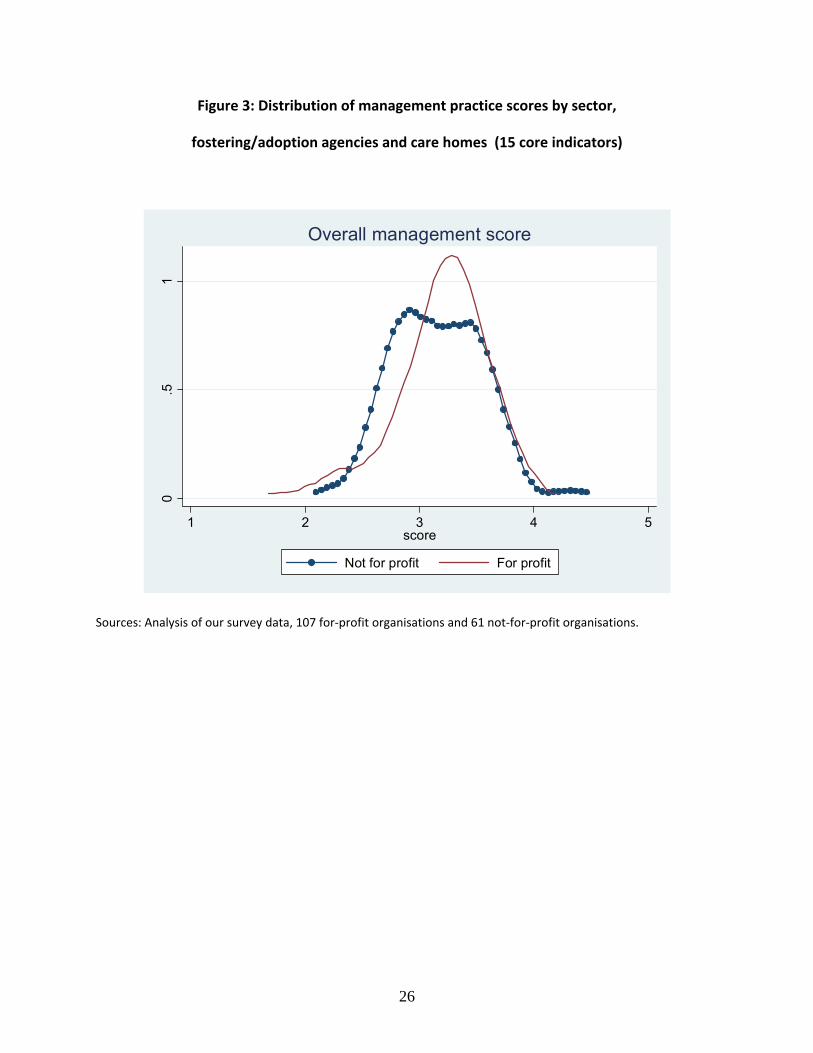
Before turning to regression analysis, where we can control for measurable differences in
organization and manager characteristics, we show the distribution of the overall management
scores for the NFP and FP sectors in Figure 3.6 We use, as above, the 15 indicators which are
consistent with the previous studies.7 The figure shows that the bulk of the FP distribution lies
above that of the NFP profits – more NFPs score in the range 2.5 – 3.0 than FPs firms. However,
FPs are also the worst performers.
To test for significant differences in mean management practice scores across sectors,
conditional on other characteristics, we run simple regressions of the following form:
5 For care homes and agencies these minimum standards cover training of staff and managers, information and records, and facilities and premises. 6 In our analysis of differences between the sectors, we pool observations from care homes and agencies. The advantage of this is that it increases the sample size. We have separately tested for – and rejected – significant differences between the industries. 7 Results with the full 18 indicators are similar.
10
where Mi is the management practices score (overall and for the sub‐groups of indicators),
included as a z‐score, so the differences are measured in standard deviations. For each score,
we include a set of noise controls (X1i), including interviewer fixed effects and time of interview,
and controls for organization and manager characteristics (X2i) as the firms in the two sectors
differ in terms of staffing and size (see Table 2). These control variables include an indicator for
whether or not the manager is female and tenure in post (in years), the number of staff in the
organization (as fraction of the average number of staff in the organization’s industry), and an
indicator for whether the manager reports that the organization is part of a network, which is
also likely to reflect the size of the organization beyond the immediate home/agency. Note that
none of the coefficients on the explanatory variables has a casual interpretation – we are
simply looking at conditional correlations.
Our final sample is not large (107 FPs and 61 NFPs) and, as already shown, there is also not a
large degree of variation in the management scores across organizations (compared to the
earlier manufacturing and hospital studies). Nevertheless, we do find some interesting – and
statistically significant – results, summarized in Table 4.
The first column of the table shows that NFPs score lower than FPs on the overall management
practices score. The difference is small (less than 0.1 of a standard deviation) and is not
statistically significant. NFPs score higher (but not significantly different) on the sub‐groups of
indicators that capture monitoring (i.e. how performance is tracked and monitored within the
organizations and reviewed and followed with staff members) and targets. But they score
significantly lower on the sub‐group of indicators that captures the use of incentives (the extent
to which the organization rewards and promotes high performers and deals with poor
performers and how the organization retains and attracts talented individuals). NFPs have
scores on this indicator which are approximately one third of a standard deviation lower than
FPs.
11
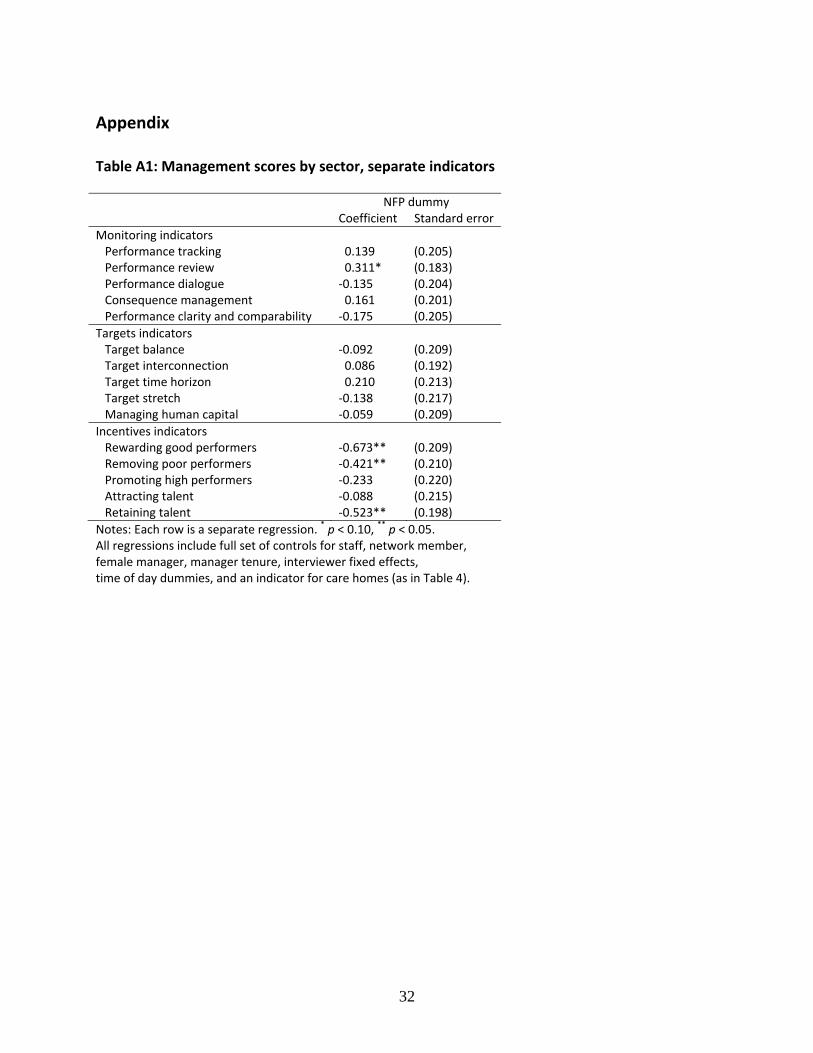
Table A1 in the Appendix gives the difference between NFPs and FPs for each of the 15
indicators of management practices separately. Within the sub‐group of five indicators for
incentives, NFPs score significantly lower on three indicators. These are “rewarding high
performers”, i.e. whether good performance is financially rewarded within the organization,
“retaining talent”, i.e. whether the organization goes out of its way to retain talent, and
“removing poor performers”, i.e. whether and how the organization deals with under‐
performers. There are no significant differences for “promoting high performers” and
“attracting talent”. Within the sub‐groups of indicators for monitoring and targets, we find no
significant differences between FPs and NFPs, except for a marginally significant higher score of
NFPs on monitoring indicator “performance review”.
The results also indicate that there is a correlation between size and management practices.
The scores are typically increasing in size, although the negative coefficient on the squared
term indicates that management practices may begin to deteriorate among very large
organizations.8 Being in a network is associated with a significantly higher score on overall
management practices and for the three sub‐groups of indicators. Again, this is not evidence of
a causal relationship. Better‐managed organizations may grow and/or be accepted into
networks; larger organizations and networks may need stronger management practices in order
to operate effectively.
3.3 Outcomes in not‐for‐profit and for‐profit organizations
In this section, we turn our focus to whether there are differences in the outcomes for NFP and
FP organizations, motivated by an interest in whether management scores have implications for
either the quantity or the quality of outcomes.
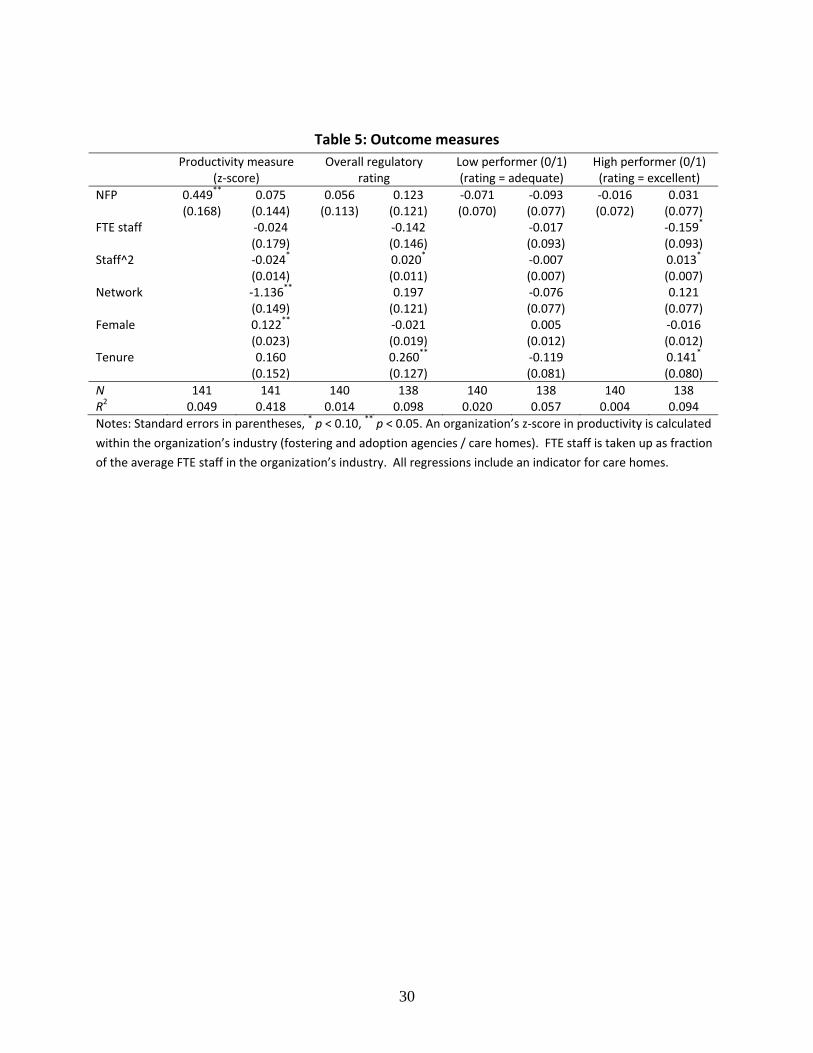
First, we define a measure of productivity based on survey responses. Specifically, we look at
the number of children placed in the last 12 months per 100 staff hours and the number of
occupied beds per 100 staff hours. Note that this information is not available for all
organizations surveyed and this reduces our sample size to 141. As shown in Table 5, according
8 None of our results changes if we drop the squared term in controlling for staff.
12
to this measure, productivity is significantly higher among NFP organizations. However, this is
mostly due to scale effects, as NFPs are relatively small and productivity is higher in smaller
organizations. After controlling for organizational characteristics including size, the difference in
productivity between NFPs and FPs is much smaller and not statistically significant.
Second, we exploit the availability of regulatory ratings information to provide an externally
validated measure of the quality of the organization and its outputs. Both fostering/adoption
agencies and care homes are regularly inspected and given a rating by an independent
regulator.9 One potential issue is that there is little variation in the ratings – both regulators use
a four‐point rating (excellent, good, adequate, inadequate) but nearly 60 per cent of the
population are rated as good and in our sample no organization is rated inadequate. As well as
looking at the overall rating, we also look at two binary measures – being a low performer,
defined as being rated as adequate, and being a high performer, defined as being rated as
excellent. As with productivity, this information is not available for all the organizations
surveyed and this reduces our sample size. Table 5 shows that NFP organizations are typically
rated better than FP organisations (they have a higher average ratings score, they are less likely
to have a poor rating and more likely to be rated outstanding), but the differences are not
statistically significant.
3.4 The relationship between management scores and outcomes
Taken together, the results from the previous two sub‐sections suggest that NFP organizations
perform as well as FP organizations, even though they score lower on their management
practices.
One possible interpretation of this finding is that what is “good” management varies across
sectors. We have applied a single, survey tool that was initially designed to capture
management quality in the FP sector, assuming that it also captures the important dimensions
of good quality management in the NFP sector. However, as we argued in the Introduction, it
9 The Office for Standards in Education (OfSTED) in the case of fostering/adoption agencies and the Care Quality Commission (CQC) in the case of nursing homes.
13
might be that management practices that work well in FPs are less productive or even
counterproductive in NFPs (Francois 2007, Benabou and Tirole 2006, Carpenter and Myers
2010).
To explore this further we look at the relationship between the management scores and
outcomes. A common finding from previous studies of management practices in manufacturing
and (public sector) health care is that the management scores are positively correlated with
external indicators of performance – measures of productivity in the case of manufacturing
(Bloom and Van Reenen, 2007) and mortality rates and regulatory ratings in the case of
hospitals (Bloom et al., 2010). While this is not necessarily a causal relationship (e.g. good
organizations could invest in management practices), it indicates that the management practice
scores “matter” in a meaningful way for performance – whether as a cause or a consequence.
If good management is common across the two sectors, we would expect to see the same
relationship between management scores and outcomes among NFP organizations as among FP
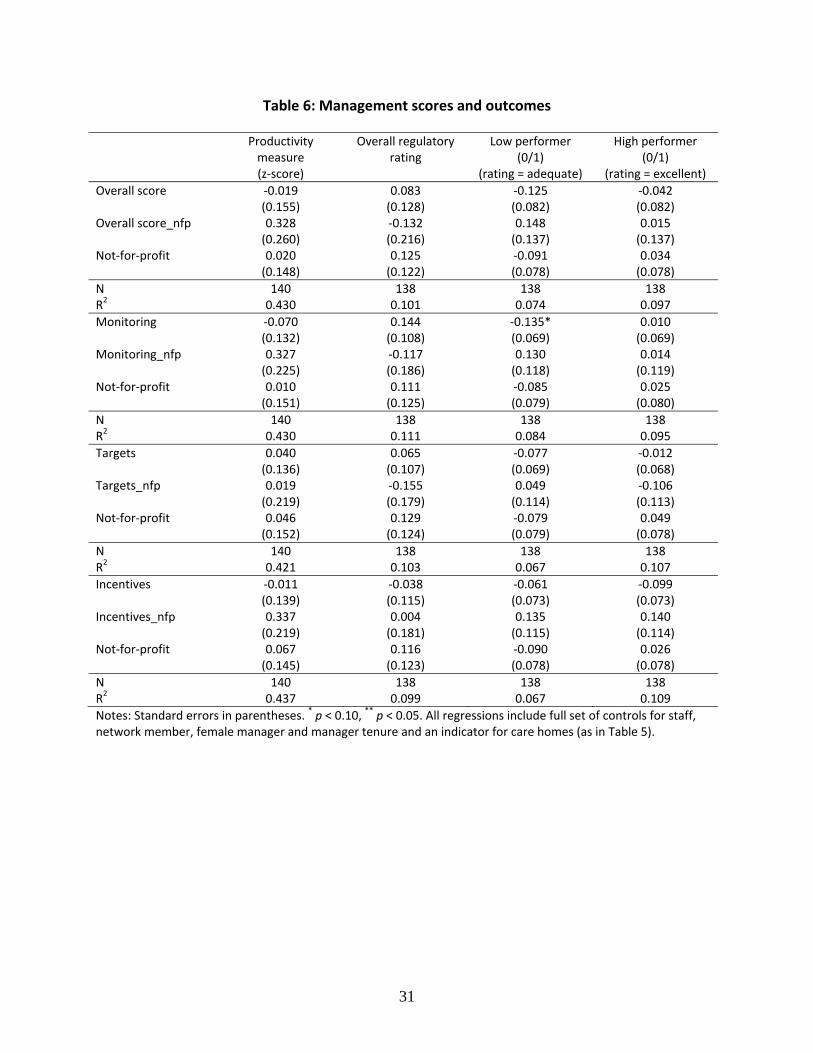
organizations. To test this we run simple regressions of the following form:
0 1 2 3 2i i i i i i iy M M NFP NFP X u
where yi is the measure of outcomes – productivity, regulatory rating, and binary indicators for
being rated adequate (“low performer”), and being rated excellent (“high performer”). M is the
overall management practices score (included as a z‐score as before), which we interact with a
NFP indicator to capture differences in the way in which management practices relate to
observable outcomes across the two sectors. We also include a NFP indicator to capture any
underlying difference in outcomes across the sectors and include the same controls as in earlier
regressions. The results are reported in Table 6.
In general, the results are weaker than in previous studies – few of the relationships are
statistically significant. This may be because of our relatively small sample sizes, the regulated
nature of the industries, or the limited range of regulatory ratings. Nevertheless, there are
some interesting findings.
14
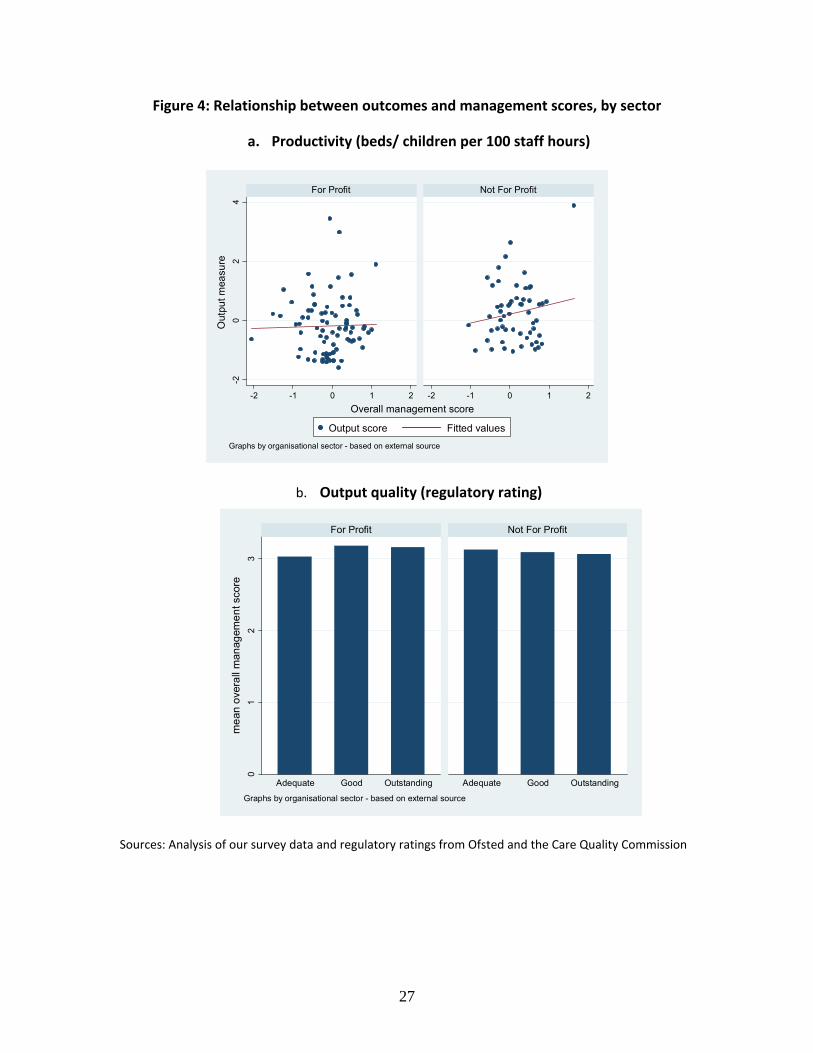
We find no significant correlation between management scores and productivity among FP
firms. However, the relationship between management scores and productivity is stronger for
NFPs than for FPs (see also Figure 4, panel a). This suggests that good management, as
measured by the survey tool designed to capture management quality in the FP sector, does
not matter differently for outcomes in NFP organizations.
Looking at our indicators of the quality of outcomes (Table 6, cols 2 – 4), the results for FP firms
are broadly consistent with earlier studies – there is a positive association between
management and performance, at least looking at both the overall regulatory rating and the
probability of being a low performer. For monitoring the relationship is statistically significant.
There is less strong association between management scores and being a higher performer (see
also Figure 5).
Looking at the interaction terms, there is some indication of a weaker relationship between
management score and outcomes among NFPs as compared to FPs (see also Figure 4, panel b) –
but the differences are not statistically significant.
Overall, these results provide little support for the idea that good management is different
between the two sectors. While we do find some evidence that management practices are less
effective in the NFP sector in terms of ensuring quality of outcomes, for productivity we find
the opposite pattern, with NFPs showing a stronger relation between productivity and
management scores than FPs. In the next section, we present an alternative theory that helps
to interpret the patterns in our data.
4. Theory
This section offers a theory that is able to reconcile our two key findings that NFPs score lower
on management practices, yet perform as well as FPs in terms of outcomes. Our theory does
not rely on differences between NFPs and FPs in how management practices affect
performance. Instead, our theoretical argument relies on sorting of entrepreneurs with
different levels of managerial ability and altruism into the FP and NFP sector. We build on
15
earlier work. In particular, we integrate key elements from earlier models by Glaeser and
Schleifer (2001), Besley and Ghatak (2005), and Bénabou and Tirole (2006).
4.1 The model
We consider the choice of agents to set up a FP or a NFP organization in a market for some
(quasi‐) public good or social service. Following Glaeser and Shleifer (2001), the only difference
between the two types of organizations is the limited ability of NFP entrepreneurs to distribute
profits to themselves. Specifically, while agents running a for‐profit organization are full
residual claimants, we shall suppose that, if an agent sets up a NFP organization, he earns a
share 0 1 of profits. The remaining share of profits (1‐) is retained by the organization
and used to further contribute to the organization's social objectives (e.g., making charitable
donations, giving discounts to poor clients, and so on).10
Agents in our economy differ in two respects: managerial ability (i) and impure altruism (i).
Both are agents’ private knowledge. The density of the joint distribution of i and i is common
knowledge and described by f() > 0 over its support ],0[],0[ and zero elsewhere. For
convenience, we shall assume that f() is a constant, that is, i and i are uniformly
distributed.
Managerial ability determines the productivity and, hence, profits of an organization. We
simply assume that output of an organization is given by q(i), where the function q(i) is
increasing. Profits are described by the function (i), which is also increasing.
Altruistic agents care about the contribution they make to the delivery of (quasi‐) public goods
or social services. Following Besley and Ghatak (2005), altruism is impure in that agents care
about how much they personally contribute, not about the total level of public goods or social
10 Our model best fits the situation of an owner-manager (a manager who is residual claimant). Results need not be different if the manager is not the owner, as long as the non-distribution constraint still has a bite (that is, if the owner wishes to pay sufficiently high pay-for-performance to the manager).
16
services provided in the economy.11 An agent's contribution consists of his organization's
output q(i) and any additional contributions, either by spending part of profits to reach some
social goals or by making private charitable donations out of distributed profits. We shall
impose an upper limit on how much an agent may care about making contributions: . As
we shall see, this rules out that some agents strictly prefer to donate all of their income to
charity.
Following Bénabou and Tirole (2006), we assume that agents are concerned about their status
for being altruistic. More concretely, we shall assume that people make inferences about an
agent's altruistic preferences by observing the agent's behavior. We assume that these outside
observers can only see the status of the organization an agent has set up: FP or NFP. People do
not observe the organization's output or profits. They update beliefs according to Bayes’ rule.
For convenience, we assume that agent's utility Ui is linear in private consumption,
contributions, and social status:
where yi represents agent i’s private consumption, i measures agent i’s altruistic preferences, ci
represents his contributions to the delivery of (quasi‐) public goods or social services, s
measures the weight put by agents on social status, and is people's belief about agent i’s
altruistic preferences. Note that, since people can only observe the (FP or NFP) status of an
agent's organization, can take at most two values, which we label and for FP
entrepreneurs and for NFP entrepreneurs, respectively. Obviously, the values of and
arise endogenously in equilibrium and must be consistent with Bayesian updating.
Lastly note that the linearity of the utility function implies that any agent with i < 1 strictly
prefers private spending to making charitable donations out of distributed profits. Hence, in the
11 This assumption is in line with Besley and Ghatak (2005) and Delfgaauw and Dur (2008), but contrasts Francois (2000), Glazer (2004), and Prendergast (2007) who study pure altruism.
1
iiiii scyU ˆ
i
i fp nfp
fp nfp
17
analysis below, we can safely ignore decisions taken on private charitable contributions as
distributed profits will be optimally spend entirely on private consumption. Moreover, it implies
that the NFP status is a binding constraint on distributing profits for all agents except those with
maximum altruistic preferences .
4.2 Analysis
Each agent decides whether to set up a FP or NFP organization. When setting up a FP
organization, an agent's payoff is:
. (1)
When setting up a NFP organization, an agent's payoff is:
. (2)
For given beliefs and an agent is indifferent between setting up a FP and a NFP
organization when the expressions in (1) and (2) are equal. After some rearrangements, we
obtain:
,0)ˆˆ()()1()()1( fpnfpiii s (3)
where the first term describes the agent's income loss when choosing NFP, the second term
describes the utility gain from contributing more to the public good through retained profits
when choosing NFP, and the third term describes the status gain or loss from choosing NFP.
Notice that the first two terms are negative in sum for all agents with . That is, although
agents enjoy making contributions, their altruism is not sufficiently strong to make up for the
decrease in private consumption. Hence, without a status gain , none of the
agents would strictly prefer setting up a NFP organization to setting up a FP organization.
1
fpiiii sqU ˆ)()(
nfpiiiii sqU ˆ)]()1()([)(
fp nfp
1i
0)ˆˆ(( fpnfps
18
It is also clear from (3) that, for given beliefs and the sum of gains and losses from
setting up a NFP organization strictly increases with i .The reason is clear. NFP status imposes
that part of the profits is used to make further contributions to the public good rather than is
distributed to the agent, which is less costly for agents who attach a greater value to making
such contributions.
The reverse holds for agent's managerial ability. For given beliefs and the sum of gains
and losses from setting up a NFP organization strictly decreases with . Intuitively, setting up a
NFP organization implies giving up a share (1‐) of profits, which is more costly for highly able
agents as they achieve higher profits.
The above observations suggest that, if some agents decide to set up a NFP organization, these
agents will be drawn from the top of the altruism distribution and the bottom of the managerial
ability distribution. Proposition 1 shows that this is indeed the case.
Proposition 1 In a partially‐separating Perfect Bayesian Equilibrium, some agents set up a NFP
organization, while others set up a FP organization. For any given level of altruism, agents who
set up a NFP organization are drawn from the bottom of the managerial ability distribution. For
any given level of manager ability, agents who set up a NFP organization are drawn from the
top of the altruism distribution.
Proof. First note that a pooling equilibrium may arise where all agents choose FP status. This
happens when people's beliefs about not‐for‐profit entrepreneurs' altruism are identical to or
more pessimistic than people's beliefs about FP entrepreneurs' altruism (that is ).
Given that people hold such beliefs, none of the agents strictly prefers to set up a NFP
organization, so that equals the people's prior belief about agents' altruism and is an
out‐of‐equilibrium belief.
fp nfp
fp nfp
fpnfp ˆˆ
fp nfp
19
Suppose next that people have more optimistic beliefs, . It is clear from (3) that, if
, then all agents with 1 i now strictly prefer to set up a NFP organization.
Further, some agents with also strictly prefer NFP, depending on their level of
managerial ability. Define as the level of altruism at which agents with ability level are
indifferent between FP and NFP. Rewriting (3) yields:
(4)
which is strictly increasing in and approaches one when goes to infinity. All agents with
strictly prefer NFP status, while the remainder (at least weakly) prefers FP status. In
equilibrium, beliefs follow from Bayes’ Rule. Hence:
(5)
.),(
),(ˆ
)(00
)(00
*
*
ddf
ddfinfp
(6)
The Perfect Bayesian Equilibrium is given by the solution to (4), (5), and (6). It is straightforward
to show that if and are uniformly distributed, a solution exists and is unique. ■
Proposition 1 predicts that in a market where both FP and NFP organizations are active, average
managerial ability is higher in FP organizations. The reason is simple: switching to NFP status
imposes a constraint on the distribution of profits to the agent, which is more costly for agents
who achieve higher profits. Managers’ altruism will, however, be higher in NFP organizations.
The reason is that only sufficiently altruistic agents are willing to give up some of their profits to
make further contributions to the public good. As a result, the theory has less clear predictions
for the relation between an organization's status and total output, broadly defined. While NFPs
fpnfp ˆˆ
fpnfp ˆ
i
)(
,)()1(
)ˆˆ(1)(
fpnfps
,),(
),(ˆ
)(0
)(0
ddf
ddfinfp
20
may achieve lower output as a result of the negative sorting of managerial ability, the use of
retained profits to further the organization's objectives may imply that NFP organizations reach
higher output. Our theory thus provides an alternative interpretation of the key findings in the
previous section.
5. Conclusions
There is growing interest in the contribution to firm performance of management practices.
This is the first study to focus on management in not‐for‐profits compared to for‐profit firms.
Using unique survey data on management practices in not‐for‐profit and for‐profit firms in two
large social‐care industries in the UK, we find evidence that not‐for‐profits score lower on
management practices than for‐profits, particularly in terms of use of incentives. Yet, the
performance of not‐for‐profits is not worse as compared to the performance of for‐profits,
neither in terms of productivity nor in terms of quality.12
One possible interpretation of these findings is that management practices that are highly
effective in for‐profit firms are less effective in not‐for‐profit firms. This would imply that there
is no single concept of good management and that good management varied from sector to
sector (and possibly more widely). However, when we relate organizational productivity to
management practices, and compare this relationship across sectors, we only find weak
evidence for this story. Instead, our preferred interpretation of the data builds on sorting of
12 Our findings that management quality does not translate into poorer output differs from Bandiera et al. (2010) who integrate selection of workers and incentive structures within a single model and empirically examine the differences between family firms and firms with distributed ownership. They find that family firms optimally offer less incentive pay, lower overall pay, and attract lower quality workers but also make lower profit. They do not, however, examine differences by for‐profit status and the workers in their model do not have altruism to offset lower ability. Stephan et al. (2011) look at social enterprises, some of which may be not‐for‐profit and some not. Also in contrast to our paper, they find that better management practices do lead to better performance in these organizations. However, they use a different measure of management practices and use balance sheet information to assess performance. In the case of not‐for‐profits which have a non‐distribution constraint, balance sheet performance may not be a good way of assessing overall performance and direct measures of quality may be more useful.

21
differently motivated and differently talented entrepreneurs to the not‐for‐profit and for‐profit
sectors. We have presented a model along these lines that predicts that managers choosing
not‐for‐profit status possess lower managerial quality, but higher altruism. Output, therefore,
need not be lower in not‐for‐profits, even if managerial quality has a similar effect on output
across sectors. This model is consistent with our observed empirical findings.
Our findings provide the first evidence that there are potentially real – and important –
differences between management in the for‐profit and not‐for‐profit sectors. However, we find
little support for the main difference being what good management is. Instead, the main
difference is likely to be in management quality – and in the importance of management quality
for achieving a given level of output in the presence of altruistically‐motivated agents in the
not‐for‐profit sector.
22
References
Bandiera, Oriana, Luigi Guiso, Andrea Prat, and Rafealla Sadun (2010), Matching Firms, Managers and Incentives. Mimeo, London School of Economics.
Bénabou, Roland, and Jean Tirole (2006), Incentives and Prosocial Behavior, American Economic Review, 96(5): 1652‐1678.
Besley, Tim and Maitreesh Ghatak (2005), Competition and Incentives with Motivated Agents, American Economic Review, 95: 616‐36.
Black, Sandra E., and Lisa M. Lynch (2001), How to Compete: The Impact of Workplace Practices and Information Technology on Productivity, Review of Economics and Statistics, 83: 434‐45.
Bloom, Nicholas, and John Van Reenen (2007), Measuring and Explaining Management Practices Across Firms and Countries, Quarterly Journal of Economics, 122(4): 1351‐1408.
Bloom, Nicholas, and John Van Reenen (2010), Human resource management and productivity, forthcoming in Ashenfelter, Orley and David Card (Eds.) Handbook of Labor Economics Volume IV.
Bloom, Nicholas, Carol Propper, Stephan Seiler, and John Van Reenen (2010), The Impact of Competition on Management Quality: Evidence from Public Hospitals, NBER Working Paper 16032.
Carpenter, Jeffrey, and Caitlin Knowles Myers (2010), Why volunteer? Evidence on the role of altruism, image, and incentives, Journal of Public Economics, 94(11‐12): 911‐920.
Delfgaauw, Josse, and Robert Dur (2008), Incentives and Workers' Motivation in the Public Sector, Economic Journal, 118: 171‐191.
Delfgaauw, Josse, and Robert Dur (2010), Managerial Talent, Motivation, and Self‐Selection into Public Management, Journal of Public Economics, October 2010, 94(9‐10): 654‐660.
Francois, Patrick (2007), Making a Difference. RAND Journal of Economics, 38(3): 714‐732.
Glaeser, Edward L., and Andrei Schleifer (2001), Not‐for‐profit Entrepreneurs, Journal of Public Economics, 81(1): 99‐115.
Glazer, Amihai (2004), Motivating Devoted Workers, International Journal of Industrial Organization, 22(3): 427‐440.
Gregg, P., Grout, P., Ratcliffe, A., Smith, S. and Windmeijer, F. (2011) How important is donated labour in the delivery of public services? Journal of Public Economics, 95(7‐8), pp. 758‐766.
Prendergast, Canice (2007), The Motivation and Bias of Bureaucrats, American Economic Review, 97 (1):
180‐196.

23
Stephan, Ute, Marieke Huysentruyt and Suncica Vujic (2011), CEO Values, Managerial Practices and Organisational Performance. Mimeo, Department of Management, London School of Economics.
24
Figure 1: Location of not‐for‐profit and for‐profit homes and agencies (population)
Nursing care homes Fostering/ adoption agencies
Sources: Population data from the Care Quality Commission (nursing homes with 40+ beds) and British Association
of Adoption and Fostering (fostering and adoption agencies)
25
Figure 2: Distribution of management practice scores, by industry (15 core indicators)
Sources: Analysis of our survey data and from Bloom et al. (2010).
0.2
.4.6
.81
1 2 3 4 5management score
Homes AgenciesHospitals Manufacturing
Overall management score
26
Figure 3: Distribution of management practice scores by sector,
fostering/adoption agencies and care homes (15 core indicators)
Sources: Analysis of our survey data, 107 for‐profit organisations and 61 not‐for‐profit organisations.
0.5
1
1 2 3 4 5score
Not for profit For profit
Overall management score
27
Figure 4: Relationship between outcomes and management scores, by sector
a. Productivity (beds/ children per 100 staff hours)
b. Output quality (regulatory rating)
Sources: Analysis of our survey data and regulatory ratings from Ofsted and the Care Quality Commission
-20
24
-2 -1 0 1 2 -2 -1 0 1 2
For Profit Not For Profit
Output score Fitted values
Out
put m
easu
re
Overall management score
Graphs by organisational sector - based on external source
01
23
Adequate Good Outstanding Adequate Good Outstanding
For Profit Not For Profit
mea
n ov
eral
l man
agem
ent s
core
Graphs by organisational sector - based on external source
28
Table 1: Population and sample distributions by sector
Fostering and adoption agencies Care homes
Population Sample Population Sample
For‐profit 0.395 0.447 0.925 0.594
Public 0.339 0.310 0.009 0.040
Not for Profit 0.266 0.243 0.067 0.366
N 413 103 2,363 101
Note: We confirmed no systematic sampling bias in terms of performance outcomes and other population
characteristics, such as number of care home beds.
Table 2: Sample characteristics
Fostering/adoption
agencies
Residential care
homes
For‐profit Not‐for‐
profit
p‐value For‐profit Not‐for‐
profit
p‐value
FTE number of staff 20.4 14.8 [0.540] 31.5 13.8 [0.001]
Typical hours worked 37.96 36.25 [0.124] 38.75 36.21 [0.014]
Network member 0.673 0.833 [0.127] 0.683 0.784 [0.370]
Manager’s tenure (yrs) 5.10 4.88 [0.829] 5.88 5.54 [0.761]
Female manager 0.522 0.840 [0.019] 0.833 0.919 [0.104]
No. kids placed/ no. beds 37.13 21.00 [0.118] 59.64 61.62 [0.619]
Average regulatory rating score 3.09 3.12 [0.886] 2.93 3.00 [0.617]
Low performer: rating = adequate 0.152 0.118 [0.750] 0.268 0.176 [0.326]
High performer: rating = excellent 0.242 0.236 [0.956] 0.196 0.176 [0.817]
Productivity (kids/ beds per 100 hrs) 10.09 9.18 [0.735] 8.32 12.93 [0.00]
N 60 37 47 24
Note: p‐value refers to the test that the means are equal between FP and NFP organizations.
29
Table 3: Management practice scores by industry (core set of 15 indicators)
Mean score
(out of 5)
Standard
deviation
Mean size
(employees)
Number of
obs
Fostering/ adoption agencies 3.07 0.392 19 105
Care homes 3.17 0.457 26 103
Manufacturing firms 3.03 0.642 897 678
Manufacturing firms (< 100 employees) 2.78 0.569 79 40
Hospitals 2.42 0.608 3,699 116
Sources: Data from authors and from Bloom et al. (2010).
Table 4: Management scores by sector, OLS regression results
Dependent variable: Management score (z‐score)
Overall score (15 indicators)
Monitoring(5 indicators)
Targets(5 indicators)
Incentives(5 indicators)
NFP (0/1) ‐0.064 ‐0.097 0.118 0.064 0.036 0.008 ‐0.348** ‐0.365**
(0.115) (0.117) (0.136) (0.141) (0.134) (0.137) (0.129) (0.133)FTE staff 0.139* 0.106 0.206** 0.104 (0.078) (0.094) (0.092) (0.089)Staff^2 ‐0.012 ‐0.010 ‐0.017* ‐0.011 (0.008) (0.010) (0.010) (0.009)Network member 0.267** 0.326** 0.187* 0.291**
(0.095) (0.114) (0.112) (0.109)Female ‐0.037 ‐0.011 ‐0.006 ‐0.096 (0.107) (0.129) (0.126) (0.122)Tenure ‐0.003 ‐0.001 ‐0.008 0.000 (0.009) (0.011) (0.011) (0.011)
N 168 166 168 166 168 166 168 166R2 0.088 0.167 0.094 0.153 0.120 0.183 0.111 0.174
Notes: Standard errors in parentheses, * p < 0.10, ** p < 0.05. FTE staff is taken up as fraction of the average FTE
staff in the organization’s industry (fostering and adoption agencies / care homes). All regressions include
interviewer fixed effects, time of day dummies, and an indicator for care homes. The reduction in sample size
occurs because of missing information on staff.
30
Table 5: Outcome measures
Productivity measure (z‐score)
Overall regulatory rating
Low performer (0/1)(rating = adequate)
High performer (0/1)(rating = excellent)
NFP 0.449** 0.075 0.056 0.123 ‐0.071 ‐0.093 ‐0.016 0.031 (0.168) (0.144) (0.113) (0.121) (0.070) (0.077) (0.072) (0.077)FTE staff ‐0.024 ‐0.142 ‐0.017 ‐0.159*
(0.179) (0.146) (0.093) (0.093)Staff^2 ‐0.024* 0.020* ‐0.007 0.013*
(0.014) (0.011) (0.007) (0.007)Network ‐1.136** 0.197 ‐0.076 0.121 (0.149) (0.121) (0.077) (0.077)Female 0.122** ‐0.021 0.005 ‐0.016 (0.023) (0.019) (0.012) (0.012)Tenure 0.160 0.260** ‐0.119 0.141*
(0.152) (0.127) (0.081) (0.080)
N 141 141 140 138 140 138 140 138R2 0.049 0.418 0.014 0.098 0.020 0.057 0.004 0.094
Notes: Standard errors in parentheses, * p < 0.10, ** p < 0.05. An organization’s z‐score in productivity is calculated
within the organization’s industry (fostering and adoption agencies / care homes). FTE staff is taken up as fraction
of the average FTE staff in the organization’s industry. All regressions include an indicator for care homes.
31
Table 6: Management scores and outcomes
Productivity measure (z‐score)
Overall regulatory rating
Low performer (0/1)
(rating = adequate)
High performer (0/1)
(rating = excellent)
Overall score ‐0.019 0.083 ‐0.125 ‐0.042 (0.155) (0.128) (0.082) (0.082)Overall score_nfp 0.328 ‐0.132 0.148 0.015 (0.260) (0.216) (0.137) (0.137)Not‐for‐profit 0.020 0.125 ‐0.091 0.034 (0.148) (0.122) (0.078) (0.078)
N 140 138 138 138R2 0.430 0.101 0.074 0.097
Monitoring ‐0.070 0.144 ‐0.135* 0.010 (0.132) (0.108) (0.069) (0.069)Monitoring_nfp 0.327 ‐0.117 0.130 0.014 (0.225) (0.186) (0.118) (0.119)Not‐for‐profit 0.010 0.111 ‐0.085 0.025 (0.151) (0.125) (0.079) (0.080)
N 140 138 138 138R2 0.430 0.111 0.084 0.095
Targets 0.040 0.065 ‐0.077 ‐0.012 (0.136) (0.107) (0.069) (0.068)Targets_nfp 0.019 ‐0.155 0.049 ‐0.106 (0.219) (0.179) (0.114) (0.113)Not‐for‐profit 0.046 0.129 ‐0.079 0.049 (0.152) (0.124) (0.079) (0.078)
N 140 138 138 138R2 0.421 0.103 0.067 0.107
Incentives ‐0.011 ‐0.038 ‐0.061 ‐0.099 (0.139) (0.115) (0.073) (0.073)Incentives_nfp 0.337 0.004 0.135 0.140 (0.219) (0.181) (0.115) (0.114)Not‐for‐profit 0.067 0.116 ‐0.090 0.026 (0.145) (0.123) (0.078) (0.078)
N 140 138 138 138R2 0.437 0.099 0.067 0.109
Notes: Standard errors in parentheses. * p < 0.10, ** p < 0.05. All regressions include full set of controls for staff, network member, female manager and manager tenure and an indicator for care homes (as in Table 5).
32
Appendix Table A1: Management scores by sector, separate indicators
NFP dummy Coefficient Standard error
Monitoring indicators Performance tracking 0.139 (0.205) Performance review 0.311* (0.183) Performance dialogue ‐0.135 (0.204) Consequence management 0.161 (0.201) Performance clarity and comparability ‐0.175 (0.205)
Targets indicators Target balance ‐0.092 (0.209) Target interconnection 0.086 (0.192) Target time horizon 0.210 (0.213) Target stretch ‐0.138 (0.217) Managing human capital ‐0.059 (0.209)
Incentives indicators Rewarding good performers ‐0.673** (0.209) Removing poor performers ‐0.421** (0.210) Promoting high performers ‐0.233 (0.220) Attracting talent ‐0.088 (0.215) Retaining talent ‐0.523** (0.198)
Notes: Each row is a separate regression. * p < 0.10, ** p < 0.05. All regressions include full set of controls for staff, network member, female manager, manager tenure, interviewer fixed effects, time of day dummies, and an indicator for care homes (as in Table 4).
33
MANAGEMENT PRACTICE INTERVIEW GUIDE: FOSTER/ADOPTION AGENCIES
LEAN MANAGEMENT
(1) Standardisation of processes (Operations)
Tests how well processes are structured and standardized – focusing on matching of children with foster carers/ adoptive parents
a. Can you briefly describe the process for finding a suitable foster carer / potential adoptive parent for a particular child? How formally is this defined and/or standardised?
b. How do you identify and then deal with the diverse needs of individual children? How much flexibility does a case worker/manager have to move outside the protocol?
c. How do you ensure that the process is followed in each case? That is, how is it evaluated/ reviewed? d. How do you define whether the match between the carer/ potential adoptive parent and the child has been successful?
Score 1 Score 3 Score 5
Scoring grid: Unable to articulate a clearly defined process;
no protocols for ensuring that the process is
followed or that the outcome is successful
Processes are in place, but there is little
monitoring and/or attempt to validate outcomes.
The agency has adopted a clearly defined process that is able
to deal with diverse needs; processes are followed with
comprehensive monitoring/ oversight and follow‐up to ensure
that outcomes are successful
(2) Continuous improvement (Operations)
Tests process for and attitudes to continuous improvement and whether there is a process for learning and for innovating
a. When a problem occurs, (for example one arising with a child placed with foster carers/ adoptive parents), how do such problems typically become exposed and then fixed?
b. Can you talk me through the process to deal with a recent problem that you faced? Were there any changes to procedures as a result (NOTE: may not apply to all problems mentioned…)
c. How do different staff groups or agency workers get involved in dealing with problems? d. To what extent do staff (specify that this includes foster carers if relevant) suggest improvements to processes (eg recruiting foster carers/ provision of
services for children)? Can you think of any examples of a staff idea was taken forward? Score 1 Score 3 Score 5
Scoring grid: Process improvements are made when
problems occur. Limited involvement of staff;
suggestions from staff/ carers are not sought/
developed.
Process review and improvements occurs at
irregular meetings involving all staff groups;
some attempt to develop ideas from the bottom
up, but not systematic.
Exposing problems in a structured way is integral to
individuals’ responsibilities. Resolution involves all involved
staff/carers as a part of regular business. For innovation,
agency seeks ideas from staff/ carers and has process for
implementation.
34
PEFORMANCE MANAGEMENT
(3) Performance tracking (Monitoring)
Tests whether the overall performance of the agency is tracked using meaningful metrics and with appropriate regularity
a. What kind of performance/ quality indicators do you use to keep track of how your agency is performing? (have examples ready) b. How do these indicators apply to individual members of staff? c. What indicators do you use to track the performance of foster carers? (note fostering only) d. How frequently is performance of the agency measured? Who gets to see the performance information?
Score 1 Score 3 Score 5
Scoring grid: No clear idea of how overall performance is
measured (other than government targets).
Performance measurement is ad‐hoc.
Most important performance indicators are
tracked formally; tracking is overseen by senior
staff.
Performance is continuously tracked and communicated
against most critical measures, both formally and informally,
to all staff using a range of visual management tools
(4) Performance review (Monitoring)
Tests whether performance of individual members of staff is reviewed in a comprehensive way.
a) How do you review your main performance indicators? b) Can you describe a recent performance review meeting? How often do these meetings take place? c) Who is involved in these meetings? Who within the agency then gets to see the results of this review? d) What sort of follow‐up plan would there be after such as meeting?
Score 1 Score 3 Score 5
Performance is reviewed infrequently or in an
un‐meaningful way e.g. only success or failure is
noted
Performance is reviewed periodically with both
successes and failures identified. No clear follow
up plan is adopted.
Performance is continually reviewed, based on the indicators
tracked. All aspects are followed up to ensure continuous
improvement.
(5) Performance dialogue (Monitoring)
Tests the quality of review conversations
a) How are these performance review meetings structured OR How is the agenda for review meetings structured determined? b) When you get together, do you generally find that you do have enough information on performance data? How is this data used? c) When a problem is discussed during these meetings, how do you identify the root cause?
Score 1 Score 3 Score 5
35
Scoring grid: The right information for a constructive
discussion is often not present or the quality is
too low; conversations focus overly on data that
is not meaningful. Clear agenda is not known
and purpose is not explicitly. Next steps are not
clearly defined
Review conversations are held with the
appropriate data present. Objectives of meetings
are clear to all participating and a clear agenda is
present. Conversations do not, drive to the root
causes of the problems, next steps are not well
defined
Regular review/performance conversations focus on problem
solving and addressing root causes. Purpose, agenda and
follow‐up steps are clear to all. Meetings are an opportunity
for constructive feedback and coaching
(6) Consequence management (Monitoring)
Tests whether differing levels of (personal) performance lead to different consequences (good or bad)
a) Let’s say you’ve agreed to a follow up plan at one of your meetings, what would happen if the plan was not enacted? b) How long is it between when a problem is identified to when it is solved? (For example – what if there was a problem with one of the children you placed) Can you
give me a recent example? c) How do you deal with repeated failures for a particular WHAT?
Score 1 Score 3 Score 5
Scoring grid: Failure to achieve agreed objectives does not
carry any consequences
Failure to achieve agreed results is tolerated for a
period before action is taken
A failure to achieve agreed targets drives retraining in
identified areas of weakness or moving individuals to where
their skills are appropriate
TARGET MANAGEMENT
(7) Target balance (Targets)
Test whether there are meaningful targets for the organisation?
a) What types of specific targets are set for your organisation? Can you give some examples? b) To what extent are these targets determined by outside bodies – such as central government, the local authority or the regulator (Ofsted)? c) Can you tell me about any targets that are not set by outside bodies? How do the targets link together?
Score 1 Score 3 Score 5
Scoring grid: Goals focussed only on government targets and
achieving the budget
Some internal goals/ targets. But not that
comprehensive/ well‐integrated.
Comprehensive range of internal targets covering a number of
dimensions. Targets are well‐integrated.
(8) Target inter‐connection (Targets)
Tests whether targets are linked to overall objectives and how well they cascade down the organisation
36
a. What is the motivation behind these goals – how would you say they are determined? b. How are these targets cascaded down through the organisation to staff teams or to individual members of staff? c. Do departments/ individual members of staff have their own targets? If so, how are they determined? How are they linked to the organisation’s overall
objective?
Score 1 Score 3 Score 5
Scoring grid: Goals do not cascade down the organisation Goals do cascade, but only to some staff groups Goals increase in specificity as they cascade, ultimately
defining individual expectations, for all staff groups
(9) Time horizon of targets (Targets)
Tests whether organisation has a rational approach to planning and setting targets
a) What kind of time scale do your targets cover? To what extent are they short‐term/ long‐term? b) Which goals receive the most emphasis – short‐term or long‐term? c) Are the long term and short term goals set independently? How are the long‐term and short‐term goals linked together? d) Could you meet all your short‐run goals but miss your long‐run goals?
Score 1 Score 3 Score 5
Scoring grid: Top staff’s main focus is on short term targets There are short and long term goals for all levels
of the organisation. As they are set
independently, they are not necessarily linked to
each other
Long term goals are translated into specific short term targets
so that short term targets become a ‘staircase’ to reach long
term goals
(10) Target stretch (Targets) Tests whether targets are appropriately difficult to achieve
a) How tough are your targets? Do you feel pushed by them? b) On average, how often would you say that you meet your targets? c) Do you feel that all teams of staff are equally pushed in meeting their targets? Or do some groups get easier targets?
Score 1 Score 3 Score 5
Scoring grid: Goals are either too easy or impossible to
achieve, at least in part because they are set
with little involvement of key staff, e.g., simply
off historical performance
In most areas, senior staff push for aggressive
goals based, e.g., on external benchmarks, but
with little buy‐in from clinical staff. There are a
few sacred cows that are not held to the same
standard
Goals are genuinely demanding for all parts of the
organisation and developed in consultation with senior staff,
e.g., to adjust external benchmarks appropriately
(11) Clarity and comparability of targets (Monitoring)
37
Tests how easily understandable performance measures are and whether performance is openly communicated
a) If I asked your staff directly whether they had been given individual performance targets, what would they tell me? b) Do people think about how their performance compares to the performance of other people? How would they be able to make any assessment of their relative
performance? c) Do you compare or rank staff performance in any way?
Score 1 Score 3 Score 5
Scoring grid: Performance measures are complex and not
clearly understood, or only relate to
government targets. Individual performance is
not made public
Performance measures are well defined and
communicated; performance is public at all levels
but comparisons are discouraged
Performance measures are well defined, strongly
communicated and reinforced at all reviews; performance
and rankings are made public to induce competition
TALENT MANAGEMENT
(12) Rewarding high performers (Incentives)
Tests whether good performance is rewarded proportionately
a) How does your appraisal system for staff work? b) Do you also operate an appraisal system for foster carers? If so, how does that system work? c) How do you reward your best performers, financially and non‐financially? How about foster carers (if relevant)? d) Overall, how does your reward system compare to that at other comparable organisations?
Score 1 Score 3 Score 5
Scoring grid: Not much systematic appraisal and people are
rewarded equally irrespective of performance
level
There is an evaluation system for the awarding of
performance related rewards at the individual
level; these are mainly non‐financial and rewards
are always or never achieved
There is an evaluation system for the awarding of
performance related rewards, including personal financial
rewards
(13) Removing poor performers (Incentives)
Tests whether organisation is able to deal with underperformers
a) If you had a social worker who was struggling or could not do his or her job, what would you do? Can you give me a recent example? b) What about foster carers? c) How long would underperformance be tolerated? d) Are there some members of staff members who seem to lead a charmed life? Do some individuals always just manage to avoid being fixed/fired?
Score 1 Score 3 Score 5
38
Scoring grid: Poor performers are rarely removed from their
positions
Suspected poor performers stay in a position for
at least a year before action is taken
We move poor performers out of the agency or to less critical
roles as soon as a weakness is identified
(14) Promoting high performers (Incentives)
Tests whether promotion is performance based
a) Can you tell me about career progression and the promotion system within your organisation? b) How would you identify and develop your star performers? c) What types of professional development opportunities are provided and how are these personalised to meet individual needs? d) Are better performers likely to be promoted faster or are promotions given on the basis of tenure/seniority?
Score 1 Score 3 Score 5
Scoring grid: People are promoted primarily on the basis of
tenure
People are promoted upon the basis of
performance
We actively identify, develop and promote our top performers
(15) Managing talent (Targets)
Tests what emphasis is put on talent management
a) How do you ensure that you have enough of the right type of staff and foster carers in your organisation? b) How do you seek out and source staff? What about foster carers? c) What do you use as hiring criteria for staff and foster carers? What strategies do you use to recruit the right people? d) Do senior members of staff get any reward for bringing in and keeping talented people – either working directly for the organisation or as foster carers?
Score 1 Score 3 Score 5
Scoring grid: Senior staff do not communicate that attracting,
retaining and developing talent throughout the
organisation is a top priority
Senior management believe and communicate
that having top talent throughout the
organisation is key to good performance
Senior staff are evaluated and held accountable on the
strength of the talent pool they actively build
(16) Retaining talent (Incentives) Tests whether organisation will go out of its way to keep its top talent
a) If your best social worker wanted to leave, what would you do to persuade him or her to stay? b) Can you give me any examples of where star performers have been persuaded to stay? c) Can you give me any examples of where star performers have left without anyone trying to keep them?
Score 1 Score 3 Score 5
Scoring grid: We do little to try and keep our top talent We usually work hard to keep our top talent We do whatever it takes to retain our top talent across all
three staff groups
39
(17) Attracting talent (Incentives) Tests how strong the employee value proposition is
a) What makes it distinctive to work at your agency, as opposed to another, similar agency? b) Suppose I was a well‐qualified social worker with an excellent track record that you wanted to hire, how would you persuade me to come and work for your
organisation? What about foster carers?
Score 1 Score 3 Score 5
Scoring grid: Our competitors offer stronger reasons for
talented people to join their hospitals
Our value proposition to those joining our
department is comparable to those offered by
others hospitals
We provide a unique value proposition to encourage talented
people join our department above our competitors
40
MANAGEMENT PRACTICE INTERVIEW GUIDE
RESIDENTIAL CARE HOMES
LEAN MANAGEMENT
(1) Effective Care Management Processes and personalisation (Operations)
Tests how the motivation and impetus behind changes to operations and what change story was communicated and how well the care management process is configured
a) Can you briefly describe the client profile? That is, the main type of client, their major needs etc. How clear and/or concise is your organisations client profile defined?
b) How much emphasis is placed on defining your organisation’s client profile? How are these needs then accommodated for in the care management process? c) How do you as a manager ensure that this level of care? How is personalisation monitored or evaluated?
Score 1 Score 3 Score 5
Scoring grid: Changes are not substantially based on the
details of resident needs or profile. No
structured or effective feedback process to
communicate the changes taking place among
the resident needs.
Changes are noticed, implemented regularly but
there are few documented and formal systems
to control this process.
Changes were made to improve overall performance, based on
client needs and profile, and financial, with buy‐in from all
affected staff groups. The changes were communicated in a
coherent ‘change story’ with a structured, pro‐active
mechanism for transmitting, recording and acting on this data.
(2) Rationale for introducing operational improvements (operations)
Tests motivation and impetus behind changes to operations and how the change story was communicated
a) Has the main care management process changed in the recent years? How frequently do these changes occur? b) What is the main rationale for making operational improvements to the care management process or pathway? Can you give me a recent example? c) Who typically drives these changes?
Score 1 Score 3 Score 5
Scoring grid: Changes were imposed in a top down manner
or because others were making (similar)
changes, rationale was not communicated or
understood
Changes were made because of financial
pressure and the need to save money or as a
(short‐term) measure to achieve government
and/or external targets
Changes were made to improve overall performance, both
clinical and financial, with buy‐in from all affected staff groups.
The changes were communicated in a coherent ‘change story’
41
(3) Standardisation and alignment of Case Management Processes (operations)
Tests how well processes are structured and standardized and how CMP is applied and monitored systematically
a) How standardised are the main processes for case management? b) How clear are (clinical) staff members about how the treatment of specific procedures should be carried out? c) What tools and resources do the clinical staff employ to insure care plans are followed correctly (i.e. that the patients get the correct tests done, medications,
or therapy session on time)? d) How are managers able to monitor whether or not clinical staff are following established protocols?
Score 1 Score 3 Score 5
Scoring grid: Little standardisation and few protocols exists,
e.g., different staff members have different
approaches to the same treatments
Protocols have been created, but are not
commonly used, e.g., because they are too
complicated or not monitored adequately (may
be on website or in manual only)
Processes and protocols are known and used by all staff and
regularly followed up on through some form of monitoring or
oversight; clients are informed of expectations for their
care
(4) Continuous improvement (operations)
Tests process for and attitudes to continuous improvement and whether there is a process for learning and for innovating
a) With regard to the operations of management process, when problems occur – how do they typically get exposed and fixed? b) Can you talk me through the process organisation went through when you faced a recent problem? (see prompt list) c) When specific process does change, what is the main driver of this change? d) Who within the organisation typically gets involved in changing or improving? How do/can different staff groups get involved in this process? Can you think of
any examples of how/when ideas were taken forward? Score 1 Score 3 Score 5
Scoring grid: Process improvements are made when
problems occur. Limited involvement of staff;
suggestions from staff are not sought/
developed.
Process review and improvements occurs at
irregular meetings involving all staff groups;
some attempt to develop ideas from the bottom
up, but not systematic.
Exposing problems in a structured way is integral to
individuals’ responsibilities and resolution involves all
staff groups, along the entire care management process as a
part of regular business processes rather than by
extraordinary effort/teams
42
PEFORMANCE MANAGEMENT
(5) Performance tracking (Monitoring)
Tests whether performance is tracked using meaningful metrics and with appropriate regularity
a) What kind of performance/ quality indicators do you use to keep track of how the organisation is performing? (examples ‐ clinical, as in response times to button calls; corporate – bed occupancy rates; or stakeholder – patient satisfaction, or parent organization’s mission
objectives)
b) How frequently is performance measured? Who gets to see the performance information? c) If I were to walk through your nursing/ residential care home, how could I tell how it was doing against these main indicators?
Score 1 Score 3 Score 5
Scoring grid: No clear idea of how overall performance is
measured (other than government targets).
Performance measurement is ad‐hoc.
Most important performance indicators are
tracked formally; tracking is overseen by senior
staff.
Performance is continuously tracked and communicated
against most critical measures, both formally and informally,
to all staff using a range of visual management tools
(6) Performance review (Monitoring)
Tests whether performance is reviewed with appropriate frequency and communicated with staff
a) How do you review the performance of your members of staff, both formally and informally? b) Can you describe a recent performance review meeting? c) Who is involved in these meetings? Who gets to see the results of this review? d) What sort of follow‐up plan would there be after such as meeting?
Score 1 Score 3 Score 5
Performance is reviewed infrequently or in an
un‐meaningful way e.g. only success or failure is
noted
Performance is reviewed periodically with both
successes and failures identified. No clear follow
up plan is adopted.
Performance is continually reviewed, based on the indicators
tracked. All aspects are followed up to ensure continuous
improvement.
(7) Performance dialogue (Monitoring)
Tests the quality of review conversations
43
a) How are performance/ quality review meetings structured? b) How do you make use of performance data or metrics during any of these meetings? When you do get together, do you generally find that you do have enough
information? c) What type of feedback occurs in these meetings? d) When a problem is discussed during these meetings, how do you identify the root cause?
Score 1 Score 3 Score 5
Scoring grid: The right information for a constructive
discussion is often not present or the quality is
too low; conversations focus overly on data that
is not meaningful. Clear agenda is not known
and purpose is not explicitly. Next steps are not
clearly defined
Review conversations are held with the
appropriate data present. Objectives of meetings
are clear to all participating and a clear agenda is
present. Conversations do not, drive to the root
causes of the problems, next steps are not well
defined
Regular review/performance conversations focus on problem
solving and addressing root causes. Purpose, agenda and
follow‐up steps are clear to all. Meetings are an opportunity
for constructive feedback and coaching
(8) Consequence management (Monitoring)
Tests whether differing levels of (personal) performance lead to different consequences (good or bad)
a) Let’s say you’ve agreed to a follow up plan at one of your meetings, what would happen if the plan was not enacted? b) How long is it between when a problem is identified to when it is solved? Can you give me a recent example? c) How do you deal with repeated failures in specific areas/ of the home or with certain processes?
Score 1 Score 3 Score 5
Scoring grid: Failure to achieve agreed objectives does not
carry any consequences
Failure to achieve agreed results is tolerated for
a period before action is taken
A failure to achieve agreed targets drives retraining in
identified areas of weakness or moving individuals to where
their skills are appropriate
TARGET MANAGEMENT
(9) Target balance (Targets)
Test whether there are meaningful targets for the organisation
44
a) What types of specific targets are set for your organisation? b) To what extent are these targets determined by outside bodies – such as government departments, the local authority or the regulator? Can you tell me about any
targets that are not set by outside bodies?
Score 1 Score 3 Score 5
Scoring grid: Goals focussed only on government targets and
achieving the budget
Some internal goals/ targets. But not that
comprehensive/ well‐integrated.
Goals are a balanced set of targets Clinical, Operational and
Patient Quality of Life Targets are well‐integrated
(10) Target inter‐connection (Targets) Tests whether targets are linked to overall objectives and how well they cascade down the organisation
a) “How are these goals determined?” OR “What is the motivation behind these goals?” b) How would you say these targets are linked to your organization’s long term goals or objectives? c) How are these targets cascaded down through the organisation – both to staff teams or to individual members of staff? d) Do departments/ individual members of staff have their own targets? If yes, how are they determined? How are these linked to the organisation’s overall
objective? Score 1 Score 3 Score 5
Scoring grid: Goals do not cascade down the organisation Goals do cascade, but only to some staff groups Goals increase in specificity as they cascade, ultimately
defining individual expectations, for all staff groups
(11) Time horizon of targets (Targets)
Tests whether organisation has a rational approach to planning and setting targets
a) What kind of time scale do your goals/ targets cover? b) Are the long term and short term goals set independently? How are these long‐term and short‐term goals linked together? c) Which goals receive the most emphasis – short‐term or long‐term? d) Do you think you could meet all your short‐run goals but miss your long‐run goals?
Score 1 Score 3 Score 5
45
Scoring grid: Top staff’s main focus is on short term targets There are short and long term goals for all levels
of the organisation. As they are set
independently, they are not necessarily linked to
each other
Long term goals are translated into specific short term targets
so that short term targets become a ‘staircase’ to reach long
term goals
(12) Target stretch (Targets) Tests whether targets are appropriately difficult to achieve
a) How tough are your targets? Do you feel pushed by them? b) On average, how often would you say that you meet your targets? c) Do you feel that all teams of staff are equally pushed in meeting their targets? Or do some groups get easier targets?
Score 1 Score 3 Score 5
Scoring grid: Goals are either too easy or impossible to
achieve, at least in part because they are set
with little involvement of key staff, e.g., simply
off historical performance
In most areas, senior staff push for aggressive
goals based, e.g., on external benchmarks, but
with little buy‐in from clinical staff. There are a
few sacred cows that are not held to the same
standard
Goals are genuinely demanding for all parts of the
organisation and developed in consultation with senior staff,
e.g., to adjust external benchmarks appropriately
(13) Clarity and comparability of targets (Monitoring)
Tests how easily understandable performance measures are and whether performance is openly communicated
a) If I asked someone on your staff directly about his or her individual targets, what would he or she tell me? b) Does anyone complain that the targets are too complex? c) How do people know how their own performance compares to other people’s performance?
Score 1 Score 3 Score 5
Scoring grid: Performance measures are complex and not
clearly understood, or only relate to
government targets. Individual performance is
not made public
Performance measures are well defined and
communicated; performance is public at all levels
but comparisons are discouraged
Performance measures are well defined, strongly
communicated and reinforced at all reviews; performance
and rankings are made public to induce competition

46
Talent Management
(14) Rewarding high performers (Incentives)
Tests whether good performance is rewarded proportionately
a) How does your appraisal system work? How does the staff pay relate to the result of this appraisal/ review? b) How do you reward the best performers, financially and non‐financially? c) How does the bonus system work? For both managers and non managers. d) Overall, how does your reward system compare to that at other comparable organisations?
Score 1 Score 3 Score 5
Scoring grid: Not much systematic appraisal and people are
rewarded equally irrespective of performance
level
There is an evaluation system for the awarding of
performance related rewards at the individual
level; these are mainly non‐financial and rewards
are always or never achieved
There is an evaluation system for the awarding of
performance related rewards, including personal financial
rewards
(15) Removing poor performers (Incentives)
Tests whether organisation is able to deal with underperformers
a) If you had a staff member who was struggling or could not do his or her job, what would you do? Can you give me a recent example? b) How long would underperformance be tolerated? c) Are there some members of staff members who seem to lead a charmed life? Do some individuals always just manage to avoid being fixed/fired?
Score 1 Score 3 Score 5
Scoring grid: Poor performers are rarely removed from their
positions
Suspected poor performers stay in a position for
more than a year before remedial action is taken
We move poor performers out of the agency or to less critical
roles as soon as a weakness is identified
(16) Promoting high performers (Incentives)
Tests whether promotion is performance based
a) Can you tell me about career progression and promotion system within your organisation? b) How would you identify and develop your star performers? c) What types of professional development opportunities are provided to staff? How are these personalised to meet individual needs? d) How would you balance between tenure/seniority and performance when it comes to making these decisions? Are better performers likely to be promoted faster
or are promotions given on the basis of tenure/seniority?
47
Score 1 Score 3 Score 5
Scoring grid: People are promoted primarily on the basis of
tenure
People are promoted upon the basis of
performance
We actively identify, develop and promote our top performers
(17) Managing talent (Targets)
Tests what emphasis is put on talent management
a) How do managers show that attracting talented individuals and developing their skills is a top priority? b) How do you ensure you have enough staff of the right type in your organisation? c) Where do you seek out and source staff? What strategies do you use to recruit the right people? d) Do senior members of staff get any rewards for bringing in and keeping talented people?
Score 1 Score 3 Score 5
Scoring grid: Senior staff do not communicate that attracting,
retaining and developing talent throughout the
organisation is a top priority
Senior management believe and communicate
that having top talent throughout the
organisation is key to good performance
Senior staff are evaluated and held accountable on the
strength of the talent pool they actively build
(18) Retaining talent (Incentives) Tests whether organisation will go out of its way to keep its top talent
a) If your best staff member wanted to leave, what would you do to persuade him or her to stay? b) Can you give me any examples of where star performers have been persuaded to stay? c) Can you give me any examples of where star performers have left without anyone trying to keep them?
Score 1 Score 3 Score 5
Scoring grid: We do little to try and keep our top talent We usually work hard to keep our top talent We do whatever it takes to retain our top talent across all
three staff groups
48
(19) Attracting talent (Incentives) Tests how strong the employee value proposition is
a) What makes it distinctive to work at your care home, as opposed to another, similar care home? b) Suppose I was a well‐qualified potential staff member that you wanted to hire, how would you persuade me to come and work for your organisation?
Score 1 Score 3 Score 5
Scoring grid: Our competitors offer stronger reasons for
talented people to join their care homes
Our value proposition to those joining our
department is comparable to those offered by
other care homes
We provide a unique value proposition to encourage talented
people join our department above our competitors