M. MAKMUN Profit Net Profit 6,5% terhadap penjualan 6,6% terhadap penjualan 5,6% 9,0% -2,1% SAMBUTAN...
30
-
Upload
trinhthuan -
Category
Documents
-
view
219 -
download
0
Transcript of M. MAKMUN Profit Net Profit 6,5% terhadap penjualan 6,6% terhadap penjualan 5,6% 9,0% -2,1% SAMBUTAN...

M. MAKMUN ARSYAD
SAMBUTAN
WAKIL PRESIDEN DIREKTUR

SAMBUTAN
konsumsi rumah tangga masih
mencatatkan pertumbuhan yang
positif, pola konsumsi konsumen
memperlihatkan adanya tren
perubahan.
Sumber : BPS
SAMBUTAN
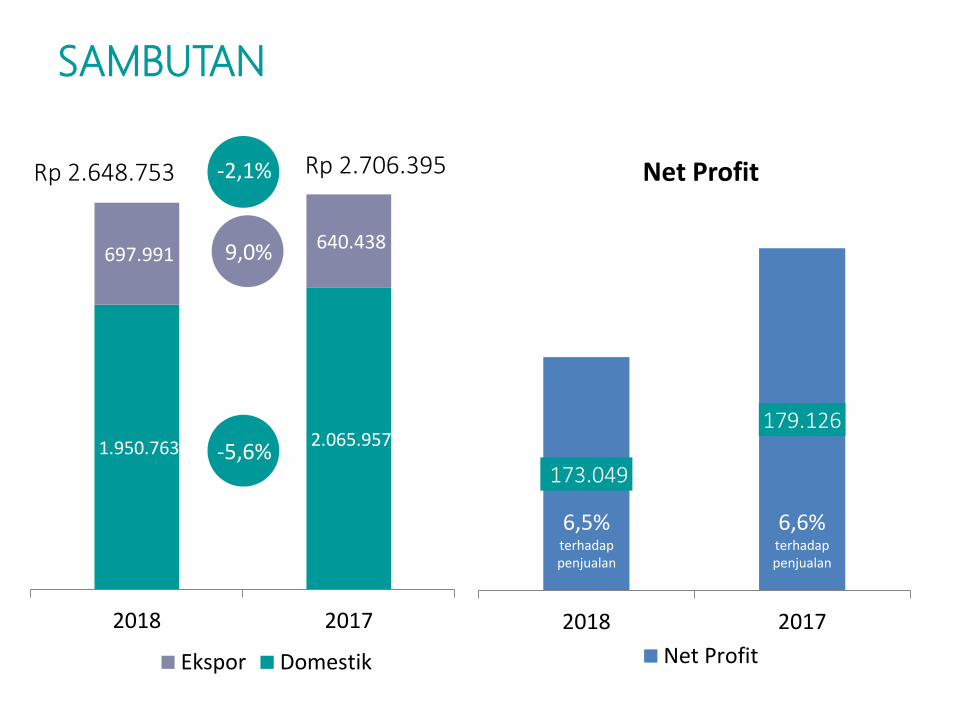
1.950.763 2.065.957
697.991 640.438
2018 2017
Ekspor Domestik
Rp 2.706.395 Rp 2.648.753
173.049
179.126
2018 2017
Net Profit
Net Profit
6,5% terhadap penjualan
6,6% terhadap penjualan
-5,6%
9,0%
-2,1%

SAMBUTAN
Pertumbuhan ekonomi Indonesia di
tahun 2019 diperkirakan akan tetap
baik dan berada pada kisaran
5,0-5,4%
perkiraan inflasi sebesar
3,5±1%

SAMBUTAN
Pengalaman
47 Tahun Tumbuh Bersama
Tenaga kerja yang handal
Investasi teknologi dan
produksi
Kemampuan untuk
memahami pasar
Dapat terus menawarkan
produk-produk berkualitas
tinggi

SAMBUTAN
Di sisi pasar global, terutama pasar ASEAN, kami yakin
mempunyai peluang yang cukup besar mengingat masih
banyak produk yang belum diperkenalkan ke pasar tersebut

SAMBUTAN
“Challenge, Change, Innovation” Target pertumbuhan penjualan
5-10%

MASAHIRO UEDA
PRESENTASI
DIREKTUR MANAGING
SENIOR
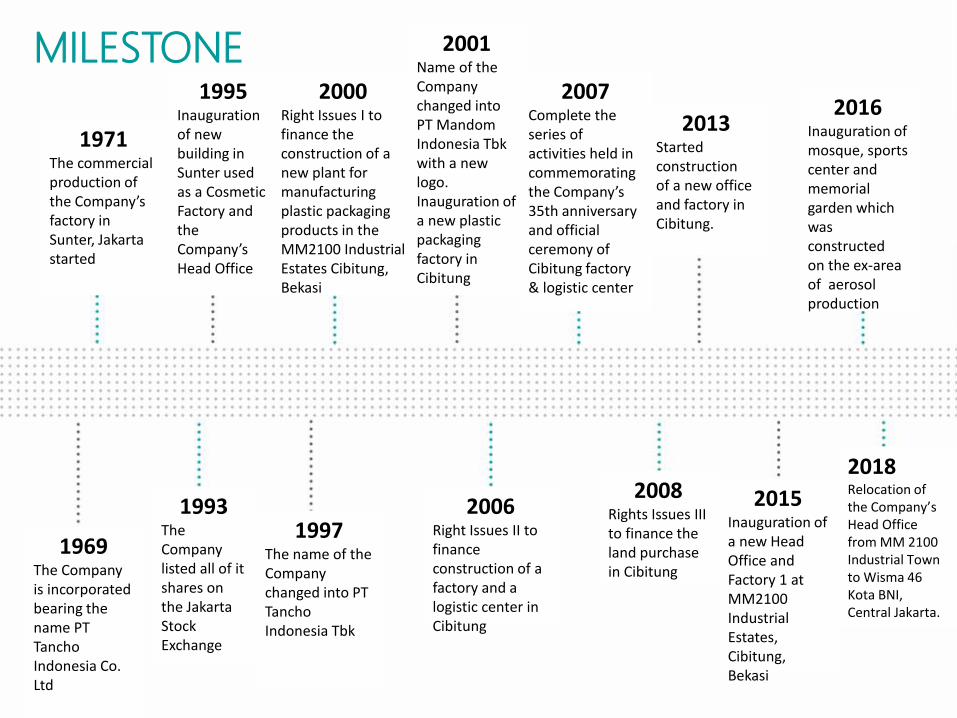
MILESTONE
1971 The commercial production of the Company’s factory in Sunter, Jakarta started
1969 The Company is incorporated bearing the name PT Tancho Indonesia Co. Ltd
1993 The Company listed all of it shares on the Jakarta Stock Exchange
1997 The name of the Company changed into PT Tancho Indonesia Tbk
2000 Right Issues I to finance the construction of a new plant for manufacturing plastic packaging products in the MM2100 Industrial Estates Cibitung, Bekasi
2001 Name of the Company changed into PT Mandom Indonesia Tbk with a new logo. Inauguration of a new plastic packaging factory in Cibitung
2006 Right Issues II to finance construction of a factory and a logistic center in Cibitung
2007 Complete the series of activities held in commemorating the Company’s 35th anniversary and official ceremony of Cibitung factory & logistic center
2008 Rights Issues III to finance the land purchase in Cibitung
2013 Started construction of a new office and factory in Cibitung.
2015 Inauguration of a new Head Office and Factory 1 at MM2100 Industrial Estates, Cibitung, Bekasi
1995 Inauguration of new building in Sunter used as a Cosmetic Factory and the Company’s Head Office
2016 Inauguration of mosque, sports center and memorial garden which was constructed on the ex-area of aerosol production
2018 Relocation of the Company’s Head Office from MM 2100 Industrial Town to Wisma 46 Kota BNI, Central Jakarta.

MISI MANDOM

Presiden Direktur / CEO Tatsuya Arichi Wakil Presiden Direktur Muhammad Makmun Arsyad Direktur Managing Senior Koichi Watanabe Direktur Managing Senior Masahiro Ueda Direktur - Independen Sanyata Adi Saputra Direktur Tiurma Rondang Sari Direktur Effendi Tandi Direktur Liandhajani Direktur Masahiro Ozaki Direktur Hiroshi Ito Direktur Keigo Kajiwara
MANAJEMEN PERSEROAN
Presiden Komisaris Shinichiro Koshiba Komisaris Motonobu Nishimura Komisaris Lie Harjono Komisaris Independen Herman Saleh Komisaris Independen Tesong Kim
DIREKSI
DEWAN KOMISARIS

INFORMASI PERSEROAN
FACTORY 1 Kawasan Industri MM2100
Jl. Irian Blok PP Bekasi 17520
FACTORY 2 Kawasan Industri MM2100
Jl. Jawa Blok J-9 Cibitung – Bekasi 17520
Wisma 46 Kota BNI Suite 7.01, 7th Floor
Jl. Jend. Sudirman Kav.1 Jakarta 10220
T: (021) 2980 9500 F: (021) 2980 9501 E: [email protected]

RINGKASAN POSISI KEUANGAN (FINANCIAL POSITION)
Laporan Posisi Keuangan 2018 2017 Statements of Financial
Position
Aset Lancar 1.333.428 1.276.479 Current Assets
Aset Tidak Lancar 1.111.715 1.085.328 Noncurrent Assets
Jumlah Aset 2.445.143 2.361.807 Total Assets
Liabilitas Jangka Pendek 231.534 259.807 Current Liabilities
Liabilitas Jangka Panjang 241.146 243.674 Noncurrent Liability
Ekuitas 1.972.463 1.858.326 Equity
Jumlah Liabilitas dan Ekuitas 2.445.143 2.361.807 Total Liabilities & Equity
Rasio Keuangan (%) 2018 2017 Financial Ratio
Rasio Lancar 575,9% 491,3% Current Ratio
Liabilitas/ Ekuitas 24,0% 27,1% Liabilities to Equity
Liabilitas/ Jumlah Aset 19,3% 21,3% Liabilities to Assets
Ekuitas/ Jumlah Aset 80,7% 78,7% Equity to Assets

RINGKASAN LABA RUGI (PROFIT LOSS)
2016 2015
Penjualan Bersih 2.648.754 2.706.395 Net Sales
Beban Pokok Penjualan 1.685.792 1.699.418 Cost of Goods Sold
Laba Bruto 962.963 1.006.977 Gross Profit
Laba Usaha 185.123 225.321 Operating Income
Laba Bersih 173.049 179.126 Net Income

INFORMASI SAHAM 18.150
17.400
17.800 17.700
17.275
16.900 17.000
18.000 18.000
17.200 17.200 17.250
Jan Feb Mar Apr Mei Jun Jul Ags Sep Okt Nov Des
JUMLAH SAHAM YANG DIKELUARKAN : 201.066.667 SAHAM
NILAI NOMINAL PER SAHAM : Rp 500/SAHAM
MODAL DISETOR : Rp 100.533.333.500
39.16% Public
Shareholders
60.84% Mandom
Corporation
Pada Januari 2019, Mandom Corporation, Jepang melakukan aktivitas pembelian saham sehingga kepemilikan saham Mandom Corporation, Jepang meningkat menjadi 126.278.585 lembar (62,80%).

CHART
874
2.708
806 891 861
2014 2015 2016 2017 2018
Laba Bersih per Saham
390 410 410 410 420
2014 2015 2016 2017 2018
Dividen per Saham

EFFENDI TANDI
PRESENTASI
DIREKTUR
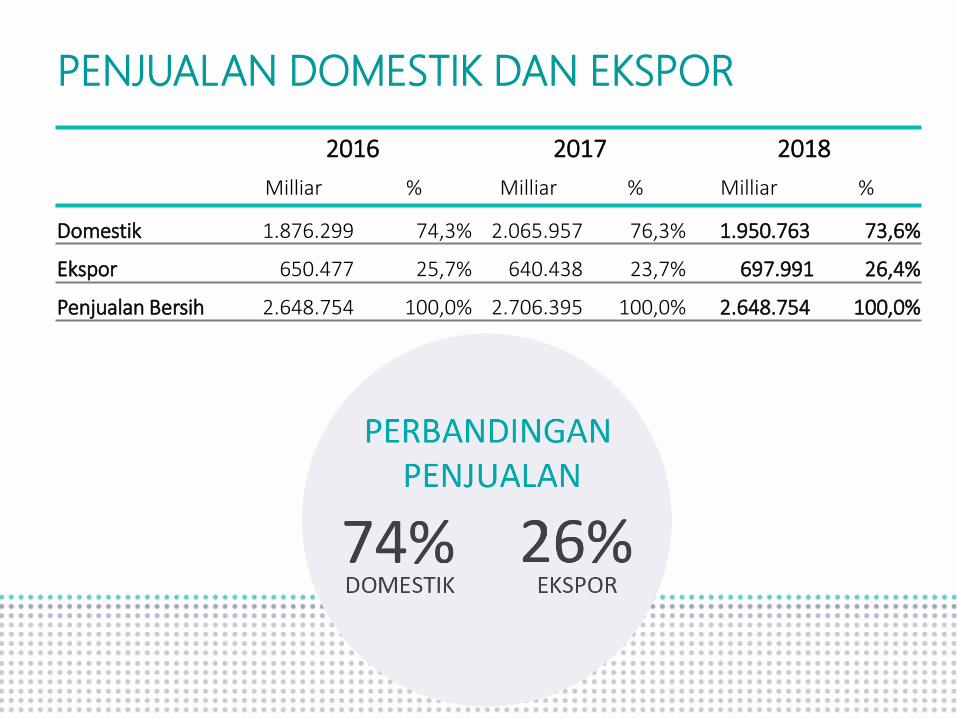
PENJUALAN DOMESTIK DAN EKSPOR
2016 2017 2018
Milliar % Milliar % Milliar %
Domestik 1.876.299 74,3% 2.065.957 76,3% 1.950.763 73,6%
Ekspor 650.477 25,7% 640.438 23,7% 697.991 26,4%
Penjualan Bersih 2.648.754 100,0% 2.706.395 100,0% 2.648.754 100,0%

PENJUALAN DOMESTIK
VS
MODERN MARKET
49,8% TRADITIONAL MARKET
50,2%

Mendorong penjualan Produk Baru;
Melakukan efisiensi dengan memfokuskan pada titik distribusi
yang telah ada agar setiap titik distribusi dapat bekerja secara
maksimal;
Terus melakukan beberapa program yang dinilai efektif;
Pendekatan dengan para
distributor maupun agen melalui program apresiasi.
STRATEGI PENJUALAN
DOMESTIK

PENJUALAN INTERNASIONAL
MANDOM GROUP
INDIA
Penjualan ke India meningkat sebesar 42,9%. Kenaikan dikontribusikan oleh peluncuran produk baru baik produk hairstyling maupun skin care.
Penurunan penjualan sub-kategori Hair Wax dan Hair Gel terjadi sebagai pengaruh perubahan tren gaya rambut ke arah pomade style. Kompetisi
di sub-kategori Pomade ini sangat ketat dengan maraknya produk-produk buatan China yang diproduksi dengan skala menengah maupun home
industry dan menawarkan harga yang sangat kompetitif.

PENJUALAN INTERNASIONAL
STRATEGI Lebih aktif memperkenalkan produk-produk yang telah diterima dengan baik di
pasar Indonesia ataupun di beberapa negara tujuan ekspor lain, tentunya dengan memperhatikan keinginan dan kebutuhan konsumen di masing masing
negara.

PENJUALAN PER KATEGORI
2016 2017 2018
Miliar % Miliar % Miliar %
Perawatan Rambut 1.053.480 41,7% 1.247.161 46,1% 1.125.784 42,5%
Perawatan kulit & rias 811.194 32,1% 906.976 33,5% 971.262 36,7%
Wangi-wangian 633.261 25,1% 523.292 19,3% 486.153 18,4%
Lain-lain 28.841 11,1% 28.966 1,1% 65.555 2,4%
Penjualan bersih 2.526.776 100,0% 2.706.395 100,0% 2.648.754 100,0%

PRODUK BARU
COSMETICS
PIXY 4 Beauty Benefits Series, PIXY Make It Glow Series, PIXY Tint Me & Twin
Blush
GENERAL
GATSBY Ultra Prime Series, GATSBY Urban Ice Deo Series, GATSBY Facial
Micro Foam, Pucelle Icy Gel Cologne, BIFESTA Micelar Water

AKTIVITAS IKLAN DAN PROMOSI
GATSBY Pomadic Party, GATSBY Nusantara Challenge, Synchronize Fest & 90’s Festival.

AKTIVITAS IKLAN DAN PROMOSI
PIXY Inspiring Beauty Talk, PIXY My Beauty My Energy Roadshow & PIXY One Fine Day bersama Beauty Influencer

AKTIVITAS IKLAN DAN PROMOSI
Pucelle Do It With Passion & Pucelle Hitsbae Stories
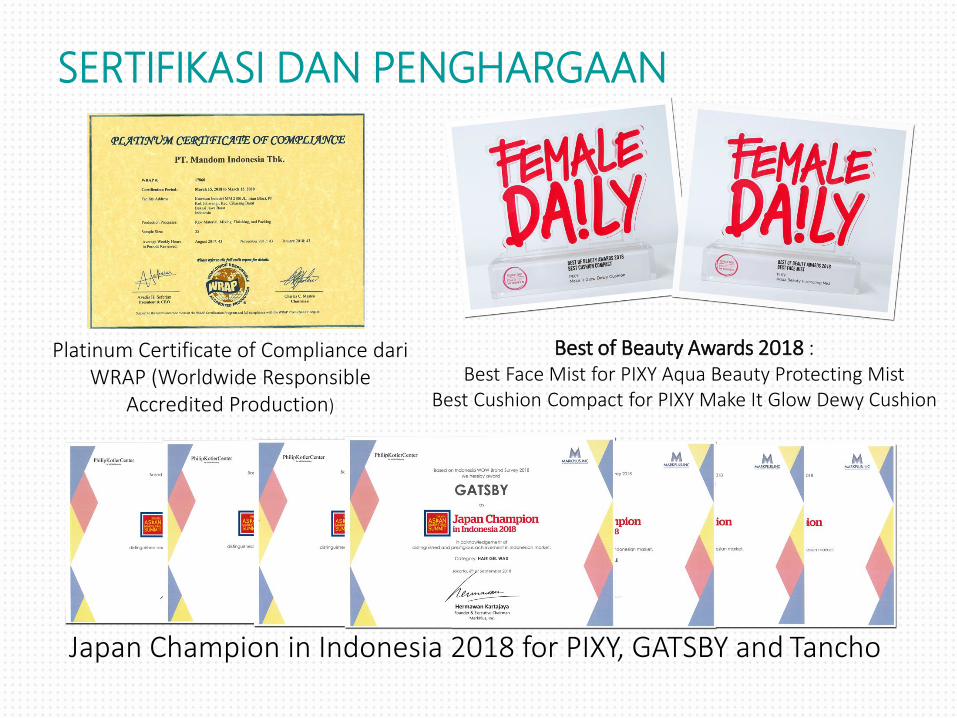
SERTIFIKASI DAN PENGHARGAAN
Best of Beauty Awards 2018 : Best Face Mist for PIXY Aqua Beauty Protecting Mist
Best Cushion Compact for PIXY Make It Glow Dewy Cushion
Platinum Certificate of Compliance dari WRAP (Worldwide Responsible
Accredited Production)
Japan Champion in Indonesia 2018 for PIXY, GATSBY and Tancho