Luria-Delbrück Estimation of Turnip mosaic virus … · Luria-Delbrück Estimation of Turnip...
11
1 1 Luria-Delbrück Estimation of Turnip mosaic virus 2 Mutation Rate in vivo 3 4 Francisca de la Iglesia, 1 Fernando Martínez, 1 Julia Hillung, 1 José M. 5 Cuevas, 1 Philip J. Gerrish, 2 José-Antonio Daròs, 1 and Santiago F. Elena 1,3,* 6 7 Instituto de Biología Molecular y Celular de Plantas, Consejo Superior de Investigaciones 8 Científicas-UPV, 46022 València, Spain 1 ; Center for Theoretical and Evolutionary 9 Immunology, University of New Mexico, Albuquerque NM 87131, USA 2 ; The Santa Fe Institute, 10 Santa Fe NM 87501, USA 3 11 12 Running title: Mutation rate in TuMV 13 Abstract word count: 57 14 Text word count: 1964 15 16 * Corresponding author. Mailing address: Instituto de Biología molecular y Celular de Plantas, 17 CSIC-UPV, Campus UPV CPI 8E, Ingeniero Fausto Elio s/n, 46022 València, Spain. Phone: 18 +34 963 877 895. Fax: +34 963 877 859. E-mail: [email protected]. 19 20
Transcript of Luria-Delbrück Estimation of Turnip mosaic virus … · Luria-Delbrück Estimation of Turnip...
1
1
Luria-Delbrück Estimation of Turnip mosaic virus 2
Mutation Rate in vivo 3
4 Francisca de la Iglesia,1 Fernando Martínez,1 Julia Hillung,1 José M. 5
Cuevas,1 Philip J. Gerrish,2 José-Antonio Daròs,1 and Santiago F. Elena1,3,* 6
7 Instituto de Biología Molecular y Celular de Plantas, Consejo Superior de Investigaciones 8
Científicas-UPV, 46022 València, Spain1; Center for Theoretical and Evolutionary 9
Immunology, University of New Mexico, Albuquerque NM 87131, USA2; The Santa Fe Institute, 10
Santa Fe NM 87501, USA3 11
12
Running title: Mutation rate in TuMV 13
Abstract word count: 57 14
Text word count: 1964 15
16
*Corresponding author. Mailing address: Instituto de Biología molecular y Celular de Plantas, 17
CSIC-UPV, Campus UPV CPI 8E, Ingeniero Fausto Elio s/n, 46022 València, Spain. Phone: 18
+34 963 877 895. Fax: +34 963 877 859. E-mail: [email protected]. 19
20
2
A potential drawback of recent antiviral therapies based on the transgenic 21
expression of artificial microRNAs is the ease with which viruses may generate escape 22
mutations. Using a variation of the classic Luria-Delbrück fluctuation assay, we estimated 23
that the spontaneous mutation rate in the artificial microRNA (amiR) target of a plant 24
virus was ca. 6×10⁻⁵ per replication event. 25
26
3
The rate of spontaneous mutation is a key parameter to understand the genetic structure of 27
populations over time. Mutation represents the primary source of genetic variation on which 28
natural selection and genetic drift operate. Although the exact value of mutation rate is 29
important for several evolutionary theories, accurate estimates are available only for a reduced 30
number of organisms (15). In the case of RNA viruses, mutation rates are orders of magnitude 31
higher than those of their DNA-based hosts (7). This high mutation rates have important 32
practical implications. For instance, for the long-term durability of vaccination strategies (6) 33
and antiviral drugs (2), for the stability of live attenuated vaccines (26), for the eventual success 34
of antiviral therapies based on the concept of lethal mutagenesis (1), or to determine the risk of 35
new emerging viruses (14). The spontaneous mutation rate of a virus can be evaluated in vivo 36
using a variety of experimental approaches. Among the most commonly used are: (i) estimating 37
the frequency of mutants contained in a population generated from a single clone (7, 23), (ii) 38
counting the number of mutant alleles accumulated in a locus which was protected against the 39
action of purifying selection (20, 25), (iii) counting the number of lethal alleles present in a 40
population (10), (iv) estimating the mean and variance in fitness declines among independent 41
lineages during a mutation-accumulation experiment and then applying the Mukai-Bateman 42
method (8), or (v) using a fluctuation assay (19). Among all, the latter is considered as the most 43
flexible, robust and reliable method (9). The fluctuation test, originally developed by Luria and 44
Delbrück (19), allows estimating the rate at which mutations arise in a genetic locus associated 45
to an easy-to-score phenotype. The estimates obtained are independent of generation time and 46
replication mode, factors that are not available for most RNA viruses. Advanced mathematical 47
tools for the analysis of the distribution of the number of mutants across replicated cultures (the 48
so-called Luria-Delbrück distribution) are readily available and easy to adapt to each 49
experimental design (9). 50
The transgenic expression of 21-nt long artificial microRNAs (amiR) complementary to 51
viral genomes has been proposed as a new antiviral strategy. Niu et al. (22) used the pre-52
miRNA159a precursor to engineer an amiR containing a sequence complementary to the RNA 53
4
genome of Turnip mosaic potyvirus (TuMV). Transgenic expression of this amiR in 54
Arabidopsis thaliana conferred high levels of specific resistance. Similarly, a gene-silencing 55
mechanism (RNAi) has been used in in vitro assays as antiviral therapeutics to inhibit the 56
replication of several human viruses (5, 11, 16). However, a major issue of these amiR-based 57
antiviral therapies has been the emergence of escape mutant viruses (3, 13, 17). These escape 58
variants differ from the wild-type virus by at least one point mutation in the 21-nt target, leading 59
to imperfect matching with the amiR. To evaluate the durability of amiR-mediated resistance in 60
plants, Lafforgue et al. (17) performed an evolution experiment in which multiple independent 61
lineages of TuMV were founded with an ancestral virus clone and allowed to evolve and 62
diversify by serial passages in two different hosts. The first host was a wild-type A. thaliana 63
and the second one the partially resistant 10-4 transgenic A. thaliana line that expressed amiR at 64
subinhibitory concentrations. Periodically, the evolving populations were used to challenge the 65
resistance of the 12-4 transgenic A. thaliana line, which was fully resistant to the ancestral 66
virus. It was found that all lineages evolved in wild-type plants accumulated mutations in the 67
amiR target and acquired the capacity to successfully infect 12-4 plants (17). The median time 68
for lineages evolved in wild-type plants to break resistance was 14 passages, while lineages 69
evolved in partially resistant plants only took 2 passages. The easiness to break this resistance 70
correlated to the existence of natural variation for the 21-nt target sequence (Lafforgue et al., 71
unpublished results), suggesting that this genomic region shall not be under strong purifying 72
selection. 73
The frequency at which mutations may be produced in the amiR target locus in evolving 74
TuMV populations is fundamenteal to understand the observed dynamics of resistance breaking. 75
Here, we report the results of a fluctuation assay experiment designed to evaluate the 76
spontaneous mutation rate at the amiR target locus of TuMV. In this case, the phenotype 77
associated to the mutants was the ability to replicate in the 12-4 transgenic plants expressing the 78
antiviral amiR. We used a modification of the analytical method proposed in (12) that provides 79
5
improved accuracy and is especially well suited to large populations and/or high mutation rates. 80
This method is a generalization of the statistical modeling developed by Lea and Coulson (18). 81
Fig. 1 shows a scheme of the experimental design for this fluctuation assay. A large 82
stock of infectious sap was obtained from Nicotiana benthamiana plants inoculated with a 83
plasmid containing TuMV cDNA (4, 17). This amplification step was necessary to overcome 84
the low efficiency infecting A. thaliana plants with the TuMV cDNA. Sap was obtained by 85
grinding infected tissues in a mortar with liquid N2 and 20 volumes of extraction buffer (50 mM 86
potassium phosphate pH 7.0, 3% polyethylene glycol 6000). One hundred wild-type A. 87
thaliana plants were inoculated with 5 µL sap containing 10% Carborundum applied on three 88
different leaves and gentle rubbing with a cotton swab (Fig. 1). After inoculation, plants were 89
maintained in a growth chamber (16 h light 25 ºC/8 h darkness 24 ºC). TuMV replicated and 90
systemically colonized the plants until reaching a population size of Ni, where the subscript 91
denotes the ith plant. From each of these plants, virus was extracted from symptomatic tissue 92
14 days post-inoculation (dpi), as described above. Heterogeneity in virus accumulation on 93
leafs of different age was minimized by pooling them into a single extraction. However, as only 94
a fraction of the virus-infected host tissues was extracted, only a fraction d of total virus 95
produced was obtained and successfully transmitted. This extract was divided into 10 parts, 96
each of which was used to inoculate a 12-4 resistant plant as described above; i.e., there were 10 97
resistant plants per each susceptible one (Fig. 1). Fourteen dpi, the number of resistant plants 98
on which infection was successfully established was recorded. From this vector of counts, R, a 99
mutation rate was estimated using the following procedure. The number of mutants after 100
growth and extraction from wild-type plants has a distribution whose probability generating 101
function is (12): 102
ℎ 𝑧 = 𝑝 − 𝑝𝑧!!!"
!!!!!"!!!, 103
6
where p = d/10 is the total dilution factor (dilution due to extraction, d, and dilution due to 104
partitioning the extract into 10 parts), µ is mutation rate per amiR target locus, and z denotes the 105
argument of the generating function h(·). 106
Infection is not a deterministic process, and a single virion has probability q of infecting a 107
plant and 1 – q of not doing so. If the diluted inoculum contains m mutants, then the probability 108
of not establishing an infection on the 12-4 resistant plants is 1 − 𝑞 !. The number of mutants 109
is unknown and so is treated as a random variable, and the total probability of not establishing 110
an infection is therefore 1 − 𝑞 !!!!! 𝜙 𝑚 , where 𝜙 𝑚 is the mth coefficient in the 111
expansion of h(z). The total probability of not establishing infection is therefore h(1 – q). Since 112
the probability of establishing an infection is 50% when 1 − 1 − 𝑞 !!.! = !!, where λ0.5 is the 113
median infectious dose, the parameter q may thus be calculated as 𝑞 = 1 − 2!! !!.!. 114
The log-likelihood function for µ is thus 𝑙 𝜇 𝑹,𝑁! ,𝑑, 𝜆!.! = log𝜉 𝑖!"""!!! , where 100 × 115
10 = 1000 is the total number of resistant plants used in the fluctuation assay and 116
𝜉 𝑖 = ℎ 1 − 𝑞 if the 𝑖th plant is not infected1 − ℎ 1 − 𝑞 if the 𝑖th plant is infected.
This function is maximized at µ = 𝜇, the maximum likelihood (ML) estimate of the mutation 117
rate. Therefore, in addition to the vector R with the counts of infected 12-4 plants for each 118
wild-type plant, the other relevant parameters to be experimentally determined are Ni (i = 1, …, 119
100), d and λ0.5. 120
First, the concentration of TuMV genomic (+) RNA strand in the original stock as well as 121
resulting from each of the 100 wild-type A. thaliana (e.g., Ni) was measured by absolute RT-122
qPCR using an external standard as described in (21). In short, the standard curve was 123
constructed using 1/5-fold dilution intervals of TuMV (+)-RNA in the range from 1.28×10⁸ to 124
4×10⁴ molecules. Aliquots of 100 ng of total RNA were reverse transcribed in triplicate in the 125
presence of 250 nM of primer PI (5’-TAACCCCTTAACGCCAAGTAAG-3’, sequence 126
7
complementary to TuMV GenBank accession AF530055.2 positions 9599-9620) with M-MuLV 127
reverse transcriptase (Fermentas) in 20 µL reactions for 10 min at 25 ºC, 45 min at 42 ºC and 5 128
min at 50 ºC. Reactions were stopped by heating at 72 ºC for 15 min. Sequence specific qPCRs 129
were performed with 2 µL of the reverse transcription products in 20 µL final volume using the 130
Maxima SYBR Green Master Mix reagent (Fermentas) and primers PI and PII (5’-131
CAATACGTGCGAGAGAAGCACAC-3’, sequence homologous to TuMV positions 9448-132
9470) at 95 ºC for 10 min followed by 40 cycles of 15 s at 95 ºC and 1 min at 60 ºC. 133
Considering the total aerial plant masses (see below), measured Ni values ranged from 134
3.845×10¹⁰ to 3.429×10¹¹, with an average value of 1.226×10¹¹ TuMV (+) RNA molecules per 135
plant (95% CI around the mean: 1.110×10¹¹ – 1.341×10¹¹). 136
Second, the dilution factor d was approximated as the fraction of wild-type plant tissue 137
used to generate the sap that was later used to inoculate the corresponding set of 12-4 resistant 138
plants. On average, the aerial part of the infected wild-type plants weighted 0.922±0.090 g (±1 139
SEM) and the average weight of the tissue ground to produce the 100 inocula was 0.122±0.007 140
g, which corresponds to a dilution factor of d = 0.132±0.021. 141
Third, a dose-infectivity assay was used to evaluate λ0.5. To do so, the original TuMV 142
stock was serially diluted with 1/5-fold intervals in the range 1/1 – 1/500 and each dilution was 143
used to inoculate sets of 10 plants. Twenty dpi the number of symptomatic plants was recorded. 144
Infectivity data were subjected to a probit analysis that rendered an estimate of the median 145
infectious dose of λ0.5 = 8.826×10⁶ TuMV genomes per 12-4 plant (95% CI: 4.543×10⁶ – 146
1.779×10⁷; goodness of fit test: χ2 = 2.694, 5 d.f., P = 0.747). 147
Finally, the fluctuation assay rendered the following results. From a total of 100 wild-148
type A. thaliana plants used as source a of TuMV inocula, only 11 contained escape mutants 149
that produced at least one 12-4 plant infected (five cases of 1/10 and two cases of 2/10, 3/10, 150
and 5/10). Feeding all data to the ML algorithm, the estimate of the mutation rate for the amiR 151
target locus was 𝜇 = 5.545×10⁻⁵ mutations per replication event (95% CI: 2.886×10−
5 – 152
8
9.507×10⁻⁵). Since the amiR target is 21-nt long, this estimate can be expressed in a more 153
common per nucleotide scale as 2.640×10⁻⁶ s/n/r (95% CI: 1.374×10−
6 – 4.527×10⁻⁶). This 154
empirical estimate is between 17 to 30 times lower than the value suggested by the simulations 155
performed by Lafforgue et al. (17), which given the many assumptions behind the simulations, 156
can be considered a reasonable discrepancy. 157
Direct estimates of mutation rates for plant RNA viruses are scarcer than for their animal 158
and bacterial counterparts. The first estimate ever reported for a plant virus was for Tobacco 159
mosaic virus and it was ca. 1.8×10⁻⁵ s/n/r (20). Later on, the mutation rate for Tobacco etch 160
virus (TEV) was estimated to range between 2.960×10⁻⁵ (23) to 4.754×10−
6 s/n/r (25). Our data 161
for TuMV are in good agreement with those reported for TEV, another potyvirus. Furthermore, 162
all these estimates are well within the range 10−6 to 10−
4 recently reported for several animal 163
RNA viruses and bacteriophages (24). All together, the recent estimates obtained for plant 164
RNA viruses and the reanalyzes made of previous data (24) suggest that the mutation rate of 165
RNA viruses may be lower than previously proposed (7). 166
167
This work was supported by grants BFU2009-06993 from the Spanish Ministerio de 168
Ciencia e Innovación, RGP12/2008 from Human Frontier Science Program Organization and 169
PROMETEO2010/019 from Generalitat Valenciana to S.F.E., by CSIC grant 2010TW0015 to 170
J.A.D., and by USA National Institutes of Health grants R01GM079843-01 and ARRA 171
PDS#35063 and by EC grant FP7231807 to P.J.G. F.M. was supported by a fellowship from 172
Universidad Politénica de Valencia, J.H. was supported by a fellowship from the Spanish 173
Ministerio de Ciencia e Innovación, and J.M.C. was contracted under the CSIC JAE-Doc 174
program. 175
176
REFERENCES 177
9
1. Anderson, J. P., R. Daifuku, and L. A. Loeb. 2004. Viral error catastrophe by mutagenic 178
nucleosides. Annu. Rev. Microbiol. 58:183-205. 179
2. Arribas, M., L. Cabanilles, and E. Lázaro. 2011. Identification of mutations conferring 5-180
azacytidine resistance in bacteriophage Qβ. Virology 417:343-352 181
3. Boden, D., O. Pusch, F. Lee, L. Tucker, and B. Ramratnam. 2003. Human 182
immunodeficiency virus type 1 escape from RNA interference. J. Virol. 77:11531-11535. 183
4. Chen, C. C., et al. 2003. Identification of Turnip mosaic virus isolates causing yellow stripe 184
and spot on calla lily. Plant Dis. 87:901-905. 185
5. Coburn, G. A., and B. R. Cullen. 2002. Potent and specific inhibition of Human 186
immunodeficiency virus type 1 replication by RNA interference. J. Virol. 76:9225-9231. 187
6. Davenport, M. P., L. Loh, J. Petravic, and S. J. Kent. 2008. Rates of HIV immune escape 188
and reversion: implications for vaccination. Trends Microbiol. 16:561-566. 189
7. Drake, J. W., and J. J. Holland. 1999. Mutation rates among RNA viruses. Proc. Natl. 190
Acad. Sci. USA 96:13910-13913. 191
8. Elena, S. F., and A. Moya. 1999. Rate of deleterious mutation and the distribution of its 192
effects on fitness in Vesicular stomatitis virus. J. Evol. Biol. 12:1078-1088. 193
9. Foster, P. L. 2006. Methods for determining spontaneous mutation rates. Meth. Enzymol. 194
409:195-213. 195
10. Gago, S., S. F. Elena, R. Flores, and R. Sanjuán. 2009. Extremely high mutation rate of a 196
hammerhead viroid. Science 323:1308. 197
11. Ge, Q., M. T., et al. 2003. RNA interference of Influenza virus production by directly 198
targeting mRNA for degradation and indirectly inhibiting all viral RNA transcription. Proc. 199
Natl. Acad. Sci. USA 100:2718-2723. 200
12. Gerrish, P. J. 2008. A simple formula for obtaining markedly improved mutation rate 201
estimates. Genetics 180:1773-1778. 202
13. Gitlin, L., and R. Andino. 2005. Poliovirus escape from RNA interference: short interfering 203
RNA-target recognition and implications for therapeutic approaches. J. Virol. 79:1027-1035. 204
10
14. Holmes, E. C. 2009. The evolutionary genetics of emerging viruses. Annu. Rev. Ecol. Evol. 205
Syst. 40:353-372. 206
15. Kondrashov, F. A., and A. S. Kondrashov. 2010. Measurements of spontaneous rates of 207
mutation in recent past and the near future. Phil. Trans. R. Soc. B 365:1169-1176 208
16. Krönke, J., et al. 2004. Alternative approaches for efficient inhibition of Hepatitis C virus 209
RNA replication by small interfering RNAs. J. Virol. 78:3436-3446. 210
17. Lafforgue, G., et al. 2011. Tempo and mode of plant RNA virus escape from RNA 211
interference-mediated resistance. J. Virol. 85:9686-9695. 212
18. Lea, D. E., and C. A. Coulson. 1949. The distribution of the numbers of mutants in 213
bacterial populations. J. Genetics 49:264-285. 214
19. Luria, S. E., and M. Delbrück. 1943. Mutations of bacteria from virus sensitivity to virus 215
resistance. Genetics 28:491-511. 216
20. Malpica, J. M., et al. 2002. The rate and character of spontaneous mutation in an RNA 217
virus. Genetics 162:1505-1511. 218
21. Martínez, F., J. Sardanyés, S. F. Elena, and J. A. Daròs. 2011. Dynamics of a plant RNA 219
virus intracellular accumulation: stamping machine vs. geometric replication. Genetics 220
188:637-646. 221
22. Niu, Q., et al. 2006. Expression of artificial microRNAs in transgenic Arabidopsis thaliana 222
confers virus resistance. Nat. Biotech. 24:1420-1428. 223
23. Sanjuán, R., P. Agudelo-Romero, and S. F. Elena. 2009. Upper limit mutation rate 224
estimation for a plant RNA virus. Biol. Lett. 5:394-396. 225
24. Sanjuán, R., M. R. Nebot, N. Chirico, L. M. Mansky, and R. Belshaw. 2010. Viral 226
mutation rates. J. Virol. 84:9733-9748. 227
25. Tromas, N., and S. F. Elena. 2010. The rate and spectrum of spontaneous mutations in a 228
plant RNA virus. Genetics 185:983-989. 229
26. Vignuzzi, M., E. Wendt, and R. Andino. 2008. Engineering attenuated virus vaccines by 230
controlling replication fidelity. Nat. Med. 14:154-161. 231
232
11
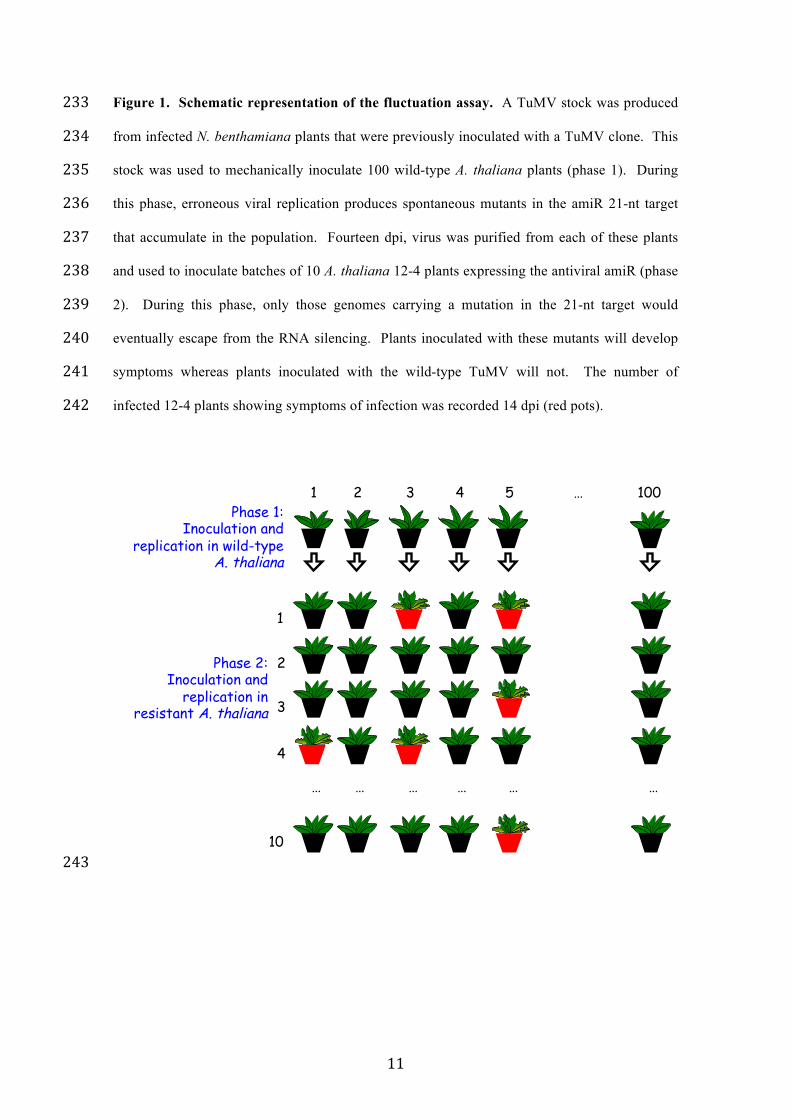
Figure 1. Schematic representation of the fluctuation assay. A TuMV stock was produced 233
from infected N. benthamiana plants that were previously inoculated with a TuMV clone. This 234
stock was used to mechanically inoculate 100 wild-type A. thaliana plants (phase 1). During 235
this phase, erroneous viral replication produces spontaneous mutants in the amiR 21-nt target 236
that accumulate in the population. Fourteen dpi, virus was purified from each of these plants 237
and used to inoculate batches of 10 A. thaliana 12-4 plants expressing the antiviral amiR (phase 238
2). During this phase, only those genomes carrying a mutation in the 21-nt target would 239
eventually escape from the RNA silencing. Plants inoculated with these mutants will develop 240
symptoms whereas plants inoculated with the wild-type TuMV will not. The number of 241
infected 12-4 plants showing symptoms of infection was recorded 14 dpi (red pots). 242
243
… 1 2 3 100 4 5Phase 1:
Inoculation and replication in wild-type
A. thaliana
1
2
3
4
…
10
… … … … …
Phase 2: Inoculation and
replication in resistant A. thaliana