Long-term Forecasting Problems of the Latvian Energy Sector Development
43
Long-term Forecasting Problems of the Latvian Energy Sector Development M. oec. E. Zeberga, Prof., Dr. habil. ing. V. Zebergs, Prof., Dr. habil. ing. N. Zeltins Institute of Physical Energetics of Latvian Academy of Science Aizkraukles St.21, Riga LV-1006, Latvia Phone: (371)7558636 or 9363105; Fax (371) 7557671 E-mail: zeltinsh @ edi . lv
-
Upload
hilliard-schwarz -
Category
Documents
-
view
18 -
download
0
description
Long-term Forecasting Problems of the Latvian Energy Sector Development. M. oec. E. Zeberga, Prof., Dr. habil. ing. V. Zebergs, Prof., Dr. habil. ing. N. Zeltins Institute of Physical Energetics of Latvian Academy of Science Aizkraukles S t.21, Riga LV-1006, Latvia - PowerPoint PPT Presentation
Transcript of Long-term Forecasting Problems of the Latvian Energy Sector Development

Long-term Forecasting Problems of the Latvian
Energy Sector DevelopmentM. oec. E. Zeberga, Prof., Dr. habil. ing. V. Zebergs,
Prof., Dr. habil. ing. N. Zeltins
Institute of Physical Energetics of Latvian Academy of Science
Aizkraukles St.21, Riga LV-1006, Latvia
Phone: (371)7558636 or 9363105; Fax (371) 7557671
E-mail: [email protected]
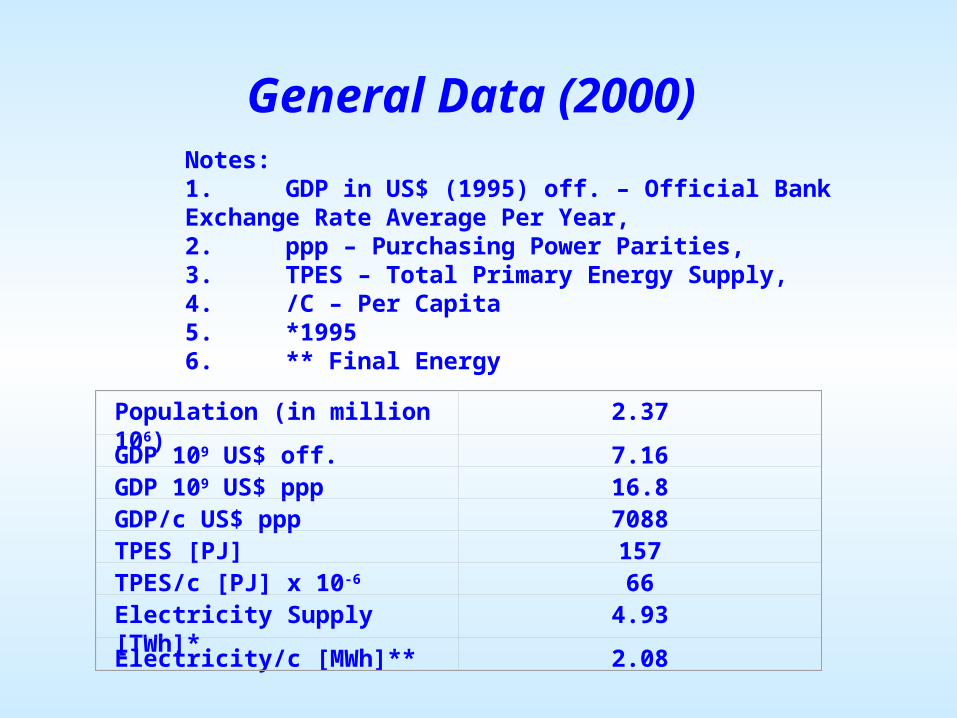
General Data (2000)Notes:1. GDP in US$ (1995) off. – Official Bank Exchange Rate Average Per Year,2. ppp – Purchasing Power Parities,3. TPES – Total Primary Energy Supply,4. /C – Per Capita5. *19956. ** Final Energy
Population (in million 106) 2.37
GDP 109 US$ off. 7.16GDP 109 US$ ppp 16.8GDP/c US$ ppp 7088TPES [PJ] 157TPES/c [PJ] x 10-6 66Electricity Supply [TWh]* 4.93
Electricity/c [MWh]** 2.08
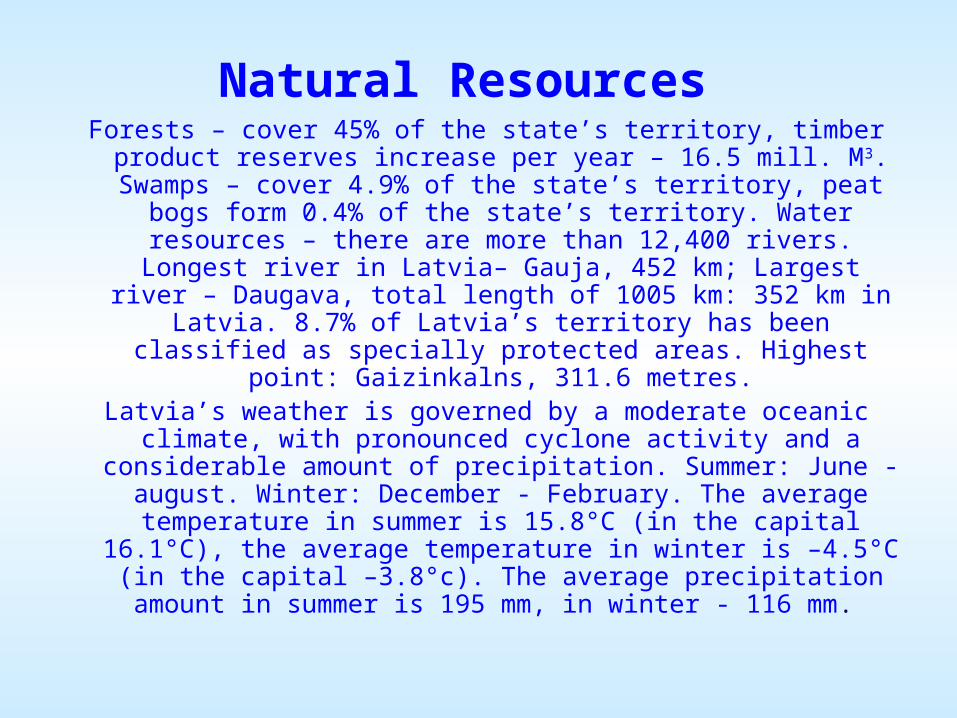
Natural Resources Forests – cover 45% of the state’s territory, timber product reserves increase per year – 16.5 mill. M3. Swamps – cover
4.9% of the state’s territory, peat bogs form 0.4% of the state’s territory. Water resources – there are more than 12,400 rivers. Longest river in Latvia– Gauja, 452 km; Largest river – Daugava, total length of 1005 km: 352 km in Latvia. 8.7% of Latvia’s territory has been classified as specially protected
areas. Highest point: Gaizinkalns, 311.6 metres.Latvia’s weather is governed by a moderate oceanic climate,
with pronounced cyclone activity and a considerable amount of precipitation. Summer: June - august. Winter: December - February. The average temperature in summer is 15.8°C (in the capital 16.1°C), the average temperature in winter is –
4.5°C (in the capital –3.8°c). The average precipitation amount in summer is 195 mm, in winter - 116 mm.
Basic Goals As it moves into the 21st century, Latvia is clearly on a path to
convergence with the EU. For Latvia, membership in the European union and NATO are not ends in themselves, but simply means to accomplish a greater goal – participation
in a united Europe, whole and free. Latvia has sought membership in NATO in order to make its contribution to
the formation of European security policy. In the development of Latvia’s security policies, Latvian
governments have focused on regional co-operation and European integration, while building a special relationship
with the united states in order to strengthen the transatlantic aspect of its security policy.
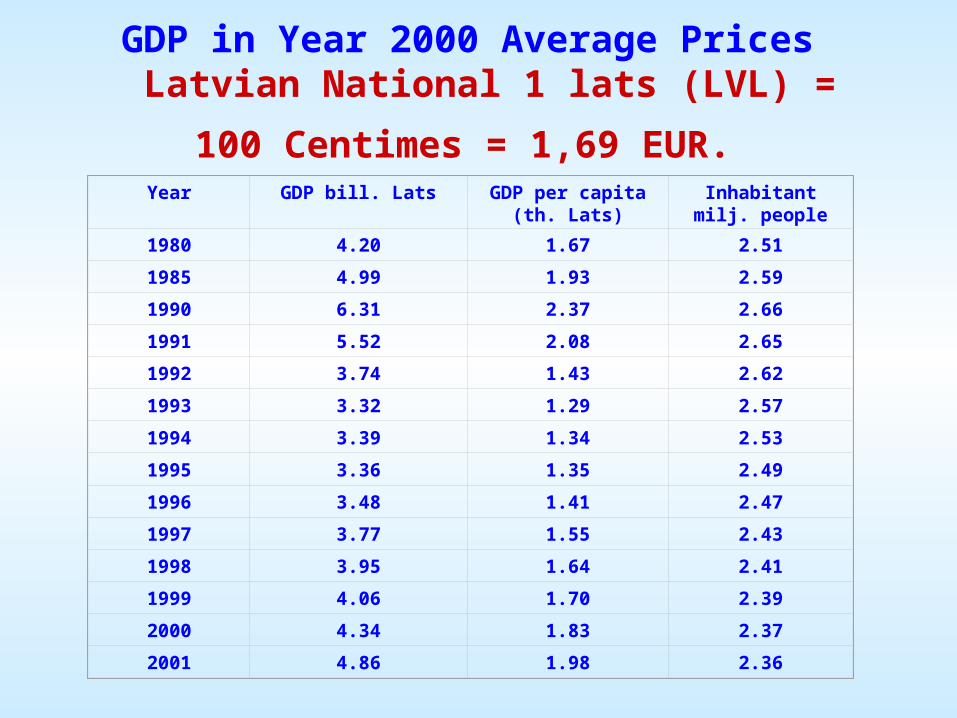
GDP in Year 2000 Average Prices Latvian National 1 lats (LVL) = 100 Centimes =
1,69 EUR. Year GDP bill. Lats GDP per capita
(th. Lats)Inhabitant milj.
people
1980 4.20 1.67 2.51
1985 4.99 1.93 2.59
1990 6.31 2.37 2.66
1991 5.52 2.08 2.65
1992 3.74 1.43 2.62
1993 3.32 1.29 2.57
1994 3.39 1.34 2.53
1995 3.36 1.35 2.49
1996 3.48 1.41 2.47
1997 3.77 1.55 2.43
1998 3.95 1.64 2.41
1999 4.06 1.70 2.39
2000 4.34 1.83 2.37
2001 4.86 1.98 2.36
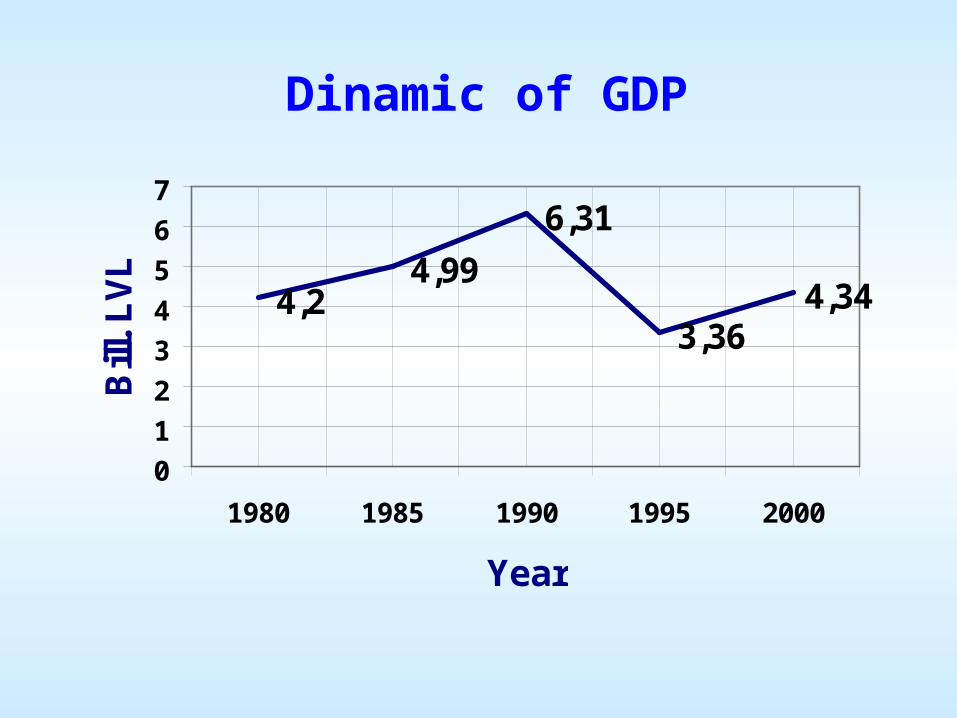
Dinamic of GDP
4,24,99
6,31
3,364,34
0
1
2
3
4
5
6
7
1980 1985 1990 1995 2000
Year
Bill
. L
VL
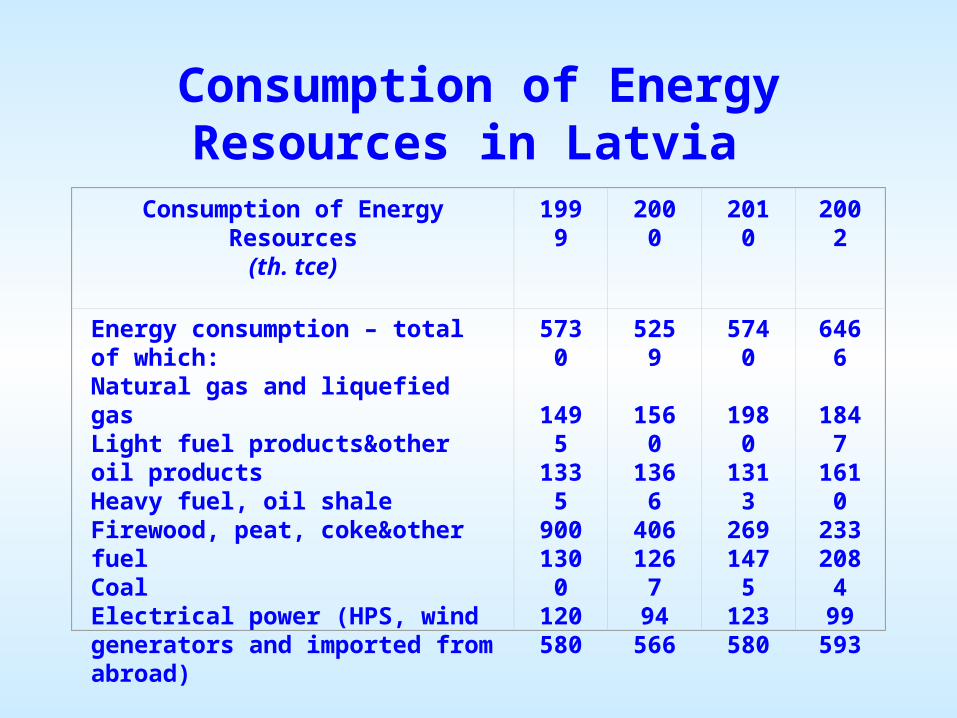
Consumption of Energy Resources in Latvia
Consumption of Energy Resources
(th. tce)
1999 2000 2010 2002
Energy consumption – totalof which:Natural gas and liquefied gasLight fuel products&other oil products Heavy fuel, oil shaleFirewood, peat, coke&other fuelCoalElectrical power (HPS, wind generators and imported from abroad)
5730
14951335900
1300120580
5259
15601366406
126794
566
5740
19801313269
1475123580
6466
18471610233
208499
593
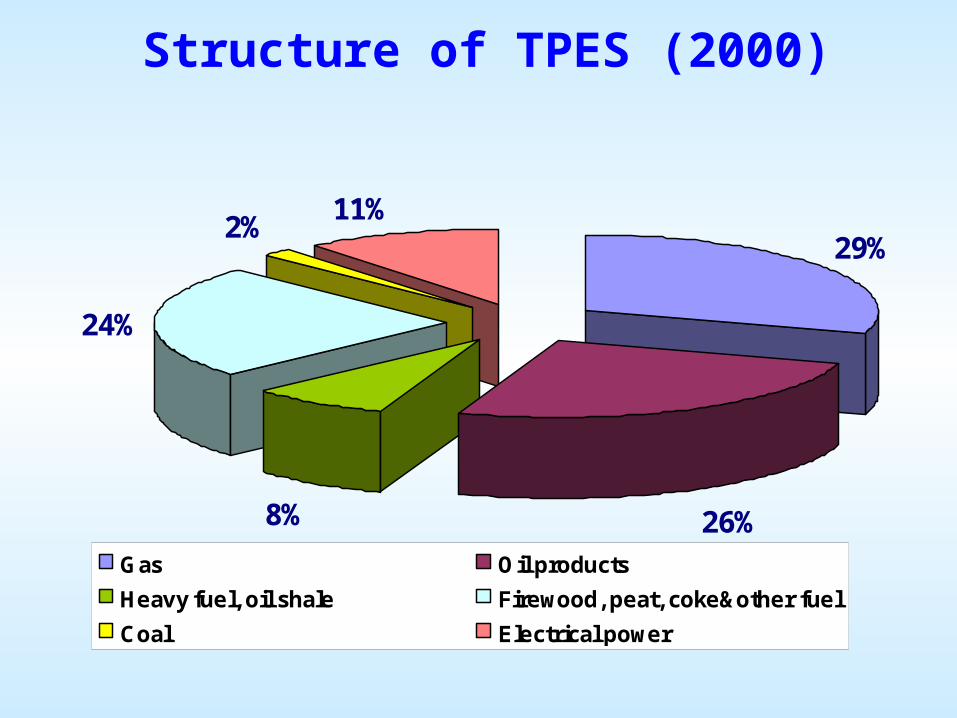
29%
26%8%
24%
2%11%
Gas Oil products
Heavy fuel, oil shale Firewood, peat, coke&other fuel
Coal Electrical power
Structure of TPES (2000)

Electricity Supply in Latvia
Components of electricity supply (billion kWh)
1999 2000 2001 2002
Total electricityGeneration – totalof which:Large scale HPPCHPBlock stations&other equipmentSmall HPSWind generatorsImport of electricity – total
6.0654.110
2.7441.2220.1280.0140.0021.955
5.9224.136
2.7991.1630.1500.0200.0041.786
6.1634.280
2.8011.2460.1980.0320.0031.883
6.323.98
2.431.240.260.030.012.35

Production Electricity by Latvian HPP
Year Total electricity consumption TWh
Production of HPP
TWh %
1995 6.2 3.2 52
1996 6.4 2.2 34
1997 6.3 3.5 56
1998 6.3 4.1 65
1999 6.1 3.1 51
2000 5.9 3.2 54
2001 6.2 3.1 50
2002 6.3 2.8 44
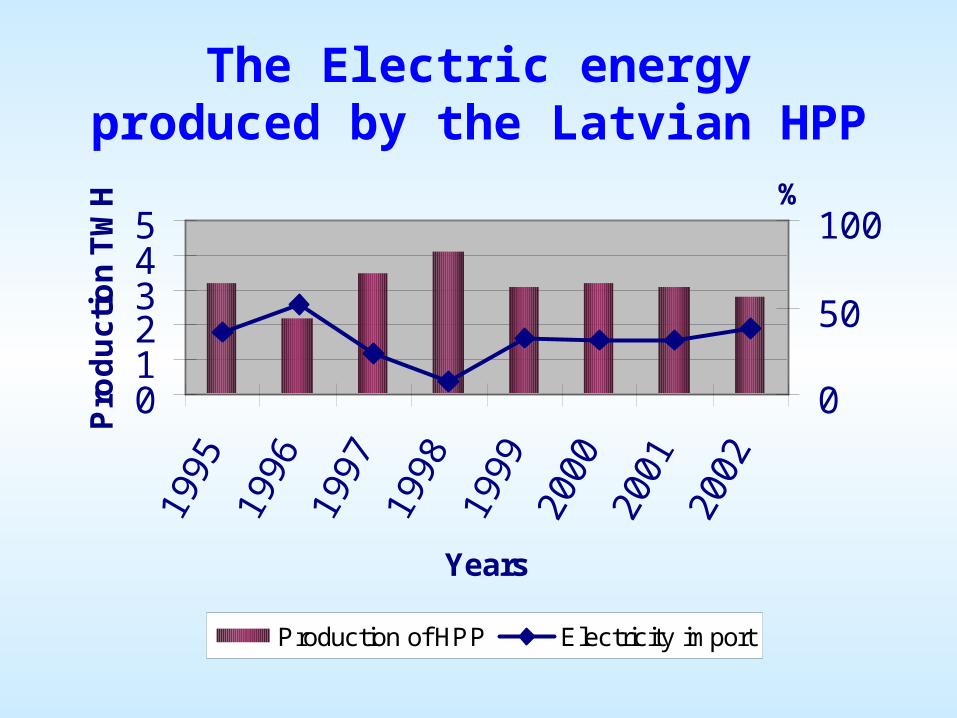
The Electric energy produced by the Latvian HPP
012345
Years
Pro
du
cti
on
TW
H
0
50
100
Production of HPP Electricity import
%
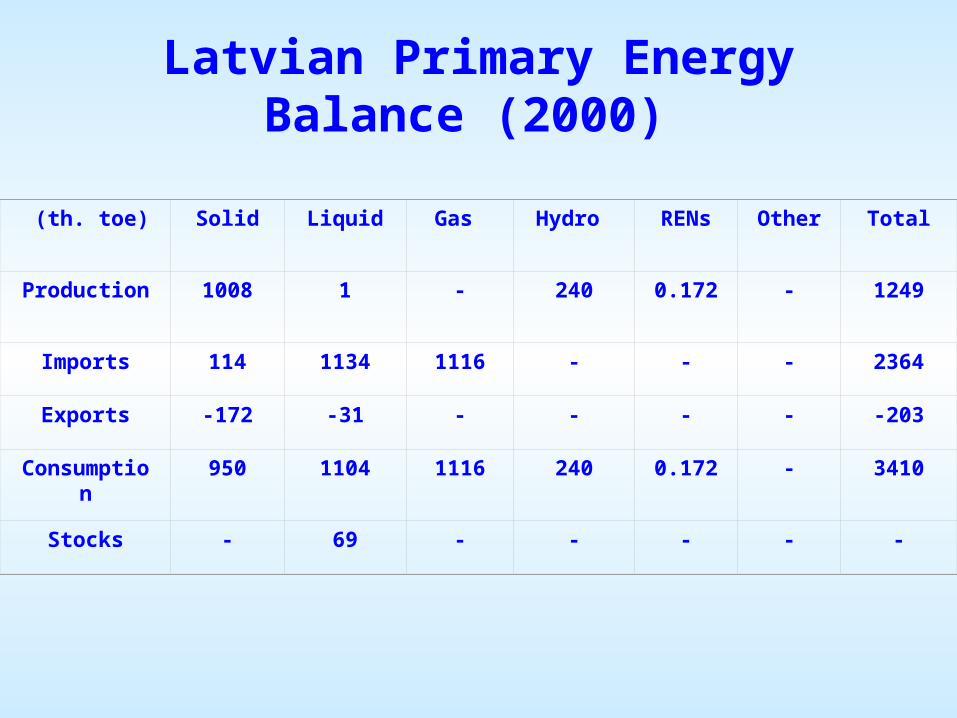
Latvian Primary Energy Balance (2000)
(th. toe) Solid Liquid Gas Hydro RENs Other Total
Production 1008 1 - 240 0.172 - 1249
Imports 114 1134 1116 - - - 2364
Exports -172 -31 - - - - -203
Consumption 950 1104 1116 240 0.172 - 3410
Stocks - 69 - - - - -
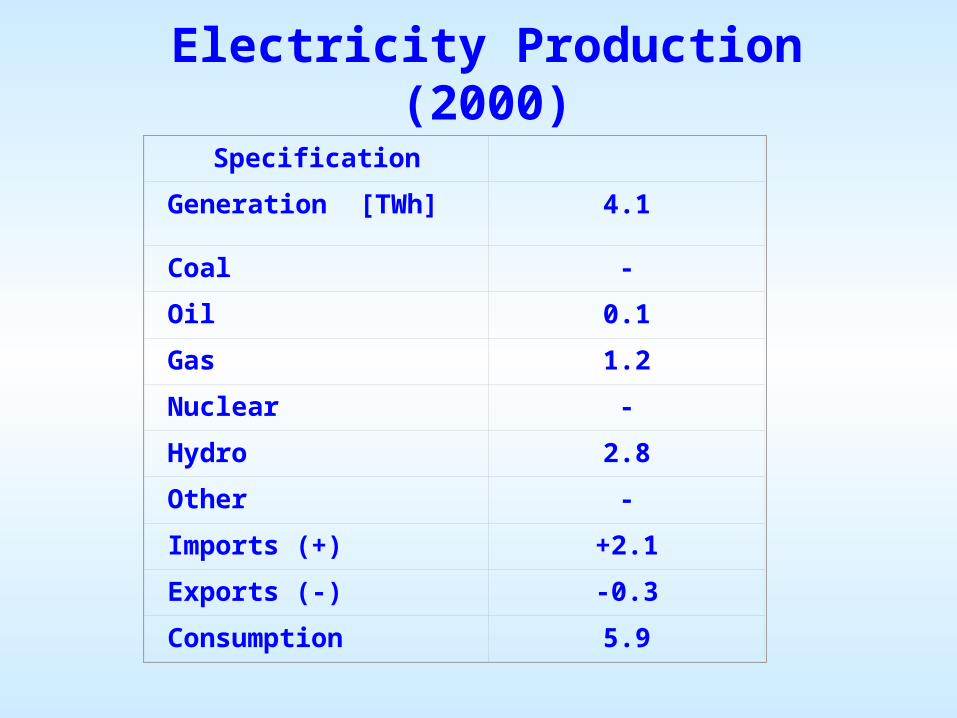
Electricity Production (2000)
Specification
Generation [TWh] 4.1
Coal -
Oil 0.1
Gas 1.2
Nuclear -
Hydro 2.8
Other -
Imports (+) +2.1
Exports (-) -0.3
Consumption 5.9
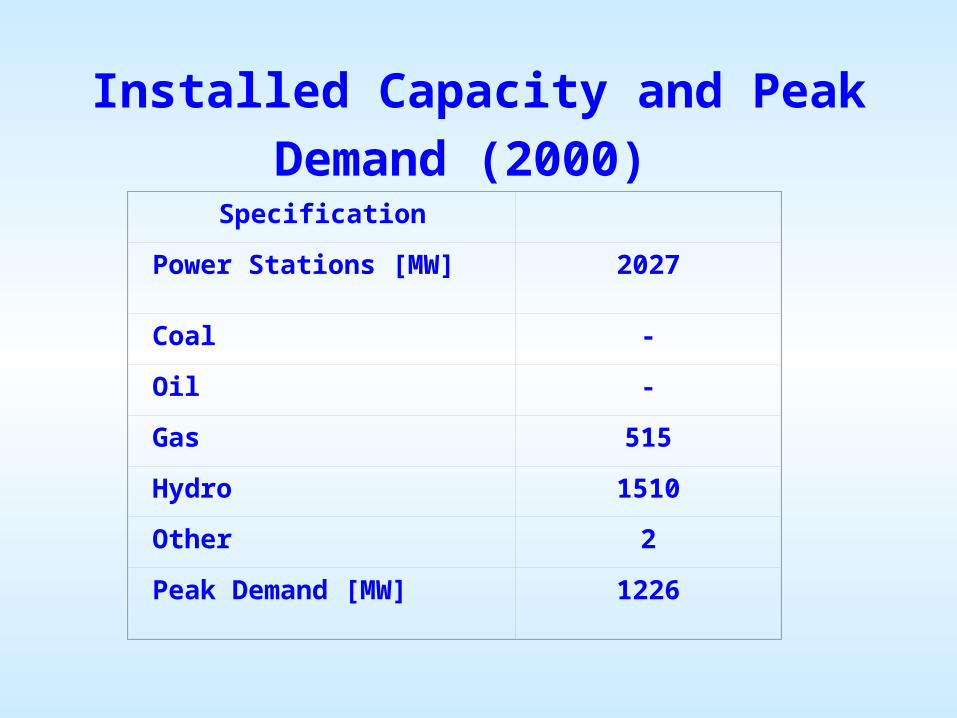
Installed Capacity and Peak Demand
(2000) Specification
Power Stations [MW] 2027
Coal -
Oil -
Gas 515
Hydro 1510
Other 2
Peak Demand [MW] 1226

75%
0,1%25%
Gas Hydro Others
Installed Power Capacity (2000)
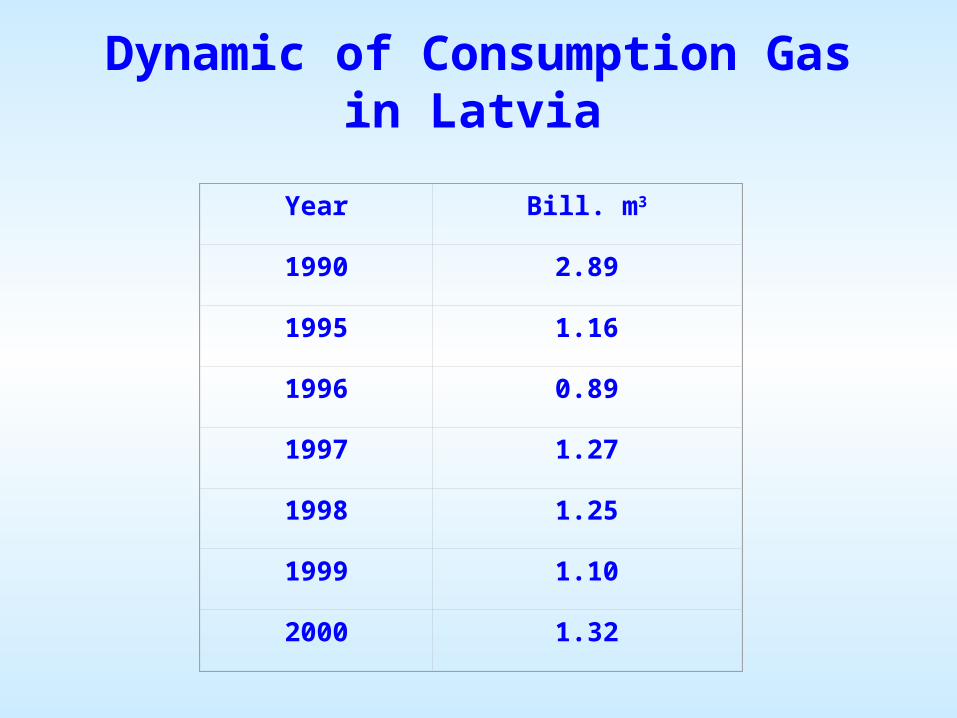
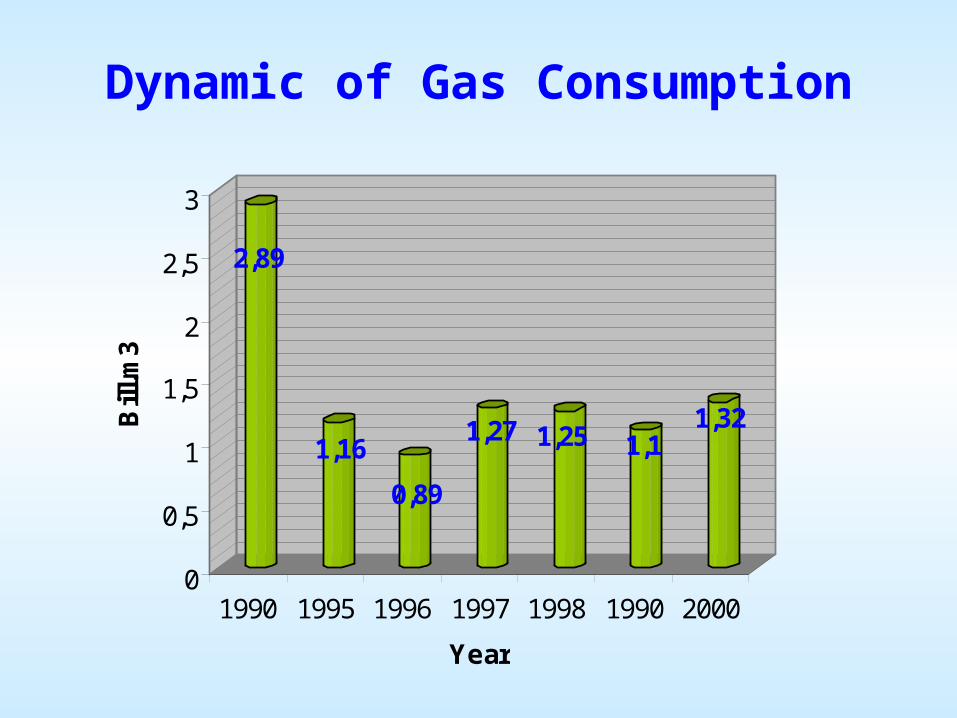
Dynamic of Consumption Gas in Latvia
Year Bill. m3
1990 2.89
1995 1.16
1996 0.89
1997 1.27
1998 1.25
1999 1.10
2000 1.32
2,89
1,16
0,89
1,27 1,25 1,11,32
0
0,5
1
1,5
2
2,5
3
Bill
.m3
1990 1995 1996 1997 1998 1990 2000
Year
Dynamic of Gas Consumption

The UGS Capacities in Eastern Europe [in Bill. Cubic M (109 M3)]
Country Existing Perspective
Latvia 2.12 50 (8 UGS)
Poland 0.56 5.23
Slovakia 1.60 4.39
Hungary 1.92 2.52
Czech Republic 20.1 1.20
Romania 0.57 1.45
Slovenia 0.07 0.07
Bulgaria 0.60 0.60

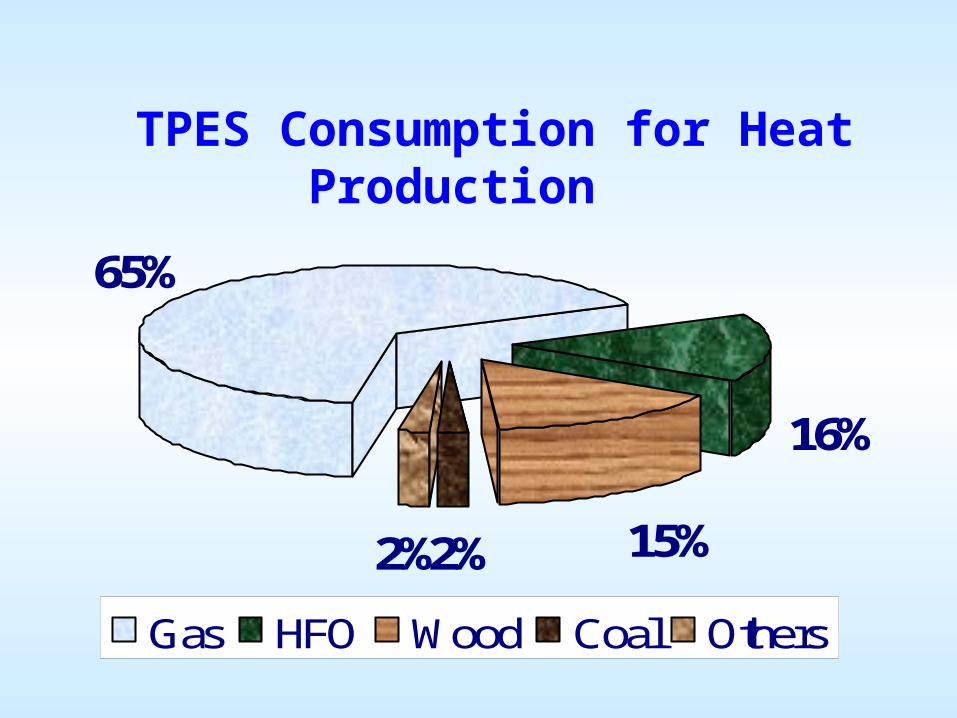
Total Consumption for Heat Production (2000)
Fuel %
Gas 65
HFO 16
Wood 15
Coal 2
Other 2
Total 100
65%
16%
15%2%2%
Gas HFO Wood Coal Others
TPES Consumption for Heat Production
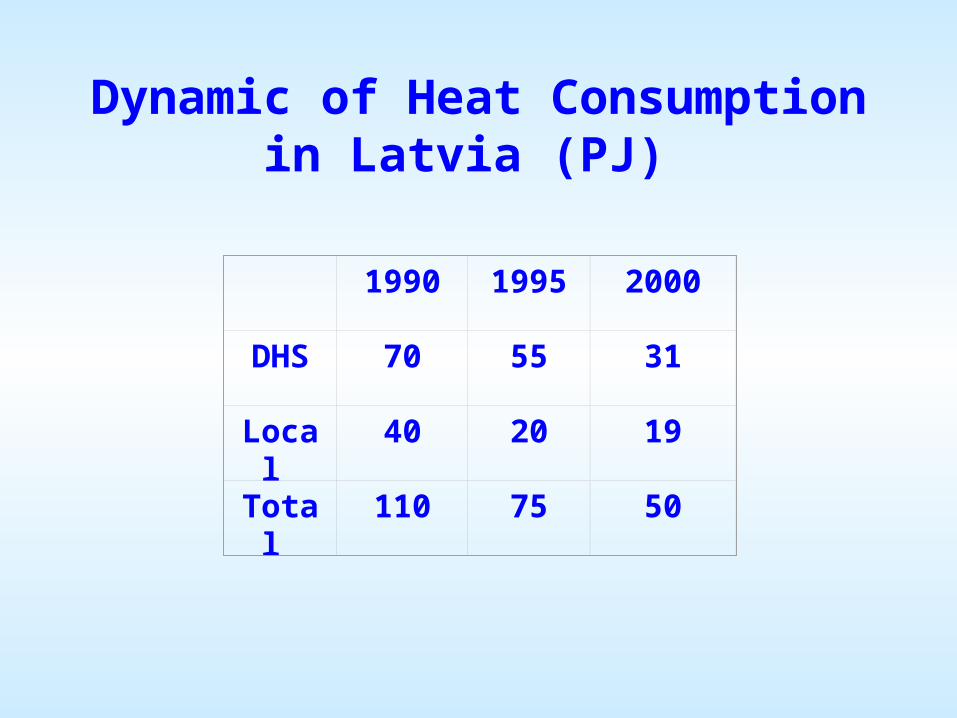
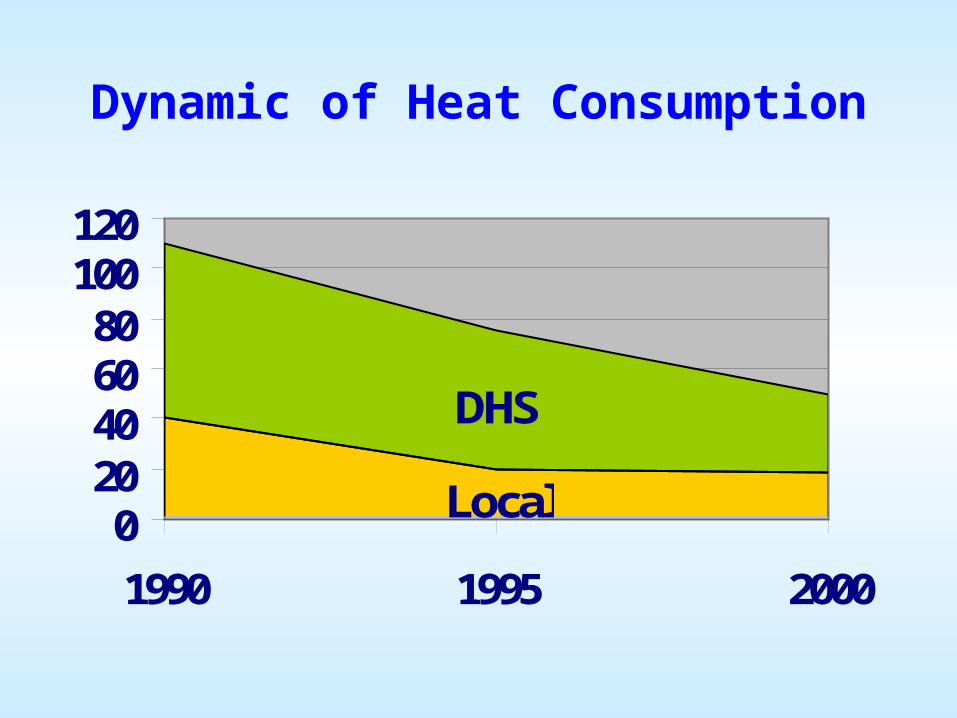
Dynamic of Heat Consumption in Latvia (PJ)
1990 1995 2000
DHS 70 55 31
Local 40 20 19
Total 110 75 50
Local
DHS
020406080
100120
1990 1995 2000
Dynamic of Heat Consumption

Emission in Latvia in Year 2000 (milj. T.)
Emission Summary Burning energy and transport
fuel
CO2 7.1 7.0
CH4 0.124 0.025
N2O 0.004 0.003
SO2 0.018 0.018
NOx 0.038 0.037
CO 0.283 0.251
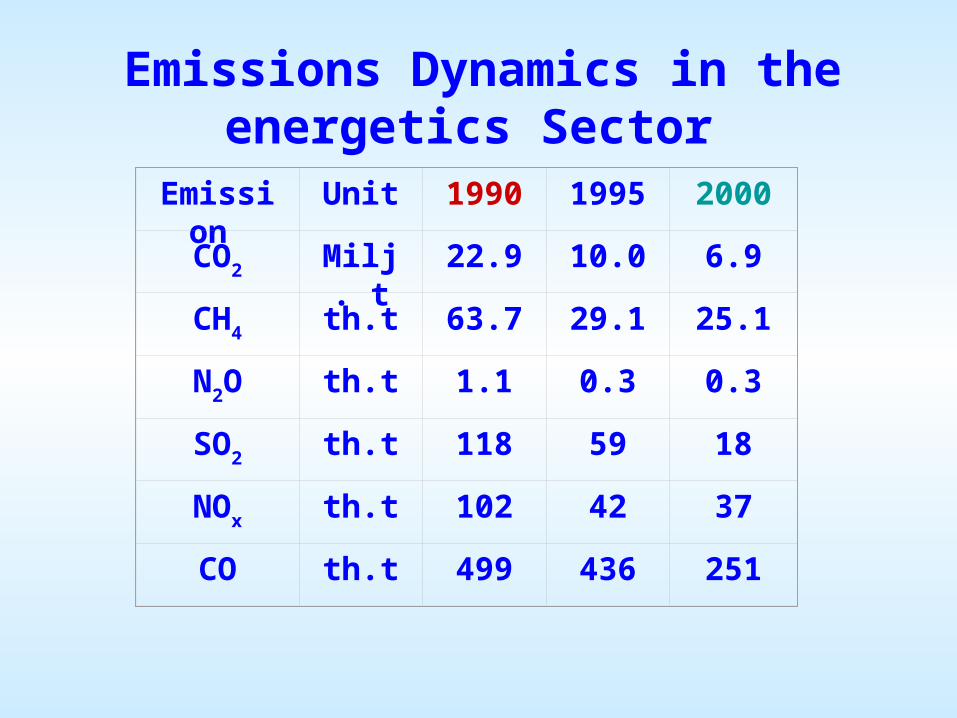
Emissions Dynamics in the energetics Sector
Emission Unit 1990 1995 2000
CO2 Milj. t 22.9 10.0 6.9
CH4 th.t 63.7 29.1 25.1
N2O th.t 1.1 0.3 0.3
SO2 th.t 118 59 18
NOx th.t 102 42 37
CO th.t 499 436 251
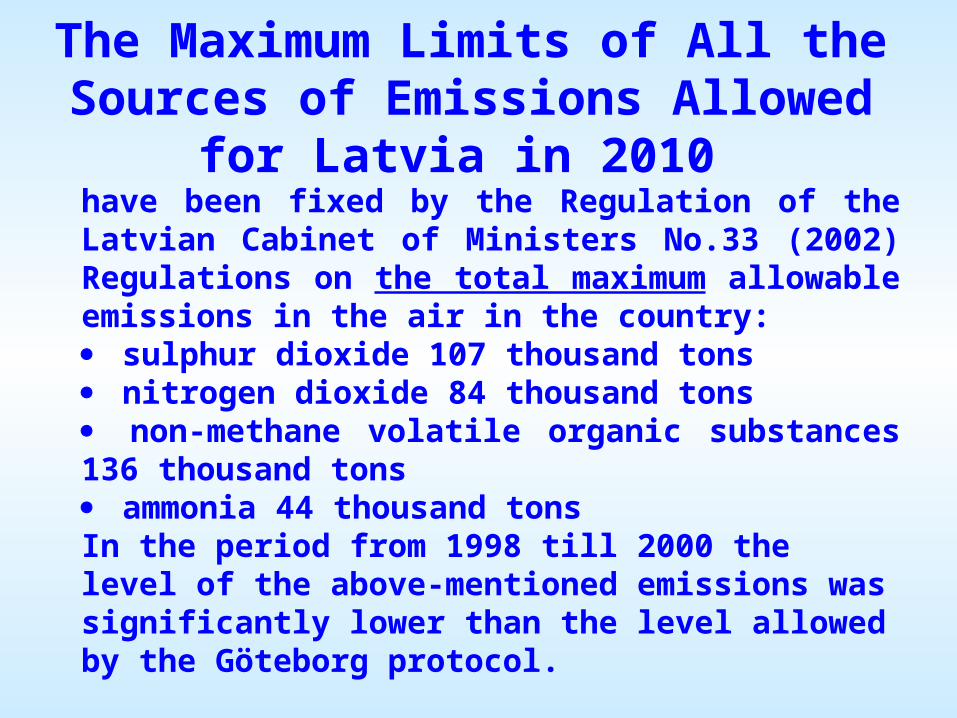
The Maximum Limits of All the Sources of Emissions Allowed for Latvia in 2010
have been fixed by the Regulation of the Latvian Cabinet of Ministers No.33 (2002) Regulations on the total maximum allowable emissions in the air in the country: sulphur dioxide 107 thousand tons nitrogen dioxide 84 thousand tons non-methane volatile organic substances 136 thousand tons ammonia 44 thousand tonsIn the period from 1998 till 2000 the level of the above-mentioned emissions was significantly lower than the level allowed by the Göteborg protocol.

Emissions Dynamics
10784
010
020
0
1990 1995 2000 2010Year
th.t
EU (Gōteberg) limits SO2 EU (Gōteberg) limits NOx
SO2 NOx
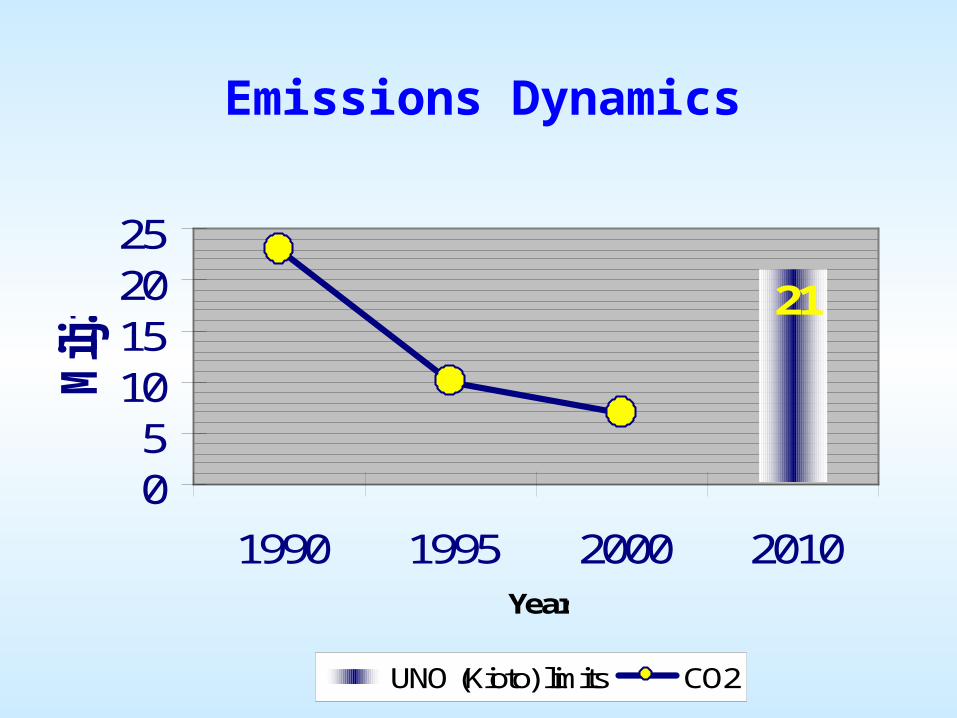
21
05
10152025
1990 1995 2000 2010Year
Milj
.t
UNO (Kioto) limits CO2
Emissions Dynamics
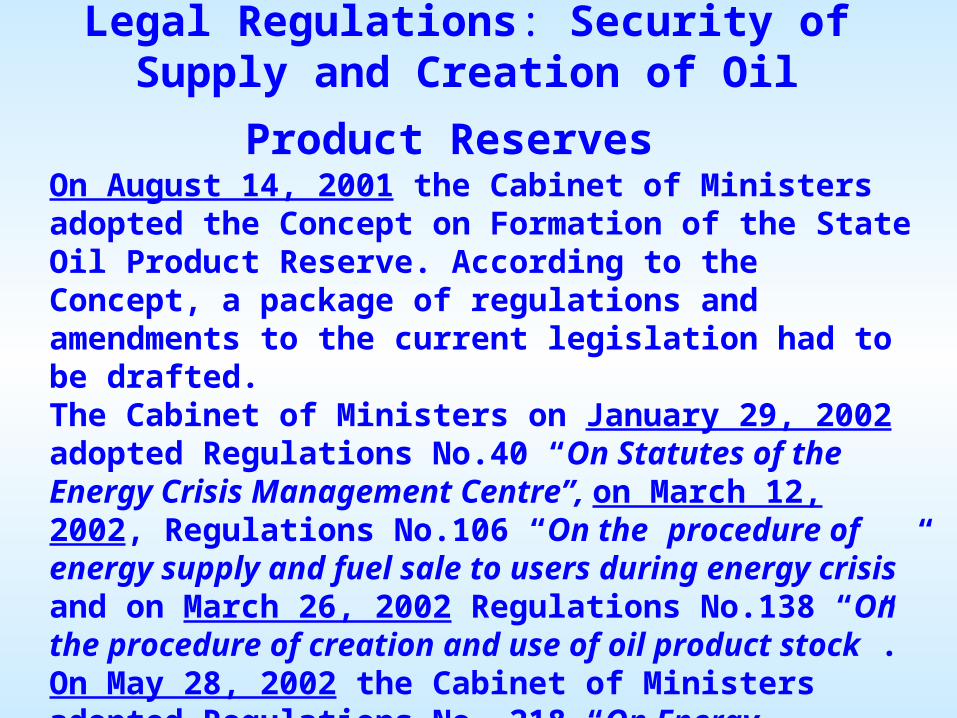
Legal Regulations: Security of Supply and Creation of Oil
Product Reserves On August 14, 2001 the Cabinet of Ministers adopted the Concept on Formation of the State Oil Product Reserve. According to the Concept, a package of regulations and amendments to the current legislation had to be drafted. The Cabinet of Ministers on January 29, 2002 adopted Regulations No.40 “On Statutes of the Energy Crisis Management Centre”, on March 12, 2002, Regulations No.106 “On the procedure of energy supply and fuel sale to users during energy crisis” and on March 26, 2002 Regulations No.138 “On the procedure of creation and use of oil product stock”. On May 28, 2002 the Cabinet of Ministers adopted Regulations No. 218 “On Energy Information System”
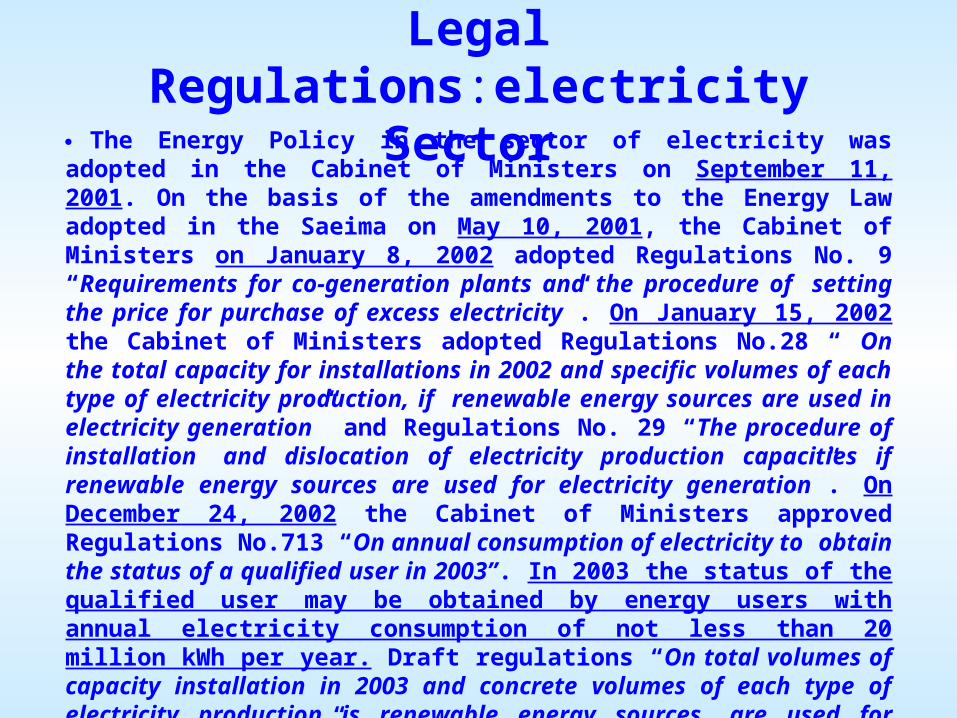
Legal Regulations:electricity Sector
The Energy Policy in the sector of electricity was adopted in the Cabinet of Ministers on September 11, 2001. On the basis of the amendments to the Energy Law adopted in the Saeima on May 10, 2001, the Cabinet of Ministers on January 8, 2002 adopted Regulations No. 9 “Requirements for co-generation plants and the procedure of setting the price for purchase of excess electricity”. On January 15, 2002 the Cabinet of Ministers adopted Regulations No.28 “ On the total capacity for installations in 2002 and specific volumes of each type of electricity production, if renewable energy sources are used in electricity generation” and Regulations No. 29 “The procedure of installation and dislocation of electricity production capacities if renewable energy sources are used for electricity generation”. On December 24, 2002 the Cabinet of Ministers approved Regulations No.713 “On annual consumption of electricity to obtain the status of a qualified user in 2003”. In 2003 the status of the qualified user may be obtained by energy users with annual electricity consumption of not less than 20 million kWh per year. Draft regulations “On total volumes of capacity installation in 2003 and concrete volumes of each type of electricity production is renewable energy sources are used for electricity generation” has been developed and submitted to the Cabinet of Ministers
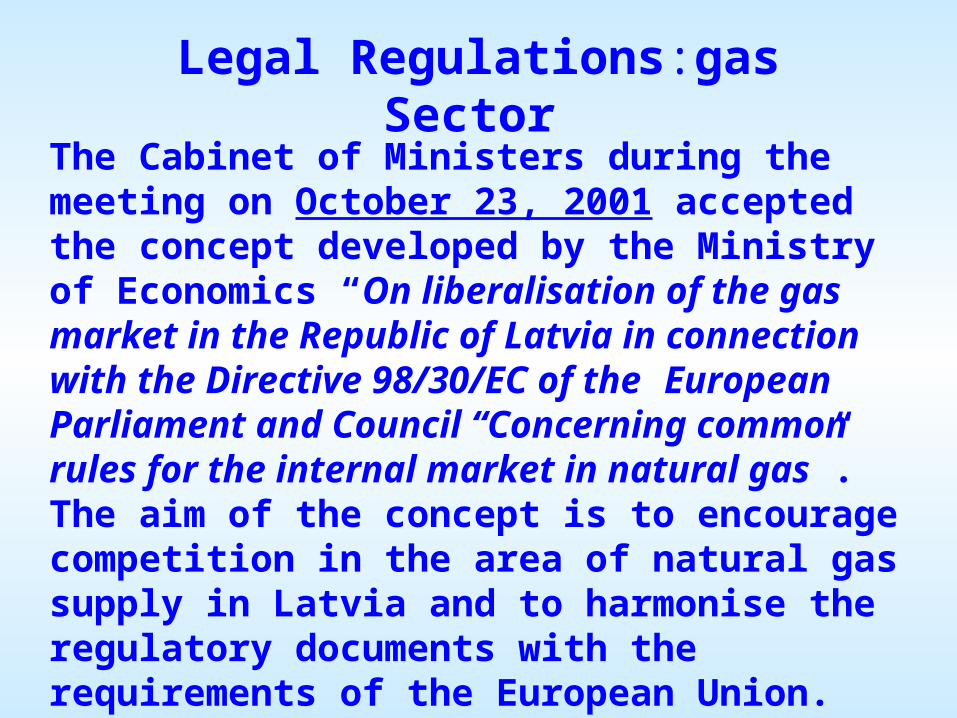
Legal Regulations:gas Sector
The Cabinet of Ministers during the meeting on October 23, 2001 accepted the concept developed by the Ministry of Economics “On liberalisation of the gas market in the Republic of Latvia in connection with the Directive 98/30/EC of the European Parliament and Council “Concerning common rules for the internal market in natural gas”. The aim of the concept is to encourage competition in the area of natural gas supply in Latvia and to harmonise the regulatory documents with the requirements of the European Union. The Action Plan to implement the concept has been developed.
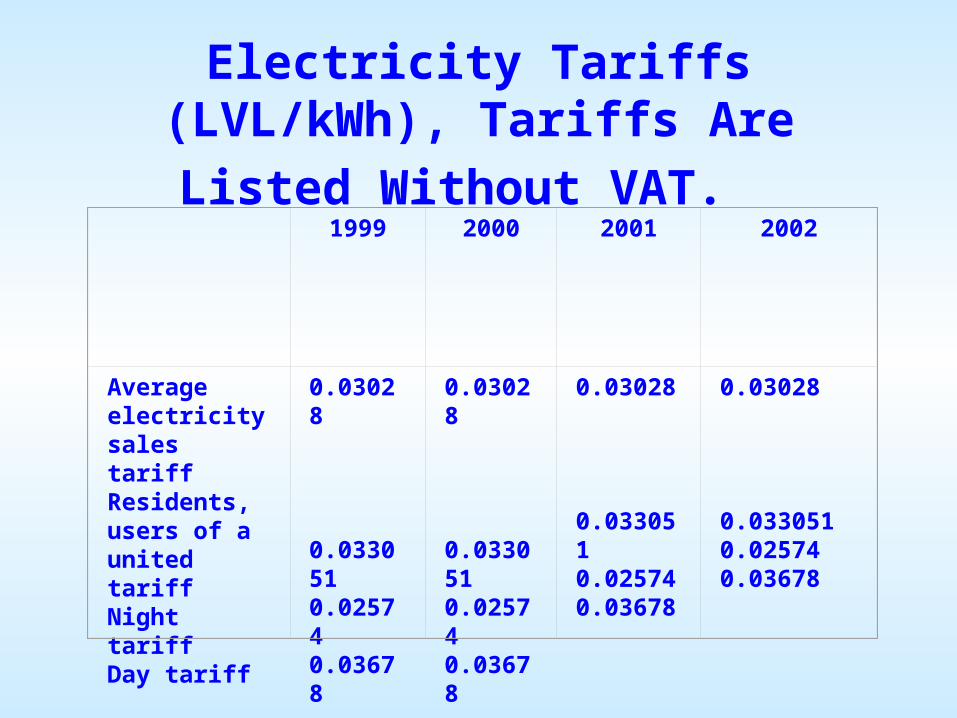
Electricity Tariffs (LVL/kWh), Tariffs Are Listed Without
VAT. 1999 2000 2001 2002
Average electricity sales tariffResidents, users of a united tariffNight tariffDay tariff
0.03028
0.0330510.025740.03678
0.03028
0.0330510.025740.03678
0.03028
0.0330510.025740.03678
0.03028
0.0330510.025740.03678
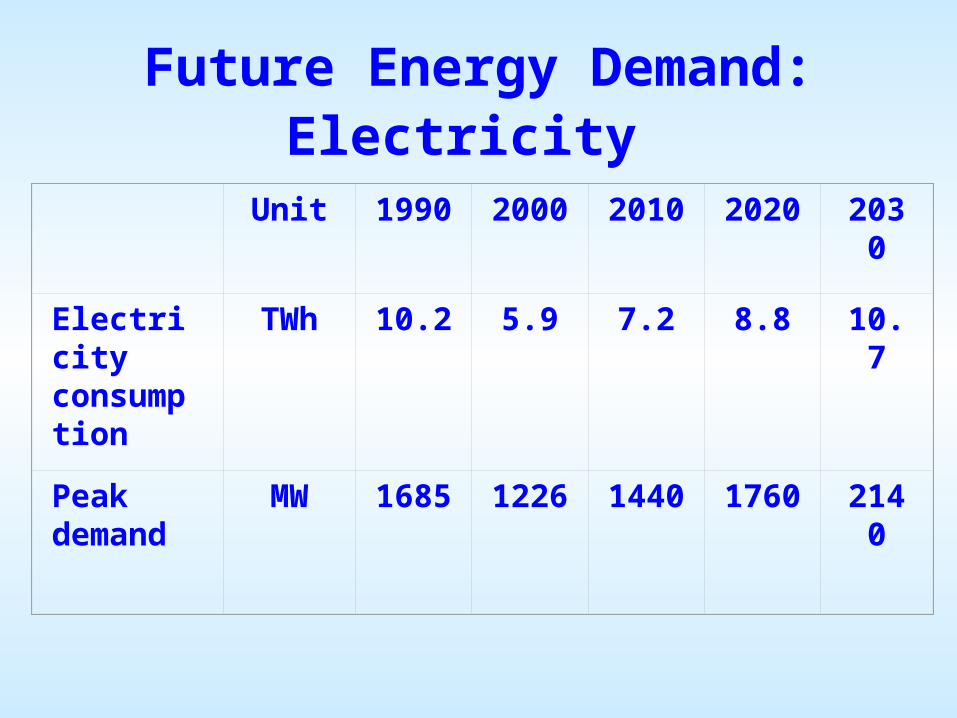
Future Energy Demand: Electricity
Unit 1990 2000 2010 2020 2030
Electricity consumption
TWh 10.2 5.9 7.2 8.8 10.7
Peak demand
MW 1685 1226 1440 1760 2140

0
2
4
6
8
10
12
1990 200 2010 2020 2030
Year
TW
h
0
1000
2000
3000
MW
Electricity consumpti Peak demand
Energy Demand

Primary Energy Demand
Unit 1990 2000 2010 2020 2030
Primary demand
M toe
8.65 3.74 4.38 5.02 5.35
PJ 349 157 184 211 225
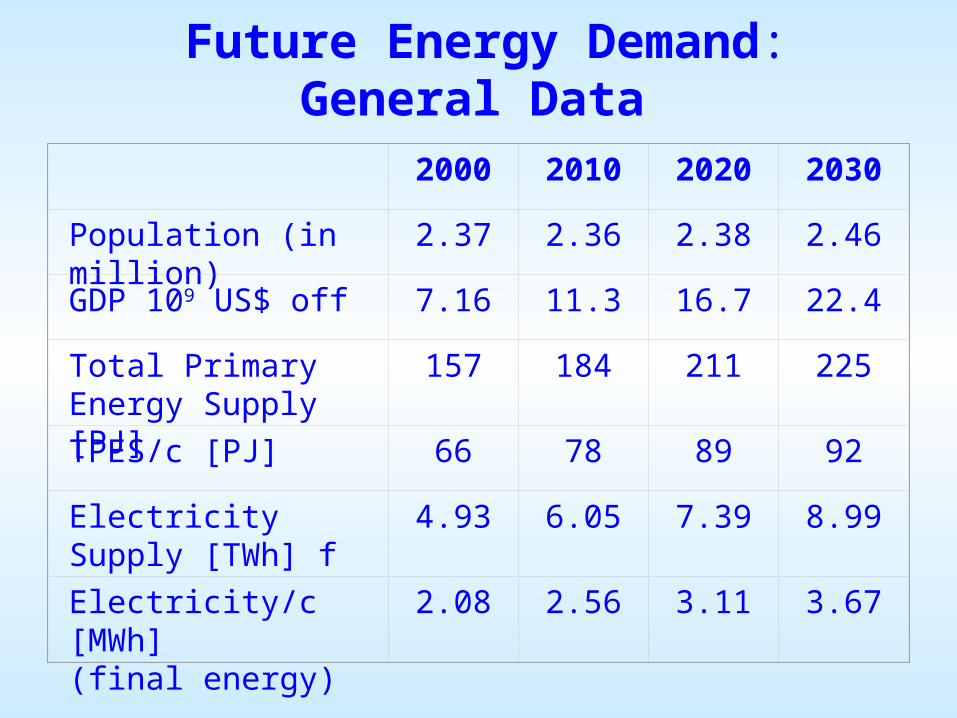
Future Energy Demand: General Data
2000 2010 2020 2030
Population (in million) 2.37 2.36 2.38 2.46
GDP 109 US$ off 7.16 11.3 16.7 22.4
Total Primary Energy Supply [PJ]
157 184 211 225
TPES/c [PJ] 66 78 89 92
Electricity Supply [TWh] f
4.93 6.05 7.39 8.99
Electricity/c [MWh] (final energy)
2.08 2.56 3.11 3.67

0
100
200
300
400
2000 2010 2020 2030
Year
%
GDP Electricity TPES
Electricity and TPES Demand

Energy Supply of Electricity Production
Electricity (TWh) 1990 2000 2010 2020 2030
Generation (total) 6.7 4.1 6.69 8.82 10.95
Coal - - - 2.1 1.8
Oil 1.0 0.1 - - -Gas 0.9 1.2 4.2 4.2 2.4
Nuclear - - - - 4.2Hydro 4.6 2.8 2.44 2.46 2.48
Other 0.2 - 0.05 0.06 0.07
Imports (+) +3.9 +2.1 +0.51
- -
Exports (-) -0.4 -0.3 - -0.02 -0.25
Consumption (total) 10.2 5.9 7.2 8.8 10.7
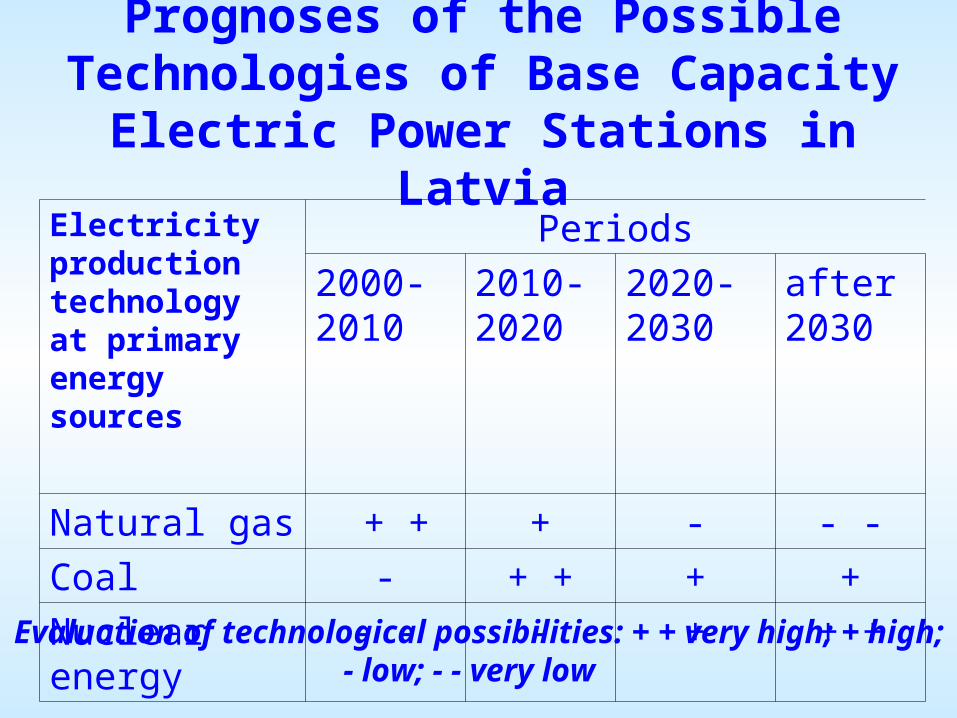
Prognoses of the Possible Technologies of Base Capacity Electric Power Stations
in LatviaElectricity production technology at primary energy sources
Periods
2000-2010
2010-2020
2020-2030
after 2030
Natural gas + + + - - -
Coal - + + + +
Nuclear energy - - - + + +Evaluation of technological possibilities: + + very high; + high; - low;
- - very low
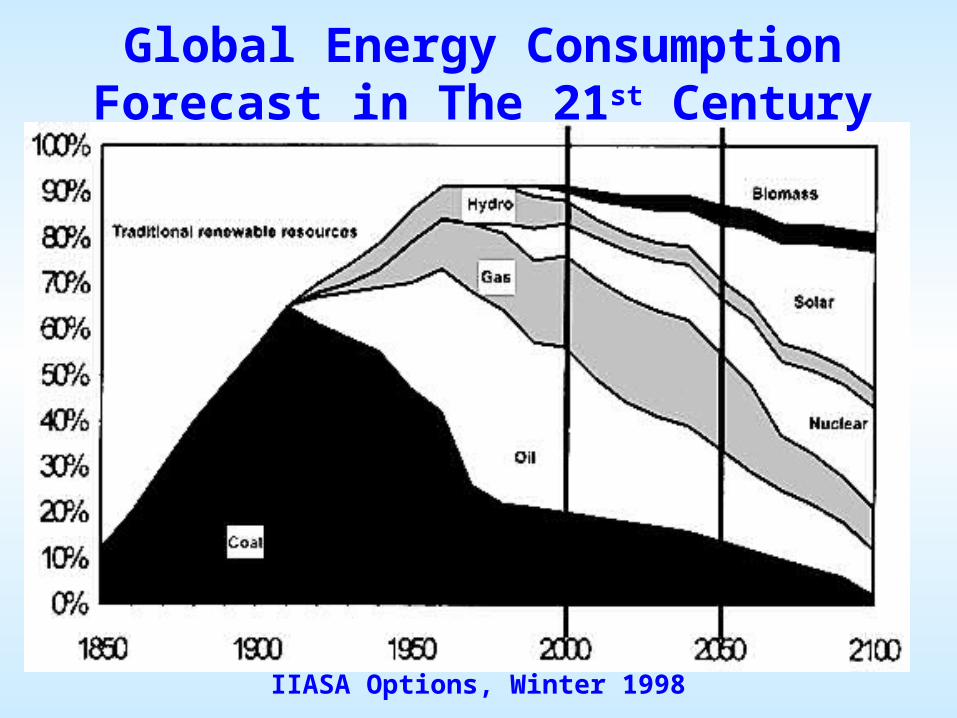
Global Energy Consumption Forecast in The 21st Century
IIASA Options, Winter 1998

Installed Capacity and Peak Demand Not Included Reduplicate Gas Turbines in Pick Power Plant for
Reservation Pick of Hydropower Planning by Low Water in 2010-700MW, 2020-900MW and in 2030-900MW
Specification Unit 1990 2000 2010 2020 2030
Power station MW 2017 2027 2145 2460 3750
Coal MW - - - 300 300
Oil MW 390 - - - -
Gas MW 125 515 600 600 600
Nuclear MW - - - - 600
Hydro MW 1502 1510 1520 1530 1540
Other MW - 2 25 30 35
Peak demand MW 1685 1226 1440 1760 2140
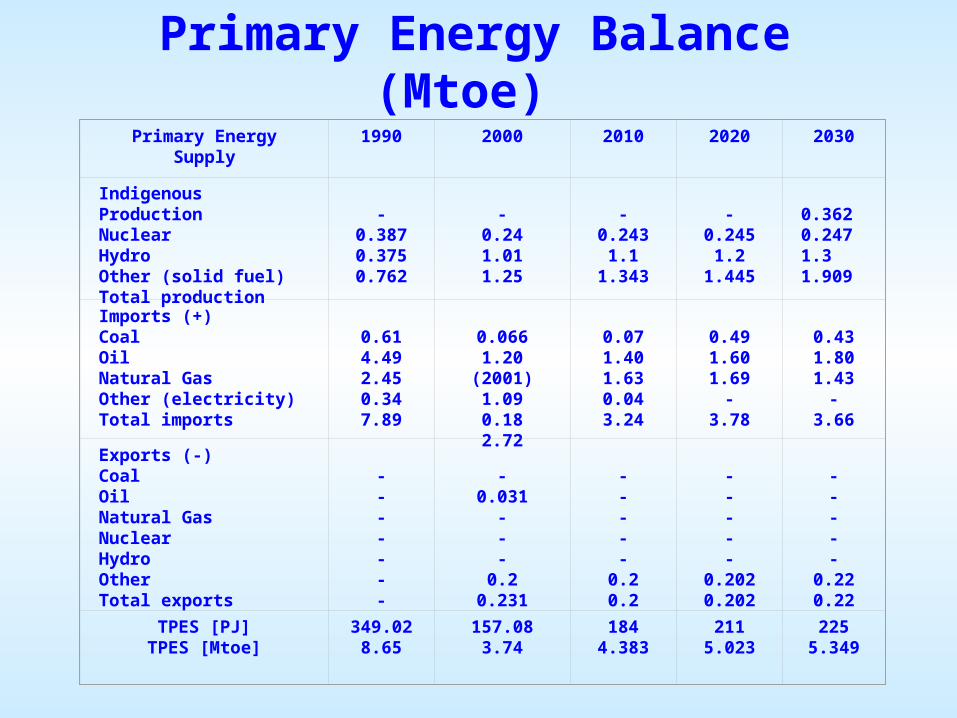
Primary Energy Balance (Mtoe) Primary Energy Supply 1990 2000 2010 2020 2030
Indigenous ProductionNuclear Hydro Other (solid fuel)Total production
-
0.3870.3750.762
-
0.241.011.25
-
0.2431.1
1.343
-
0.2451.2
1.445
0.3620.2471.31.909
Imports (+)CoalOil Natural GasOther (electricity)Total imports
0.614.492.450.347.89
0.066
1.20 (2001) 1.090.182.72
0.071.401.630.043.24
0.491.601.69
-3.78
0.431.801.43
-3.66
Exports (-)Coal Oil Natural GasNuclear Hydro OtherTotal exports
-------
-
0.031---
0.20.231
-----
0.20.2
-----
0.2020.202
-----
0.220.22
TPES [PJ]TPES [Mtoe]
349.028.65
157.083.74
1844.383
2115.023
2255.349
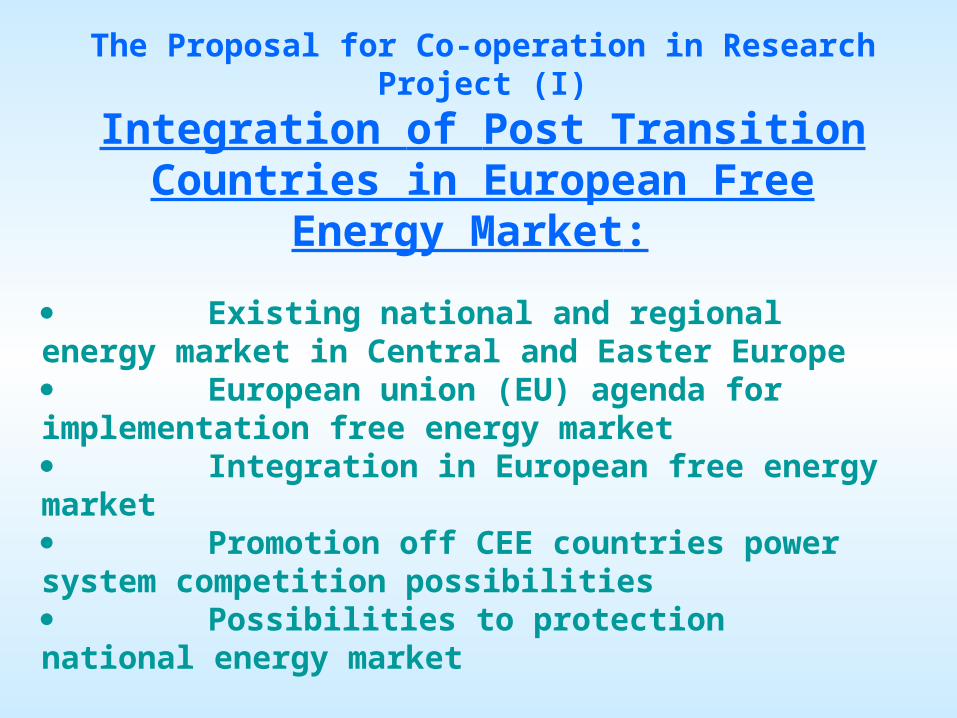
The Proposal for Co-operation in Research Project (I)
Integration of Post Transition Countries in European Free Energy Market:
Existing national and regional energy market in Central and Easter Europe European union (EU) agenda for implementation free energy market Integration in European free energy market Promotion off CEE countries power system competition possibilities Possibilities to protection national energy market
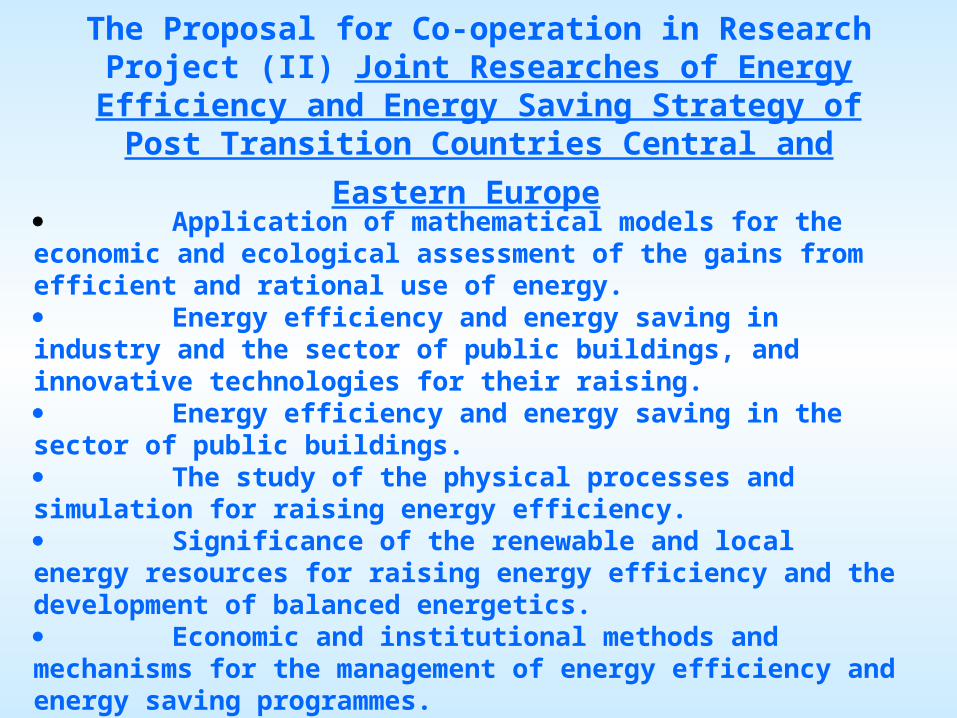
The Proposal for Co-operation in Research Project (II) Joint Researches of Energy Efficiency and Energy Saving
Strategy of Post Transition Countries Central and
Eastern Europe Application of mathematical models for the economic and ecological assessment of the gains from efficient and rational use of energy. Energy efficiency and energy saving in industry and the sector of public buildings, and innovative technologies for their raising. Energy efficiency and energy saving in the sector of public buildings. The study of the physical processes and simulation for raising energy efficiency. Significance of the renewable and local energy resources for raising energy efficiency and the development of balanced energetics. Economic and institutional methods and mechanisms for the management of energy efficiency and energy saving programmes.


![Computer development [Latvian]](https://static.fdocument.pub/doc/165x107/5568449fd8b42a26518b5035/computer-development-latvian.jpg)