London, 14 November 2017 · PDF file2016 Growth to 2040 Sources of global electricity demand...
16
© OECD/IEA 2017 London, 14 November 2017
Transcript of London, 14 November 2017 · PDF file2016 Growth to 2040 Sources of global electricity demand...
© OECD/IEA 2017
London, 14 November 2017
© OECD/IEA 2017
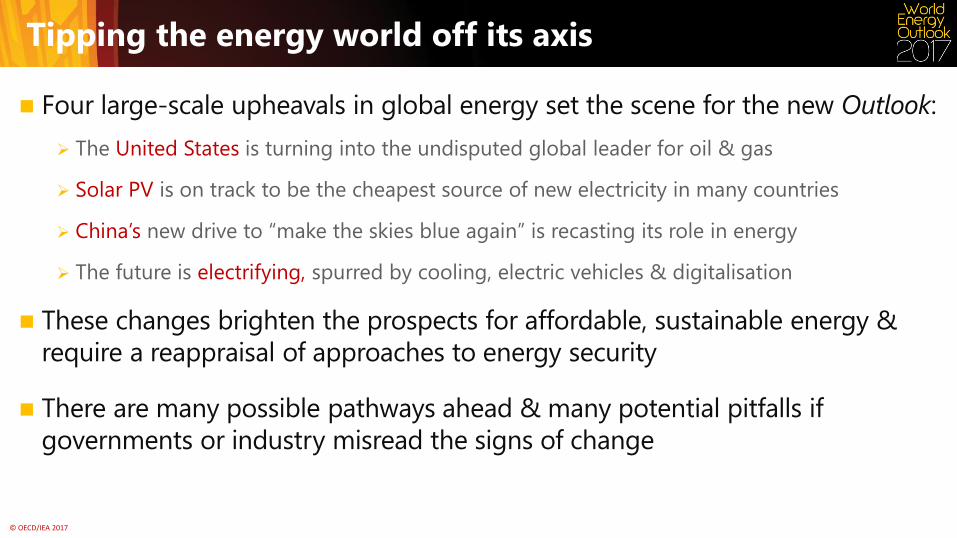
Tipping the energy world off its axis
Four large-scale upheavals in global energy set the scene for the new Outlook:
The United States is turning into the undisputed global leader for oil & gas
Solar PV is on track to be the cheapest source of new electricity in many countries
China’s new drive to “make the skies blue again” is recasting its role in energy
The future is electrifying, spurred by cooling, electric vehicles & digitalisation
These changes brighten the prospects for affordable, sustainable energy &
require a reappraisal of approaches to energy security
There are many possible pathways ahead & many potential pitfalls if
governments or industry misread the signs of change
© OECD/IEA 2017
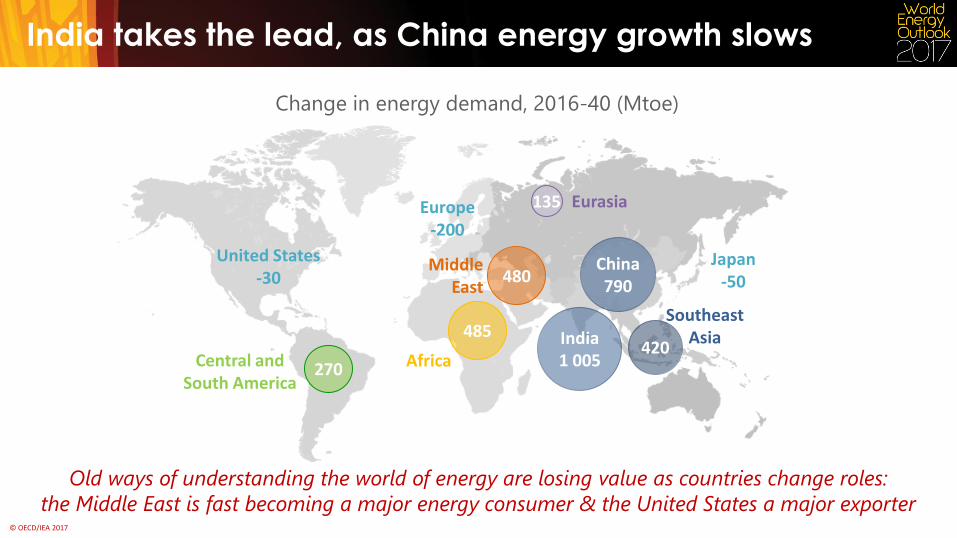
India takes the lead, as China energy growth slows
Change in energy demand, 2016-40 (Mtoe)
Old ways of understanding the world of energy are losing value as countries change roles:
India 1 005
420
Southeast Asia
China 790
United States -30
Japan -50
Europe -200
270 Central and South America
485
Africa
135 Eurasia
480 Middle
East
the Middle East is fast becoming a major energy consumer & the United States a major exporter
© OECD/IEA 2017
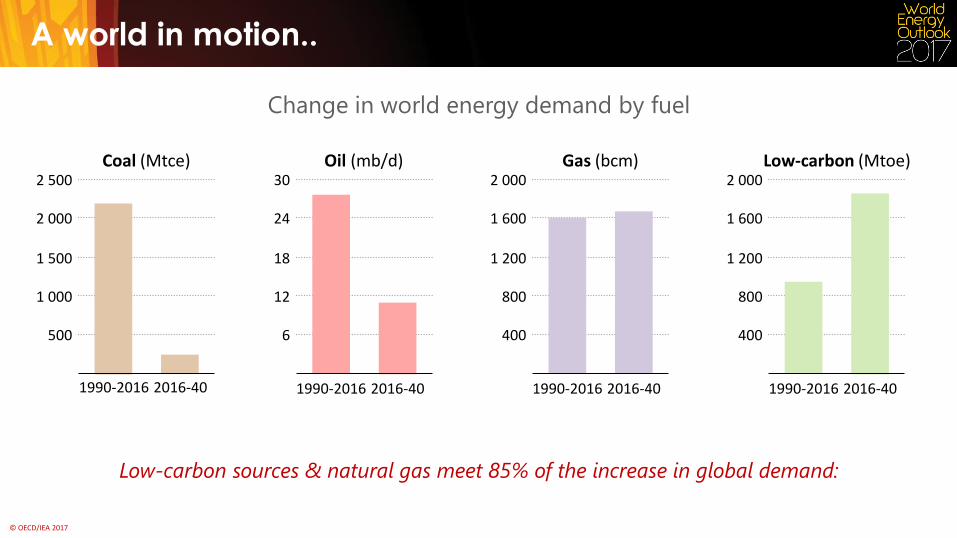
Low-carbon sources & natural gas meet 85% of the increase in global demand:
Change in world energy demand by fuel
Coal (Mtce)
500
1 000
1 500
2 000
2 500 Oil (mb/d)
6
12
18
24
30
1990-2016 2016-40
Gas (bcm)
400
800
1 200
1 600
2 000
1990-2016 2016-40
Low-carbon (Mtoe)
400
800
1 200
1 600
2 000
1990-2016 2016-40 1990-2016 2016-40
A world in motion..
© OECD/IEA 2017
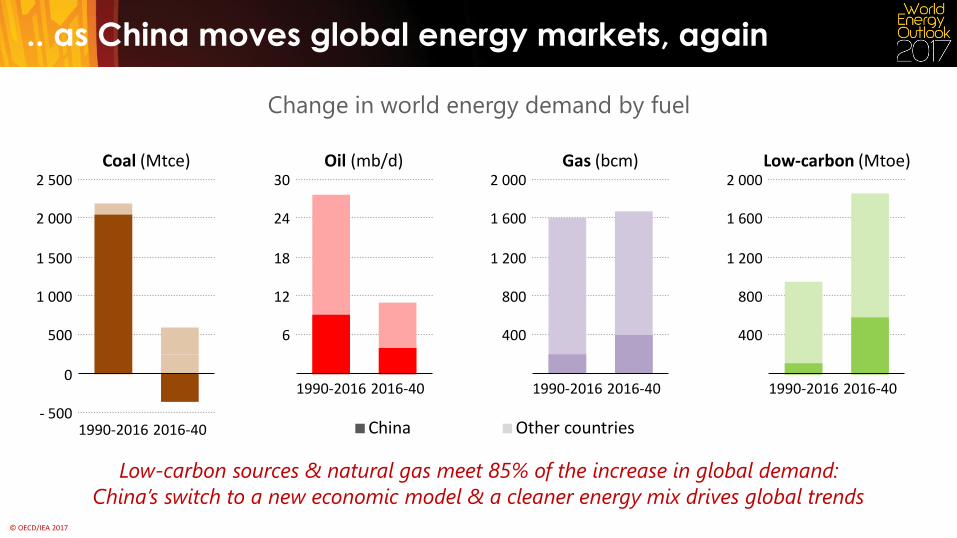
Change in world energy demand by fuel
Low-carbon sources & natural gas meet 85% of the increase in global demand:
Coal (Mtce)
0
500
1 000
1 500
2 000
2 500
- 500 1990-2016 2016-40
Oil (mb/d)
6
12
18
24
30
1990-2016 2016-40
Gas (bcm)
400
800
1 200
1 600
2 000
1990-2016 2016-40
Low-carbon (Mtoe)
400
800
1 200
1 600
2 000
1990-2016 2016-40
China’s switch to a new economic model & a cleaner energy mix drives global trends
Other countries China
.. as China moves global energy markets, again
© OECD/IEA 2017
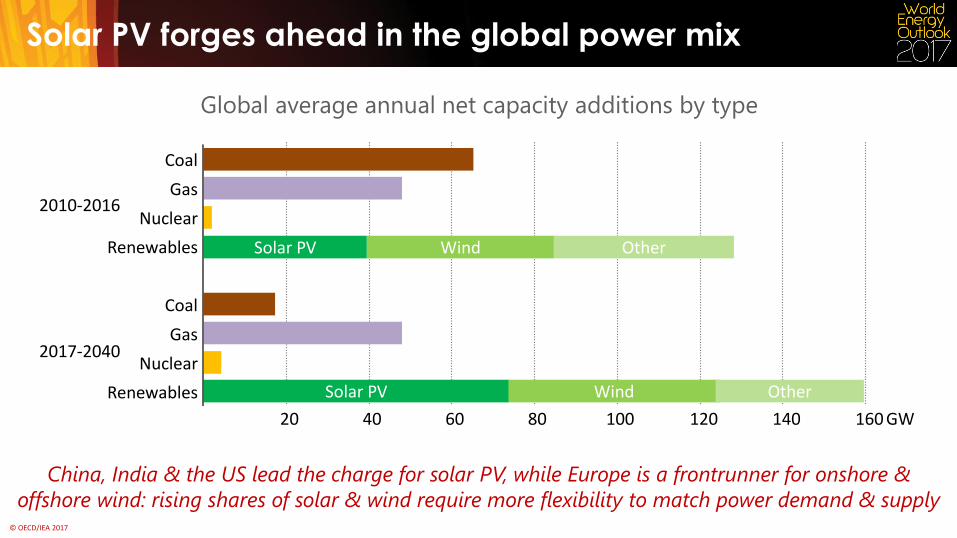
Solar PV forges ahead in the global power mix
Global average annual net capacity additions by type
China, India & the US lead the charge for solar PV, while Europe is a frontrunner for onshore &
offshore wind: rising shares of solar & wind require more flexibility to match power demand & supply
Renewables
Nuclear
Gas
Coal
Renewables
Nuclear
Gas
Coal
20 40 60 80 100 120 140 160 GW
2010-2016
2017-2040
Solar PV Wind
Solar PV Wind Other
Other
© OECD/IEA 2017
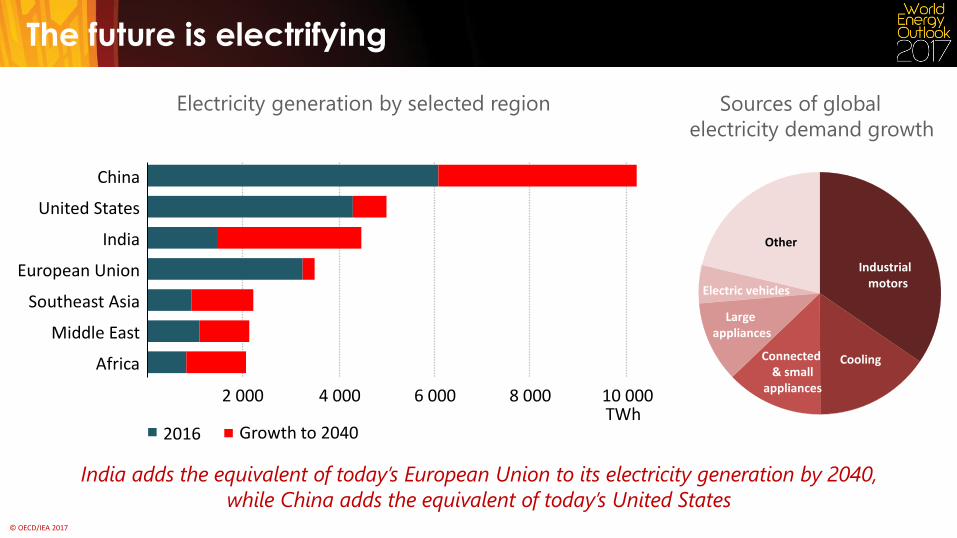
The future is electrifying
Electricity generation by selected region
India adds the equivalent of today’s European Union to its electricity generation by 2040,
Middle East
2 000 4 000 6 000 8 000 10 000
Africa
Southeast Asia
European Union
India
United States
China
TWh 2016 Growth to 2040
Sources of global
electricity demand growth
Industrial motors
Cooling
Large appliances
Connected & small
appliances
Electric vehicles
Other
while China adds the equivalent of today’s United States
© OECD/IEA 2017
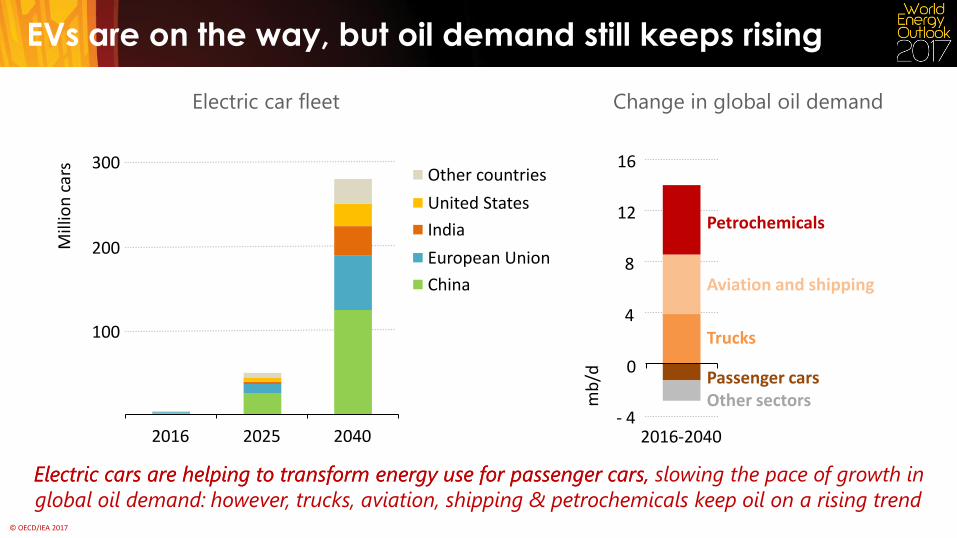
Electric cars are helping to transform energy use for passenger cars, slowing the pace of growth in
global oil demand: however, trucks, aviation, shipping & petrochemicals keep oil on a rising trend
Electric cars are helping to transform energy use for passenger cars, slowing the pace of growth in
global oil demand: however, trucks, aviation, shipping & petrochemicals keep oil on a rising trend
however, trucks, aviation, shipping & petrochemicals keep oil on a rising trend
EVs are on the way, but oil demand still keeps rising
Electric car fleet
100
200
300
2016 2025 2040
Mill
ion
car
s
Other countries
United States
India
European Union
China
Passenger cars Other sectors
Change in global oil demand
4
8
12
16
Petrochemicals
Aviation and shipping
Trucks
mb
/d
- 4 2016-2040
0
© OECD/IEA 2017
25
30
35
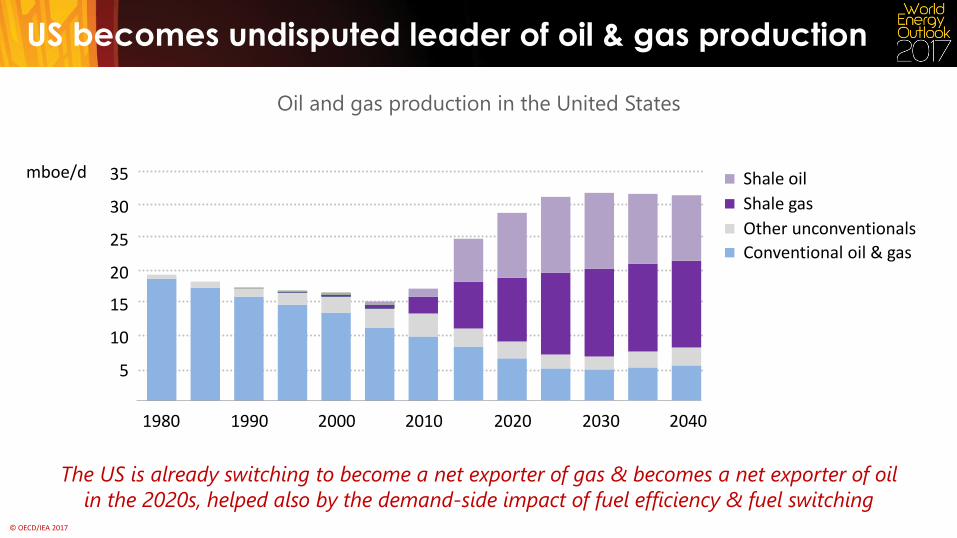
US becomes undisputed leader of oil & gas production
Oil and gas production in the United States
The US is already switching to become a net exporter of gas & becomes a net exporter of oil
in the 2020s, helped also by the demand-side impact of fuel efficiency & fuel switching
5
10
15
20
1980 1990 2000 2010 2020 2030 2040
mboe/d Shale oil
Shale gas
Other unconventionals
Conventional oil & gas
© OECD/IEA 2017
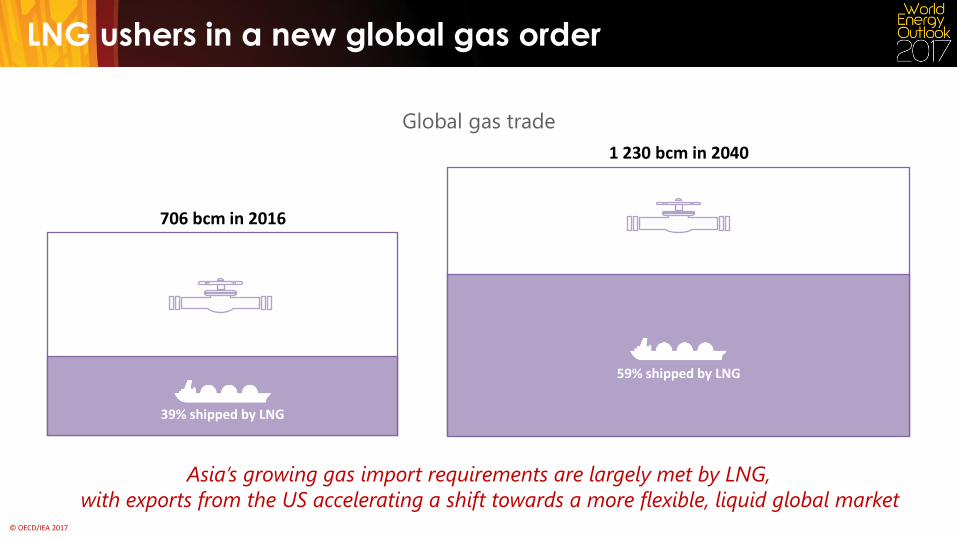
706 bcm in 2016
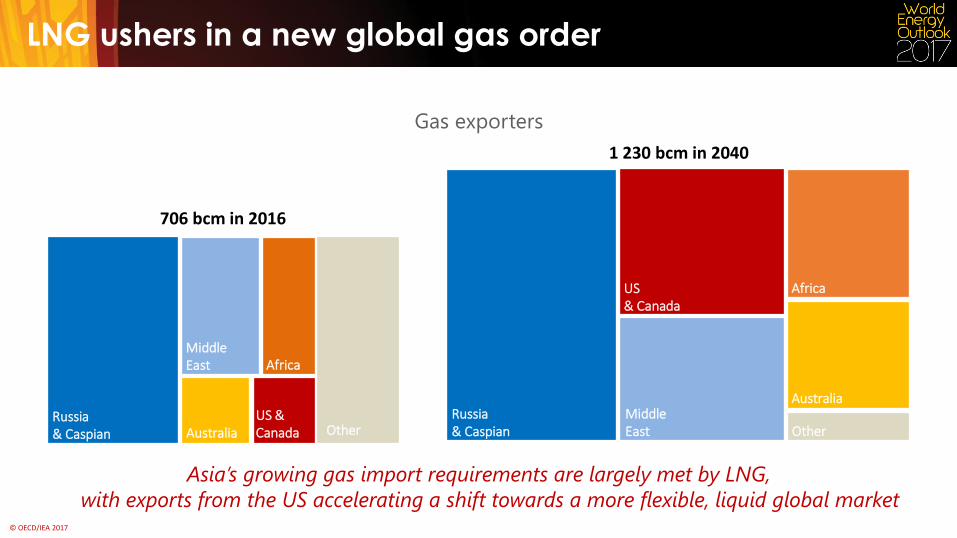
Asia’s growing gas import requirements are largely met by LNG,
with exports from the US accelerating a shift towards a more flexible, liquid global market
LNG ushers in a new global gas order
Global gas trade
39% shipped by LNG
1 230 bcm in 2040
59% shipped by LNG
© OECD/IEA 2017
706 bcm in 2016
Asia’s growing gas import requirements are largely met by LNG,
with exports from the US accelerating a shift towards a more flexible, liquid global market
LNG ushers in a new global gas order
1 230 bcm in 2040
Australia Russia & Caspian
Middle East
Other
Africa
US & Canada
Australia Russia & Caspian
Middle East Other
Africa US & Canada
Gas exporters
© OECD/IEA 2017
706 bcm in 2016
Global gas trade
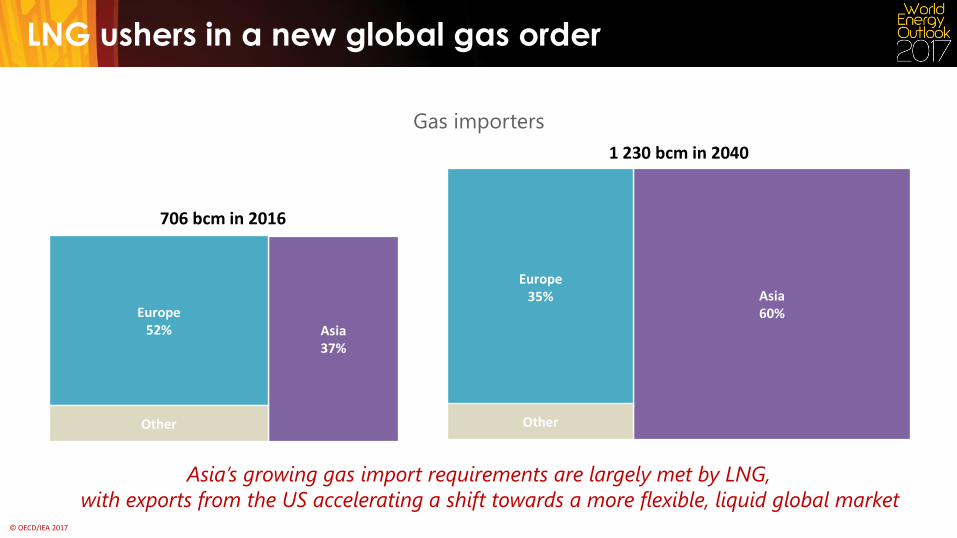
Asia’s growing gas import requirements are largely met by LNG,
with exports from the US accelerating a shift towards a more flexible, liquid global market
LNG ushers in a new global gas order
Gas exporters Gas importers
1 230 bcm in 2040
Asia 37%
Europe 52%
Other
Asia 60%
Europe 35%
Other
© OECD/IEA 2017
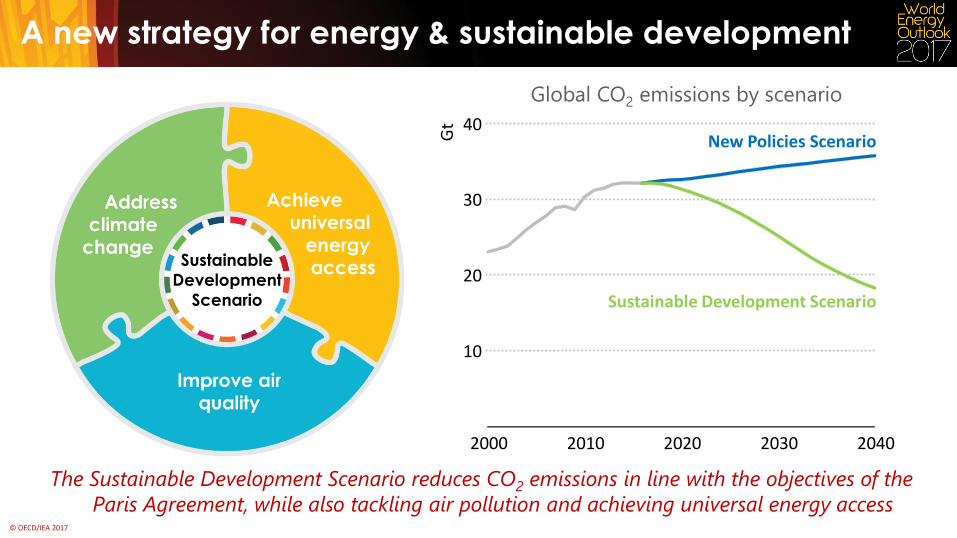
A new strategy for energy & sustainable development
Sustainable
Development
Scenario
The Sustainable Development Scenario reduces CO2 emissions in line with the objectives of the
Paris Agreement, while also tackling air pollution and achieving universal energy access
New Policies Scenario
Sustainable Development Scenario
Global CO2 emissions by scenario
10
20
30
40
2000 2010 2020 2030 2040 G
t
© OECD/IEA 2017
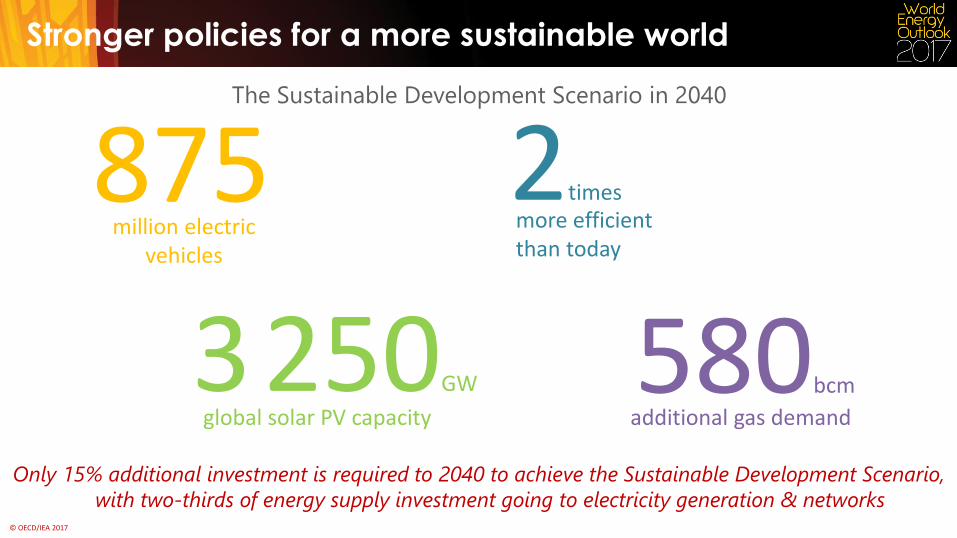
Stronger policies for a more sustainable world
580bcm additional gas demand
2times more efficient than today
3 250GW
global solar PV capacity
875 million electric
vehicles
Only 15% additional investment is required to 2040 to achieve the Sustainable Development Scenario,
with two-thirds of energy supply investment going to electricity generation & networks
The Sustainable Development Scenario in 2040
© OECD/IEA 2017
Conclusions
The oil & gas boom in the United States is shaking up the established order, with major
implications for markets, trade flows, investment & energy security
The versatility of natural gas means that it is well placed to grow, but it cannot afford
price spikes or uncertainty over methane leaks
China continues to shape global trends, but in new ways as its “energy revolution”
drives cost reductions for a wide range of clean energy technologies
Our strategy for sustainable energy shows that concerted action to address climate
change is fully compatible with global goals on universal access & air quality
Electrification & digitalisation are the future for many parts of the global energy system,
creating new opportunities but also risks that policy makers have to address
© OECD/IEA 2017
iea.org/weo