Local observation of plasmon focusing in Talbot carpets
13
Local observation of plasmon focusing in Talbot carpets Sudhir Cherukulappurath, 1 Dominique Heinis, 1 Jean Cesario, 1,2 Niek. F. van Hulst, 1, 3, Stefan Enoch, 2 and Romain Quidant 1,3* 1 ICFO-Institut de Ciencies Fotoniques, Mediterranean Technology Park, 08860 Castelldefels (Barcelona), Spain. 2 Institut Fresnel, UMR CNRS 6133, Université Paul Cézanne Aix-Marseille III, 13397 Marseille Cedex 20, France 3 ICREA-Institució Catalana de Recerca i Estudis Avançats, 08010 Barcelona, Spain *[email protected] Abstract: We present a detailed experimental and theoretical study of plasmon Talbot effect. A theoretical model based on simple scattering theory is developed to describe the Talbot self-imaging pattern generated by a linear arrangement of cylindrical nanostructures forming a periodic array. We first show the experimental observation of plasmon Talbot carpets created by propagating surface plasmon polaritons (SPP) interacting with cylindrical nanostructures positioned on a thin Au film using leakage radiation microscopy. Such images provide information on the distribution of the plasmon intensity close to the nanostructures. Next, heterodyne interferometer based near-field imaging is carried out to extract information on the plasmonic modes forming the Talbot carpet deployment. We report the experimental observation of Talbot focal spots with dimensions down to /4 λ . ©2009 Optical Society of America OCIS codes: (070.6760) Talbot effect; (240.6680) Surface plasmons; (250.5403) Plasmonics. References and links 1. W. L. Barnes, A. Dereux, and T. W. Ebbesen, “Surface plasmon subwavelength optics,” Nature 424(6950), 824– 830 (2003). 2. H. Raether, “Surface Plasmons on Smooth and Rough Surfaces and on Gratings”, Vol. 111 of Springer Tracts in Modern Physics (Springer-Verlag, Berlin, 1988). 3. F. J. Garcia de Abajo, “Light Scattering by particle and hole arrays,” Rev. Mod. Phys. 79(4), 1267–1290 (2007). 4. A. G. Curto, and F. Javier García de Abajo, “Near-Field Optical Phase Antennas for Long-Range Plasmon Coupling,” Nano Lett. 8(8), 2479–2484 (2008). 5. S. I. Bozhevolnyi, and F. A. Pudonin, “Two-Dimensionsal Micro-Optics of Surface Plasmons,” Phys. Rev. Lett. 78(14), 2823–2826 (1997). 6. H. Ditlbacher, J. R. Krenn, G. Schider, A. Leitner, and F. R. Aussenegg, “Two-dimensional optics with surface plasmon polaritons,” Appl. Phys. Lett. 81(10), 1762–1764 (2002). 7. J.-C. Weeber, Y. Lacroute, A. Dereux, E. Devaux, T. Ebbesen, C. Girard, M. U. Gonzalez, and A.-L. Baudrion, “Near-field characterization of Bragg mirrors engraved in surface plasmon waveguides,” Phys. Rev. B 70(23), 235406 (2004). 8. A. Drezet, A. L. Stepanov, H. Ditlbacher, A. Hohenau, B. Steinberger, F. R. Aussenegg, A. Leitner, and J. R. Krenn, “Surface plasmon propagation in an elliptical corral,” Appl. Phys. Lett. 86(7), 74104 (2005). 9. M. U. Gonzalez, J.-C. Weeber, A.-L. Baudrion, A. Dereux, A. L. Stepanov, J. R. Krenn, E. Devaux, and T. W. Ebbesen, “Design, near-field characterization, and modeling of 45 surface-plasmon Bragg mirrors,” Phys. Rev. B 73(15), 155416 (2006). 10. A. Hohenau, J. R. Krenn, A. L. Stepanov, A. Drezet, H. Ditlbacher, B. Steinberger, A. Leitner, and F. R. Aussenegg, “Dielectric optical elements for surface plasmons,” Opt. Lett. 30(8), 893–895 (2005). 11. F. M. Huang, T. S. Kao, V. A. Fedotov, Y. Chen, and N. I. Zheludev, “Nanohole Array as a lens,” Nano Lett. 8(8), 2469–2472 (2008). 12. H. F. Talbot, “Facts relating to optical science, No. IV,” Philos. Mag. 9, 401–407 (1836). 13. M. V. Berry, and S. Klein, “Integer, fractional and fractal Talbot effects,” J. Mod. Opt. 43, 2139–2164 (1996). 14. A. W. Lohmann, and D. E. Silva, “An interferometer based on the Talbot effect,” Opt. Commun. 2(9), 413–415 (1971). 15. A. W. Lohmann, “An array illuminator based on the Talbot effect,” Optik (Stuttg.) 79, 41–45 (1988). (C) 2009 OSA 21 December 2009 / Vol. 17, No. 26 / OPTICS EXPRESS 23772 #118474 - $15.00 USD Received 12 Oct 2009; revised 30 Nov 2009; accepted 2 Dec 2009; published 11 Dec 2009
Transcript of Local observation of plasmon focusing in Talbot carpets
Local observation of plasmon focusing
in Talbot carpets
Sudhir Cherukulappurath,1 Dominique Heinis,
1 Jean Cesario,
1,2 Niek. F. van Hulst,
1, 3,
Stefan Enoch, 2 and Romain Quidant
1,3*
1 ICFO-Institut de Ciencies Fotoniques, Mediterranean Technology Park, 08860 Castelldefels (Barcelona), Spain. 2 Institut Fresnel, UMR CNRS 6133, Université Paul Cézanne Aix-Marseille III, 13397 Marseille
Cedex 20, France 3 ICREA-Institució Catalana de Recerca i Estudis Avançats, 08010 Barcelona, Spain
Abstract: We present a detailed experimental and theoretical study of
plasmon Talbot effect. A theoretical model based on simple scattering
theory is developed to describe the Talbot self-imaging pattern generated by
a linear arrangement of cylindrical nanostructures forming a periodic array.
We first show the experimental observation of plasmon Talbot carpets
created by propagating surface plasmon polaritons (SPP) interacting with
cylindrical nanostructures positioned on a thin Au film using leakage
radiation microscopy. Such images provide information on the distribution
of the plasmon intensity close to the nanostructures. Next, heterodyne
interferometer based near-field imaging is carried out to extract information
on the plasmonic modes forming the Talbot carpet deployment. We report
the experimental observation of Talbot focal spots with dimensions down
to / 4λ .
©2009 Optical Society of America
OCIS codes: (070.6760) Talbot effect; (240.6680) Surface plasmons; (250.5403) Plasmonics.
References and links
1. W. L. Barnes, A. Dereux, and T. W. Ebbesen, “Surface plasmon subwavelength optics,” Nature 424(6950), 824–
830 (2003).
2. H. Raether, “Surface Plasmons on Smooth and Rough Surfaces and on Gratings”, Vol. 111 of Springer Tracts in
Modern Physics (Springer-Verlag, Berlin, 1988).
3. F. J. Garcia de Abajo, “Light Scattering by particle and hole arrays,” Rev. Mod. Phys. 79(4), 1267–1290 (2007).
4. A. G. Curto, and F. Javier García de Abajo, “Near-Field Optical Phase Antennas for Long-Range Plasmon
Coupling,” Nano Lett. 8(8), 2479–2484 (2008).
5. S. I. Bozhevolnyi, and F. A. Pudonin, “Two-Dimensionsal Micro-Optics of Surface Plasmons,” Phys. Rev. Lett.
78(14), 2823–2826 (1997).
6. H. Ditlbacher, J. R. Krenn, G. Schider, A. Leitner, and F. R. Aussenegg, “Two-dimensional optics with surface
plasmon polaritons,” Appl. Phys. Lett. 81(10), 1762–1764 (2002).
7. J.-C. Weeber, Y. Lacroute, A. Dereux, E. Devaux, T. Ebbesen, C. Girard, M. U. Gonzalez, and A.-L. Baudrion,
“Near-field characterization of Bragg mirrors engraved in surface plasmon waveguides,” Phys. Rev. B 70(23),
235406 (2004).
8. A. Drezet, A. L. Stepanov, H. Ditlbacher, A. Hohenau, B. Steinberger, F. R. Aussenegg, A. Leitner, and J. R.
Krenn, “Surface plasmon propagation in an elliptical corral,” Appl. Phys. Lett. 86(7), 74104 (2005).
9. M. U. Gonzalez, J.-C. Weeber, A.-L. Baudrion, A. Dereux, A. L. Stepanov, J. R. Krenn, E. Devaux, and T. W.
Ebbesen, “Design, near-field characterization, and modeling of 45 surface-plasmon Bragg mirrors,” Phys. Rev.
B 73(15), 155416 (2006).
10. A. Hohenau, J. R. Krenn, A. L. Stepanov, A. Drezet, H. Ditlbacher, B. Steinberger, A. Leitner, and F. R.
Aussenegg, “Dielectric optical elements for surface plasmons,” Opt. Lett. 30(8), 893–895 (2005).
11. F. M. Huang, T. S. Kao, V. A. Fedotov, Y. Chen, and N. I. Zheludev, “Nanohole Array as a lens,” Nano Lett.
8(8), 2469–2472 (2008).
12. H. F. Talbot, “Facts relating to optical science, No. IV,” Philos. Mag. 9, 401–407 (1836).
13. M. V. Berry, and S. Klein, “Integer, fractional and fractal Talbot effects,” J. Mod. Opt. 43, 2139–2164 (1996).
14. A. W. Lohmann, and D. E. Silva, “An interferometer based on the Talbot effect,” Opt. Commun. 2(9), 413–415
(1971).
15. A. W. Lohmann, “An array illuminator based on the Talbot effect,” Optik (Stuttg.) 79, 41–45 (1988).
(C) 2009 OSA 21 December 2009 / Vol. 17, No. 26 / OPTICS EXPRESS 23772#118474 - $15.00 USD Received 12 Oct 2009; revised 30 Nov 2009; accepted 2 Dec 2009; published 11 Dec 2009
16. M. Testorf, J. Jahns, N. A. Khilo, and A. M. Goncharenko, “Talbot effect for oblique angle of light propagation,”
Opt. Commun. 129(3-4), 167–172 (1996).
17. F. M. Huang, N. Zheludev, Y. Chen, and F. J. Garcia de Abajo, “Focusing of light by a nanohole array,” Appl.
Phys. Lett. 90(9), 091119 (2007).
18. M. R. Dennis, N. I. Zheludev, and F. J. García de Abajo, “The plasmon Talbot effect,” Opt. Express 15(15),
9692–9700 (2007).
19. A. A. Maradudin, and T. A. Leskova, “The Talbot effect for a surface Plasmon polariton,” N. J. Phys. 11(3),
033004 (2009).
20. W. Zhang, C. Zhao, J. Wang, and J. Zhang, “An experimental study of the plasmonic Talbot effect,” Opt.
Express 17(22), 19757 (2009).
21. A. Archambault, T. V. Teperik, F. Marquier, and J. J. Greffet, “Surface plasmon Fourier optics,” Phys. Rev. B
79(19), 195414 (2009).
22. J. Cesario, M. U. Gonzalez, S. Cheylan, W. L. Barnes, S. Enoch, and R. Quidant, “Coupling localized and
extended plasmons to improve the light extraction through metal films,” Opt. Express 15(17), 10533–10539
(2007).
23. A. L. Stepanov, J. R. Krenn, H. Ditlbacher, A. Hohenau, A. Drezet, B. Steinberger, A. Leitner, and F. R.
Aussenegg, “Quantitative analysis of surface plasmon interaction with silver nanoparticles,” Opt. Lett. 30(12),
1524 (2005).
24. A. Drezet, A. Hohenau, A. L. Stepanov, H. Ditlbacher, B. Steinberger, N. Galler, F. R. Aussenegg, A. Leitner,
and J. R. Krenn, “How to erase surface plasmon fringes,” Appl. Phys. Lett. 89(9), 091117 (2006).
25. J. W. Goodman, “Introduction to Fourier Optics”, 3rd Ed., Robert & Com., 2005.
26. M. L. M. Balistreri, J. P. Korterik, L. Kuipers, and N. F. van Hulst, “Phase Mapping of Optical Fields in
Integrated Optical Waveguide Structures,” J. Lightwave Technol. 19(8), 1169–1176 (2001).
27. M. L. M. Balistreri, J. P. Korterik, L. Kuipers, N. F. van Hulst, “Local Observations of Phase Singularities in
Optical Fields in Waveguide Structures,” Phys. Rev. Lett. 85(2), 294–297 (2000).
28. H. L. Offerhaus, B. van den Bergen, M. Escalante, F. B. Segerink, J. P. Korterik, and N. F. van Hulst, “Creating
Focused Plasmons by Non-collinear Phase-matching on Functional Gratings,” Nano Lett. 5(11), 2144–2148
(2005).
1. Introduction
In recent years the study and manipulation of subwavelength optical fields is attracting great
interest owing to the potential applications in biophotonics, ultrafast communication and
quantum optics. In particular, the field of surface plasmon optics has opened new avenues in
understanding the light-matter interaction at the nanoscopic level [1]. Surface plasmon
polaritions (SPP) are two-dimensional electron waves propagating along a metal-dielectric
interface coupled to the electromagnetic fields that are evanescent in the direction
perpendicular to the surface [2]. The surface confinement of SPPs make them interesting
candidates for studying several optical phenomena as the propagation properties of SPPs are
strongly dictated by the surface morphology of the interface between the metal and the
dielectric. Any surface defect at the interface can act as a scattering center thereby altering the
propagation of the SPPs. The interaction of SPPs with surface defects has been studied
extensively both theoretically [3, 4] as well as experimentally [5]. The sensitivity of SPP
towards surface defects has led researchers to make use of the property for designing several
optical elements like Bragg mirrors [6–9], beam splitters, interferometers [7] and nanolenses
[10, 11].
The scattering of SPP with periodically patterned defects is of particular interest as it
invokes several interesting phenomena that are analogous to those found in conventional
optics. One such effect is the revival or self-imaging of the field after transmission or
reflection from a periodic structure, called Talbot effect [12]. This effect, originally
discovered by H. F. Talbot, has been observed in classical as well as in quantum optics. The
Talbot length τ, at which the periodicity is revived, is given by2
2 /aτ λ= in the paraxial
approximation, where a is the period of the array and λ the wavelength. The self-imaging
Talbot effect can be regarded as the interference of different orders of the electromagnetic
waves that are diffracted when they pass through a periodic structure.
The Talbot effect in optics is well studied both theoretically as well as experimentally
[13–16]. F. M. Huang et al. have reported on the free space Talbot effect after transmission
through a quasi-crystal array of nano-holes on a metallic film [17]. Sub-wavelength light
(C) 2009 OSA 21 December 2009 / Vol. 17, No. 26 / OPTICS EXPRESS 23773#118474 - $15.00 USD Received 12 Oct 2009; revised 30 Nov 2009; accepted 2 Dec 2009; published 11 Dec 2009
spots were observed for different heights from the nano-hole array plane. However, studies of
the Talbot effect on electromagnetic surface waves have mostly been restricted to theoretical
simulations. Dennis et al. has shown theoretically that it is possible to create complex
plasmon carpets containing hot spots by a row of periodically spaced surface defects on a
metal surface [18]. Their system consisted of a row of holes drilled in Ag film, illuminated
from the backside. Both numerical and analytical calculations for plasmonic Talbot effect
were discussed and the revival of propagating plasmons at the Talbot distances was observed.
More recently, Maradudin and Leskova have reported some theoretical studies on the Talbot
effect for SPP using an impedance boundary condition approach [19]. Lately, Zhang et al.
have for the first time observed experimentally complex plasmon Talbot pattern generated by
periodic indentations on a metal film [20].
In this paper we present both experimental and theoretical study of the plasmonic Talbot
effect generated near a periodic arrangement of nanostructures on a thin metal film. We
develop a simple theoretical model based on a dipole scattering approximation taking into
account a finite number of dipolar scatterers and describes the full physics involved. On the
experimental side, we first study the Talbot effect using leakage radiation microscopy. We
show that it is possible to create complex Talbot carpets using plasmonic fields after
transmission or reflection from a periodic array of metal nanostructures lying on a metal film.
Next we perform heterodyne interferometer based near-field microscopic characterization of
the plasmonic Talbot pattern and reveal the phase and amplitude information of the Talbot
carpet pattern. The subwavelength resolution of the near-field microscopic images enables us
to measure the spatial confinement of individual Talbot hot-spots.
2. Theoretical description of the plasmonic Talbot pattern
The Talbot effect is usually described as a periodic self constructive focusing of light passing
through a periodic structure. This effect is a direct consequence of the Fresnel diffraction that
assumes that each element of the structure emits a spherical wave whose spatial dependence
is proportional to /ikR
e R . The term ikRe represents the propagation behavior, while the
( )1/ R dependence allows the energy conservation flow through a surface surrounding the
source of wave emission. The field measured at any position after the periodic structure is the
sum of the field created by all the individual sources at this position. It is straightforward to
deduce the expression of the Talbot length τ with such approximations. To model the
plasmonic Talbot effect a similar hypothesis can be used. Nevertheless, applying Fresnel
formula directly for plasmonic structures is not justified and Fourier optics for surface waves
has to be considered in such cases [21]. Indeed, surface plasmons are two-dimensional waves
and not spherical waves. As a result, the ( )1/ R dependence, valid only in the three-
dimensional case, does not hold anymore and has to be replaced by a 1/ R dependence [9].
Hence, the modeled field emitted by a single dipolar emitter is now proportional to:
( ) ,
ikp
Re
G RR
⋅
=
�
�
�
� (1)
where 2p p
k π λ=�
is the wave vector of the plasmon whose real part gives the wavelength of
propagation p
λ at the interface and imaginary part gives the damping due to Joule effect
during propagation. Here R�
is a vector in the interface plane, whose norm R�
gives the
distance between the measured field and the dipole emitter position.
(C) 2009 OSA 21 December 2009 / Vol. 17, No. 26 / OPTICS EXPRESS 23774#118474 - $15.00 USD Received 12 Oct 2009; revised 30 Nov 2009; accepted 2 Dec 2009; published 11 Dec 2009
To calculate the field at any point of the interface, each emitter is assumed to have a
dipolar moment n
p induced by the driven field such as ( )n np = αE R
�
, where α represents the
polarisability, n
R�
the emitter position in the interface plane indexed by the integer n and
( )nE R�
the field at positionn
R�
. With those notations, the field ( )E R�
at any position R�
satisfies the following expression:
( ) ( ) ( ) ( ) ( ) ( ).inc inc
n n n n
n n
E R = E R + G R R p = E R +α G R R E R− −∑ ∑� � � � � � � �
(2)
The field measured at any position ( )nR, R R n≠ ∀� � �
is the sum of the incident field
( )incE R�
at position R�
added by the contribution of the field of all the independent emitters.
This expression is a reformulation of the Lippmann-Schwinger equation for this particular
case. Forn
R = R� �
the self interaction when n = n' has to be removed from the sum over all the
structures. Expression (2) becomes:
( ) ( ) ( ) ( ).inc
n n n' n'
n n'
E R = E R +α G R R E R≠
−∑� � � � �
(3)
By changing notations ( ) ( ) for and 0 for n n n n' nn'
E R = E ,G R R = G n n' n = n'− ≠� � �
this self
consistent equation can easily be casted into a matrix of the form
,inc
E = E +G E⋅ (4)
where E is the column vector of elements n
E and G a square matrix of general termnn'
G .
Note that the condition 0 for nn'
G = n = n' allows removing naturally the self interaction
between the structures themselves. By inverting (4), we end up with:
( )1
,incE = Id G E−
− ⋅ (5)
where Id is the identity matrix. The column vector E represents the field at the dipole emitter
position which is the result of the incident field and the cross interaction between the nano-
emitters themselves. Deducing E by solving Eq. (5) and introducing the solution in Eq. (2) we
are able to calculate the field at any position at the interface plan. The dimension of the matrix
G is exactly the number of pillars. In accordance with our experimental samples, we consider
only 20 nanostructures for the numerical simulations, which makes the equation solvable
rapidly. Working with gold film at a wavelength around 785 nm, the damping of plasmon
propagation can diminish the observation of the Talbot carpets. To permit all the dipole
emitters to interfere efficiently, we kept the array parameters close to the wavelength.
Moreover, this makes the Talbot pattern simpler for analysis.
Figure 1 (a) and (b) shows two examples of the plasmonic Talbot effect on a gold-air
interface using our formalism for periods 800 nm and 1200 nm respectively. The images
represent the intensity of the field for an area of 22 µm 22 µm× . The incident beam incE is a
SPP having a transverse Gaussian profile 30 µm wide coming from the left to the right at a
wavelength of 785 nm. We see clearly the incident beam being transmitted and reflected by
the array forming a complex field pattern. This kind of plasmonic Talbot carpet has been
already observed numerically by Dennis et. al [18] where the incident beam is launched
perpendicular to the interface and not from the interface itself as in our case.
(C) 2009 OSA 21 December 2009 / Vol. 17, No. 26 / OPTICS EXPRESS 23775#118474 - $15.00 USD Received 12 Oct 2009; revised 30 Nov 2009; accepted 2 Dec 2009; published 11 Dec 2009
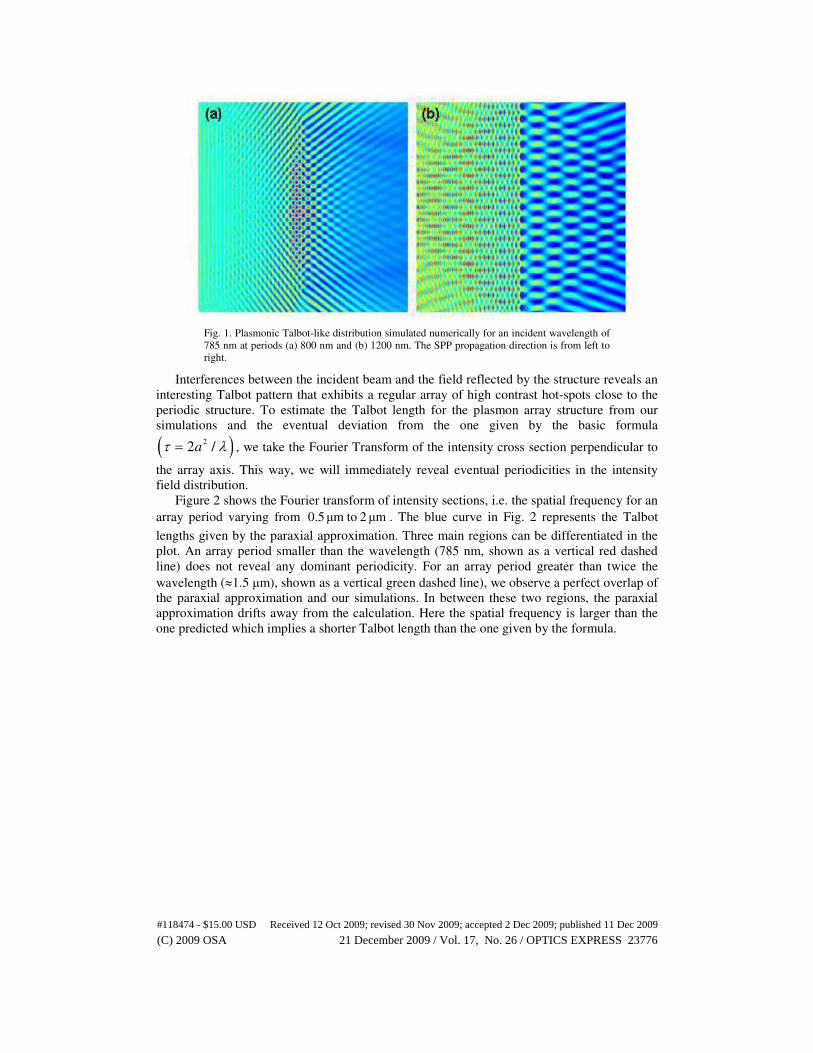
Fig. 1. Plasmonic Talbot-like distribution simulated numerically for an incident wavelength of
785 nm at periods (a) 800 nm and (b) 1200 nm. The SPP propagation direction is from left to
right.
Interferences between the incident beam and the field reflected by the structure reveals an
interesting Talbot pattern that exhibits a regular array of high contrast hot-spots close to the
periodic structure. To estimate the Talbot length for the plasmon array structure from our
simulations and the eventual deviation from the one given by the basic formula
( )22 /aτ λ= , we take the Fourier Transform of the intensity cross section perpendicular to
the array axis. This way, we will immediately reveal eventual periodicities in the intensity
field distribution.
Figure 2 shows the Fourier transform of intensity sections, i.e. the spatial frequency for an
array period varying from 0.5 µm to 2 µm . The blue curve in Fig. 2 represents the Talbot
lengths given by the paraxial approximation. Three main regions can be differentiated in the
plot. An array period smaller than the wavelength (785 nm, shown as a vertical red dashed
line) does not reveal any dominant periodicity. For an array period greater than twice the
wavelength (≈1.5 µm), shown as a vertical green dashed line), we observe a perfect overlap of
the paraxial approximation and our simulations. In between these two regions, the paraxial
approximation drifts away from the calculation. Here the spatial frequency is larger than the
one predicted which implies a shorter Talbot length than the one given by the formula.
(C) 2009 OSA 21 December 2009 / Vol. 17, No. 26 / OPTICS EXPRESS 23776#118474 - $15.00 USD Received 12 Oct 2009; revised 30 Nov 2009; accepted 2 Dec 2009; published 11 Dec 2009
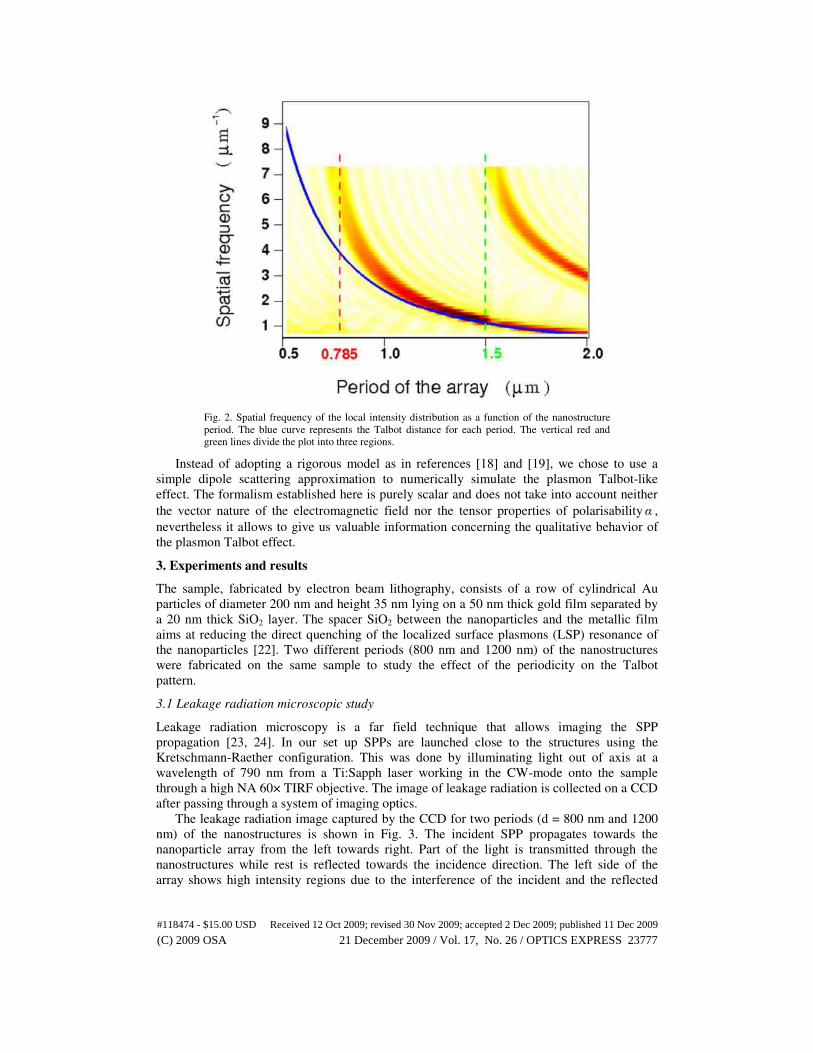
Fig. 2. Spatial frequency of the local intensity distribution as a function of the nanostructure
period. The blue curve represents the Talbot distance for each period. The vertical red and
green lines divide the plot into three regions.
Instead of adopting a rigorous model as in references [18] and [19], we chose to use a
simple dipole scattering approximation to numerically simulate the plasmon Talbot-like
effect. The formalism established here is purely scalar and does not take into account neither
the vector nature of the electromagnetic field nor the tensor properties of polarisability α ,
nevertheless it allows to give us valuable information concerning the qualitative behavior of
the plasmon Talbot effect.
3. Experiments and results
The sample, fabricated by electron beam lithography, consists of a row of cylindrical Au
particles of diameter 200 nm and height 35 nm lying on a 50 nm thick gold film separated by
a 20 nm thick SiO2 layer. The spacer SiO2 between the nanoparticles and the metallic film
aims at reducing the direct quenching of the localized surface plasmons (LSP) resonance of
the nanoparticles [22]. Two different periods (800 nm and 1200 nm) of the nanostructures
were fabricated on the same sample to study the effect of the periodicity on the Talbot
pattern.
3.1 Leakage radiation microscopic study
Leakage radiation microscopy is a far field technique that allows imaging the SPP
propagation [23, 24]. In our set up SPPs are launched close to the structures using the
Kretschmann-Raether configuration. This was done by illuminating light out of axis at a
wavelength of 790 nm from a Ti:Sapph laser working in the CW-mode onto the sample
through a high NA 60× TIRF objective. The image of leakage radiation is collected on a CCD
after passing through a system of imaging optics.
The leakage radiation image captured by the CCD for two periods (d = 800 nm and 1200
nm) of the nanostructures is shown in Fig. 3. The incident SPP propagates towards the
nanoparticle array from the left towards right. Part of the light is transmitted through the
nanostructures while rest is reflected towards the incidence direction. The left side of the
array shows high intensity regions due to the interference of the incident and the reflected
(C) 2009 OSA 21 December 2009 / Vol. 17, No. 26 / OPTICS EXPRESS 23777#118474 - $15.00 USD Received 12 Oct 2009; revised 30 Nov 2009; accepted 2 Dec 2009; published 11 Dec 2009
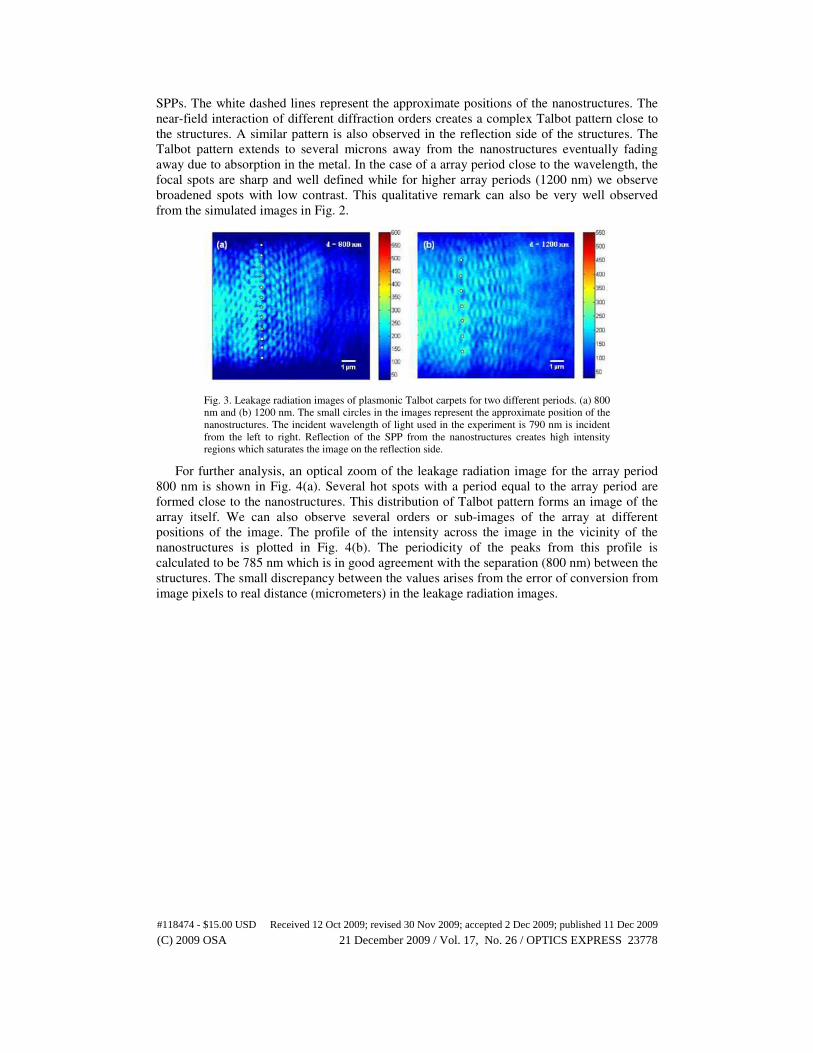
SPPs. The white dashed lines represent the approximate positions of the nanostructures. The
near-field interaction of different diffraction orders creates a complex Talbot pattern close to
the structures. A similar pattern is also observed in the reflection side of the structures. The
Talbot pattern extends to several microns away from the nanostructures eventually fading
away due to absorption in the metal. In the case of a array period close to the wavelength, the
focal spots are sharp and well defined while for higher array periods (1200 nm) we observe
broadened spots with low contrast. This qualitative remark can also be very well observed
from the simulated images in Fig. 2.
Fig. 3. Leakage radiation images of plasmonic Talbot carpets for two different periods. (a) 800
nm and (b) 1200 nm. The small circles in the images represent the approximate position of the
nanostructures. The incident wavelength of light used in the experiment is 790 nm is incident
from the left to right. Reflection of the SPP from the nanostructures creates high intensity
regions which saturates the image on the reflection side.
For further analysis, an optical zoom of the leakage radiation image for the array period
800 nm is shown in Fig. 4(a). Several hot spots with a period equal to the array period are
formed close to the nanostructures. This distribution of Talbot pattern forms an image of the
array itself. We can also observe several orders or sub-images of the array at different
positions of the image. The profile of the intensity across the image in the vicinity of the
nanostructures is plotted in Fig. 4(b). The periodicity of the peaks from this profile is
calculated to be 785 nm which is in good agreement with the separation (800 nm) between the
structures. The small discrepancy between the values arises from the error of conversion from
image pixels to real distance (micrometers) in the leakage radiation images.
(b)
(C) 2009 OSA 21 December 2009 / Vol. 17, No. 26 / OPTICS EXPRESS 23778#118474 - $15.00 USD Received 12 Oct 2009; revised 30 Nov 2009; accepted 2 Dec 2009; published 11 Dec 2009
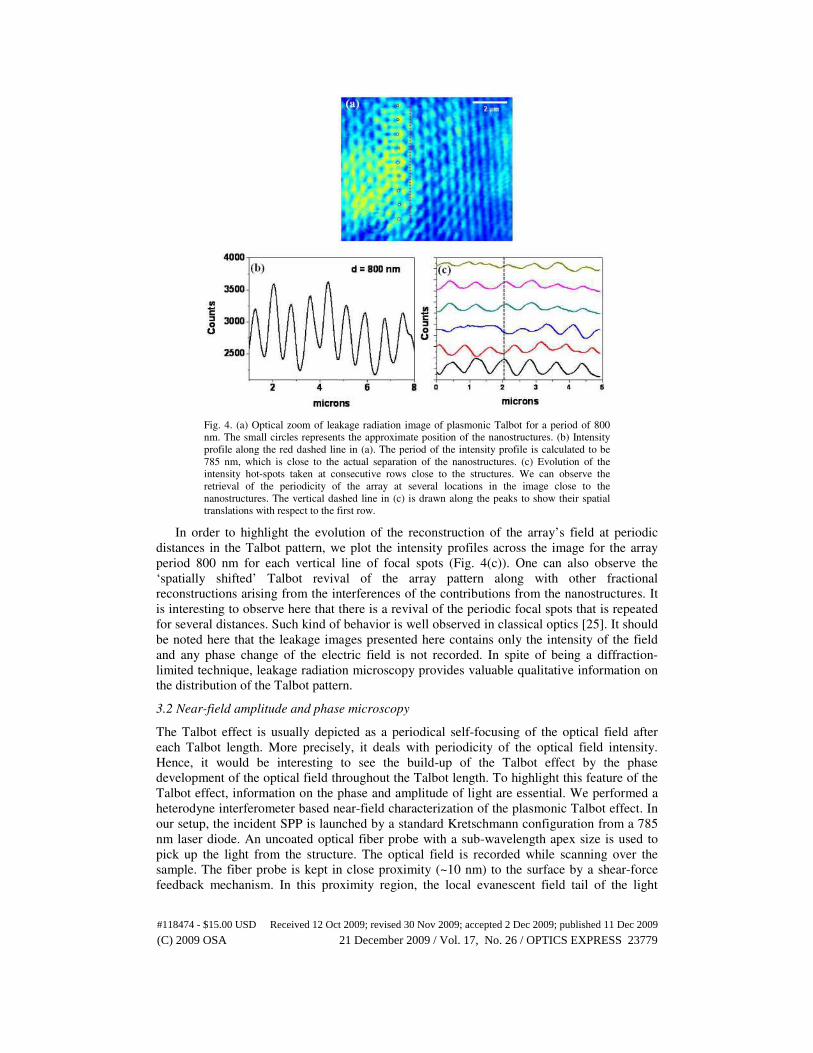
Fig. 4. (a) Optical zoom of leakage radiation image of plasmonic Talbot for a period of 800
nm. The small circles represents the approximate position of the nanostructures. (b) Intensity
profile along the red dashed line in (a). The period of the intensity profile is calculated to be
785 nm, which is close to the actual separation of the nanostructures. (c) Evolution of the
intensity hot-spots taken at consecutive rows close to the structures. We can observe the
retrieval of the periodicity of the array at several locations in the image close to the
nanostructures. The vertical dashed line in (c) is drawn along the peaks to show their spatial
translations with respect to the first row.
In order to highlight the evolution of the reconstruction of the array’s field at periodic
distances in the Talbot pattern, we plot the intensity profiles across the image for the array
period 800 nm for each vertical line of focal spots (Fig. 4(c)). One can also observe the
‘spatially shifted’ Talbot revival of the array pattern along with other fractional
reconstructions arising from the interferences of the contributions from the nanostructures. It
is interesting to observe here that there is a revival of the periodic focal spots that is repeated
for several distances. Such kind of behavior is well observed in classical optics [25]. It should
be noted here that the leakage images presented here contains only the intensity of the field
and any phase change of the electric field is not recorded. In spite of being a diffraction-
limited technique, leakage radiation microscopy provides valuable qualitative information on
the distribution of the Talbot pattern.
3.2 Near-field amplitude and phase microscopy
The Talbot effect is usually depicted as a periodical self-focusing of the optical field after
each Talbot length. More precisely, it deals with periodicity of the optical field intensity.
Hence, it would be interesting to see the build-up of the Talbot effect by the phase
development of the optical field throughout the Talbot length. To highlight this feature of the
Talbot effect, information on the phase and amplitude of light are essential. We performed a
heterodyne interferometer based near-field characterization of the plasmonic Talbot effect. In
our setup, the incident SPP is launched by a standard Kretschmann configuration from a 785
nm laser diode. An uncoated optical fiber probe with a sub-wavelength apex size is used to
pick up the light from the structure. The optical field is recorded while scanning over the
sample. The fiber probe is kept in close proximity (~10 nm) to the surface by a shear-force
feedback mechanism. In this proximity region, the local evanescent field tail of the light
(C) 2009 OSA 21 December 2009 / Vol. 17, No. 26 / OPTICS EXPRESS 23779#118474 - $15.00 USD Received 12 Oct 2009; revised 30 Nov 2009; accepted 2 Dec 2009; published 11 Dec 2009

propagating in the gold structure is coupled to the probe, converted into propagated waves,
guided by the optical fiber and finally detected in the far field.
To retrieve direct information on amplitude and phase, a reference phase is needed. To
this end the collected light is mixed with a reference beam into a heterodyne interferometer
arrangement. This way, the interference between the two branches is obtained yielding both
phase and amplitude of the local field [26–28].
Figure 5(a) shows an amplitude/phase measurement of a SPP launched towards a array of
the nanostructures with a period of 1200 nm. The black circles represent pillars position as
obtained from the shear force detection. We define the local optical field by the mathematical
expression
[ ]E(x, y) E (x, y) exp i (x, y) ,0= φi (6)
where E (x, y)0 is the amplitude and (x, y)φ the phase at position (x, y) . Figure 5(a)
represents the map of the real part cos( )E φ of the field obtained from the near-field
experiment. We clearly observe the wave front of the incident SPP weakly diffracted by the
array. The predominance of the incident plasmon makes the observation of any Talbot carpet
difficult. Fortunately, having the optical field map in a complex
form [ ]E (x, y) exp i (x, y)0 φi allows us to analysis the Talbot effect in the Fourier space. Figure
5(b) shows the two dimensional FFT of the measured optical field in its complex form. The
red circle in the image represents the light cone separating the lower spatial frequency wave
vectors associated with scattered light into the free space and high frequency wave vectors
associated with the evanescent waves bound to the surface (SPP). In order to reveal the
presence of diffracted orders of SPPs by the array, we filter out most part of scattering into
free space (gray region) as well as the incident SPP that dominates the spectrum. We can then
clearly observe a series of orders of diffraction in the near field (bright spots indicated by a
red arrow outside the light cone) and in the far field (bright spots inside the light cone). This
implies that the array structures not only scatter light into plasmonic modes but into free
space modes as well. Figure 5(c) shows the calculated real part of the optical field with the
same parameters as used in our experiments
(C) 2009 OSA 21 December 2009 / Vol. 17, No. 26 / OPTICS EXPRESS 23780#118474 - $15.00 USD Received 12 Oct 2009; revised 30 Nov 2009; accepted 2 Dec 2009; published 11 Dec 2009
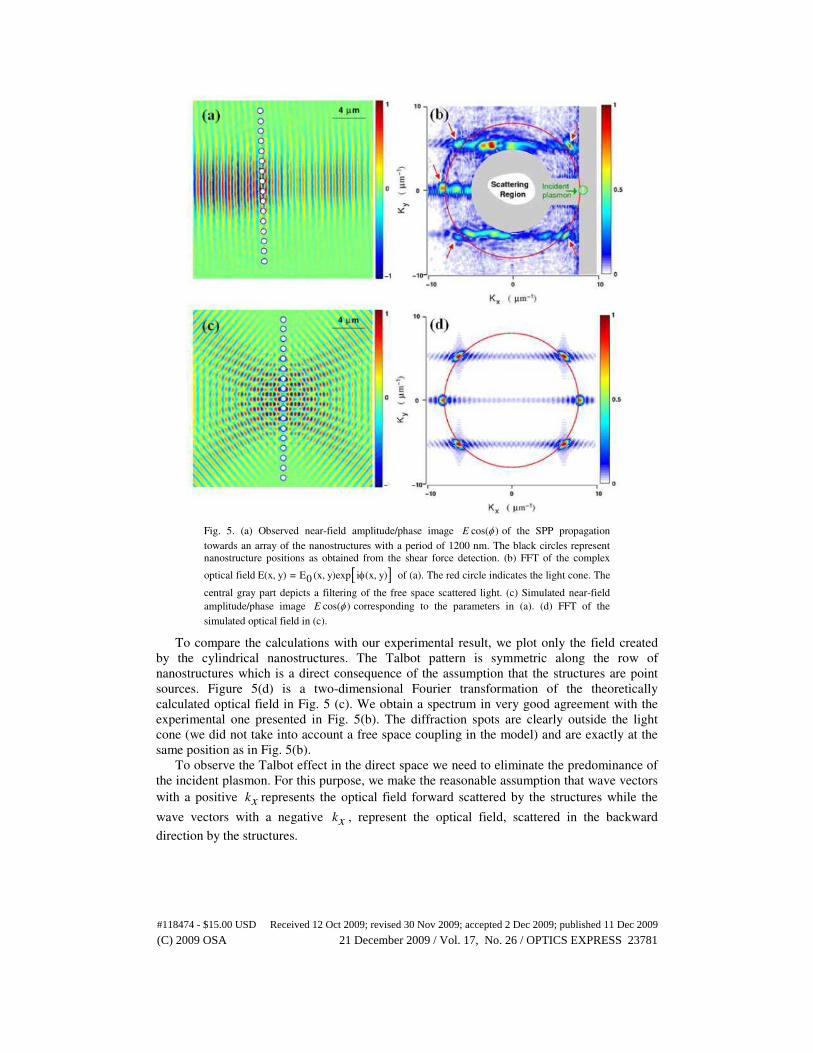
Fig. 5. (a) Observed near-field amplitude/phase image cos( )E φ of the SPP propagation
towards an array of the nanostructures with a period of 1200 nm. The black circles represent
nanostructure positions as obtained from the shear force detection. (b) FFT of the complex
optical field [ ]E(x, y) = E (x, y)exp i (x, y)0 φ of (a). The red circle indicates the light cone. The
central gray part depicts a filtering of the free space scattered light. (c) Simulated near-field
amplitude/phase image cos( )E φ corresponding to the parameters in (a). (d) FFT of the
simulated optical field in (c).
To compare the calculations with our experimental result, we plot only the field created
by the cylindrical nanostructures. The Talbot pattern is symmetric along the row of
nanostructures which is a direct consequence of the assumption that the structures are point
sources. Figure 5(d) is a two-dimensional Fourier transformation of the theoretically
calculated optical field in Fig. 5 (c). We obtain a spectrum in very good agreement with the
experimental one presented in Fig. 5(b). The diffraction spots are clearly outside the light
cone (we did not take into account a free space coupling in the model) and are exactly at the
same position as in Fig. 5(b).
To observe the Talbot effect in the direct space we need to eliminate the predominance of
the incident plasmon. For this purpose, we make the reasonable assumption that wave vectors
with a positive kx represents the optical field forward scattered by the structures while the
wave vectors with a negative kx , represent the optical field, scattered in the backward
direction by the structures.
(C) 2009 OSA 21 December 2009 / Vol. 17, No. 26 / OPTICS EXPRESS 23781#118474 - $15.00 USD Received 12 Oct 2009; revised 30 Nov 2009; accepted 2 Dec 2009; published 11 Dec 2009
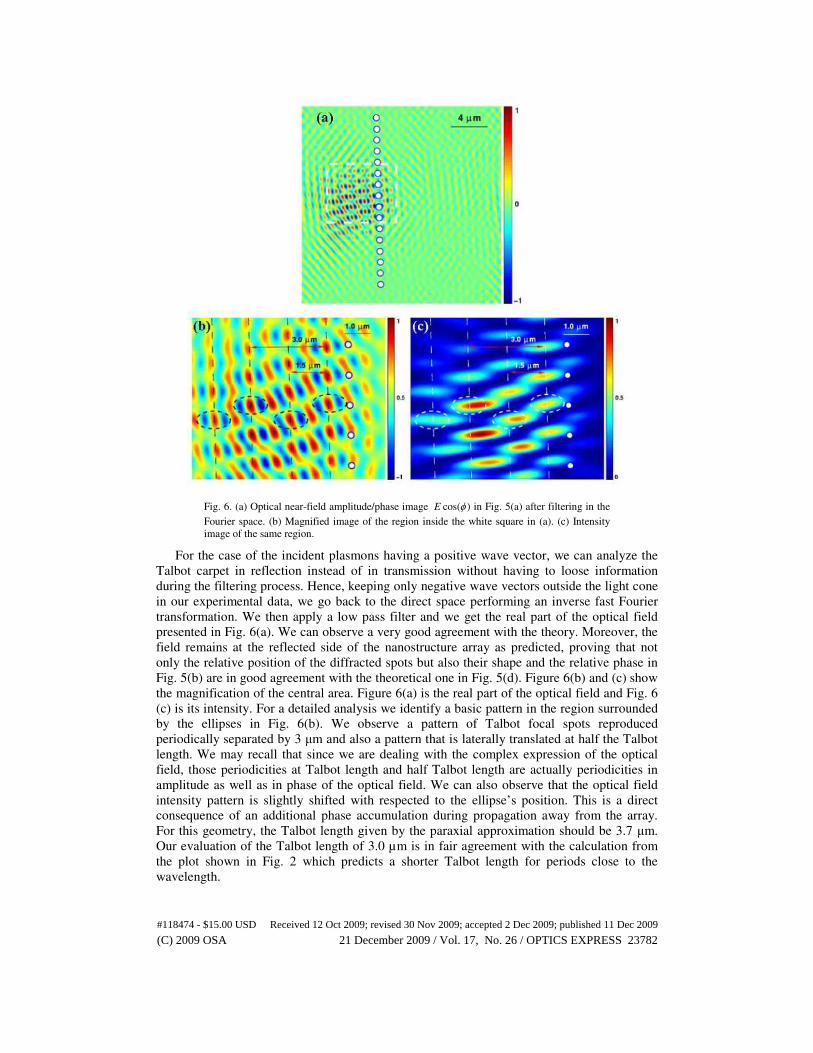
Fig. 6. (a) Optical near-field amplitude/phase image cos( )E φ in Fig. 5(a) after filtering in the
Fourier space. (b) Magnified image of the region inside the white square in (a). (c) Intensity
image of the same region.
For the case of the incident plasmons having a positive wave vector, we can analyze the
Talbot carpet in reflection instead of in transmission without having to loose information
during the filtering process. Hence, keeping only negative wave vectors outside the light cone
in our experimental data, we go back to the direct space performing an inverse fast Fourier
transformation. We then apply a low pass filter and we get the real part of the optical field
presented in Fig. 6(a). We can observe a very good agreement with the theory. Moreover, the
field remains at the reflected side of the nanostructure array as predicted, proving that not
only the relative position of the diffracted spots but also their shape and the relative phase in
Fig. 5(b) are in good agreement with the theoretical one in Fig. 5(d). Figure 6(b) and (c) show
the magnification of the central area. Figure 6(a) is the real part of the optical field and Fig. 6
(c) is its intensity. For a detailed analysis we identify a basic pattern in the region surrounded
by the ellipses in Fig. 6(b). We observe a pattern of Talbot focal spots reproduced
periodically separated by 3 µm and also a pattern that is laterally translated at half the Talbot
length. We may recall that since we are dealing with the complex expression of the optical
field, those periodicities at Talbot length and half Talbot length are actually periodicities in
amplitude as well as in phase of the optical field. We can also observe that the optical field
intensity pattern is slightly shifted with respected to the ellipse’s position. This is a direct
consequence of an additional phase accumulation during propagation away from the array.
For this geometry, the Talbot length given by the paraxial approximation should be 3.7 µm.
Our evaluation of the Talbot length of 3.0 µm is in fair agreement with the calculation from
the plot shown in Fig. 2 which predicts a shorter Talbot length for periods close to the
wavelength.
(C) 2009 OSA 21 December 2009 / Vol. 17, No. 26 / OPTICS EXPRESS 23782#118474 - $15.00 USD Received 12 Oct 2009; revised 30 Nov 2009; accepted 2 Dec 2009; published 11 Dec 2009
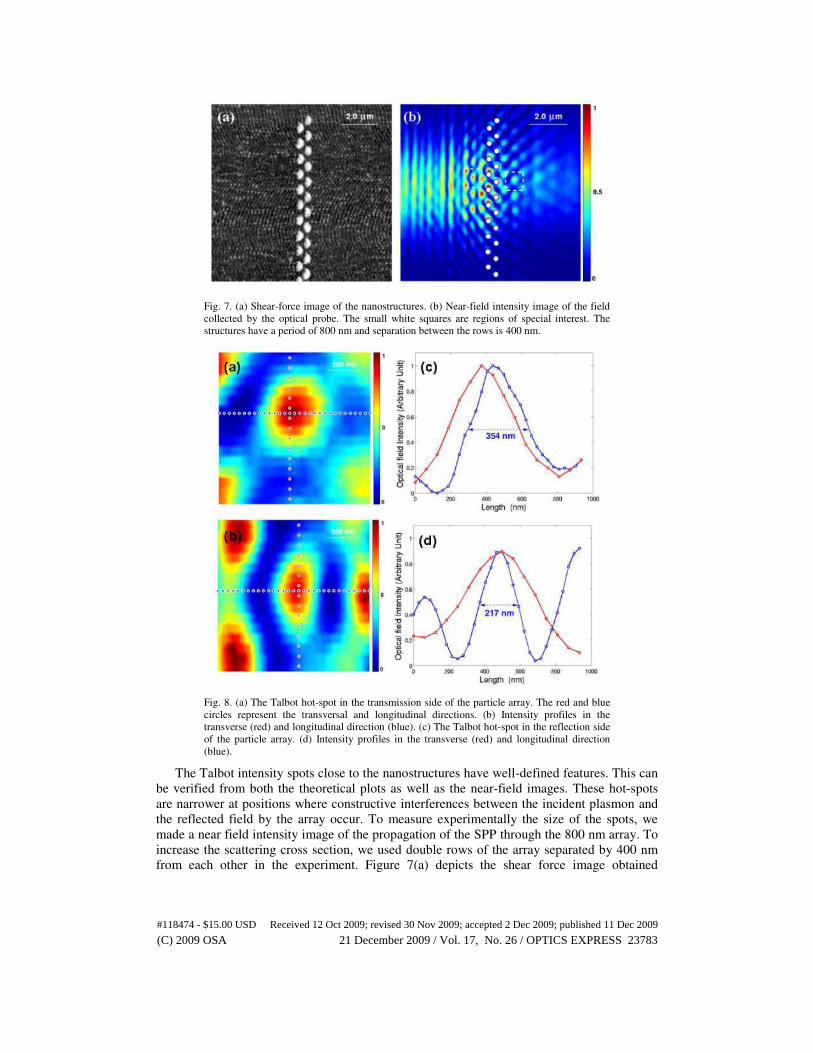
Fig. 7. (a) Shear-force image of the nanostructures. (b) Near-field intensity image of the field
collected by the optical probe. The small white squares are regions of special interest. The
structures have a period of 800 nm and separation between the rows is 400 nm.
Fig. 8. (a) The Talbot hot-spot in the transmission side of the particle array. The red and blue
circles represent the transversal and longitudinal directions. (b) Intensity profiles in the
transverse (red) and longitudinal direction (blue). (c) The Talbot hot-spot in the reflection side
of the particle array. (d) Intensity profiles in the transverse (red) and longitudinal direction
(blue).
The Talbot intensity spots close to the nanostructures have well-defined features. This can
be verified from both the theoretical plots as well as the near-field images. These hot-spots
are narrower at positions where constructive interferences between the incident plasmon and
the reflected field by the array occur. To measure experimentally the size of the spots, we
made a near field intensity image of the propagation of the SPP through the 800 nm array. To
increase the scattering cross section, we used double rows of the array separated by 400 nm
from each other in the experiment. Figure 7(a) depicts the shear force image obtained
(C) 2009 OSA 21 December 2009 / Vol. 17, No. 26 / OPTICS EXPRESS 23783#118474 - $15.00 USD Received 12 Oct 2009; revised 30 Nov 2009; accepted 2 Dec 2009; published 11 Dec 2009
simultaneously with the optical signal. Figure 6(b) shows the intensity of the field collected
by the optical probe. The nanostructure positions are represented by circles.
Figure 8(a) and (b) show the magnification of two regions where sharp contrast hot-spots
have been located. One region is taken from the transmission side while the other from
reflection part. To have a better estimation of the dimensions of each spot, we applied a linear
interpolation on them. For the spot at the transmission side, the FWHM of the spot has been
measured to be close to λ/2. On the other hand, the spot at the reflection side measures 217
nm longitudinally and 430 nm in the transverse direction. We can observe a ‘nano-focussing’
of the hot-spot in one direction with a FWHM close to λ/4 while a widening occurs in the
other direction. It should be noted that these hot spots are more than one wavelength away
from the nanostructures. This kind of asymmetrical behavior of the plasmon Talbot spots has
been discussed theoretically by Dennis et al. [18]. Such localization of hot-spots could be of
importance in nanolithography processes and optical sensing.
4. Conclusion
We have presented an experimental and theoretical study of the plasmonic Talbot effect. A
simple theory based on a dipolar scattering is developed. Interesting patterns of hot-spots for
a nanoparticle array period close to the wavelength are observed. The Talbot length calculated
for such periodic array is shorter than that obtained from a paraxial approximation. Leakage
radiation microscopy experiments were done to observe plasmonic Talbot effect. The leakage
images of the plasmonic Talbot carpets obtained for periods of nanostructure array close to
the wavelength give information on the complexity of the field patterns. Heterodyne
interferometer based near-field measurement gives us an interpretation of the Talbot effect in
the spatial Fourier space in terms of order of diffraction outside the light cone in perfect
agreement with our simulations. The observed deviation from the Talbot length formula is in
good agreement with theory. Plasmonic hot-spots of lateral dimension close to λ/4 have been
observed. Such highly confined focal spots can find interesting applications in nanoscale
plasmonic devices.
Acknowledgment
This research has been funded by the Spanish Ministry of Science and Innovation through
Grant Nos. TEC2007-60186/MIC, CSD2007-046-NanoLight.es, the Juan de la Cierva
program (D.H.) and by La Fundació CELLEX Barcelona. The authors would like to also
acknowledge Jan Renger for his help in the leakage radiation microscopy experiment and
Alberto G. Curto for fruitful discussions. SC and DH contributed equally to this paper.
(C) 2009 OSA 21 December 2009 / Vol. 17, No. 26 / OPTICS EXPRESS 23784#118474 - $15.00 USD Received 12 Oct 2009; revised 30 Nov 2009; accepted 2 Dec 2009; published 11 Dec 2009