Local low carbon development initiatives in Fukushima...Local low carbon development initiatives in...
23
Local low carbon development initiatives in Fukushima Gomi Kei National Institute for Environmental Studies, Japan (NIES) 2015/Jan/23 AIM International Workshop @NIES
Transcript of Local low carbon development initiatives in Fukushima...Local low carbon development initiatives in...
Local low carbon development initiatives in Fukushima
Gomi Kei National Institute for Environmental Studies, Japan (NIES)2015/Jan/23AIM International Workshop @NIES

Toward Local Society Design
Planning of relatively small municipality
Population decrease and aged society
Employment
Energy
2

Shinchi town (新地町)
A small town in Tohoku
North most of Fukushima’s coastal region.
50km north of Fukushima-daiichi power plant
50km south from Sendai city
3
Tokyo
SendaiShinchi
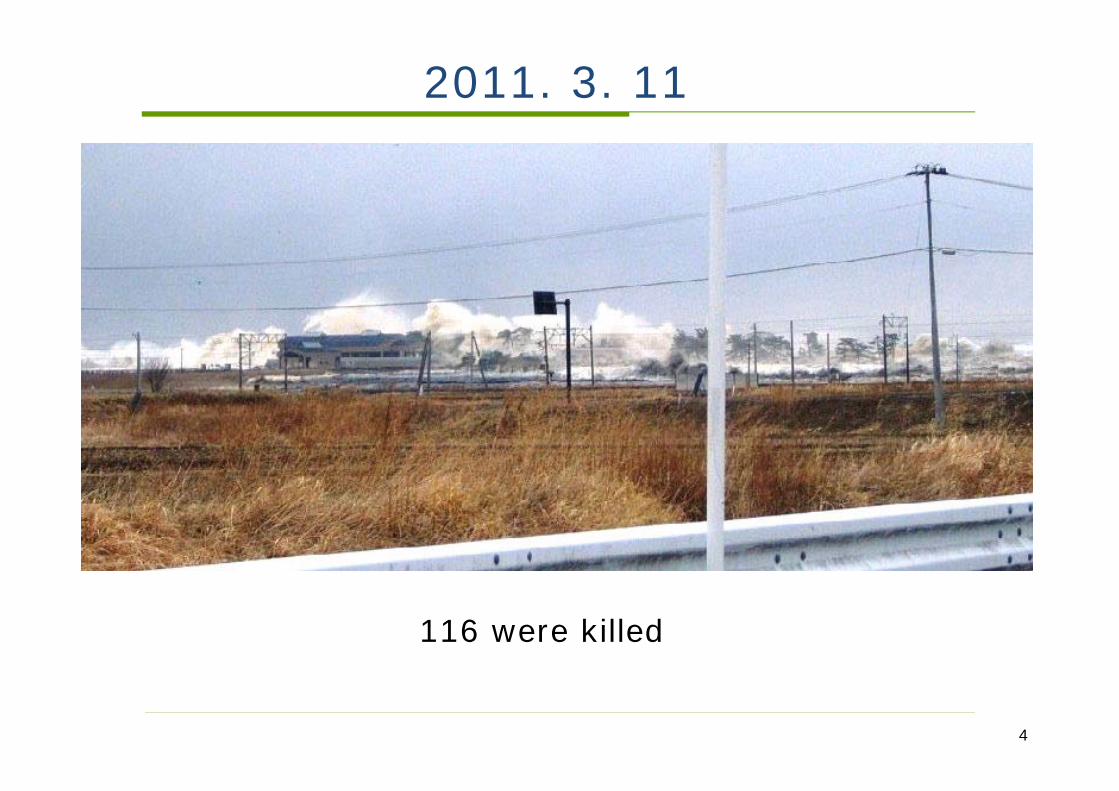
2011. 3. 11
4
116 were killed

2011.3.11
5

Recovery? 2014. Feb
6

Even without Tsunami,
7
Population decrease Aged society
Employment Agriculture

LNG facility
8
JAPEX (Japan Petroleum Exploration Co. Ltd.)Operation: From 2018Investment: 60Bill. Yen Employment for construction: 1000

Modeling
How much alternative scenarios can enhance its activity level
Describe effects and interaction of : Industry policies Residence policies Transport policies Energy policies Family and welfare policies
Least data requirement9
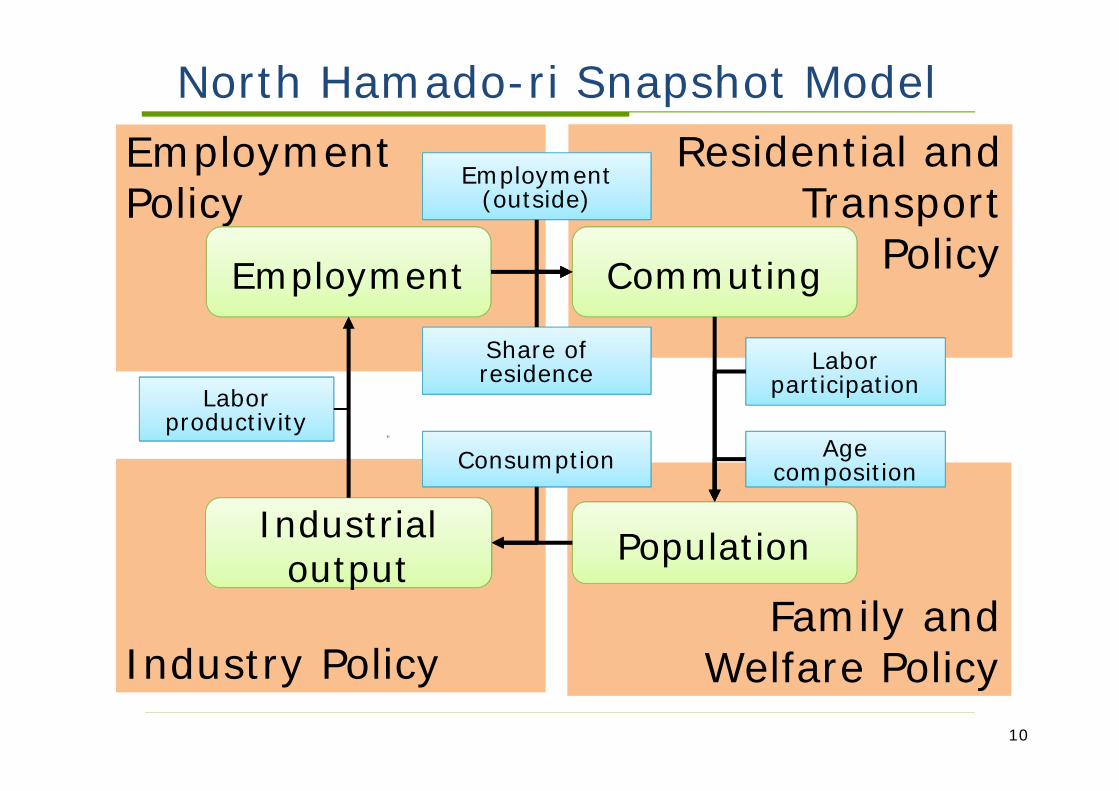
Family and Welfare PolicyIndustry Policy
Residential and Transport
Policy
Employment Policy
North Hamado-ri Snapshot Model
10
pIndustrial
output
CommutingEmployment
Population
Share of residence
Age composition
Labor participation
Consumption
Labor productivity
Employment(outside)
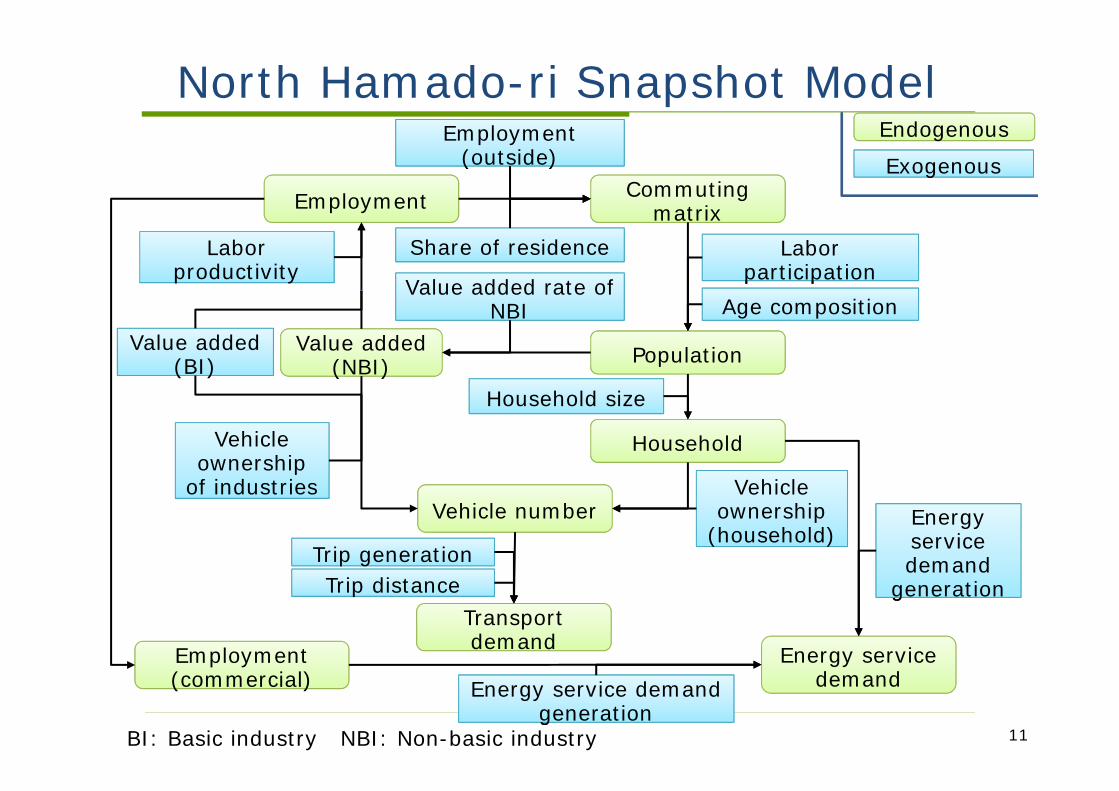
North Hamado-ri Snapshot Model
11
Age composition
Household size
Household
( )
Vehicle ownership
(household)
Vehicle ownership
of industriesVehicle number
Transport demand Energy service
demand
p gTrip generationpTrip distance g
Energy service demand
generation
( )Value added
(BI) ( )Value added
(NBI)
p yLabor
productivityShare of residence
Commuting matrix
Value added rate of NBI
Employment
Population
p pLabor
participation
( )Employment (commercial)
gEnergy service demand
generation
gEndogenous
gExogenous( )Employment
(outside)
BI: Basic industry NBI: Non-basic industry
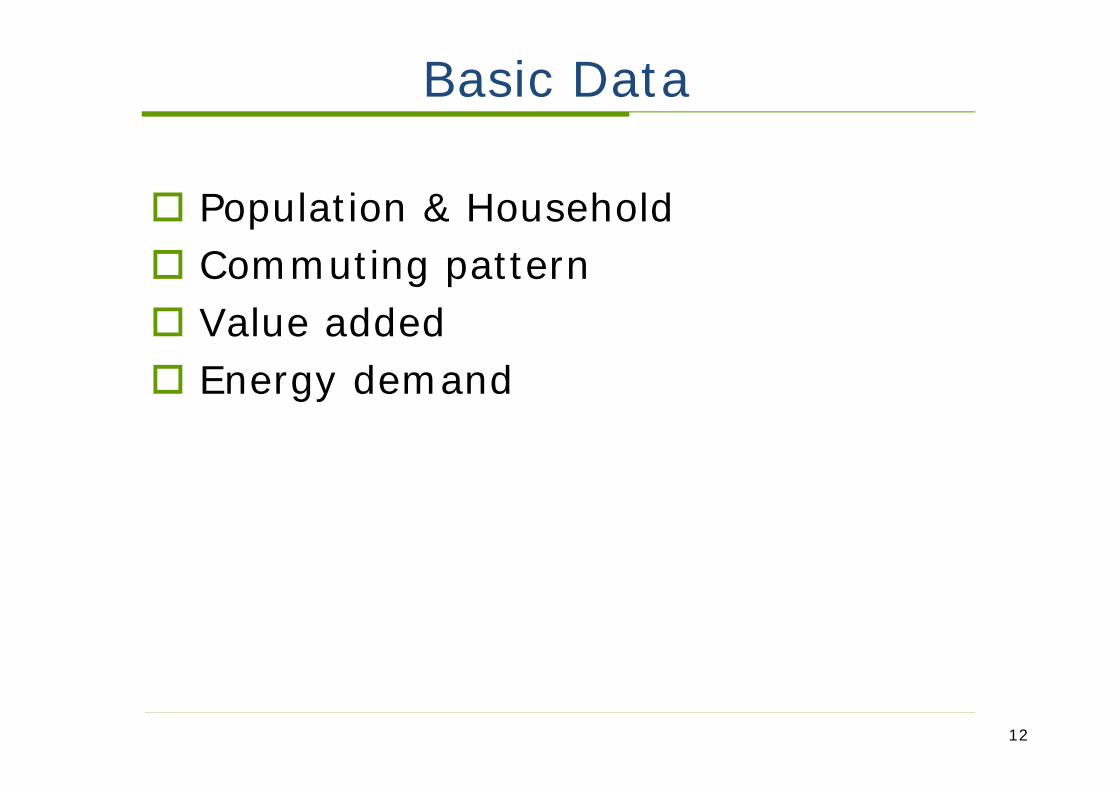
Basic Data
Population & Household Commuting pattern Value added Energy demand
12
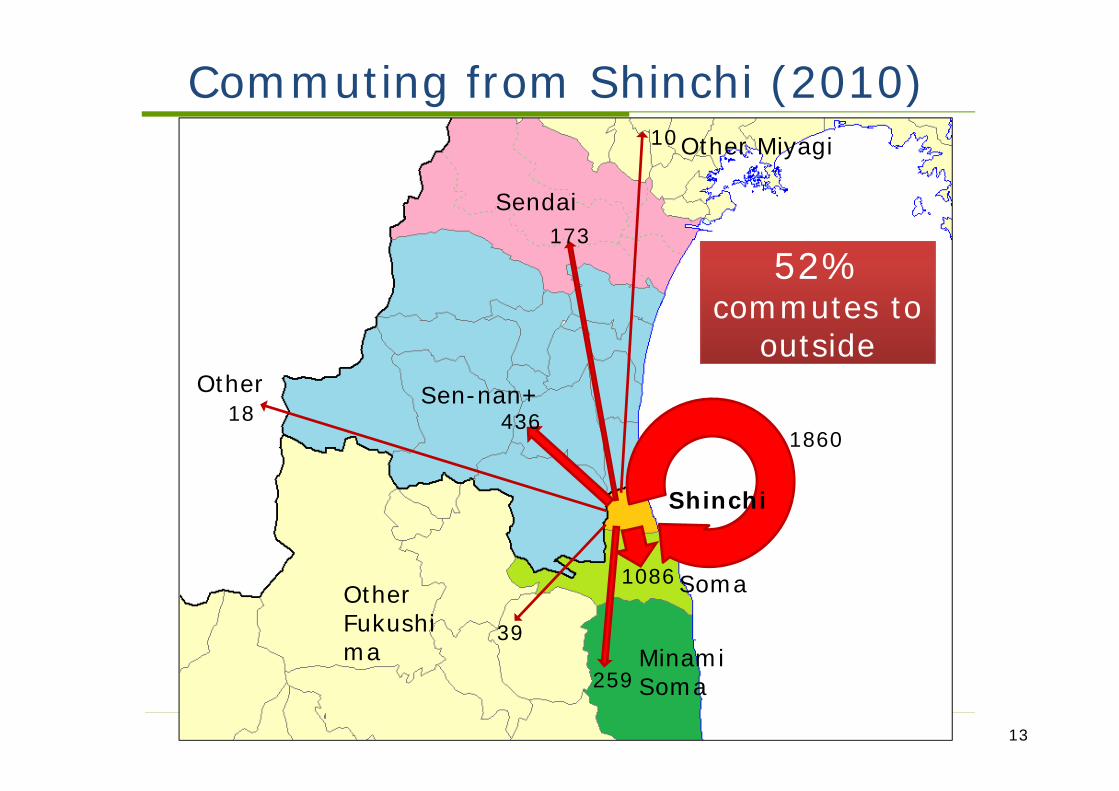
Commuting from Shinchi (2010)
13
Sendai
Soma
Minami Soma
Sen-nan+
Other Fukushima
Other Miyagi
1860
259
1086
39
436
173
10
Other18
52%commutes to
outside
Shinchi

Commuting to Shinchi (2010)
14
1860
224
782
38
19
23
4 436
41%commutes
from outside
Sendai
Shinchi
Soma
Minami Soma
Sen-nan+
Other Fukushima
Other Miyagi
Other
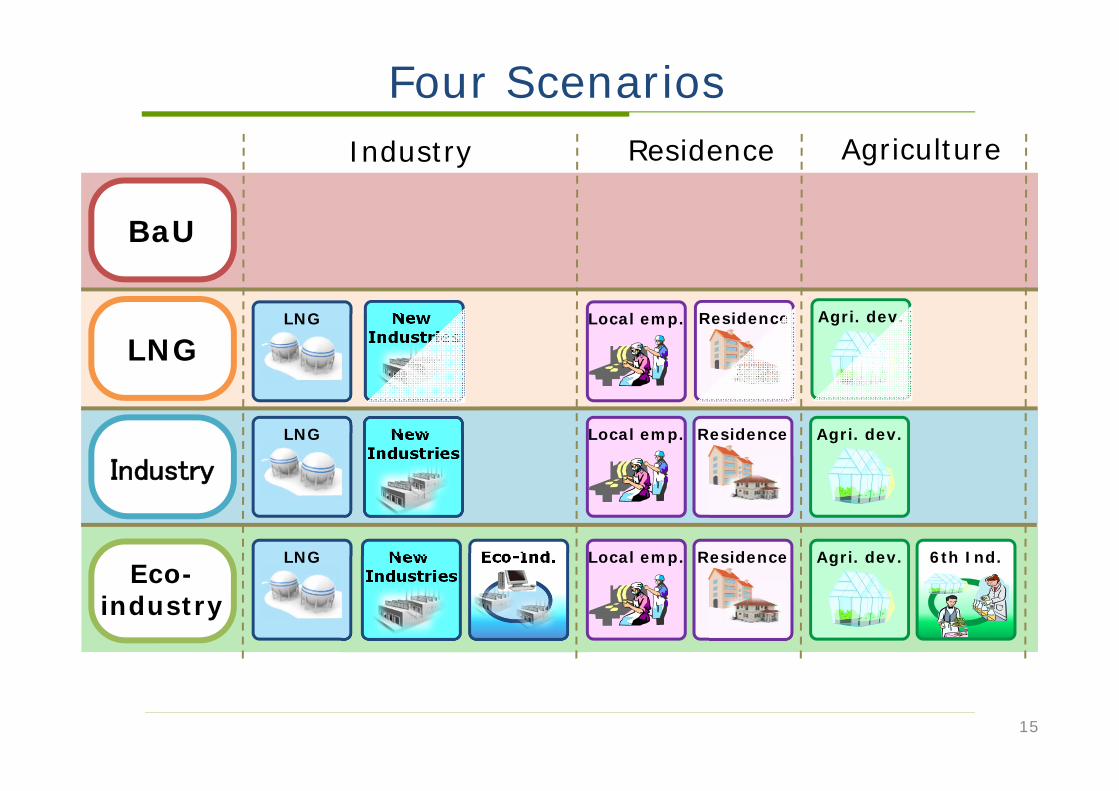
Four Scenarios
15
BaU
LNG
Industry
Eco-industry
LNG
LNG New Industries
LNG New Industries
Eco-Ind.
Agri. dev.
Agri. dev. 6th Ind.
Local emp.
Local emp.
Local emp. Residence
Residence
Industry Residence Agriculture
New Industries
Agri. dev.Residence

Projection of 4 scenarios
16
0
10
20
30
40
50
60
70
2005 2010 2015 2020 2025 2030 2035 2040 2045 2050
Bill. Yen
0
1,000
2,000
3,000
4,000
5,000
6,000
7,000
8,000
9,000
10,000
2005 2010 2015 2020 2025 2030 2035 2040 2045 2050
Popu
latio
nEco-IndustryIndustry
LNGBaU
Popu
latio
nG
RP
Eco-IndustryIndustryLNG
BaU
Caused by recovery from disaster.

Projection of 4 scenarios
17
0
10
20
30
40
50
60
70
2005 2010 2015 2020 2025 2030 2035 2040 2045 2050
Bill. Yen
0
1,000
2,000
3,000
4,000
5,000
6,000
7,000
8,000
9,000
10,000
2005 2010 2015 2020 2025 2030 2035 2040 2045 2050
Popu
latio
nEco-IndustryIndustry
LNGBaU
Popu
latio
nG
RP
Eco-IndustryIndustryLNG
BaU
LNG increases GRP, rather than
population

Energy & CO2
18
By Dr. Shiraki (NIES)
0
5
10
15
20
25
30
35
40
45
50
0
50
100
150
200
250
300
350
400
450
500
[kt-CO
2]
[TJ]
農林漁業 建設鉱業 家庭
業務 製造業 CO2排出量
0
5
10
15
20
25
30
35
40
45
50
0
50
100
150
200
250
300
350
400
450
500
[kt-CO
2]
[TJ]
農林漁業 建設鉱業 家庭
業務 製造業 CO2排出量
BaU Eco-industry
AGRCOM
CSTMNF
RESCO2 emissions
AGRCOM
CSTMNF
RESCO2 emissions

Energy & CO2
19
By Dr. Shiraki (NIES)
0
5
10
15
20
25
30
35
40
45
50
0
50
100
150
200
250
300
350
400
450
500
[kt-CO
2]
[TJ]
農林漁業 建設鉱業 家庭
業務 製造業 CO2排出量
0
5
10
15
20
25
30
35
40
45
50
0
50
100
150
200
250
300
350
400
450
500
[kt-CO
2]
[TJ]
農林漁業 建設鉱業 家庭
業務 製造業 CO2排出量
BaU Eco-industry
AGRCOM
CSTMNF
RESCO2 emissions
AGRCOM
CSTMNF
RESCO2 emissions

From the scenarios to the programs
20
0
1,000
2,000
3,000
4,000
5,000
6,000
7,000
8,000
9,000
10,000
2005
2010
2015
2020
2025
2030
2035
2040
2045
2050
Gap
Short term
Long term
Mid term

Appendix
21

North-Hamadori Snapshot Model
22
世帯数車両
保有台数車両
走行距離 内生変数 外生変数エネルギーサービス需要(家庭・業務)
産業生産額
就業者数
,, , / i ri r i rL VA LP
,,
,
,
( )
( )
nb rr aa
i r
b r
P VAP for i nbVA
VA for i b
, ,, , ,i s ri r i s rL RS CM
, ,, , ,,
/ s s r s ai s r s ai r r
CM LPR Lout PC P
人口
通勤者数
純移動
出生率
生残率
移動調整前人口
農業・製造業等
商業・サービス業等
商業・サービス業等
農業・製造業等
町内→町外町内→町内
町外→町内
前期人口
居住人口
350 300 250 200 150 100 50 0 50 100 150 200 250 300
00_0405_0910_1415_1920_2425_2930_3435_3940_4445_4950_5455_5960_6465_6970_7475_7980_84
85_Over
女性 男性
産業の労働需要から雇用を求める
人口に見合う生産額を求める
産業誘致・農業振興施策等から想定する
町外への通勤、町外からの通勤を含む通勤パターンを推計する
雇用と前期の人口、出生・死亡要因から居住人口を求める

NHSMの定式化
23
,, , / i ri r i rL VA LP
,,
,
,
( )
( )
nb rr aa
i r
b r
P VAP for i nbVA
VA for i b
, ,, , ,i s ri r i s rL RS CM
, ,, , ,,
/ s s r s ai s r s ai r r
CM LPR Lout PC P
11
, ,
( 0)
( 0)t-1,s,at-1,s,a
t s a t-1,s,at-1,s,aa
P SVR for aP P BR for a
, , ,s a s a s aP P NM
, / ss a sa
P HS HHD
, ,s ps s pHHD VOW VH
,, ,r fi r r fi
VA VOW VH
,,, ,s cs cs c s cVH TG TD VKT
,
,,
, ,
,
,
( )
( )
( )( )
s res,esvs
s com,esvt sts eds esv
pas s
c s
HHD ESVG for eds res
L ESVG for eds comESVD
VA for eds pasVKT for eds c
内生変数 VAnb,r: 地域 r の非基盤産業 nb の付加価値 [億円] Li,r: 地域 r で産業 i に就業する就業者数 [人] CMi,s,r: 地域 s に住み地域 r で産業 i に就業する就業者数(通勤マトリクス)[人] Ps,a: 地域 s に住む年齢 a の人口[人] Pt-1,s,a-1: 前期に地域 s に住んでいた年齢 a-1 の人口[人] P’s,a: 前期人口から求めた移動考慮前の地域 s に住む年齢 a の人口[人] NMs,a: 当期において地域 s に住む年齢 a の者の前期からの純移動[人] HHDs: 地域 s の世帯数 [世帯] VHs,c: 地域 s の車両 c の保有台数[台] VKTs,c: 地域 s の車両 c の走行距離 [台 km] ESVDs,eds,esv: 地域 s のエネルギー需要部門 edsにおけるエネルギーサービス esvのエネルギーサービス需要 (単位はエネルギーサービスによって異なる) 外生変数
VA______
b,r: 地域 r の基盤産業 b の付加価値 [億円] LP______
i,r: 地域 r の産業 i の付加価値労働生産性 [億円/人] RS______
i,s,r:地域 r で産業 i に就業する就業者のうち地域 s の居住地域構成比[-] Lout_________
s,r: 地域 r に住み域外の地域 s で就業する就業者数[人] VAP_________
nb,r: 地域 r の常住人口一人当たりの非基盤産業 nb の付加価値 [億円/人] LPR________
s: 地域 s に住む者の就業率[-] PC______
s,a: 地域 s に住む者のうち年齢 a の年齢構成比[-] SVR________
t-1,s,a-1: 前期に地域 s に住んでいた年齢 a-1 の者の生残率[-] BR______
t-1,s,a-1: 前期に地域 s に住んでいた年齢 a-1 の者の出生率[-] HS______
s: 地域 s の平均世帯人員[人/世帯] VOW__________
s,p: 地域 s の車両(乗用)p の世帯当たり保有台数[台/世帯] VOW__________
r,f: 地域 r の車両(貨物用)f の全産業付加価値当たり保有台数[台/世帯] TG______
s,c: 地域 s の車両 c の年間トリップ数 [-] TD______
s,c: 地域 s の車両 c の平均トリップ長 [km] ESVG____________
s,eds,esv: 地域 s のエネルギー需要部門 eds におけるエネルギーサービス esv のエネルギーサービス需要原
単位 (単位はエネルギー需要部門およびエネルギーサービスによって異なる) 添え字 t: 年(式(5)を除いて全ての式の全ての変数に添えられる。表記を簡略化するため省略) r, s: 地域 I: 産業の集合 i : 産業 (i∈I) b: 基盤産業(b∈I) nb: 非基盤産業(nb∈I, b∧nb=φ ) com: 業務部門に属する産業(com∈I) pas: 第一次・第二次産業(pas∈I, com∧pas=φ) a: 年齢