
Linking PR to Sales (South Carolina Governor's Conference on Tourism & Travel)
26
Slide 1 -- February 21, 2011 South Carolina Governor’s Conference on Tourism & Travel – February 21, 2011 Tim Marklein, Executive VP, Measurement & Strategy [email protected] Twitter: @tmarklein Communications Measurement: Linking PR to Sales Planning Optimization ROI
-
Upload
tim-marklein -
Category
Documents
-
view
1.372 -
download
0
Transcript of Linking PR to Sales (South Carolina Governor's Conference on Tourism & Travel)
Slide 1 -- February 21, 2011
South Carolina Governor’s Conference on Tourism &
Travel – February 21, 2011
Tim Marklein, Executive VP, Measurement & Strategy
Twitter: @tmarklein
Communications Measurement:
Linking PR to Sales
Planning Optimization ROI
The Long, Winding Road
Go to the wrong airport
Wait in line 45 minutes to rebook
“We can’t get you to Aspen today”
“The last bus leaves before 6:00”
Ignore signs: “Independence Pass CLOSED”
Backtrack 2.5 hours to Aspen
Slide 2 -- February 21, 2011

Don’t Let This Happen to You…
Slide 3 -- February 21, 2011
Linking PR to Sales Requires…
Determination
Persistence
Creativity
Strategy
Methodology
Slide 4 -- February 21, 2011
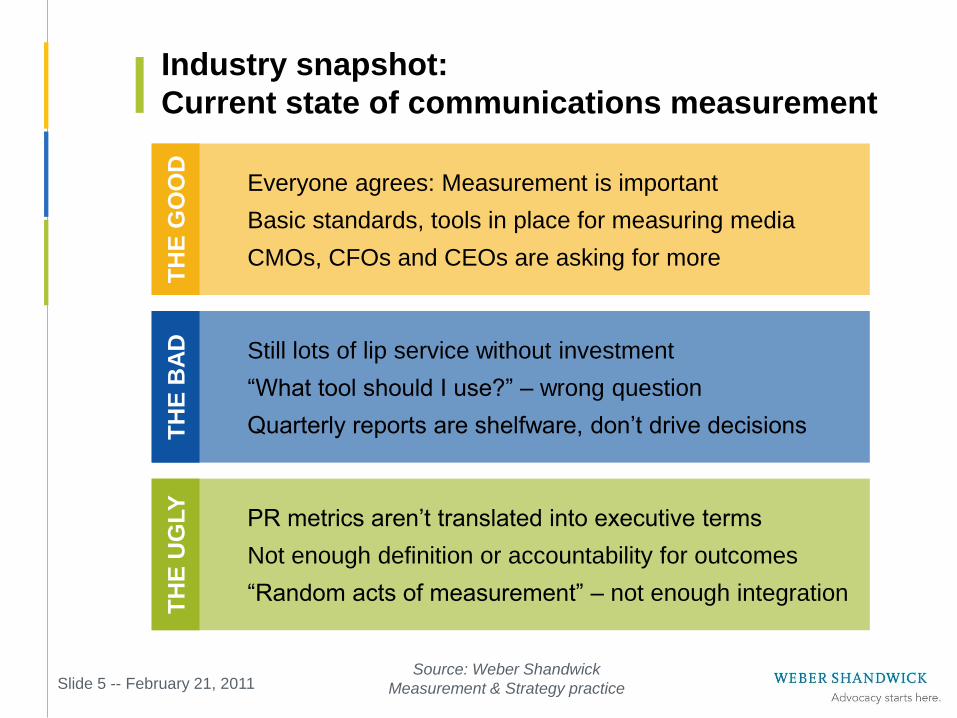
Industry snapshot:
Current state of communications measurement
Everyone agrees: Measurement is important
Basic standards, tools in place for measuring media
CMOs, CFOs and CEOs are asking for more
TH
E G
OO
D
Still lots of lip service without investment
“What tool should I use?” – wrong question
Quarterly reports are shelfware, don’t drive decisions TH
E B
AD
PR metrics aren’t translated into executive terms
Not enough definition or accountability for outcomes
“Random acts of measurement” – not enough integration
TH
E U
GLY
Source: Weber Shandwick
Measurement & Strategy practice Slide 5 -- February 21, 2011
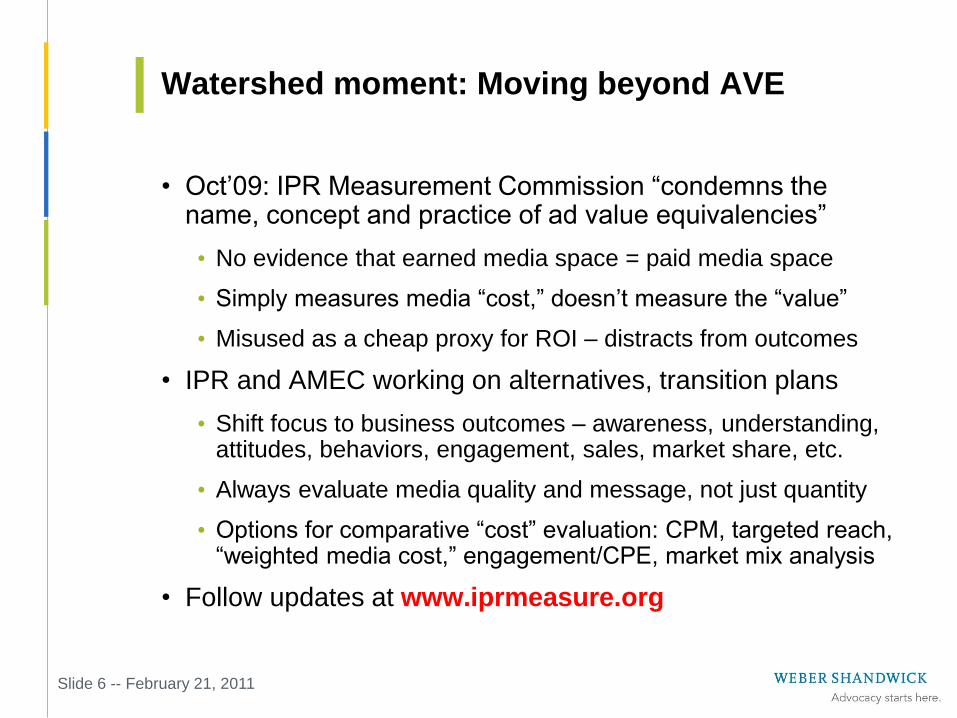
Watershed moment: Moving beyond AVE
• Oct’09: IPR Measurement Commission “condemns the name, concept and practice of ad value equivalencies”
• No evidence that earned media space = paid media space
• Simply measures media “cost,” doesn’t measure the “value”
• Misused as a cheap proxy for ROI – distracts from outcomes
• IPR and AMEC working on alternatives, transition plans
• Shift focus to business outcomes – awareness, understanding, attitudes, behaviors, engagement, sales, market share, etc.
• Always evaluate media quality and message, not just quantity
• Options for comparative “cost” evaluation: CPM, targeted reach, “weighted media cost,” engagement/CPE, market mix analysis
• Follow updates at www.iprmeasure.org
Slide 6 -- February 21, 2011
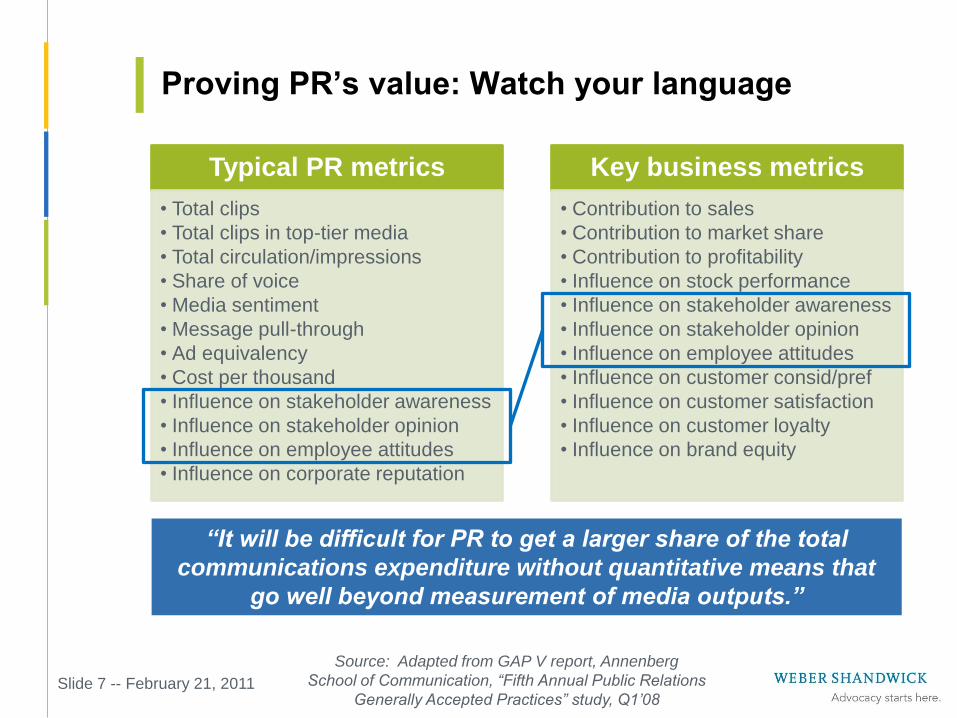
Proving PR’s value: Watch your language
Typical PR metrics
• Total clips
• Total clips in top-tier media
• Total circulation/impressions
• Share of voice
• Media sentiment
• Message pull-through
• Ad equivalency
• Cost per thousand
• Influence on stakeholder awareness
• Influence on stakeholder opinion
• Influence on employee attitudes
• Influence on corporate reputation
Key business metrics
• Contribution to sales
• Contribution to market share
• Contribution to profitability
• Influence on stock performance
• Influence on stakeholder awareness
• Influence on stakeholder opinion
• Influence on employee attitudes
• Influence on customer consid/pref
• Influence on customer satisfaction
• Influence on customer loyalty
• Influence on brand equity
Source: Adapted from GAP V report, Annenberg
School of Communication, “Fifth Annual Public Relations
Generally Accepted Practices” study, Q1’08
“It will be difficult for PR to get a larger share of the total
communications expenditure without quantitative means that
go well beyond measurement of media outputs.”
Slide 7 -- February 21, 2011

Or as Duane Parrish put it…
Heads in the beds
Feet in the fairways
People in the parks
Slide 8 -- February 21, 2011
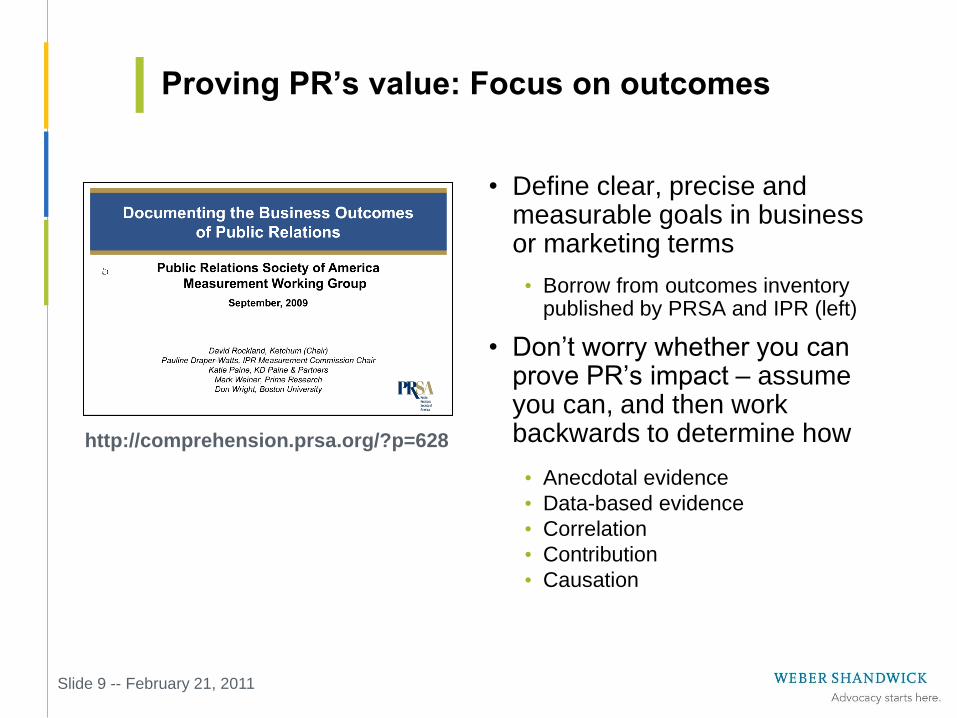
Proving PR’s value: Focus on outcomes
• Define clear, precise and measurable goals in business or marketing terms
• Borrow from outcomes inventory published by PRSA and IPR (left)
• Don’t worry whether you can prove PR’s impact – assume you can, and then work backwards to determine how
• Anecdotal evidence
• Data-based evidence
• Correlation
• Contribution
• Causation
Slide 9 -- February 21, 2011
http://comprehension.prsa.org/?p=628
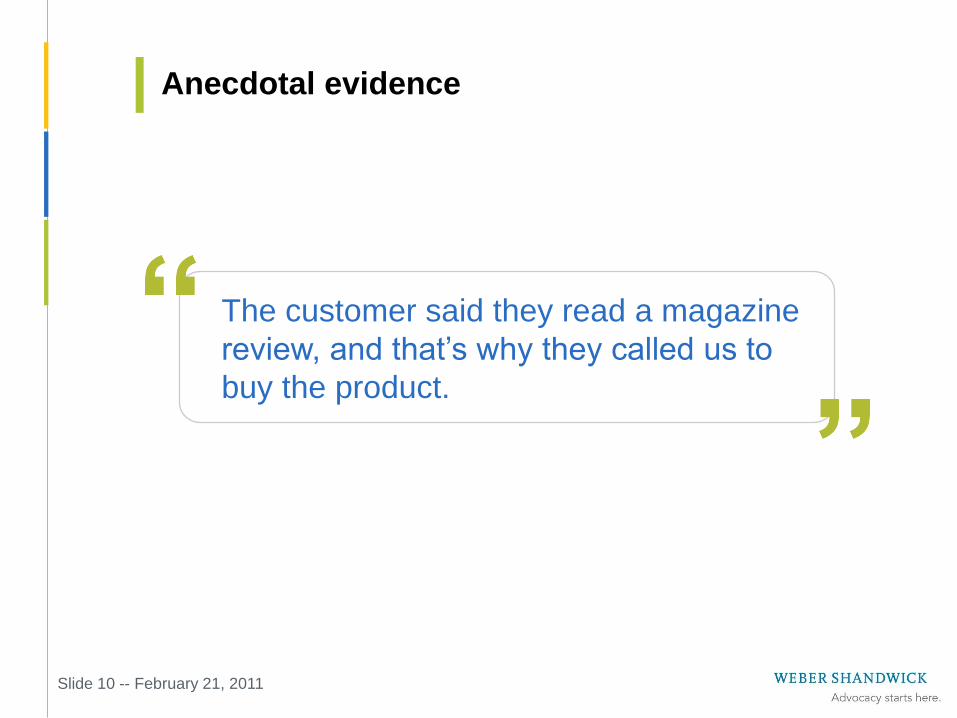
Anecdotal evidence
Slide 10 -- February 21, 2011
The customer said they read a magazine
review, and that’s why they called us to
buy the product.
Data-based evidence
Slide 11 -- February 21, 2011
9.7% of the customers we surveyed last
quarter said they called us because they
read a magazine review.
Correlation
Slide 12 -- February 21, 2011
Every time our competitive media share
goes up, our sales in that region go up for
the next two months.
Contribution
Slide 13 -- February 21, 2011
Based on our marketing mix model, we
determined that PR contributed 2.7% to
our sales goal last quarter.
Causation
Slide 14 -- February 21, 2011
720 customers that read about us online,
then went to our site, bought the product
at an average sales price of $675.
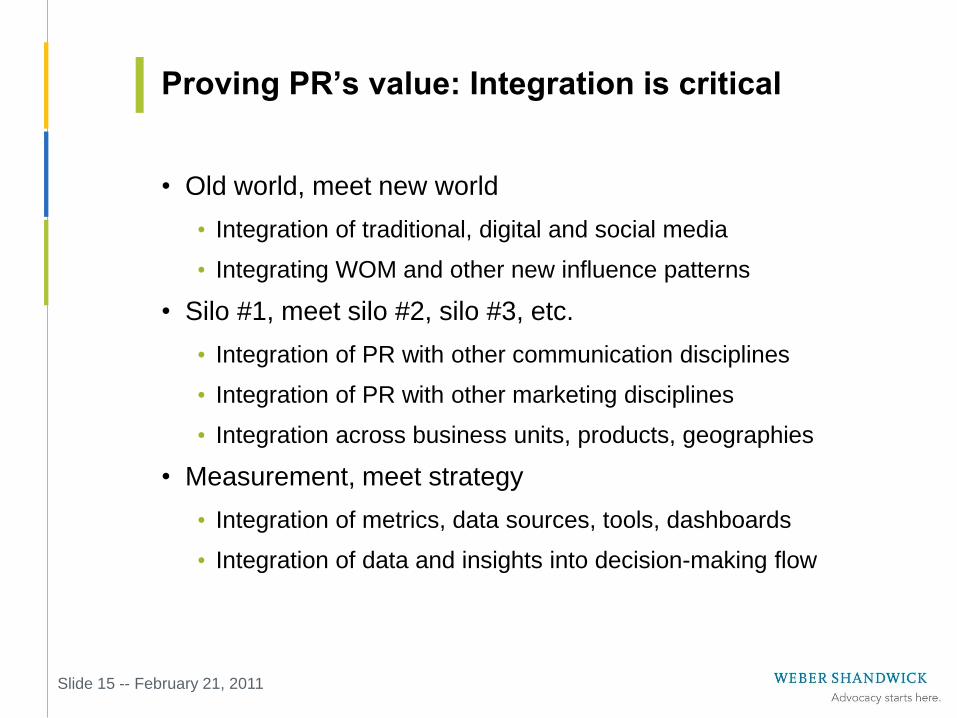
Proving PR’s value: Integration is critical
• Old world, meet new world
• Integration of traditional, digital and social media
• Integrating WOM and other new influence patterns
• Silo #1, meet silo #2, silo #3, etc.
• Integration of PR with other communication disciplines
• Integration of PR with other marketing disciplines
• Integration across business units, products, geographies
• Measurement, meet strategy
• Integration of metrics, data sources, tools, dashboards
• Integration of data and insights into decision-making flow
Slide 15 -- February 21, 2011
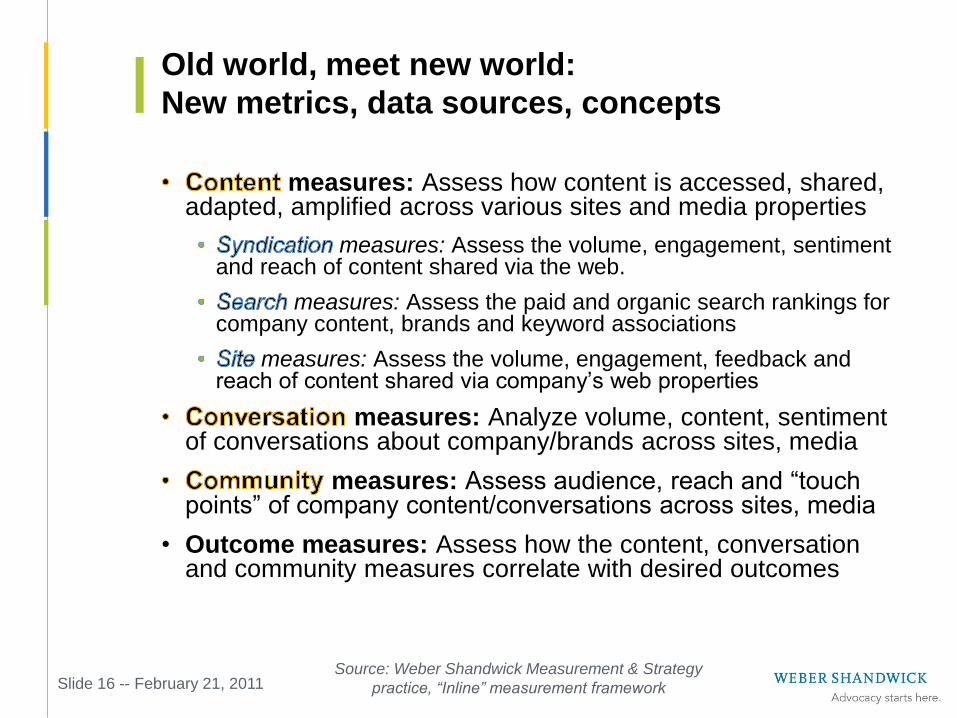
Old world, meet new world:
New metrics, data sources, concepts
measures: Assess how content is accessed, shared, adapted, amplified across various sites and media properties
measures: Assess the volume, engagement, sentiment and reach of content shared via the web.
measures: Assess the paid and organic search rankings for company content, brands and keyword associations
measures: Assess the volume, engagement, feedback and reach of content shared via company’s web properties
measures: Analyze volume, content, sentiment of conversations about company/brands across sites, media
measures: Assess audience, reach and “touch points” of company content/conversations across sites, media
• Outcome measures: Assess how the content, conversation and community measures correlate with desired outcomes
Source: Weber Shandwick Measurement & Strategy
practice, “Inline” measurement framework Slide 16 -- February 21, 2011
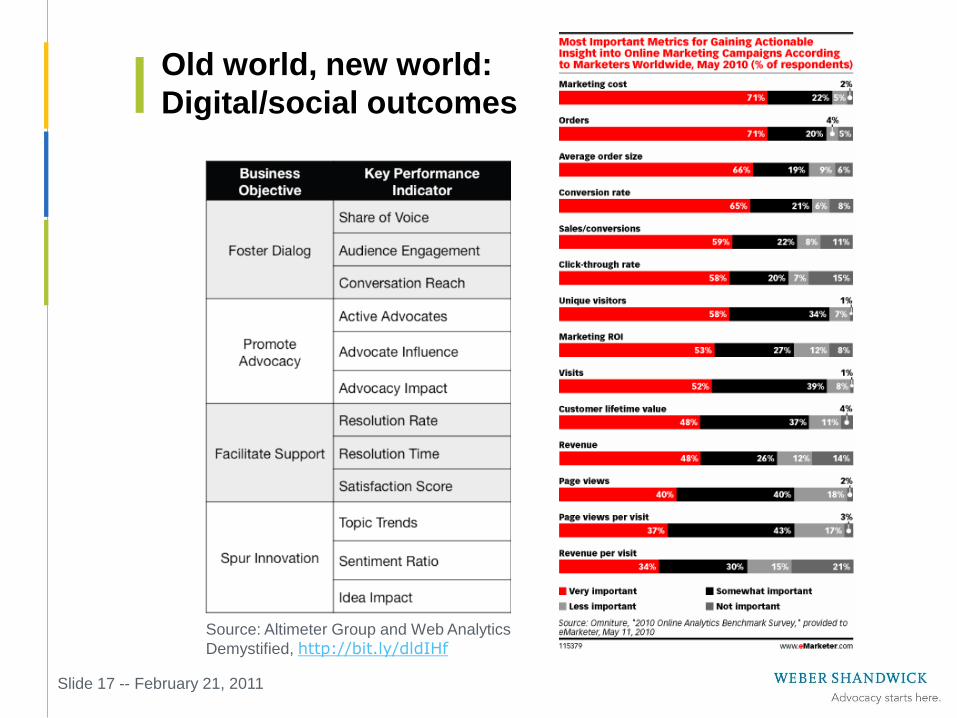
Old world, new world:
Digital/social outcomes
Slide 17 -- February 21, 2011
Source: Altimeter Group and Web Analytics
Demystified, http://bit.ly/dldIHf
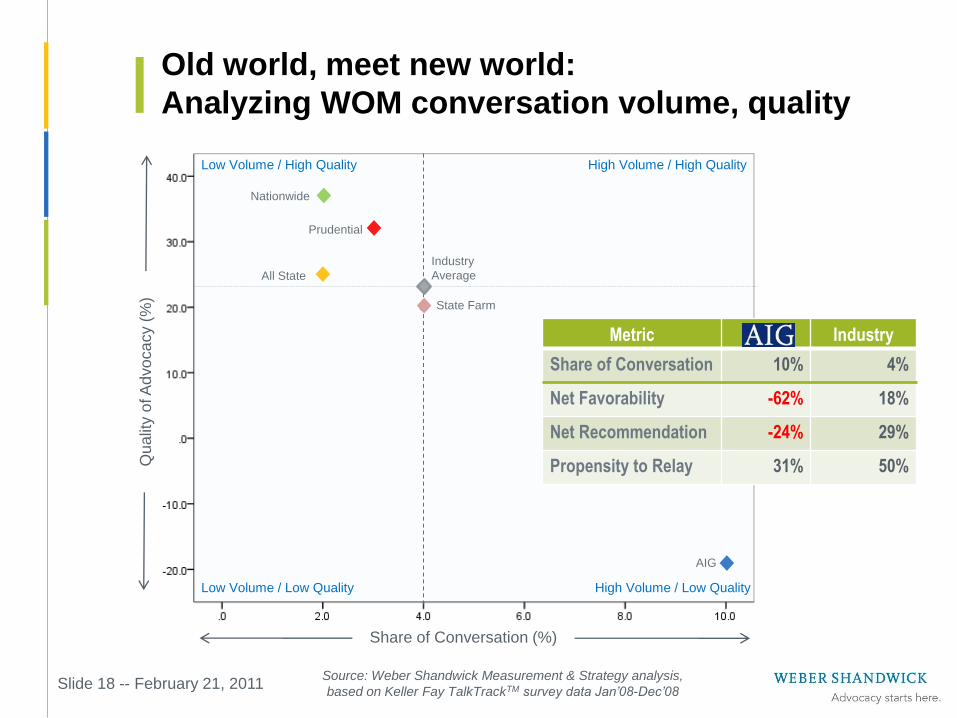
Old world, meet new world:
Analyzing WOM conversation volume, quality
Source: Weber Shandwick Measurement & Strategy analysis,
based on Keller Fay TalkTrackTM survey data Jan’08-Dec’08
AIG
Industry
Average
State Farm
All State
Prudential
Nationwide
High Volume / High Quality Low Volume / High Quality
High Volume / Low Quality Low Volume / Low Quality
Share of Conversation (%)
Qu
alit
y o
f A
dvo
ca
cy (
%)
Metric Score Industry
Share of Conversation 10% 4%
Net Favorability -62% 18%
Net Recommendation -24% 29%
Propensity to Relay 31% 50%
Slide 18 -- February 21, 2011
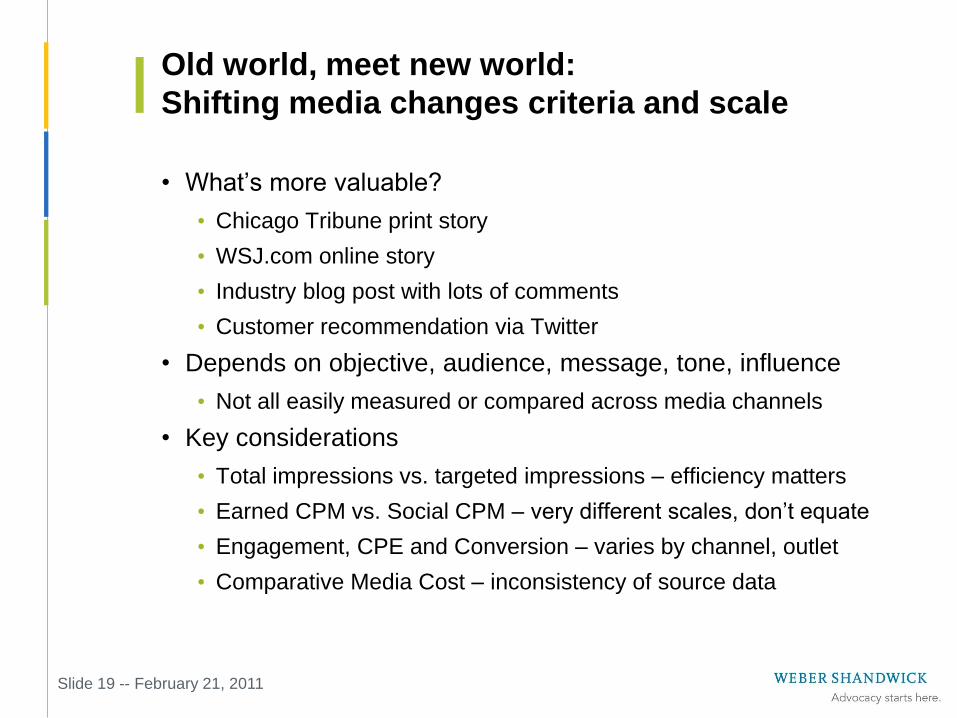
Old world, meet new world:
Shifting media changes criteria and scale
• What’s more valuable?
• Chicago Tribune print story
• WSJ.com online story
• Industry blog post with lots of comments
• Customer recommendation via Twitter
• Depends on objective, audience, message, tone, influence
• Not all easily measured or compared across media channels
• Key considerations
• Total impressions vs. targeted impressions – efficiency matters
• Earned CPM vs. Social CPM – very different scales, don’t equate
• Engagement, CPE and Conversion – varies by channel, outlet
• Comparative Media Cost – inconsistency of source data
Slide 19 -- February 21, 2011
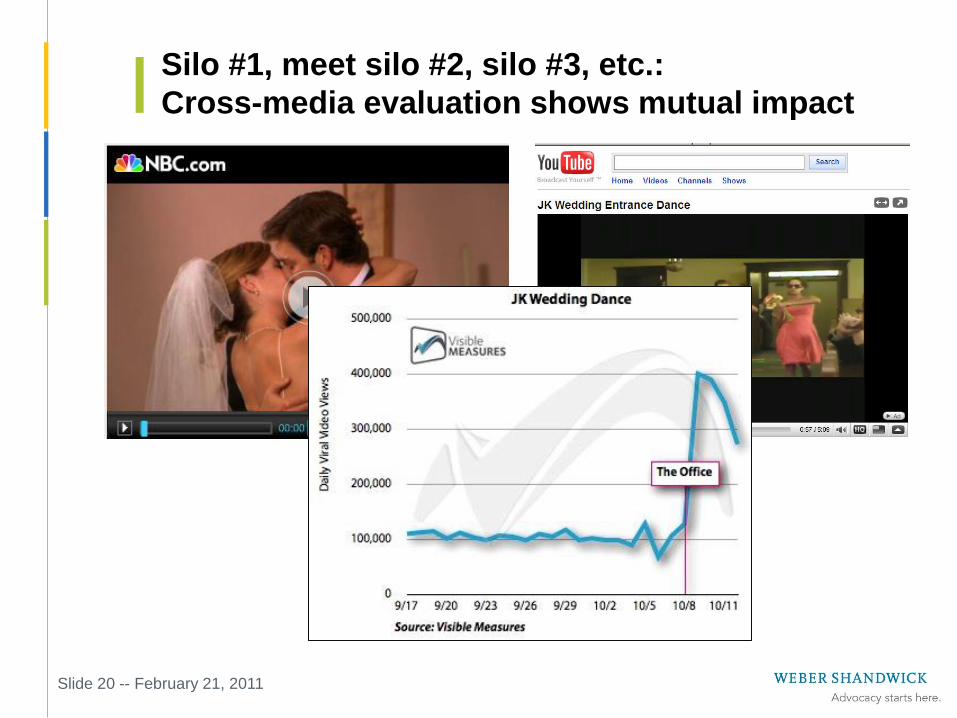
Silo #1, meet silo #2, silo #3, etc.:
Cross-media evaluation shows mutual impact
Slide 20 -- February 21, 2011
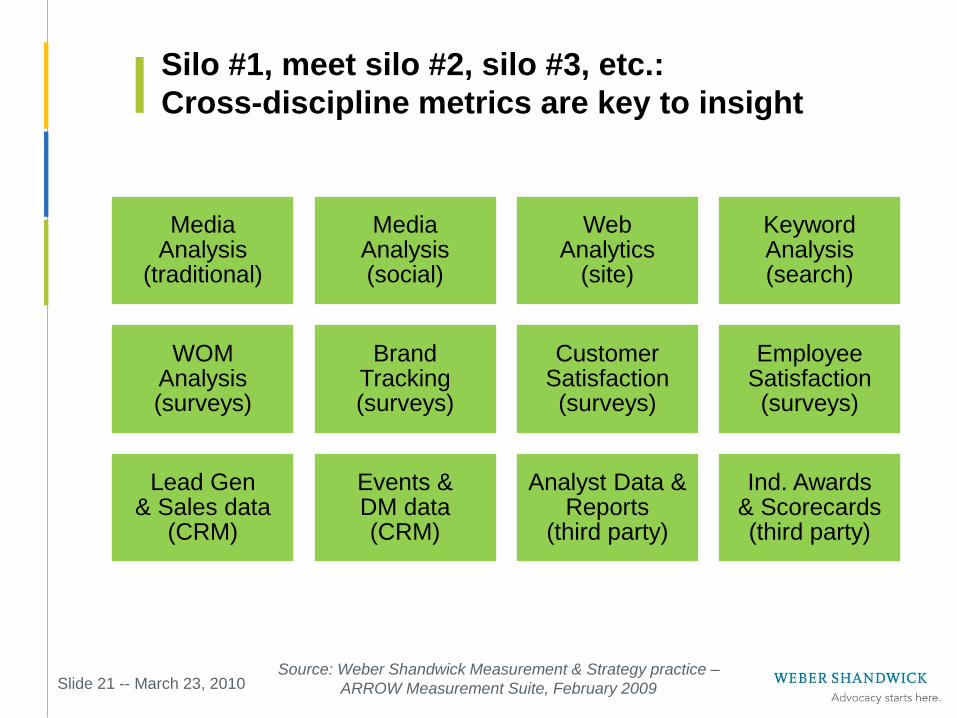
Media Analysis
(traditional)
Media Analysis (social)
Web Analytics
(site)
Keyword Analysis (search)
WOM Analysis (surveys)
Brand Tracking (surveys)
Customer Satisfaction (surveys)
Employee Satisfaction (surveys)
Lead Gen & Sales data
(CRM)
Events & DM data (CRM)
Analyst Data & Reports
(third party)
Ind. Awards & Scorecards (third party)
Source: Weber Shandwick Measurement & Strategy practice –
ARROW Measurement Suite, February 2009
Silo #1, meet silo #2, silo #3, etc.:
Cross-discipline metrics are key to insight
Slide 21 -- March 23, 2010
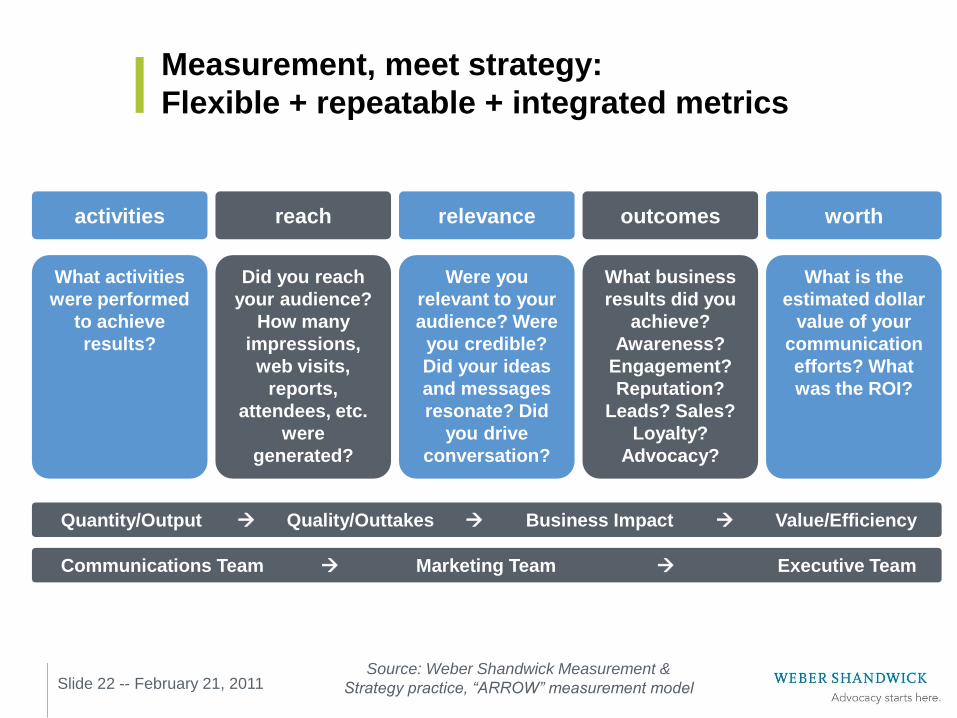
Measurement, meet strategy:
Flexible + repeatable + integrated metrics
Source: Weber Shandwick Measurement &
Strategy practice, “ARROW” measurement model
activities reach relevance outcomes worth
What activities
were performed
to achieve
results?
Did you reach
your audience?
How many
impressions,
web visits,
reports,
attendees, etc.
were
generated?
Were you
relevant to your
audience? Were
you credible?
Did your ideas
and messages
resonate? Did
you drive
conversation?
What business
results did you
achieve?
Awareness?
Engagement?
Reputation?
Leads? Sales?
Loyalty?
Advocacy?
What is the
estimated dollar
value of your
communication
efforts? What
was the ROI?
Communications Team Marketing Team Executive Team
Quantity/Output Quality/Outtakes Business Impact Value/Efficiency
Slide 22 -- February 21, 2011
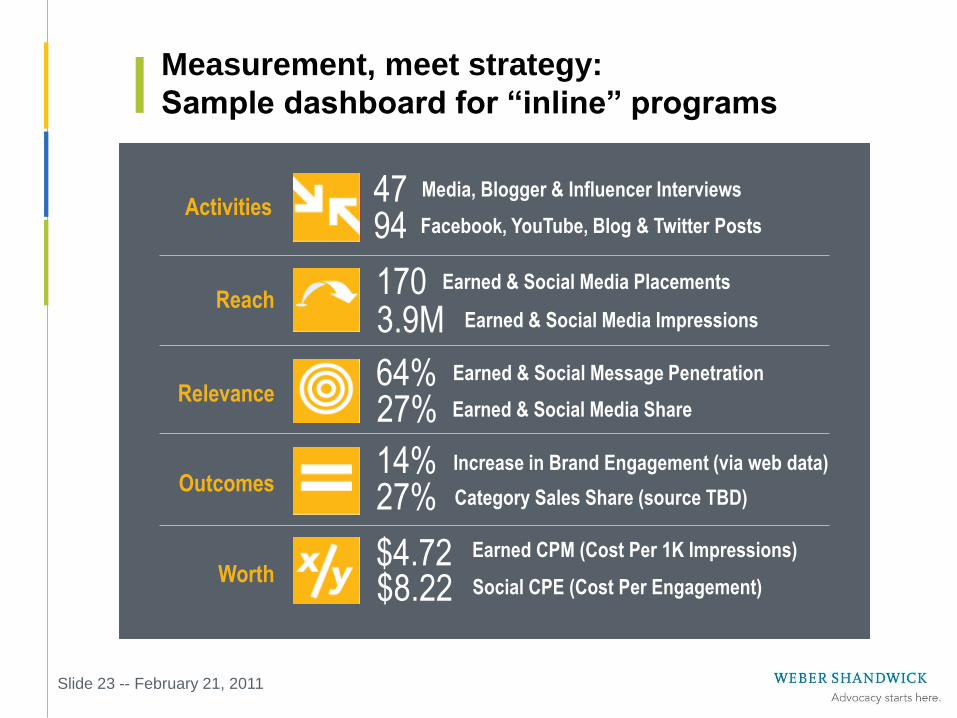
Measurement, meet strategy:
Sample dashboard for “inline” programs
Slide 23 -- February 21, 2011
Activities 47 Media, Blogger & Influencer Interviews
Reach 170 Earned & Social Media Placements
Relevance 64% Earned & Social Message Penetration
Outcomes 14% Increase in Brand Engagement (via web data)
Worth $4.72 Earned CPM (Cost Per 1K Impressions)
94 Facebook, YouTube, Blog & Twitter Posts
3.9M Earned & Social Media Impressions
27% Earned & Social Media Share
27% Category Sales Share (source TBD)
$8.22 Social CPE (Cost Per Engagement)
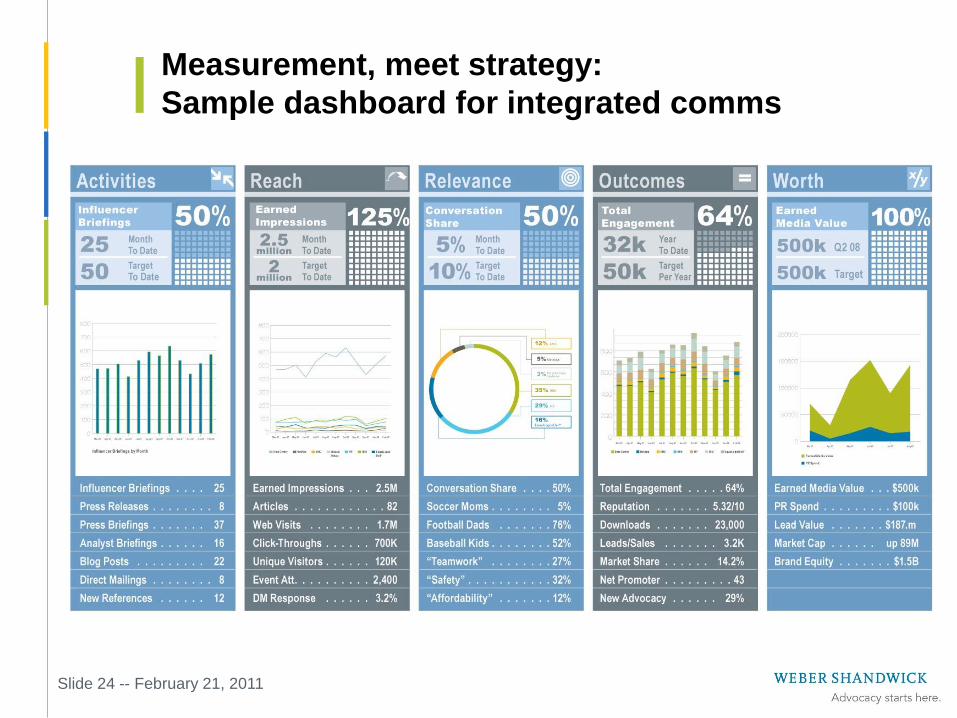
Measurement, meet strategy:
Sample dashboard for integrated comms
Slide 24 -- February 21, 2011
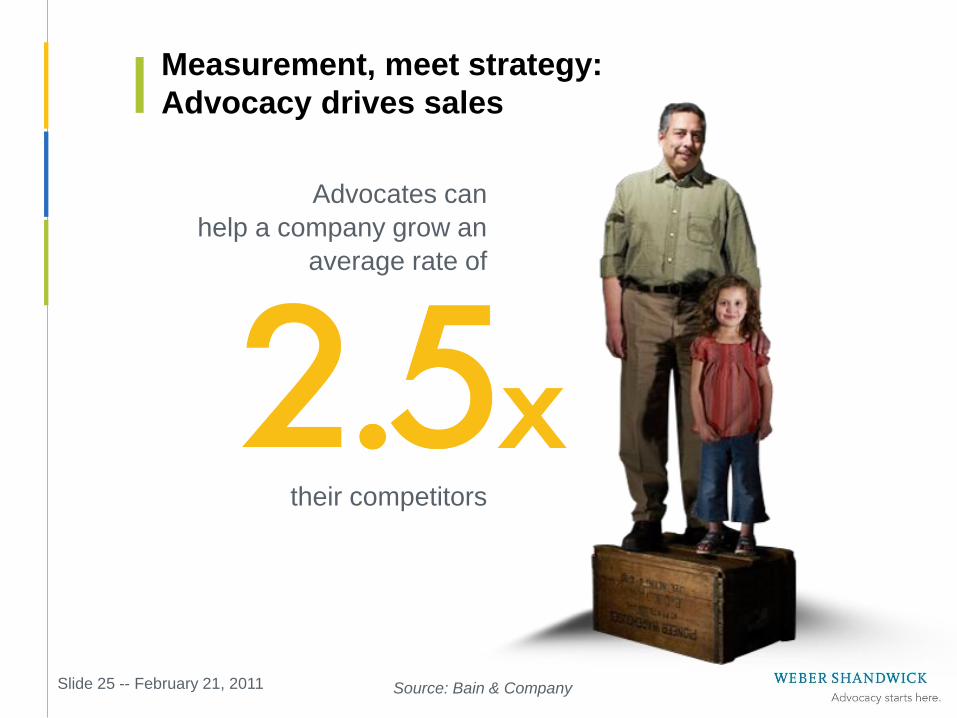
Measurement, meet strategy:
Advocacy drives sales
their competitors
Advocates can
help a company grow an
average rate of
Slide 25 -- February 21, 2011 Source: Bain & Company

- 26 -
Thank You!!!
Email:
Blog:
www.allaboutadvocacy.com
Twitter:
twitter.com/tmarklein