LIBRARY COPii( - Defense Technical Information Center · NACATN No. 1089 drop OenAp is a function...
57
‘b . . . P 1.6W4fJ NATIONAL ADVISOf& COMMITTEE FOR AERONAUTICS TECHNICAL NOTE No. 1089 s. — HIGH-ALTITUDE FLIGIITCOOLING INVESTIGATION OF A RADIAL AIRCOOUED ENGINE By Eugene J. Manganiello, Michael F. Valerino and E. Barton Bell Aircreft Engine Research Laboratory Cleveland, Ohio Washington August 1946 . LIBRARY COPii( 1---1 I *..:, 23 Iggj I
Transcript of LIBRARY COPii( - Defense Technical Information Center · NACATN No. 1089 drop OenAp is a function...

‘b
.
..
P 1.6W4fJNATIONAL ADVISOf& COMMITTEE
FOR AERONAUTICS
TECHNICAL NOTE
No. 1089
s.
—
HIGH-ALTITUDE FLIGIITCOOLING INVESTIGATION OF A
RADIAL AIRCOOUED ENGINE
By Eugene J. Manganiello, Michael F. Valerinoand E. Barton Bell
Aircreft Engine Research LaboratoryCleveland, Ohio
WashingtonAugust 1946
.
LIBRARY COPii(1---1I *..:, 23 Iggj
I

Ill[l[lllilllllllllll[lllll’ll!llll31i76014333166
Anradial,
.-NATIONAL ADVISORY COkKU?TEE FOR AERONAUTICS
TECHNICAL NOTE NO. 1089
EIGH-ALTITUD!?FLIG3T COOLING INVESTIGATION OF A
RADIAL AIR-COOLED ENGINE
By Eugene J. Manganiello, Michael F. Valerinoand E. Earton Bell
.
investigation of theair-cooled engine in
SUMMARY
cooling of an 18-cylinderytwin-row,a high-performance pursuit airplane -
has been conducted for variable engine and flight conditions at .
altitude8 rangi~ from 5000 to 35,000 feet in order to provide abasis for predicting high-altitude cooling performance from sea-level or low-altitude test results.
The engine cooli~ data obtained aro enalyzed by the usualNACA cooling-correlationmetlld wherein cylirder head and barreltemperatures are related to the pertinent engine and cooli~-air
.-
variables. A theoretical analysis is made of the effect on e~”InGcooling of the change of density of the cooling air acrosstheengine (Vlo comjjressibilityeffect), which becomes of increasingimportance as altitude is increased. Good agmoment was obtainedbetween the results of the theoretical analysis and the test data.It was found that the use of the cooling-air exit den~ity in theNACA cooling-correlationequation is a sufficientYJ accurate approx-imation of the compressibility effect to give satisfactory corre- ‘“lation of the cooling data over the altitude range tested. It wasalso found that a sea-level or low-altitude correlation based onentrance density gives fairly accurate cooling predictions up to aaltttude of 20,020 feet. ...._
tiODUWION
A methcd was developed by Pin:el (reference 1) for relating thecylinder-wall temperatures of an air-cooled engine with o~erating ‘conditions, cool--air temperature, and coaling-air weight flow.Because pressure drop is a more .easilymeasuzable q.uixntitythanweight flow end because the product of cooling-a<irentrance density(taken rel.ativeto standard ~ea-level air d~nsity) and pressure

NACATN No. 1089
drop OenAp is a function of tineweight flow, this prcd.uctwassubstituted for weight flow in the correlatbn method. This sub-stitution, which was made on the basis of incompressible-flow —
considerations, has proved satisfactory for tho correlation ofsea-level and low-al.titudocooling data, as is evident from theresults of nuluerousengine-cooling investigations (for example,reforcnces 2 and 3). For application to high-altitude flight,hwevcr, where the change of density of the cooli~-air across thetingin-e(compressibilityeffects) becomes significant, the weightflow and L7enAp are not uniquely related and consequently the sub-stitution is invalidated. Errors are therefore introduced in theprediction of high-altitude cooling fran sea-level or low-altitudotest results when tho substitution is made.
—.
-.
So!xetheoretical and e~ri~en’td investigations of the coolingproblems a% altitude have aheady been conducted. Reference 4 pre- “’--—””-sonts a theoretical study of the confpressibilityeffect in relationto aircraftheat-exch~~er operation and provides charts whereby,in a series of successive ap~i~oxi~ti~~, the compressible pressuredroy corresponding *O a given cooling-air weight flow, drag coef-ficient, ad de~~ity c;hazngecan be determined. A s~wkt stillartheoretical aaalysis of the compressibility effect in relation toengine cooling is glve~ in reference 5, which provides charts foraccurately determining compressible-flow cooling-air ~ressure drop.In addition, reference 5 indicates that the compressibility effectcan be accounted for, to a good degreo of accuracy, by the use afthe prcduct of pressure dzq and exit density. This correlationof cooling-air weight flow with pressure drop bn the basis of exit- ‘der=ity conditions was experimentally verified by Pratt & WhitneyAircraft (reference 6) in single-cylinder-enginetests over a range -.
of simulated altitudes from sea level to 45,000 feet. A SiRlibZ’single-cylimhr investi~tion (reference 7) conducted and reportedconcurrently with the subject tests furt.horverifies the use of
—.
exit density cxporimontally and theoretically.
In order to obtain infomaticn on the cooling characteristicsof air-cooled engines a% altitude conditions and, in particular, to “- “-”check present methods of etirapolating to high-altitude conditionsthe data obtained from sea-level c?rlow-altitude cooling tests~-afliglhtcooling investigationwas conducted.on an 18-cylinder, twin-row, radial, air-cooled er@ne installed in a hSgh-yerfcrmancepursuit air@ane. The investigation consisted of flights at vari-able engine and flight operat~ conditionsfrom 5000 to 35,000 feet. Ths cooling datab~ the NACA method developed in reference 1“furCOOling-air c~pressibility effects. A
at altitties ranging.=._
obtained”were“correlatedas mcdified to accounttheoretical -lysis was
.-

NACA TN 1?0. 1089
also made to check the validity of the use of caol~-air exitdensity in the correlation equation for approximating the compres-sib~lity effects.
.—
TEST INSTALLATION
Airplane and power plant. - The engine cooling tests were con-ducted in a puzsuit airplane on en 1~-cylfnder, twin-row, radial,
-—.—
air-cooled engine having a volumetric displacement of 2804 cubic-.-
inches. The compression ratio for the engine is 6.65, the sparksettirg 20° B.T.C., and the valve overlap 40°. Tineengine isequipped with a single-stage, single-speed blower, which has animpeller diameter of 11 inches and a gear ratio of 7.6:1. Aturbosupercharger consisting of a single-stage hnpulse turbinewheel with a 13.2-inch pitch-line di~eter shafted directly to a
..—
15-inch-diameter impeller provides the supercharging required forhigh-altitude operation. An in~ection-t~e carburetor meters thefuel to the engine at the inlet face of the engine-stage blower.The power plant is rated as follows:
Horse- En@ne Aititudepower speed (ft)
—.
(rPm)
Norma 1625 2550 29,000lhergency maximzm 2000 2700 27,000Take-off 2000 2700 ------
The engine power is delivered through a 2:1 reduction gear tc a%electrically cont~oliable four-bladed propeller having a diameterof 12 feet 2 inches. I%e propeller is fitted with shank cuffs andin not provided with a spinner hub.
..—.
A photograph of tileairplane used in the flight tests is pre-sented in figure 1. Figure 2 is a schematic diagram of the power-plant installation showing tilegeneral arrangement of the internalair-ducting system and the relative positions on the a~dplane ofthe engine, the cowling, the turbosupercharger, the intercooler,and the oil coolers. The engine cowling is of the NACA type Cfitted witiieight ad~ustable cowl flaps extending around the upperhalf of the cowling. A small fixed air gap between the enginecowling and the fuselage bcdy extends around the lower half of thecowling to the auxiliary air-su?ply scoop, The ope~ of theauxillary air-supply scoop, which supplies air to the carburetor,intercooler, oil coolers, and exhaust cooling shrouds, is locatedwithin the eng~ne cowling at the lottom of the engine. The inter-cooler is mounted at the rear of the airplane slightly forward of
3

NAC!ATN No. 1089w
thev air
turbosupercharger and fe provided with two separate cooling-Cutlets and flaps, one on each stileof the f’uselage. The oil
coolersare mounted-in series with respect to the oil–flow, one oneach corner of the fuselage at tt.erear of the engine. -.
En@ne cooling-aL- ~essure rneasnrements.- Although the testsincluded =extensive cooli-~-air pressure~=vey in which a largenumber of pressuzzetubes and lcmations were used, only those tubecombinations spocfi~iedly recent NACA procedures as giving the bestindication of the average cooli~-air pressures ahead of and behindthe engine are of present interest. The tubes used for the average ‘“ -pressure indications and their locations are shown in figure 3.
The total pressure of the cooling air was masured ahead ofVle engine with open-end tubes HZ, E2, H3, end E4 locate~ on eachfront-row cylinder at the positions indicated in figure 5. TheEetubes were insta?.lef!halfway hetween the fin tips and the cylinder
--
baffle.at a point about one-eighth inch behind the tangent petit oftinebaffle-entrance CW1. The coolhg-air static pressure behindthe engine was rieasLlredon each rear-rcw cylinder with open-end
d tube P3 installed in the stagu.,%ionreG’ionbehind the cylimder topbaffle and tubes F1 and P4 installed in the curl of the intake-side ‘-bafTle. Care was taken in the fitallation of these tubes to insurethat they received little if any velocity head.*
The pressure tubes were led to motor-driver.pressure-selectorvalves which, in turn,were cmnocted to NACA recording multiplemanometers. All pressuree could he recorded in 2 minutes.
Temperature meamrements. - Cylinder-wall temperatures weremeasured with iron-constantan thermocouples located on the headsand the barrels of each of the 18 engine cylinder=. The locationsand designations of these cylinder-wall thermocouples are indicated
.- —.
in figure 4 and are as follows:
(1) At the rear spark piug with standard gasket-type thermo-couple T12. (See fig. 5 for eketchof gasket details.) — —.—z
(2) In the rear spark-plug boss with thermocouple T35 embeddedto a depth of one-sixbeenth inch.installation.)
(3) In the rear middle of the# with thermocouple T19 ~eened about
cylinder-wall surface
●
(See fig. 5for tietailsof
head circumferential finningme-sixteenth inch into the

NACA TN No. 1089
(4) Int?2etYiermOCO~lp3.eT6barrel muff
(5) At theT14 8yot-welded
rear of the barrel two-thirds of the way up withyeened about one-sixteenth inch into the aluminum-
-
rear of the cylinder base flange with thermocoupleat the flange
Tho free-air temperature was obtained frcfmtidetemperaturereading of a resistance-bulb thermometer installed under and near
.-
the tip of the rig??twing. The correction for stagnation-heatingeffect was dete.wined in a se~~ate flight calibration for variousa~rspeds.
.
A survey of the temperatures in the cooling-air stremdirectly behti the engine was made duri~ most of the flight
-..
tests. Eighteen iz-on-cmstanten thermocouples were used in thismrrvey, two in front of each of the nine intake piyes at tho same
..._
radial distances as the middle of the engine heads and barrels.The intake pi~es provided paz-tialshielding of the thermocmples —
from the exhaust-collector ring. –-—-
The temperature of the char$e air was measured at the carburetortop deck with four parallel-connected fion-constadan tha.’’mocouples.
.
AU temperatures were recorded b~ high-speed data recordersconsist- of galvanometers, thermocouple selector switches, andfilm-drum recorders. It WaEIpossible to record 200 temperaturesdur4~ each run in about 3 minutes. A calibration point wasobtaimd for each galvanometersduring each test run by taki~~galmnometer readir@ of a known atatiard voltage; the offec% ofchanging galvenometer calibration was thus eliminated. A check on’the accuracy of the temperature records was also provided duringeach run by r~cordi~ on each galvanometersthe temperature of hotnercur~ contained within a thernms bottle. -. ..–-
Charge-air-weight-flewmeasurements. - The charge-air weightflow was measured during flight by venturi meters installed in thetwo parallel lines between tileintercooler and car?nmetor, as shownin fi~e 2, and calibrated within the charge-air ducting systemprior to the flight testd. In addition, checks were obtained fromthe carburetor compensated metering pressure as measured duringfli@t and its relation witincharge-air flow as established inextensive carburetor air-box tests for the test range of carburetorpressures and temperatures. The checks obtained were within =E5per-cent, the deviations being of a randm nature.
—

NACATN ~0* 1089 .-
8
~el-flow meaeurenents. - A flow-%ench calibration.of the car-buretor in which the fuel flow was related to the carburetor com-
--—
-—~ensated metering yressure furnished the West d+irectEWM3simplestnethod of measuring fuel flow in tho flight tests. This fuel-flowcalibration was later verified in the ati-box tests, which showedthe relaticn between compensated metering pressure and fuel flow ‘-to be independent of the pressure and tempe~ture conditions of thecharge air at the carburetor top deck and also of the fuel te@era-ture, within the range encountered. In addition, fuel-flaw checkswere obtained with both a vane-tyye and a rotameter-type fuel flow-
.-
meter in several syecial fligkts coveving the engine fuel-flowoperating Yemge. Except for a few widely erratic points, thechecks were within +3 percent.
--—— --
Other measmements. - Fke-stream impact pressure was measuredby a shrouded total-head tubo installed on a streamline loom onthe right wi~ tip. A swiveling static tube, which was calibratedin a special flight> was also carried by the boom about 1 chcmllength ahead of the leading edge of the wing. Continums recordsOF both the impact and static ylaessuroswere taken du.xxi~each runby NACA pressure recorders.
A torqueneter was incorporated for awasuringThe torquewas indicatd on a ~c.gein the cockpitthe pilot.
.-
engine torque.~ was read by -,
.— .— .—
~ng:ne~ t~~:ne sw~ds w- $~wr~teq r~c~rdod by r~vo~u-tion counters operatod in conjunction with a chiionometiicthner. .-.
The engine exhaust pressure was measured by means of staticwall taps located on both sides of the exhaust collector ring -—
upstreau of the waste gate.
Continuous records were taken onlTACA pressure and control-position recorders of manifold pressue ; charge-air preesure atthe turbosupercb.argeroutlet and at the carburetor top deck; throttlesetting; mi.xture-centralsetting; angle of attacks; and engine, oilcooler, and intercooler fkp openings.
TEST!FRCKEDURE
The flight tests were conciacted,for the mosttudes (based on pressure) of 5000, 25,000, 30,000,
part, at alti-and 35,000 feet;
a few flights were also made at intermediate altitudes. The threenain controllable variablea during each test run at a given altitudewere engine power,engine speed, and engine cooling-air pressure ._ –
6

NAOA TM NO. 1089r
drop; in general, during each constant-al,titudeflight one of theseb’ three varialles was independently varied while the other two-were
maintained constsnt.
The engine power was controlled with the carburetor throttleat con~t=it engine speed end, at the high altitudes, also with theexhatlstwaste gate through regulation of the turbosu~rchargerspeed. The mixbuzzecontrol was set in the automatic-rich positionand the fuel-air ratio was allowed to vary accordi~ to the carbu-retor characteristics. The e~~ino speed was controlled with the~~rope~er gove~or ~ the COOI~-~& pressure drop was controlledby means of the cwl-flap deflection and through chan$e in tineafi-
..—
plane drag chezacteristics (and thus the ‘airplaneveloc:ty ands,vailablorcm pressure) obtained by rais@ and lowering the landinggear.
-—
A s~ary ~f the fl~ht test conditions is presented In table I._.During each test runl in which the specified test conditions wereheld constant and the cylinder-wall temperatures had bean stab”il~zed~a i-ecordwas ohtaincd of tilecoaling-air pressures and temyoraturcsahead of and bohfnd the cr@ne, the cyli.ndcr-walltemporaturosj and*the airplane and engina opeuati~ conditions. .—
m REDUCTION OF COOLING DATA
Ccrrela.tionequations. - The basic equation developed in refer-ence 1 for correlating the wall temperatures of air-co~led ea.gineswith the engine operating conditions and the cooling-air temperatureand wei@t :lUU is
/
‘h-Ta ~n ‘1T% -% c ‘~
(1)
All symbols are defined in appendix A.
It has been the practice in low-altitude coding-correlationwork to assume that the weiGht flow of cooling air Wa is a fmc-tion of the more readily measued quantity OenAp and to make thissubstitution in equation (1). The assumption that Wa iE a ~“zqu6function of aen~p has, however, been shown by various theoretical
● analy~es (references 4, 5, and 7) and some test data (reference ~..
to be inaccurate for l.ar~ealtjtude changes. —
m It Is shown in appendix B, which presents a theoretical tr~at-ment of the relation between cooli~-air wei@t flow and.pressure
7

NY-CATN ND. 1089
drop, that Wa is,
tion to ScnAp. onticm (1) is written
m
mOi’ecorrectly, a function of Oex/3en
the basfs of the results of appendix B,
-.rhere J (“~x/~en) denotes a function of %&l”
in addi-
e~L= -
(2)
—- -—.— ..-
At low altitudes, the vcmiation of ‘ox/”en over the normal
engine operating range is sufficiently small that its function maybe considered as a constant, with ne~ligible sacrifice in accuracy..For substantially cor.ste.ntOeZ/oen ‘eqtiation(2) becomes the
-.—.__.-
familtar correlation equatic’n
Th - Ta J
/
ILj
TG-Q Wcn=I
(~enAp]m(Za)
—
When a largo altituh rango is considered, in which case lar3e
If it is.
..
eg.uation(2) re~lces to
ih~ constants n, n, b, and K Will be ovduatcddata.
(3)
frorothe test.-
In ordor far Gxit density (as suggested in rOferCnCOS 5 and 6,and as theoretically shcwn in referGncc 7) to be a satisfactory-”be.sisof correlation it is necessary that b = m in equation (3),in which case equation (3) reduces to
..
8 —.— -=

NACA TN No. 1089 -—--.—
(4)
The accuracy of the foregoi~ simplificationwill be empiricallychecked with the flight-test data. Equations similar to equa-tions (1) to (4) may also be written for the e~ine barrels.
.-
Some inVesti@toi*s (see, for example, rei’euence8) believethat, in order to obtain accuate correlation, the local cooliug- —.a~.rtem~erature In the vicinity of Vie spot on the cylinder wallUnder inVeStif@tiOn (at the location where Th is measuzl’ed.)Shcmld
.
be used instead of the entrance cooli~-air temperature. Ihap~ndix C it is shown that the cooli~~-correlation equation con-
--— ,
taini~~ Wile10cQ cool.tng-airtempe~ature can be trmsposea to the ‘“’equation containf.ngentrance cooling-air temperature; hence eithercan be used. Tho inlet cooling-air tem~ralnme was uses in thecorrelation presented in this repo~’tbecause the added complicationof determining tho local cooljng-stirtemperature did not apyoer”
—
warranted.●
.Mean effective ga~ tezuporature T . - The Beam
temperature Tg●
is, for a given en@ne, considere~fuel-alr zatio, ?nlet-nanifold temperature,exhausts~k timing.
effective gas
a-function ofTref3wre, and
--——
On the bmis of grevious cormlationwork, a Tg80 value of..
1150° F for the heads and 600° T for the barrels is chosen for thereference conditions of F/A = 0.08, Tm = 80° I?land pe = 30 inches
of nercury abeolute, awl for the normal s~ark setting.
.‘e ‘=iation ‘r ‘~eo with fuel-alr ratio for the sea-level
exhaust-pressure condition is taken as that determined in previous ..-
cooli~~ tests on an R-2800-21 single-cylinder engine (reference 9).
‘is ‘%~ variation, which was also found to check well with tine
results obtained on other types and mtiels of air-cooled enginef3,is plotted for the heads and barrels in figure 6. The variation of
‘g8 wtth exhaust pr~ssure for tbn range covered in the Qregenii
!tee s is included in figure 6 and represents the results of extensiveUxhaust-prcssuro tests conduoted at Cleveland on an R-2800-5 engine.Inasmuch as the o~ine normal s~k t-liningwas used throughout thetests, the effect of thisthe cooling test data.
variahlo is not required for analysis of.
.—
9 .

NACA TN No. 1089
The correction applied to T68~to obtain Tg for values cf
Tm other-than 80° F is given as ATg = 0.8 (Tm - 80) for engine
heads ad ATg = 0.5 (Tm - 80) fcr enginebarrels. The dry inl.et-
manifold temperature Tm 5.scalculated from the carburetor inlet-air temperature and the theoretical blower temperature rise,
,
assuming no fuel vaporizatim. This relation is given as
(5)
For the eIlgirLeused.in thereduces to
Tm
~resent investigation, equation (5)
N2= Tc + 22.1(1TzxE. (6)
\—- --/ ------- —
Cylinder temperatures. - The value of cylinder-head tempera-——.ture Tll uged.in the pri—- cczrelation is taken as the averagefor the 18 cylinder~ of the temperature indications Gf the thermo-couples peened into tiaerear middle of the heads ‘(T19in fig. 4);the barrel temperature ~ is taken as the average of the temper-ature indications of the thermocouples peoned ~nto the reaE of thebarrels (T6 in fig. 4), Final correlation curves ba~ed on the rear-
--—--—
spark-pl~-gasket and boss embddd.-thermocouple readi~s (T12 andT35 in fig. 4) axe also pre~ented to Termit cooling comparisons
—
with the results of other inve~tigationa. —
coolm-air temqeratvrea. - The entrance cooli~-air tem~era-ture Ta is taken as~t—gtion air temperature ahead of theengine as caicula.tedfrom the free-air temperature and the affrplanevelocity measurements.
The exit coclir~-air temperature, which is required for cal-culation of the exit d~nsity, was obtained for about 90 yercentof the tests from the a.verwe of’the temperature indications ofthe thorrnocdaplcslocated ,intho cooli~-afr stream behind theongino, the values for tho engine-head and engine-lmrrol coolingalr being ~eyarately averaged. These data were correlated by meansof a relation developed in appendix II,which results in a siz@ecurve involving the cooling-air pressure drop and the ratio 02 thetemperature rise of thf3”cool@ air AT to the tomp5falmro differ-onco botwoen tho cylinder head and the entrance cooling air ~ - Ta.In the correlation of the cooling-test data, the exit coclin~-drtemperatures for all th~ tests are calculated from this curve.
10

NACA TN ~0. 1089
Coolirig-airpressare droT and density. - The average cooling-air pressui-eMops across the engine heads and lxxrrelsare separatelydetermined as th; difference letween the average total pressure aheadof end the average static pressure behind the engine heads or b=-rels.
The average for the front-row cylinders of the readings of thetubes designated Hl, H2, end.H3 (f%. 3) is taken as the averagepressure in front of the engine heads; the average of the readingsof the tubes H4 is taken as the average pressure in front of thqengine lmrrele.
The average static pressure behind the engine heads is obtainedfrom the aver~e for tilerear-row cylinders of the read-s oftubes P1 and P2; tubes P4 are used for obtaining the average staticp~ess~e behind the engine barrels. -—
The entrsnce density of the cooling air is calculated from thesiaguation-air temperature u& the total-pressure values qhead.ofthe er@ne; conversion into entrance denstty ratio Uen is madesimply by dividing by the standm~ sea-level density value(0.0765 lb/cu f%). The exit demity of the ‘ccolingair is calcu-lated from the exit-aiz--temperatureand static-pressure valuesbehind the engine”and is converted Into exit density ratio Uexby dividhg by standard sea-l~vel density.
—
A,lthou@ tineexit denBity fs readily calculated,from themeasurements of temperatww and pressure made in the flight tests,its evaluation for use in predicting coolihg performance from anestablished correlation is not direct inasmuch as it involves a- .—. .
knowledge of the temperature rise and pressure drop of the cool~.-
air across the en&ine. A method of calculating the exit densityfor use in cooling predictions is given in appendix E. .—
Constants n, n, and K3. - The exponents ?n and ri of tSenAp
and Wc, respectively, and the constant K5 “ere determined fromthe cooling data obtained at a constmt ae~aen (tor al Practical __
gurpoees, at a constant altitude) by moans of the famili~ corre-lation ~rocedure mcp~-essedin equation (2a).
—
The function d (~ex/Gen). - In order to check the validity of——tkle theoretically derived equatio~ (3) h (4), the function
....—___ — .—
~ (~exl~en), which represents the effect of cooling-air com~ressi-bility in the generalized
experimentally determined
correlation equation (equation (2)), is ..
u
* NACA TN No. 1089 —.
CT~~O*nfrom the data obtained at the different altitudes. Inmorder to minimize the extraneous effects resulting from differencesin engine operating conditions that may not correlate accuratelyand may therefore mask the less sensitive effects of the cooling-air density change, data are selected.,in the construction d’ thisplot, for a narrow range of engine o~rating conditions (1200 and1500 bhp; engine speed, 2550 rpln;fuel-air ratio, 0,12). In addi-tion, in order to increase the over-all accuracy of’the plottedparameters through reduction of the random percentage errorsassociated with the tests, the values of the pammoters for the ‘“- ‘--”‘-individual rune of each variakle cooliw-air pressure flight (Jivo
—.
—
to six runs per flight) are averaged.to-give :ne plotted @int perflight.
-..
- The determination
shown in figure 7
FZi31LTSAND DISCUSSION
Determination of con3tants n, n, and K3.
of the exponent m cm ~*n4P (cqudion (2)) isTh - Ta Tb - Taw where plots of ~-m and ~C ~~imt OenAp exxemade from
the data obtained at an approximately conotant ~~Oen value of....—
. 0.83 (constant altitudo o.P500C ft) in flights that were each con-ducted at substantially conetm.i chnrge-afr weight flow, fuel-airratio, and m.gine speed with vertable cooling-air Tressure drop.Lines with the b~st-fi%ting constant s20po axe drawn thr~~l the ..ylotted values for each of the flights. Tke comnon slope, which isthe negative value of m in equation (2), iS -0.35 for the engineheads and -0.43 for the engine barrels. .. .—
A croes plot from figure 7 of the values ofTh-Tati
Tg-Th .-Tb - Ta
~ainst charge-air weight flow Wc for a constant OenAp‘g-~value of 12 inches of water for the heads and 9 inches of water forthe barrels is yresent~i in figure 8. Ihcluded in this figure arethe CCOli~ rscnd.tso’bbainedin a si~le fli@,t conduoted for vari- -able cherge-air weight 21OW at an approximately coastant aa/oen
value of 0.83 and aenAp valuBsof 12 and 9 inches of weter for the
heads and ba~rels, respectively. T“= plotted values for the vari-able char~e-air-flow fll~ht fall in with the ~oints tak.xmf>~~.cross plot of figure 7. TheGe points determine a slopo of 0~60 for “—- ....-
the heads and 0.43 for the barrels, which are the resp.act~vevaluesGt n (equation (2)) fcrthe [email protected] heads and barrels.
12

.
?
NACA TN NO, 1089
The values of/
Th - Ta ~0.60 ~d
T= -Th cClllatedfrom the data”obta~ned in all theoex/Oen of approximately 0.83 (altitude,
i’i~ure9 against the corresponding OenApthe pre~ioudy determined slope -m (-0.35
.—
/
Tb - Ta ~r0.43, a~ csJ.-
Tg-~ cflights cmds.cted at5000 ft), are plotted in -
vakes, A line Wit~l”
for the heads and -0.43for the barrels) is drawn to best represent the plotted values.
.
The correlation equation, which represents the correlation linedrawn in fi~-ue 9 for Uex/Gen of 0.83, is expressed as
...—
Th - Ta ~0.60 .
/
0.42Tg-~ c (OonAp)o035
For the’engine barrels
Tb-T /’a ~ 0.43 0.85
‘i3-Tb C =
(aenAp)O●43
(7)
(8)
.-—
It is noto& that the conetmt of 0.42 in equation (7) and 0.85in equation (8) are equal to K2 (aeX/oen) in the general corre-
lation expression (eqmtion (2)) and to K3 in equation (2a)..
Determination of function # (~ex/~en). - Ih accordance with.—T~~- Ta (GenAP)0”35
.—equation (2) the values of
Tg - ~ ~ 0.60averaged for each
flight at constant engine conditions bug vuiable cooling-airpressure drop are plotted in figure 10 against the correspondi~Qx/(7en values. The plotted points define a vti-~ationof increasing
$ (~ox/ffen)wtth decreas~ ~e~~on thus indicating the detri-mental effect of cooling-air compressibility on enghe cooling.~~liseffect is the ~e~ ~~ altitude effOct, which, for cons~t
I
Th-Ta ~nc is reflected as an imcrease OonAp rcquirermnt with
‘~-~incroasod altitude. Curves describing tho theoretical variationsof ~ (Oex/Oen) with ~ex/aen) ~S determined in appOIldiXB, are
included in figuro 10 for comparison. Agreement with the e~~i-montal results is indfcatod.
...
It is ovidont that tho cxponont b in Og.uation(3) is Oqualnwmmically to tho slope of a sti-sightlino through tho points infigure 10. A line having a S1OTO oi’-0.35 (the negativ~ value of
.—13

NACA TN No. 1089
the exponent m of OenAp in equation (7)) is drawn through the
point representing the data at an altitude of 5000 feet. Th3s linegives a good representation of the test data end also of the theo-retical curves and is arbitrarily chosen as it Fermits simplificationof equation (3) to equation (4).
The correlation equation for the cyl~er heads obtained fromfigure 10 is
It is noted.that the constant of 0.39 in equation (9) is tinetestvalue of K in equation (4). When ue~~en iS set equal to 0.83~(value for tests at an altitude of 5000 ft), equation (9) reducesto equation (7).
Attempts to determine the funotion $ (“ex/aen) for the cyl-.inder bex’relsby the foregoing method were unsuccessful because ofthe large scatter of data, whtch masked the effect of the function
, # (Oex/Oen) on the barrel coaling. In the correlation of the
barrel data presented in the subse uent secticm it will be assuned,however, that the function J$(~e %.1) for tinebarrels is similarto that for the heads and that the exponent b is equal to thovalue of m for the barrels (0.43).
Correlation of all data on basis of Ge#p. - me values of
Th - Ta
/ /
~0.60 ~ ‘b ‘Ta ~0.43-Th c ~
calculated from the data
‘f &
-Tb c
o tained in all the fli t tests cove~ing a range of d.tittiesfrom 5000 to 35,000 feet (equivalent to a range of Oex/~en frcm0.83 to 0.62) are plotta in fi~e 11 against the correspondingUe#p values. The correlation line given 3Y equation (9) for the
engine heads is indicated in figure U. It is readily evident thatthis single correlation line weU represents both the 1~-aJ-tit~e ~and the hi@-altitude cooling data. The best line with the previ-ously determined slope of -0.43 is drawn through the plotted valuesfor the barrel. It is evident that for the data on the Mrrel theagreornentbetween the plotted values an? the li~ is only fair atthe high-altitude conditions but that no definite conclusions can bedrawn because of the large data scatter. The equation that describesthis line is
--
.-
14

NACA TN NO. 1089
(lo)
Correlation of all data on basis of (JenAy.- The mriahle-
altit~de cooling Jata is plotted aflainst oenAp in figure 12wherein comparison is made with the correlation line given forOex/5en eqwl tO 0.83 (5000-ft altitude) by equations (7) ~d. (8)for the engine heads and barrels, respectively. 1% is seen thatbecause of the test variation of ~e~~en, which iS not accountedfor by the corrdation line, the test points obtained at the highcltitudes, although quite scattered, tend to fall slightly abovethe correlation line and show a definite trend of increasing devi-ation with increase in altitude. This general grouping of the hfgh-altitude data points above the 5000-foot correlation lins agatiIndicates a gree,ter OenAp requirement titthe higher altitudes.Even for ai h&#L an altitud~ as 35,000 feet, howover, the deviationsare only of the same order as the syread in the test points.
An examination of’the plotted points in figure 12 indicatesthat a single line with a slightly hi@er slow than tho correlationline for conf3tant Oe~-O~n caa be drawn to fit satisfactorily allthe data. This apyarent @ta correlation can be explained with “reference to figure 13, which presents, ~or the same data as infigure 12, a plot of GeWJaen against ~enAp on logarithmiccoordinate paper. It is noted that, although the relation between ‘--
oex/aen and CTenAp is actually difierent fbr the different altl-
tudes, the bulk of the data for the entire altitude test range canbe roughly represented by a stngle relation expressed as
‘er/aen=~ (~enAP)s. The use of a single relation is made possible.?-nthis case only because of the operational liraitaticmsof the ~engine-airplane combination that causes a shift b operati~ rangeof’ OenAp with altitude; for exanple, at an altitude of 5000 feet(aeX/a~n = approximately 0.83), a ra~e of ~enAp of approximately
4 to 20 inches of water was covered in the tests, whereaa at analtitude of 30,000 feet (“eX/a~n = approximately 0.75), th
OenAp range is approximately 1.5 to 5.5 inches of water. su-bsti-tution of ~ (OenAp)s for Oe~Uon and tho value of n for bin equation (3) reduces the right-hand term of this eqti%ion to
K6/(aenAP).m(l+s)
which @vos m(l+s) as the slope of the linebest correlating’the plotted points in figure 12, Inasmuch as the~stablishmont of this correlation is dependent on tho variationobtained in tho tests of CSex/Oon with OenAp, it is applicable, ‘-
.,
---
——
—
.-—._
--
..
—
15 —.—
1W13ATN No. 1089
f’or,usein predictions, only when the operatingtlie test relation between ~e~~en and OenAp.
is therefore of no reliable aid in altitude andextrapol.ations.
conditions satisfyThis correlation
.—
yressure-drop . .—
Correlation of average reazz-spark-pl~-boss@ Rasket temper-.—
‘- Inasmuch as the cooling of aircraft er@nes is=equentlyatures.evaluated on the basis of the rear-spark-plug-boss snd gasket tem-~eratures, the cmrelatton results based on these temperattmereadings (T3S and T12 in fig. 4) are presented in figures 14
T35 - Tand 15 as plots of
/
a ~ 0.60 T12 - Taand
/
~ 0.60
‘g- T35 c ‘8 - T12 c J
respectively, against ~e#P and UenAP. It is of interest to
know, as an indication of the accuracy of the general test results,that the correlation line for the reer-spsrk-plug-boss temperatech6cka within an average accuracy of iO” F with that obtained in anNACA test-stand investigation of a similar multicylinder engim. .
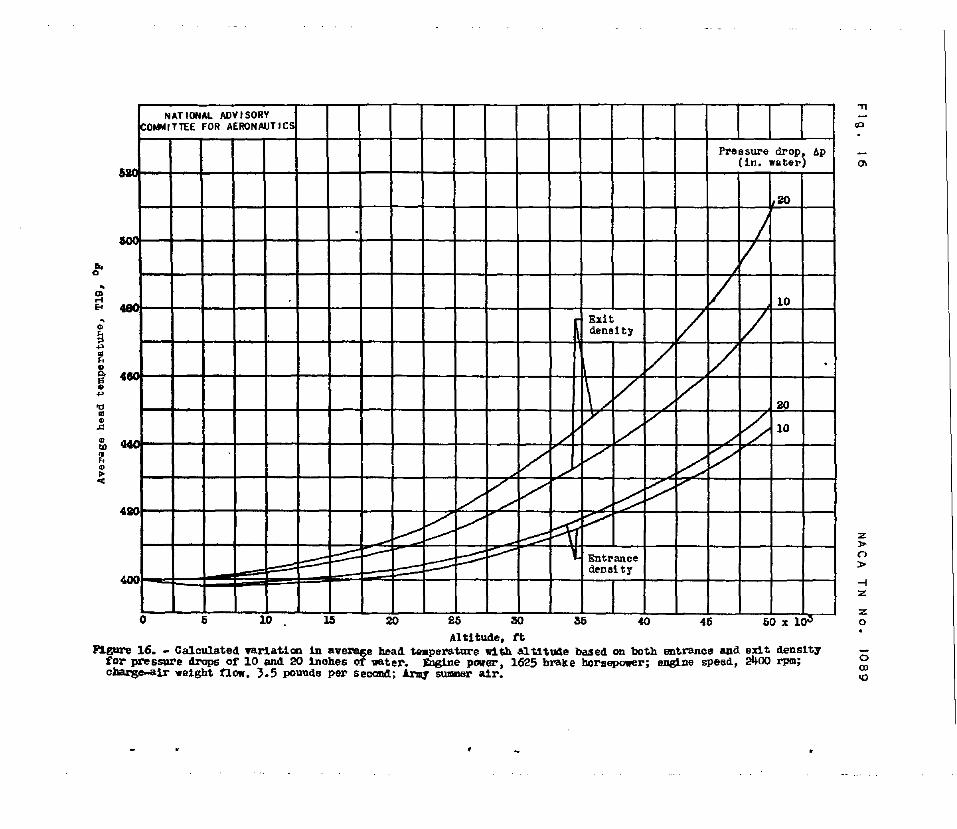
Altitude COO~~ predictions from sea-level correlation. - Acomparison of the coo- obtained at altitude, as predicted by thecooling-correlationline based on Oe@p (equatZon (9)) with thatindicated by the sea-level cooling-coruela.tion(actually 5000-ftaltitude) line based.on oenAp (equation (7)) is shown in figure 16as a plot of average head temperature T19 against altitude for con-stant engine conditions and two constant values of cooling-airpressure drop (10 and 20 in. of water). The difference between thecurve based on CexAp and that based on c3enAp amounts to 9° F at20,000 feet, 13° F at 30,000 feet, and 36° F s,t50,CMl feet, whenthe cooling-air pressure drop is 10 inches of water. For a cooling-air pessure drop of.20 inches of wate~, differences of 9°, 20°,and 60° F are obtained for 20,000, 30,900, and 50,00Q feet, respec-tivel~.
The ~gnitude of the errors introihzced,when predicting high-altitude Tressure-drop reql~irementsfrom the low-altitude correla-tion line based on OenAp ratlaerthan Ge@p is illustrated infigure 17, which presents, for a given set of constant engine
.—.—
operating conditions the cooling-air pressure-drop variation withaltitude as calculated by both corrections for maintaining anaver~e head temperature of 400° F. Errors in cooling-air pressuredrop of 1, 2, ti 14 inches of water are indicated for 20,000, 30,000,and 50,000 feet, respectively.
Figures 16 and 17 indicatesea-level correlation based on
.,
that altitude predictions from a~enAp are fairly accurate up to
16

NACA TN HO. 1089
20,000 feet but that the emor increases so rapidly with furtherincraase in altitude that the correlation based on gexAP shouldbe used at the hir>er altitudes.
CONCI.US1ONS
The results of engine-cooling flight tests conduc%d on anltl-cylin?.er,~,+in-r~, radtal, ai~s-cccoledengine in a yursuit air-plane for a r~ie of altitudes from 5090 to 35,!)00feet show that:
1. Tl?seffeck of cooling-air cx,preBsibility on tinecoolingcharacteristics of’air-coole5 eng~nes can be accounted for, to agood degree of accuracy, by the use in the NACA cooli~ correlation~e~hOfiof ~-e coo~.i~q-aQ*pres~~xa dro~ based on the exit ratherthan the ccrmnnly =ed entmnce demity. The cse of exit densitiyis fuuther rationalized theoretically.
2. A see.-lmel correlation on the basts of entrance densitygives fail-lyaccuzzaieresults up to an alt~tuileof 20,000 feet.For higher altitudes, huwemr, tileuse of exit density %-hereverpos-sible is reccmmenfiedinasmudh as tke ea’m resulttng from the useof errbrancede.nslkyi~ci-easesat a rapldiy increasing ~ate withaltitude.
--..-—
:1, p~r ~ ~1~-ustrat~~eSetjC& Constmtj e~tie Operating COlldi-tions, +ke ez’rorsimol~ed tn prtiictions made frcm the low-altitudecoi~e=tion based an entrance rather than exit density amount to:
(a) Average head tmuperatures of 9°, 13°, and 36° Ffor a con-stant cooling-air pressure drop of 10 inches of water at 20,000,30,CiO0,and50,900 fesk, respectively.
(b) C~olin.g-airpressure droys of 1, 2, and 14 inches of waterfor an average headtcxnperatuzzeo: 400° F at 20,000,30,00G,an350,000feet, respectively.
Aircraft lh@ne Researc3 Laboratory,lTatiO~l Adviscry Committee for Aei-o~utice,
Cleveland, Ohi~, My 9, 1946.
17

.
.
NAC!ATN No. 1089
JIPFENIXLXA
SYMBOLS
All symbols used in the teti and the appendixes are deffriedhere in alphabetical order for convenience of reference.
A
CP
f
F
F1
F/A
*g
h.’
J
N
P
Pe
AP
A~f
Apm
Ta ,
Tr
Tb
Tc
outside-wall =ea of cylinder head, sq in.
specific heat Of air, 0.24 Btu/(lb)(%)
cylinder free-flow area ratio
cylinder friction factor
cylhdor fricthn factor at GenAp = 1 in. of water
fuel-air ratio of engine charge
acceleration of gravitiy,32.2 f%/0ec2
heat-transfer coefficient from outside wall of cylinder headto cooling air, Btu/(sq tn.)(°F)(sec)
mechanical equivalent of heat, 778 ft-lb/Btu
.—
—
engfne speed, rpm
absolute pressure of cooling air, in. Hg
engine absolute exhaust pressure, in. Hg
coolfng-air pressure tiop across engine, in. water
cooling-air pressure drop due to skin friction within cyl-inder interfin passages, in. water
cooling-air ~ressure drop due to momentum change of coolingair acrc~sscylinder, in. water
cooling-air temperature ahead of engine, %
cooling-air temperate a-brear of engine, OF .—
cyltnder-barrel teraperature,%
carhretor inlet-air temperature, ‘F .-
18

NACA TNNo. 1039
‘GT..‘J80
%
Tm
AT
u
v
Wa
Wc
P
o
Dean effective
mear~effective
gm temperature, %
Eas temperature co~~ected.to a ?r~ inlet-manffold temp~ratuzze-of80° T
cylinder-head temperature, %
dry inleb-m.uifold tenpe.rature,‘~
cooli~-ati tenyerature rise across engine, ‘F
tip speed of engine-stage blcwer, ft/sec
cooli~-alr velmity IritlliIlinteriiinpass~ee~ ft/sec
cooli~-air weight flow across
en@ne chr~-air ccmsunption,
coolf~-air den6ity, lb/cu ft
enghe, lb/see
lb/see
density of cmling air relative to stendard air density OfC!.07C5lb/cu ft, p/O.0765
Sub~cripts:
en at cyllhdcrentmance
ex at cylinder exit
av average condition between entrence and exit
Correlation constants:
k) klj ~:2>k3> k~> k~~ K, Kl, ~, K3) % % %
Correlation exponont~:
n, m, r, r’, 3, s, x, y, Z
.—
--—--—
-.
.-
19

NACATN NO. 1089
APEEND121B
TKEORETIC!ALIERIWATION OF EFEECT OF COOLING-AIR-DENSITY
CHANGEON ENGINE COOLING
An expression will be derived for the cooling-correlationequa-tion in which account ie taken of the effect on the cooling-airpressure drop of the change in cooling-air density from the frontto the rear of the cylinder. IYcm this expression and the test dataat low altitude (5000 ft) an equation is obtained by means of whichthe cooling of the engine at any altitude may be predicted. —
In the derivation of the expression for the cooling-air pressuredrop, stiplifico-tionsare miie that have been found to Introduce asmall inaccuracy.
-—
Silified pressure-tiop eauation. - With reference to figure 18,the pressure losses across sn~~-linder cen%e divided andexpressed as follcws: Rnizcanoeloss (dation O to stition 1)
—
~ PenVen2APen = 5.2g 2.— (1 - fz) (11)
Skk-friction losses within the cylinder interfin passages, (sta-tion 1 to station 2)
~ Pavvavz@f=_—
5.2G 2
or, based.on the entrance conditions and exit-entrance density ratio(aav is taken as the arithmetic average of aen and Oex)
Momentumloss (station 1 to station 2)
(12)
‘envenAh = ~ (’e’ - “n) ——.
20

9
.
NACA TN No. 1089
or
Exii-~essure recovery (staticn 2 to station 3)
or
(13)
‘e=cvexf(NexAPex = _5.2g
- ~e~)
1 ‘enven2 i(fz -f~APex = ——5.2g 2
(– ~ex )
The total pressure loss across ansummtion of the compopent losses
(14)
.
engine cylinder is given by theas
.
-—
AI= s
~:k)~] ,@--
A p“”y2 (1-f2)[email protected]_+2 L-1 + 2(f2-2)5.2g
!l+—-
Compmrison between the values of Fressure drop comyuted.from equa-t.icn(15) and from the more rigorous methods of reference 5 ind.i.-cateda maximum diff~rence of 10 yercent for extreme conditionswith respect to present cylinder and operating conditions.
cool ing-corrob.t ion equation includi~ cc.nnpressibtlityeffect. -The fllmplifted pressure-drop equation when solved for Wa, whichis TMolortional to penVen, can be written as
Wa = (16)
SubBtitution in the %asic cooling-correlation equation (equa-tion (1)) results in
—

NACA TN No. 1089
;,; _Klfl-,’,+f~+~(-->+yen
(17)I?cn r2
k(oenAp)
Multiplying both sides of equation (17) by (OenAp)m gives
Th-Ta—.‘s- Th
,= (13)
The friction factor F is proportional to the 0.2 power of thecooling-air Reynolds.numbeu for turlw.Lentflow through the cylinderinterfin passages. Because ot t’hissmQl v=’iation of F withReynolds number, the following simplifications in the detezwinationof m expression for F are pe.wissitie:
(a) The vtscosity in the Re~ol.ds nunber parameter is assumedconstant.
(b) The mass flow int~2Reynolds number parameter is taken
as proportional to (oenAp) .
With theee simplifications F can le witten:
F=0.,1 “
Fl(~enAp) (19)
where F1 is the value of I’ at aenAp equal to 1 inch of watee.
Combination of equations (18) and (19) Gives
j ./Th-Ta.—
Y-T?
4/2
(20)

NACA TN ~tO.108S -.-— . .
The left-hand side of eq,uation(20) when equated to a constant isrecognized as the usual form of the NACA correlation relation(equation); the right-hand a3de intr~uce~ the effect ofcharge in Oexiben. The constants K1/k, Tl, f, m, and r in
equation (20) will be evaluated frcm the ?snownair-flow character-istics 01 the engine cyiinder and from the low-altitude test data(5000 ft) at which corditio~tke value of Uey~JOn WaS fOUIldtO he
effectively condmnt at 0.83 for a wide range of ogerating condi-tims. When the values of these constants are inserted in equa-tion (20)this e~uation may be used to predict the cooli~ at othervalues of aex~en ccrreqymding to any altitude and oFeration.
-.
Evaluation of constants of equat~on (20). -.—
(a) The friction factor F1 is determined as 0.9 from air-flow and pressure-loss data obtained at sea level in sitile-cylinde~teQts on an R-2800-21 engine.
(b) The value of f’ree-flowarea ratio f is takenas 0.1 as
. estjmated from measurements on an R-2SO0-21 engine. An accuratevalue cf f is not rcqulred aa the terms tivQlV@3 f me =11compzzed with the ether terms in the numerator of the right-hand
-.
side of equation (2G)..
(c) The values of K1/k and r are determined from thecooli~-test data obtained for ‘ex/Den equal to 0.83 (5000-ft -—
.
altitude tests) in the following manner:
For CSex/”en equal to G.83, equation
equation (7). Thus,
——
(20) must reduce to ..—
r2Fl(aenAP)0’3
~, (1-fz) *)
2(f2-f)+2(-L-I. i-
1 + 0.83 LO.83 0.83
k1 (5enAT)1 ‘~
r/2
= 0.42 (21)
Gn substitution of the numerical vabes of FI and f2 endreaz-rsmgement,
—equation (21) becomes
Z/r
J- 2m
1.124+ 0.984 (GenAP)O:l= b.42#\
(OenAp)l 7 (22)
When the left-hand side of equation (22) is plotted against cenAp.
on logarithmic coordinate paper, the sloye equals the exponent l—~ .
23
.
.
NACA TN No. 1089 --
aFigure 19 yresentsthis plot and indicates a value for 1 - ~ of
-0.04. The value of r, as calculated from this equality and theexperimental value of m (indicatedby equation (7) as equal to0.35), is foundto be 0.67. The ordinate in figure 19 at OenAP
e@al to 1 inch of water gives the value ofK1 t“” a“r as 2“2
from whichT is calculated to be 0.32. When the foregoing
values are substituted for the constsnts and exponents, equation (20)becomes
~o.3351- --I
Th-Ta (UenAp)0.35
=0.32Tg-rTh ~c0.60
The value of n = 0.60
altitude. The quantity
is obtained from the test data at 5000-foot
(23)
equation (23), which was establishedtifromthe theoretical analysisand the cooling test data at Oex/Gen equal to 0.83, and is plotted
as dashed lines in figure 10 against ~e~~en for t~o extremevalues of GenAp(0.5 and 20 in. of water). It is noted that UenAp
introduces negligible spread in the curves, which indicates thato nAP is of small significance in the right-hand side of equa-t%n (23) or its generalized form (equation (20)), and hence, thatequation (23) can be approximated by equation (2).
.—
—
--
24
. . ..

NACA ~ NO. 1089
APPENDIXc
JUSTIFICATIONFQR TJSEOF INIISTCOOL~TG-AIR
T3M13RATURE IN CCIKKELATIONEQHATIONS
The following derivation is presented to shuw tilevalidity ofthe use in the correlation equatfons (for e~ple, equat30n (l))of the inlet cooif~-air temperat~e instead of the local.cool2ng-air temperature in the vicinity of the location at which the cyl-inder temperature is measured.
If the cylinder temperature at tilerear of the head is @erinvestigation then, on the basis of local cooling-air temperature,the correlation eqiition (1) would be written
.
where the exponent
in equation (l)..
From equations
Whenthere
Th
/
- ‘r Wcn. _%iii~~
war
r’ differs numerically
(28) and
Tr-Ta= AT =
Tr iS eltiinat~d fromresults
Rearrangement
k2 A
(29) developed
(24)
from the exponent r
in appendix D
k2 A Wa (x-l) (~ - ~a)
CP(25)
equation(24) by means of equation (25),
~a(x-l) (~ - Ta)
cm K&r d=—
(Tg - Tn) Wcn war ‘
of terms g%~es
/
~- TalTn= %c
‘g-~
[
k2 A Wa(x-l)
war ‘ 1 -c1 1
25
“(26)
.—
(27) “-” “-”–

NACA TN No. 1089.
. It is noted that, for a given engine installation, the right-handside of equation (27) is a function only of Wa and can be approxi-mated within the limits of the variation of Wa of interest inengine oooling lJY K1/War. Equation (27) then becomes
Th - Ta
/
K1.— Wcn = —‘6-%
war (28)
which is the same as equation (1) and.s~milar in form to equa-tion (24). It is thus evident that use of the inlet cooling-airtemperature instead of the local cooling-air temperature merelyresults in a change of the constant and cooling-air exponent inthe correlation equation.
If the assumption is made that the temperature rise of thecooling air to any given location around the cylinder as a per-centage of the total temperature rice is constant for all oper-ating conditions, then the seinetransformation frcm local-airtemperature to inlet-air temperature as shown by equations (24) to(28) oanbenade foranylocal cylinder temperature.
. .
26

NACA TN NO. 1089
AFEEKOIX D
ENG~ cooL~G-~ ~-m-R= EQUATION
For convenience in cooling predictions, the engine cooling-airtem%rature rise is related to the other known cooling variables byequating the heat absorbed by the cooling air to the heat inane-feri-edfrom the cylinder walls to the cooling air. Thus,
Wa GP AT =hA(Th-Ta)
Because
h = ~ (Wa)x
.
solution for
.
Wa =
AT can beTh - Ta
-&J(U#??)y
made in terms of
(28)
(29)
(30)
~e~P>
(31)
The value of the exponent Y(x-1) is found frm the tist titsto be 0.16 for the c~l+inderheads and 0.095 for the barrels. Becauseof the low values of this exponent, satisfactory correlation of
ATT~q
tith aenAp should also be obtainable; the use of UenAP
rather than Oopp is preferred in the ——~ ~TTarelation because
the results can then, in some applications, be more dtiectly Used. . .witlnthe correlation equation at little sacrifice in accuracy. Thus,for all Zractical purposes
ATTh-Ta=
Plots of ‘TTh-~ * ~A~Ta
. cooling-test measurements are presented in figure 20 for the engineheads and barrels. The use of figure 20 for making altitude engine-coolin~ predictions is illustrated in append= E. .—
k5(~enAp)z (32)
against aenAp made from the
27

NACA TN No. 1089
HIGH-ALTITUIE ENGINE-COOLING PREDICTION
The use of ue~p in the cooling-correlationequation, asrequired for accurately Predicting cooling at altitude, introducesthe troublesome problero of evaluating Oex. This problem is com-
——
plicatetiby the fact that Uex” is not directly obtainable fromthe atmospheric pressure and temperature values (including thecorrections due to ram) as is the case with Oen but furtherinvolves the engine heat rejection and cooling-ati pressure drop.For this reason, simultaneous solution for Oen awl of the corre-la.tionequation is required; as direct solution is difficult,recourse is had to solution by the methodof successive approxi-mateions.
The correlation relations that must be established in the low-altitude or sea-level engine-cooling tests for subsequent use in
. the determination of the cooling obtained at the high altitudesare, for the purgose of review, tabulated as follows:
. 1. The correlation equatton (equation (4)) graphically repre-sented for the subject tests by the correlation line of figru’e11
2. The Tg80 relation described by tb curves of figure 6
3. The cooling-air tmperaturo-riso equation (equation (32))graphically represented in figure 20
‘mm qusntity c&/Gon is given by the general gas law
1-&
Ta + 460 PaeX/oen = ~Z X
enTr + 460 =
(33)en
l-ATTa + 460
The quantity aen is calculated from the entrance cooling-air
pressure and temperature. The q~tity UeX can be computed fromOen by means of equation (33).
For the purpose of illustrating the method of obtaining simulta-neous solution of the foregoing pertinent relations to determine thecoolinG obtained at altitude, two typical problems me herein assumedand solved in step-by-step fashion.
.
28

.
●
.
.
.
.*
NACA TN N~. 1089
Calcula.t~.onof cooli~-air pressure-drop requirementf3at alti-tude, case 1. -
1.2.3.4*5.
The following operating conditions exe assumed:
Engine c~ge-air consumption, lb/see . . . . . . . . . . . 3.5Fuel-air ratioofcharZe . . . . . . . . . . . . . ...0.100Dry inlet-manifold ternpmature, % . . . . . ● ● “ ● ● ● “ 25° _._.
—.
Engine exhaust pressure, in. Hg absolute . . . . . . . . s * wAltitude of operation, ft . . . . . s . . . ● ~ s * ● ● * 35J000
for whfch, including ram corrections,
Ta=60F
?3-en = 8.45 inches of mercury absolute
It is required to ffnd the cooling-air pre~s~e ~oP @ for flatis-.._ - ._fying the cooli~ requirement for an average rear-middle head tem-perature (T19 in fig. 4) of 400°
6. From figure 6 for Items 2 @
7. Correction of T$80
to250° F gives
‘G= 1000 +
8. Worn items 5 and 7 for
9. Frcm iteme 1 and 8
F.
4
1000° F
inlet-manifold temperature of
0.8 (250 - 80)
Tn = 400° I’
400 - 6‘1.136-400=
= 1136° F
0.535
Th-T I~ ~c0.60 0.535Tg-Th
= = 0.252s 500.60.
10. From item 9 and equation (9) (or fig. 11)
o ~xAP = 3.5 inches of water
.-
. .. —

. NACA TN No. 1089
Solution for Oex Is now required and involves the method of suc-.cessive approximation.
As the first approximation, assume
‘en = Oe~
11. Solution for Oen froLuitem 5 and the standard sea-level airconditions of a pressure of 29.92 inches of mercury absolute anda temperature of 519° R gives
0= 8.46 ~ 519 _ 0,315
en 29.92 466
12. Fron items 10 and 11, the i?irstapproximation value of Ap is .-
AP=~ = 11.1 inches of wateru.315
13. For OenAp = Ge@p = 3.5 inches of water (assumption in first.
approximation solution), figure 20 gives
AT, = 0.386— —~h
- I’a
14. Thus from item 5 (Ta = 6° I’) for
AT = 0.386 X 394 =
15. From equation (33) and items 5, 12,
Th = 400° F
152° F
and 14
11.1l-—~ex 13.6 x8.46 = 0.904 = 0.682—=Uen 1.326~+~
466
which is the second approximation value of Oex/Gen .
16. As the second
AP =.
17; From items D.
approximation for Ap, from items 10, 11, and 15
3.5 = 16.3 inches of titer0.315 X 0.682
and 16
. OenAp = 0.315 X 16.3 = scl~ inches of water
30

. NACA TN ‘~?O. 1089
18. Emu figuzze20 for item 17●
19. Thus from item 5 for
AT
AT—= 0.36Th - Ta
~= 400° F
= 0.36 X 394 = 142° i?
20. ltromequation (33) and items 5, 16, and 1S
1- 16.3
aex 13.6 X 8.46 0.858—= =—= 0.658Oea ~+142> 1 ● 305
466
which is the thtrd approximation value of oex/Jen-?
TCUS, as the third approximation for Ap.—
●
AP = 3.5 = 16.9 inches of water0.315 x 0.=
Recalculation for Oex/sell gives a valus of 0.654 as compared with
0.658 obtained in the third approximation. It is evfdent that thevalue of aex/aen converges very rapidly and that a third approxi-
mation for Oex/Oen) and thus for Ap, is sufficient. —
The pressure-drop value of 16.9 inches of water obtained in thefcrregoingcalculations co?npareswith 13.6 inches of water, whfchwould be given by the correlation based on OenAp (equation (7)).
Calculation of average head temperature obtained at altitude,ca~e 2. - It is assumed that, for the conditions given in items 1throu@ 5, a cooling-air pressure drop of 10 Inches.of water iSavai~ble-fortemperature.
21. from item.
which–it is-desired to ~alculate the resulting head
11 and for Ap = 10 inches of water
OenAp = 3.15 Inches of water
.—
31

●
●
NM2A TN No. 1089
22. FYom figure 20 and item 21
*=0”3g23. As a first approximation, assume ~
Then, from items 5 (Ta = 6° F) and 22
AT = 0.39 x 394 =
24. From items 5, 23, and equation (33)
l-. lo——
= 400° F
1.54°F
uex 13”.6x8.46 0.913—= —= 0.686‘en ~ + 154 = K33
=“--------
-.. . ..—
25. From items 11 and 24 an~ for Ap . 10 inches of’ water
oexAp = 0.315 x 0.686 x 10 = 2.16 Inches of water
26. From equation (9) (or fig. 11) and item 25.
27. Fram items 1, 5, 7, and 26
Th .
28. As the second approximation,
442° F
let ‘
Th = 442° F
Then from items 5 and 22
AT = 0.39 x436
29. l@om items 5 and 28 and equation
1- 10Ue~ 13.6 X 8.46—=oen 1+%
= 170° F
(33)
0.913= — = 0.6681.365
--—— .—
..- ,.
32

NACA TN
30. From items U and 29 and.for
‘e~p = 0.315 x 0.668 x
51. From equation
W. From items 1,
which checks very
NO, 1.089
AF = 10 inches of water
10 = 2.10 inches of water
(9) (or fig. 11) and item 30
!i?h-T
/
a ~ 0.60f-l‘g-% ‘
= 0.301
t .——_..
—.—
—
5, 7, and 31
Th = 446° F
closely witlnthe second approximation value andia therefore the required value.
The derived Th value of 446° F coqarea with 426° F, whtchwould he obtained from the correlation based on OenAp (equa-tion (7)).
.— - - .. ..
33

.
●
NACA ‘TN1?0 , 1089
KE%ERENCES
1. Pinkel, Eenjamin: 13eat-TransferProcesses in Air-Coolad EngineCylinders. ITACARep. I’Jo.612, 1938.
2. Pinkel, Benjamin, and Rubert, Kbunedy F.: Correlation of WrightAeronautical Corporation Cooling Data on the R-3350-14 Inter-mediate Engine and Comparison with Data from the Langley16-Foot Hjgh-Speed Tunnel. NACAACR No. E5A18, 1945. -.
3. Corson, Blake W., Jr.j and McTLellan,Charles H.-:,Cool= Char-acteristics ~f a Pratt & Whitney R-2800 Engine Installed ina NACA-Short-Nose Hi@-Inlet Velocfty Cowling. NACA ACRNo. L4FOG, 19440
4. Becker, JoluIV.j and &W.~S, DonaJ.dD.: The Aerodynamic EffectsGf I%e.tand C~~~re~slbilitY in t’hoInternal Flow Systems ofAircraTt. NACAAC!R, Se@. 1942.
5. W311iams, David T.: Ei@~-Altitude CGoling. 11 - Air-CooledEngines. NACA ~ ~iO.~~k, 1944.
6. Pindzula, Michael: Cylinder Baffle Yressure llrogm. FlowCharacteristics of an Air-Coobd Engine Cylinder at Various “’Altitudes. YWA-505, Pratt & Whitney Aircraft, June 23, 1944.
7. Neustetij Joseph, and Schafer, Louis J., Jr.: Comparison ofSeveral Methods of Predicting the Pressure Loss at Altitudeacross a Baffled Aircraft-ltngineCylinder. NACA ‘INNc. 1067,1946.
8. Richards, Wtiliam M. S., and Erdman, lRrmk H.: Predictim ofEngine Cooling Requirements. SAE Jour. (Tr_. ), VO1. 53jno. 7, July 1945, pp. 410-419.
9. Ellerbrocli,Hermes H., Jr., and Rol13.n,Vern G.: Correlation ofSin@e-Cylinder Cooling l%sts ot a Prntt & Whitney R-2800-21Engine Cylinder with Wjnd-Tunnel Tests of al?ratt &WhitneyR-2800-27 Engine. NACAA?3R ~0, 3L14, 1943.
. . ..-—
34

NACA TN No. 1089
TABLE I - SUMMARY OF FLIGHT TEST CONDITIONS
Altitude(ft)
5,0005,0005,CJC05,0005,000s,0005,0005,0CKI5,0005,000‘7,00’010,000IO,U.2C)15,00025>CX3025,00025>00025,00025>00025,00025,00025,00025,00030,00030,Cx3030,00030,00035,00035,000
Eng~ngpower(bhp)
800100013001500800
Variablellcil
Variable1000
Variable200015001000110010001100100015001800
Vsriable1000
Variable---do---13001500SLoo
Variabb12001200
Pressuredrop(h..
d
Variable---do------do------do---constant---do---VariableCorlstallt---do---Variable---do------aO------do------do------a.o------do------do--’---aO------ao---ConstentTarlable---do---ConstantVariable---do------aO---ConstantVeriable---do---
Engine
speed(rpm)
2550255025502550
Variable255025502550
Variable255027002550
Variable---do---25502550255025502700255025502550
Variable255025502550260025502550
National Advisory Committeefor Aeronautics
35

9- . , .
#
._, -
A ERL3460
., .. ,,
Figure I. - Airplane used in the engine-cooling flight investigation.
zo.
I●
$c)1.
•1z

q9-5d9 ‘
hntwi motorla-cylinder, twin-row, (Installed forradial, alr-Ccwled
Fmgjna
7 “fCarburetor
I
flight tests)
/ r Intercooler
NATIONAL ADVISORYC~lTISE fOS AEWTICS
Figure 2. - power-plant installation in the test airplane.
{
L .o>=:Eeh:. .Wtlet col Iactorrlno
n
b
I
I

/-n3
z
-1z
Figure 3. - Cyl
Intake-aide view of
rear-row cyl inder ~howlng
$tatlc-pre~ture tube
locations
Front VIEW of front-row
cylinder showing to al-
head tube Iocatlons I
(a.
w
NAT IC+4AL ADVISORY
CO!AMl TTEE FOR AERONAUTICS
rider total-head and static-pressure tube locations.I
., , O&+ 6+ .
z
o.
0mm
.
,

.
●
✎
NACA TN No. 1089 Fig. 4
T6
NACAc-1740
Figure 4. - Cylinder thermocouple locations.

#
NACA TN No. 1089 Fig. 5
mu.-m
w
.
i
rdron-constantan
thermocouple
embedded to
depth of ~ inch16
Touple embedded in tab
Standard sPark-p lug-
gasket tharmocoupla
.iron-conatanta n thermo-
J
Raar-spark-plug ●mbedded thermocouple
NATIONAL MV!SORV~lT=E FOR AERONAUTICS
Figure 5. - Detai Is of the rear-spark-plug-boss and gasket
thermocouples.

.
Fig. 6 NACA TN No. 1089 ““
NATIONAL ADVISORVCOMMITTEE FOR AERONAUTICS
\
Engine heads
\ 1
sob J
700
r 30/
20
Engine barrelsI 1
d 1 1I I
600 r
10s
500 , \
,
400
A.06 ,0’? .08 .09 .10 ,11 .12 .13
Fuel-air ratio
.
.
1
●
FLgwe 6.- Va~lation of meaneffeotlvegaa temperaturewith fuel-a;r ratio andexhauat preamwe.
r

NACA TN NO. 1089 Fig. 7
NAT 10NAL AOV I SORYCOMMITTEE FOR AERONAUTICS
.9 Engine power Average(bhp)
.8charge-air flow
(lb\sec)
.7
.6
.5
.4
.3
1.732.062.953.29Q Qo
* I t I\\ I I
.21 I I I I I I I I I2 3 4
R6 8 10 15 20 ~
Cooling_alr pressure drop, ~enAp, in. water
o
Slope, -0.43
.22 3 4 6 8 10 15 20 30
Cooling-air pressure drop, ~enAp, in. water
Figure 7. - Variation ofTh-Taq=q
and ~ -‘a with cooling-air- ‘b
pressure drop menAp for various const%t charge-air flows at
altitude of 5000 feet.

NACA TN No. 1089
.9 I I
.8 Engine power,,(bhp )
.7 ~ o, 800
.6 + 10001300
: 1500.5 A 1100
v Variable
.4 ~
.3 ‘/
p w Slope, 0.60
.2 i1 2 3 4 6 8 10
Charge-air weight flow, Wc, lb/see
NATIONAL ADVISORYCOMMITTEE FOR AERONAUTICS
.9“
.8
.7
●6v Slope, 0.43
.5 /●
/w’ ‘+”.4‘ /
.3
.21 2 3 4 6 a 10
Charge-air weight flow, w=, Ib/sec
Th - Ta Tb - TaFigure 8.- Variation of ~ and - Tb with charge-
gh ‘gair weight flow Wc at constant cooling-air pressure dropof 12 and 9 inches of water for heads and barrels, respec-tively, at altitude of 5000 feet.
w
●

NACA TN NO. 1089T
*
Fig. 9
1
.
NATIONAL ADVISORYCOMMITTEE FOR AERONAUT Ics
.4
.3\
Slope, -0.35m
.2 I
.11 I I I I I I 1 I 1 I I I I I I 1 I 11 2 3 456 8 10 20 30
CoOlh~8%r preEsure drop, 6&Ap, in. water
.9
.8
.’7
.6 \)
.6
Slope, -0.43
.3
.21’ 2 3 456 8 10 20 :
cooling-air pressure drop, &enAp. in. water
Figure 9. - Cooling-correlation ourves based on entrsnae density ~or engine headsand barrels at altitude of 6000 feet.

(● .
.:
.4
.:
Altitude Engine power
(ft) (bhp )
1200: 2;;%% 1200x 30,000 1200
35,000 1200
; 5,000 150025,000 1500
v 30,000 1500
\
Slope, (-b)=(-m)
.3 .
I INATIONAL ADVISORY
COWITTSE FOR AER@JAuT ICS
-––--Theoretical lines forconstant GenAp values of I0.5 and 20 Inches of water!
.5
Figure 10.- Test variation of the compressibility function
and comparison with theoretically determined variation.
.6 .7 .8 .9 1.0
-n
U2.
0
z
>0
P
-1
z
z
c1.
0
:
* < . ,

NACA TN No. 1089 Fig. 11
NATIONAL AOVISORYCOhWITTEE FOR AERONAUTICS
.
.
.
.
.
I I [ ~9) a: detez%ined for 1111111
-0:8 1 2 3 456 8- 10 20 30
@Olhei3ir preeeure drop, <xAp, In. waterFigure 11.- CoollWao~elation o~vee baeed on efit dene~ty for engine heade and
barrels for eltlttiee fr= 6000 to S5,000 feet.
,
.
.

F{g. 12 NACA TN No. 1089
NATIONAL AOVISORYCOMMITTEE FOR AERONAUTICS
Altitude(ft)
.5
.4
.35
.3
.25
.2
I I=-r.-
Oc1 ,
.1. .- - .,.
COdhg-dr pressure &op, ~enAp, in. water
1.
.
.
.
.
●
.
?
.
Cooling-air pressure drop, ~enAp, In. water
Figure 12.- Cooling-oorrelatlon ourves baaed on entrence density for engine headsand barrels for altitudes from S000 to 35,000 feet.
.
I
.-

Fig. 13
NATIONAL ADVISORYCOWITTEE FOR AEROf4AUll CS
NACA TN No. 1089,
1.0,.9
.6
.7
.6
.5
.4
.3
.2
I
Slope, s Altitude(ft)
: 2;:%A 30,000v 35,000 Engine heads
1 2 3 4 56 78.910 20 30
Coollng-a%r pressure drop, ~enAp, in. water
1.0
.9 — —
.8
.7
.6Slope, s!
.5
.4
.3Engine bsrre16
—Bulk of data–—— Indlv~dual altitudes
.21 2 3 .4 5 6 ‘7 8 910 20 30
Coollng-alr preaaure drop, cenAp, In. water
F%ur~ ~.- v=l~tlon of ~ex/~enwith oooling-alr pressure drop ~enAp at
altltu~es from 5000 to 35,000 feet for engine heads and barrels.
.

Fig. 14 NACA TN No. 1089 .
.5NATIONAL AOVISORY
COMMITTEE FOR AERONAUTICS
L I JAltitude
(ft)
5,000: 7.000
I 1 n I I 1A
1
I Hll1 x Au, Uw
a.Q 15,000
: 25.000
.16I w 1-
)2 3 45 6 ‘7 8 910 20 2
Cwling+h Preseure drop, rexb~e in. water
.5
.4
.9
.25
.2
● 16 I I I
.11 a 3 45 f37e 910 20 30
Cooling-ah pressure drop, CenAP* in. water
F@r4 14. - Coollng-aorrelatlon ourves based on rear-spark-plug-boss embedded theram-oouplea for extt and entranoe density for altituden from S000 to 3S,030 feet. (Ourresdrawn to beat Sit all data.)

NACA TN No. 1089 Fig. 15●
✎
.5>NAT 10NAL PDVISORY
COMMITTEE FOR AERONAUTICSAltitude
.4(ft)
o 5,000+ 7,000
8 .3o“ v •1 15,000
s$”
\
O 25,000
v 3s,000
L
Rm2 ●
A
Io
(ICQ Slope, -0.32
r.lue .1
.11 2 3 45 678910 20 30
cooling-air pressure drop, ~exhp, In. water
oco .3o“we
\
12
e~~ ,I Slope, -0.35m
I
l-lae .15 -’
.1-1 2 3 456 7891Q 20 30
cooling-air preesure drop, GenAP~ Ln. water
F%gure 15. - Coolln~correlatlon curves based on rear-spark-plug-gasket thermocouplesfor exit end entrance denalty for altitudes from 5000 tO 35DOC4J feet. (Curves drawnto best flt all data.) .
.
*
NATlfflAL AOVISORY
COIIMITTEE FOR AERONPJJTICS
590
Soo
.
m
[ ,
hit
dsna!tg
460 i.
Y
/ / .20
/
/ ‘ / /10
440 /
/-/
/ “ //
4m / ‘/
/
~/
denait~
o 5 10. ls m s so 56 40 46 50X1 (F
n
a
m
z
:>
-1
z
z0
. . .

NAT IONAL ADVISORY
~llTEE FOR AEROUAOTI C3 II I
, , , , , ,
Izo
I 1 I 1 1 I II I 1.I I 1 I 1- 1 u I I
26
W! i
rExit denolty
18 /
I /
14/
. /
/ ‘
~ - — - - Entrance— — — — density
10 - — — — ~ — — — — — — — —
o 5 10 15 20 26 30 as 40 45
Altitude, ft
T
m
mm= 17. - Oalmlated varlatiea of pressure drop with &tltuAe nmeseazy to maintain eonstaot W tewmtnre T19. “E@IW power, W5 brake Poreewer; qn~ meed, *O m: ~r WOi* mm, 3.5 pooods per seoaxl; fuel-air _mtio, O.10; Amy enmmer sir. -J

Fig. 18 NACA TN No. t089 .
.
—
Air flow
,NATIONAL ADVISORY
COMMITTEE FOR AERONAUTICS
Figure 18. - Diagram of cooling-air flow path across an
engine cylinder.
.

# .
IIATIONAL AOVISONYCC4MTTEE FOR PHWAUTIC9
. .
5“
4
3
2 -
Slope, -0.04
1-
1 2 3 4 56
● “
Ii
I
8 10 15 20 3
Cooling-air pressure drop, ~enAp, in. water
o
Figure 19.- plot for evaluation of parameters P and~ of equation (22).
n
In
.
to

Fig. 20 NACA TN No. /089#
.
.5
0 0 e *
o.3
L
*
s’!, Engine heads
.2
.11 2 3 46 676910 20 30 40 50
Ooollng-alr pressure drop, Cenbp, in. water
. NATIONAL ADVISORY
.5COWITTEE FOR AERONAUTICS
.4cio- 1 n J *
~ ~.qjlj
0 JQ.3
Engine barrels.2
1 2 3 45 6 7 e 910 eo
Oooltng-air pressure drop, ~enAp, In. water
Figure 20.- Varlation in ooollng-alr temperature rlae parameter with cooling-air pressuredrop CenAp for engine heade and barrels.

~ -t I ~ cd,
l8J TITLE: Hlgb-Altitude Flight Cooling Inve~tigation of a Radia~~COO~nglne ~iTO· 8539 IIIVISIOH (None)
AUTHOR(S,: Manganiello, Eugene 1.; V.lerino, Micbael 1'. -=- OIUG . .\GENCT NO. ORIGINATING' AGENCY: Aircraft Engine Researcb Laboratory, Cleveland, O. TN-1089 PUBLISHED BY: National Advisory Committee for Aeronautics, Wasbington, D. C. PWWSHlN01s':J'"
DAm ·IU~l=.1 - I .......... I 'AGEl I WUS1U.no;ra Aug' 46 U.S. Eng. 55 pbotos tables grapbs drwgs I ABSTRACT:
~t"'rl';r/"~' ~:-le ~ f~(/17 I
Investigation was conducted for v !able engine an fltght conditions at various altitudes in order to provide basis for predicting high-altitude cooling performance from sea-level or low-altitude test results. Theoretical analysis Is made of eUect on engine cooling of cbange of density of cooling air across engine. Tbeoretlcal analysis and test data results agreed. ,Use of cooling-air exit density in NACA cooling-correlation equation Is a sufficiently accurate approximation of compressi-bility effect to give satisfactory correlation of cooling data,over altitude range tested. -
DISTRIBUTION: Request copies of this report only from Publtshing.Agency ~lf.t) ~66 DIVISION: Power Plants, Reciprocating (6} I SUBJECT HEADINGS: Engines - Cooling tests (32862); SECTION: Cooling 51) Engines - High altitude cooling (32866.5)
All SHEET NO.:- 8-8-1-33 ~[Q) ~ ~@~ ~ i® A1,"""''''''::===Dopa.... = 0 0 , ..... - -- ---_._ .. --- --I