Lessons learned from Q and from tunnel and cavern design ... 8H lecture.pdf · Q-system development...
107
Lessons learned from Q and from tunnel and cavern design and performance ATHENIAN LECTURE 2014 Nick Barton, Oslo, Norway 1
Transcript of Lessons learned from Q and from tunnel and cavern design ... 8H lecture.pdf · Q-system development...
Lessons learned from Q and from tunnel and cavern design and
performance
ATHENIAN LECTURE 2014
Nick Barton, Oslo, Norway
1

Content of Lecture
1. A VARIED CAREER IN TUNNELLING, LAUNCHED BY Q-SYSTEM
2. INTRODUCTION TO FUNCTION OF SOME Q-PARAMETERS
3. SINGLE-SHELL NMT USING Q, or DOUBLE-SHELL NATM ?
4. INTEGRATION OF Q (or Qc) WITH PARAMETERS: Vp, Em, Δ, L
5. NUMERICAL MODELLING DISCUSSION, c and φ from Qc ?
6. CASE RECORD OF HIGH STRESS – NEGATIVE EFFECTS
7. CASE RECORD OF THE BENEFITS OF (REASONABLY) HIGH STRESS
8. CONCLUSIONS
• E
• F
2 2

An early question which accidentally launched the tunneling career of the lecturer 40 years ago:
Why Norwegian powerhouses, mostly with spans of 18 to 24m, showed significant variation in deformations?
3

Q-system development – powerhouse deformation question answered after ½ yr
Different rock qualities, different depths and stress levels, and different support methods each played a role in these deformations.
Six months of hard work with case record analysis and re-analysis resulted in the ‘accidental’ development of the Q-system.
It is now used more widely around the world than anyone would have guessed. Some do not like this!
4

SO WHAT IS THE ‘Q-system’ ?
Hellenic Society Soil Mech./Geotech.
engineers may not be familiar with ‘ Q’
As a briefest introduction:
Q means rock mass quality.
Q consists of ratings for six parameters.
= (Block size) x (friction) x (‘active stress’)
5
SRF
J
J
J
J
RQDQ w
a
r
n
Q used here!

SUGAR LOAF MOUNTAIN, RIO DE JANEIRO
TOP END OF ROCK MASS QUALITY SCALE.
Q ≈ 100/0.5 x 4/0.75 x 1/1
i.e. >1000
BRAZILIAN HYDROPOWER PROJECT COLLAPSE IN FAULT
LOWEST END OF THE ROCK MASS QUALITY SCALE.
Q ≈ 10/20 x 1/8 x 0.5/20
i.e. < 0.001 6

7
Strength contrast, modulus contrast, constructability contrast (15 years/1 year)
0.001→1000, or 5→95, or F7→F1 ???

8
THE FIRST TWO PAIRS OF PARAMETERS HAVE DIRECT PHYSICAL MEANING:
RQD / Jn = relative block size
Jr / Ja = frictional strength (≈ μ)
Jw / SRF = effects of water, faulting, strength/stress ratio, squeezing or swelling (an ‘active stress’ term)
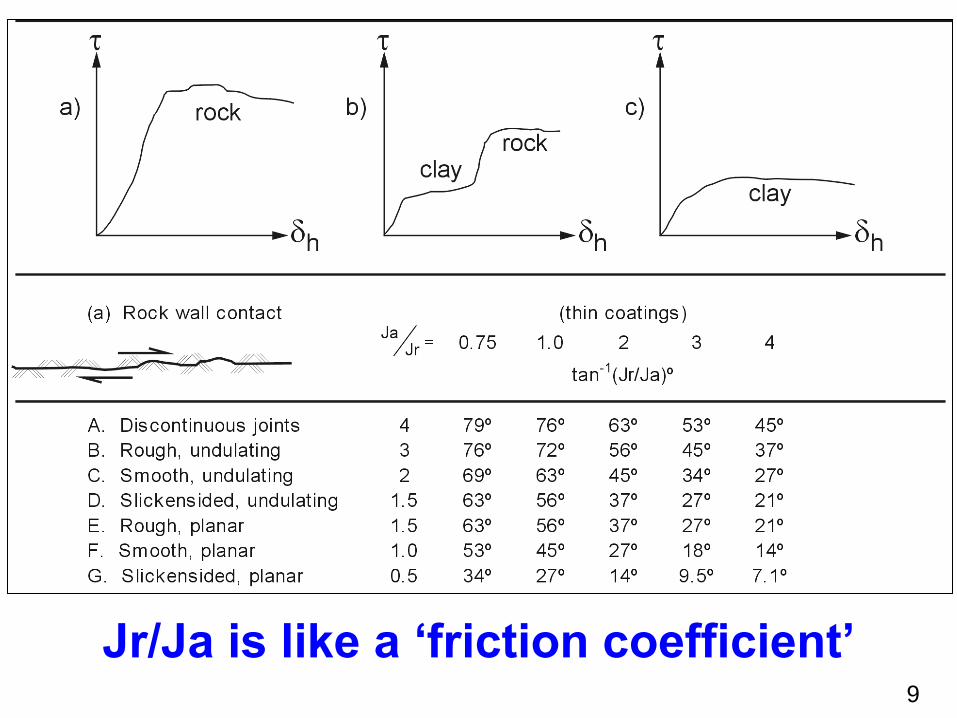
9
Jr/Ja is like a ‘friction coefficient’

FAULT ZONES ARE UNIQUE CHALLENGES FOR
TUNNELLERS BECAUSE…….
RQD, Jn, Jr, Ja, Jw, SRF……..all Q-parameters
may be adverse
also TIME + COST 10

OTHER COMBINATIONS OF
Q-PARAMETERS ALSO PROVIDE USEFUL GUIDANCE ABOUT
TUNNEL BEHAVIOUR
Jn/Jr ……over-break
11
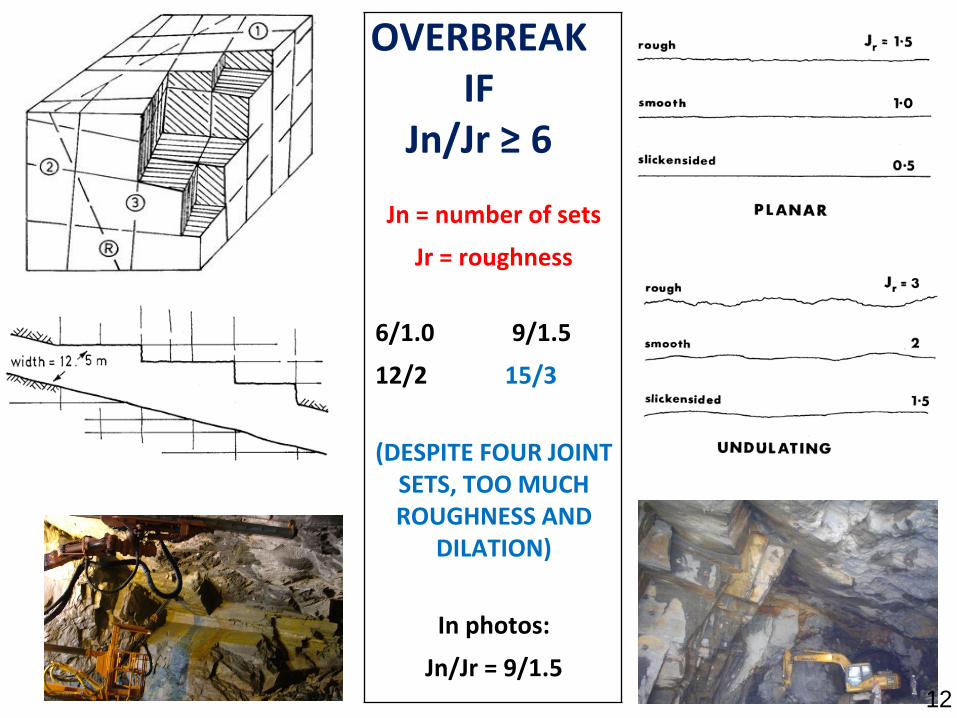
OVERBREAK IF
Jn/Jr ≥ 6
Jn = number of sets
Jr = roughness
6/1.0 9/1.5
12/2 15/3
(DESPITE FOUR JOINT SETS, TOO MUCH ROUGHNESS AND
DILATION)
In photos:
Jn/Jr = 9/1.5 12
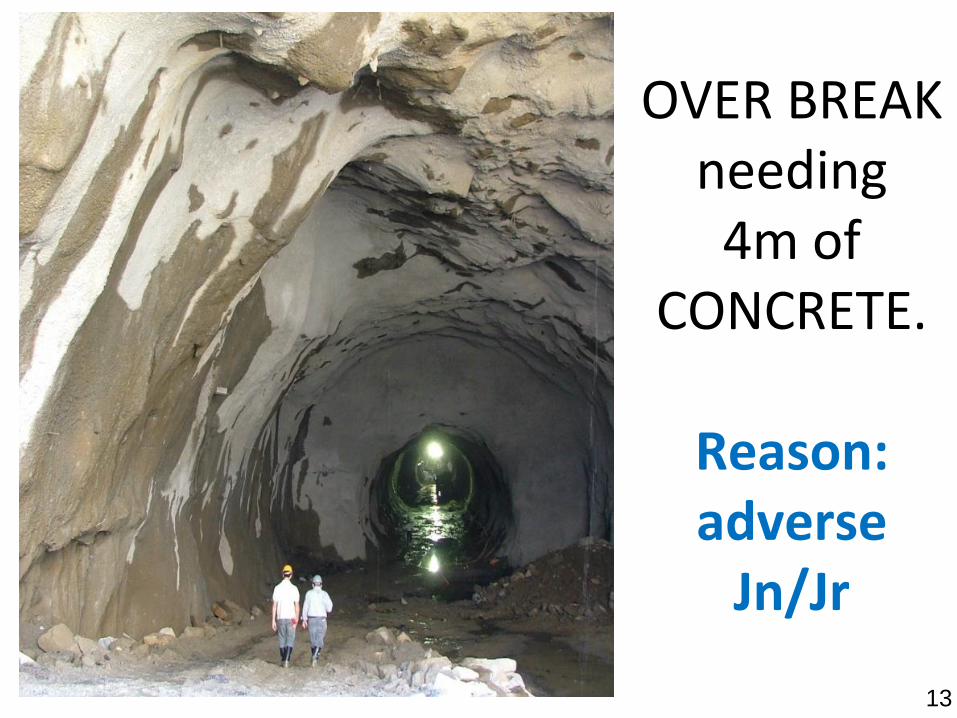
OVER BREAK needing
4m of CONCRETE.
Reason: adverse
Jn/Jr
13

CONCERNING THE PREDICTION OF OVERBREAK
RMR (Bieniawski) and GSI (= RMR-5) (Hoek) ARE PARAMETERS USED BY MANY IN ASSISTING TUNNEL DESIGN.
ONE SHOULD BE AWARE THAT THERE IS NO PARAMETER FOR NUMBER OF JOINT SETS, NOR FOR ROCK STRESS IN RMR, THEREFORE NOT IN GSI EITHER.
14

MANY POSSIBILITIES IN TUNNELLING
15

Among the possibilities:
NMT or NATM?
16

NMT or NATM?
1. SINGLE-SHELL METHODS OF SUPPORT (Sfr) + REINFORCEMENT (B) ARE USED IN ‘ALL’ THE WORLD’S HYDROPOWER GENERATION CAVERNS, OIL STORAGE CAVERNS ETC.
2. BUT IN OTHER EXCAVATIONS (LIKE ROAD, RAIL, METRO TUNNELS) THERE IS A DECISION TO BE MADE: ‘NATM’ or ‘NMT’?
17

REISSECK II PUMPED STORAGE, AUSTRIA
EVEN IN AUSTRIA, SOMEONE DECIDED TO USE ‘SINGLE-SHELL’ S(mr) + B …..in this large machine-hall.
(Similar decisions could/should be made about smaller tunnels?)
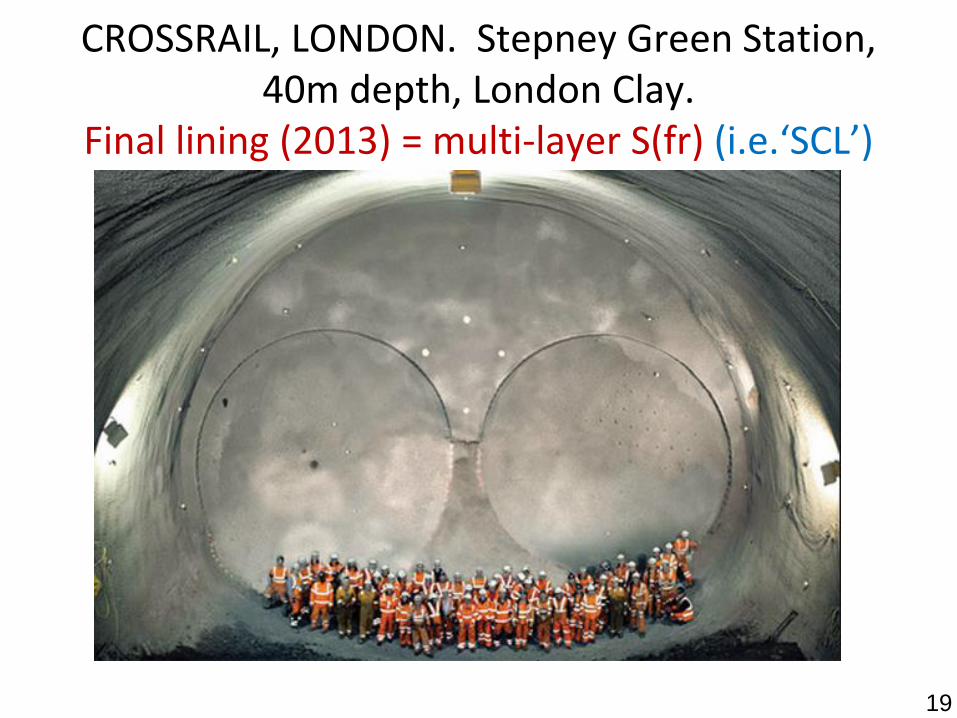
CROSSRAIL, LONDON. Stepney Green Station, 40m depth, London Clay.
Final lining (2013) = multi-layer S(fr) (i.e.‘SCL’)
19

Two examples of single-shell
tunnels with sprayed
membrane as final seal against
water.
Lausanne Metro, Switzerland
Hinehead Tunnel, UK
These resemble appearance of NMT in Norway
20
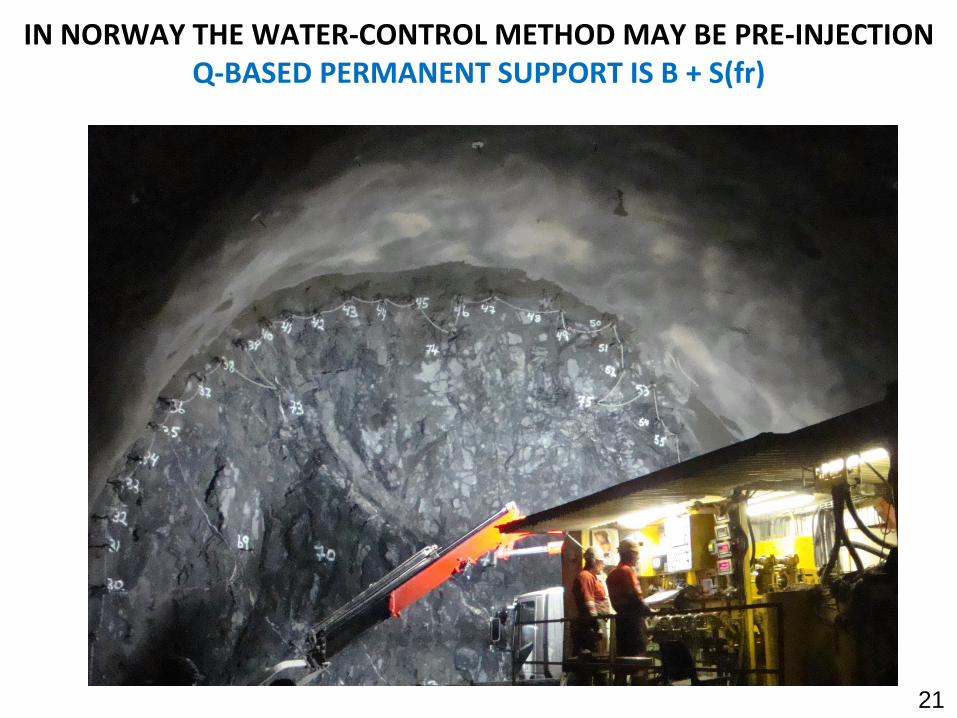
IN NORWAY THE WATER-CONTROL METHOD MAY BE PRE-INJECTION Q-BASED PERMANENT SUPPORT IS B + S(fr)
21

PRE-INJECTED SHALES / AND LIMESTONES ……B + 1st S(fr)
22
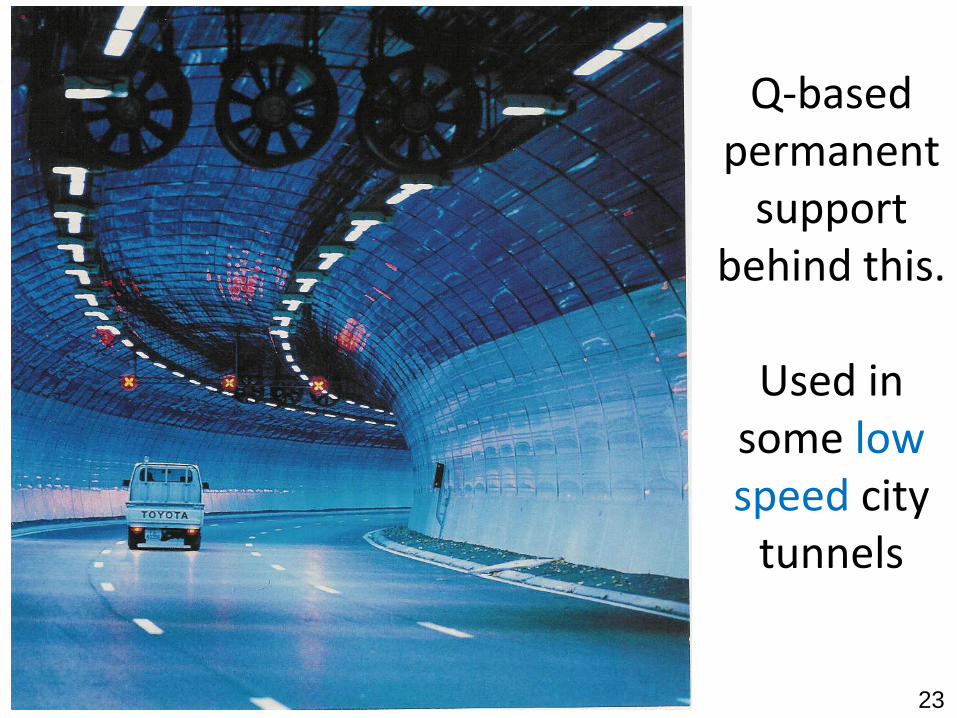
Q-based permanent
support behind this.
Used in
some low speed city
tunnels
23

Temporary support phase of NATM: S(mr) + B? + lattice girders?
Eurotunnel sub-sea Cross-Over Cavern, Channel
Tunnel Project.
Final CCA. 24

With RMR/GSI, unwanted overbreak is not ‘seen’. But with ‘double-shell’ NATM, S(fr) or S(mr) volume + CCA volume: all increase considerably + time/cost.
Difficult (3D) membrane construction with overbreak from Hong Kong
25
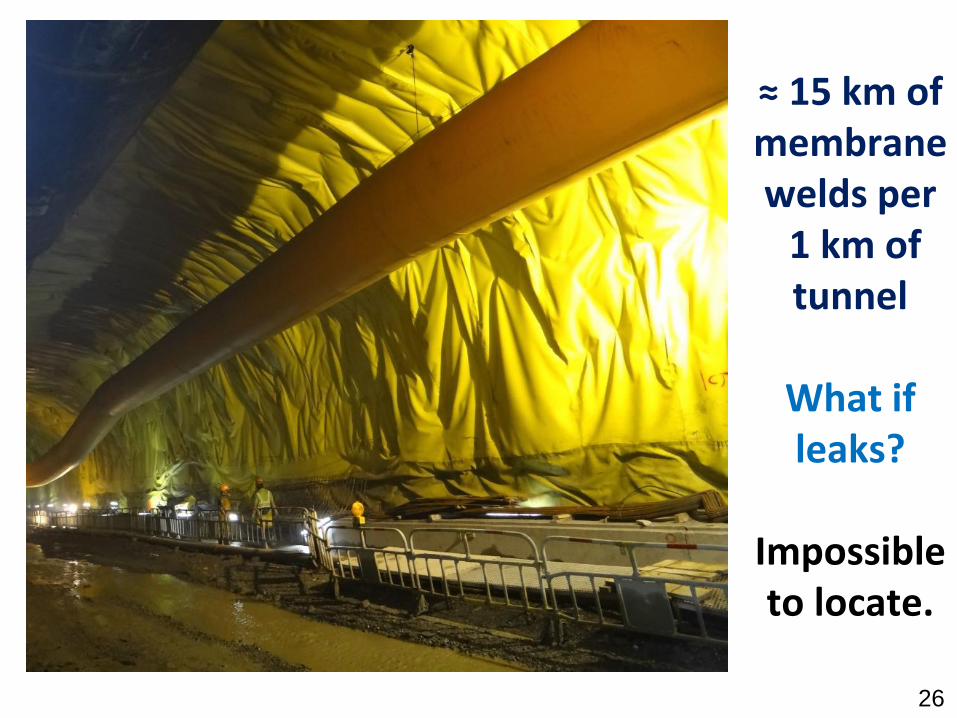
≈ 15 km of membrane welds per 1 km of tunnel
What if leaks?
Impossible to locate.
26

NMT/NATM ?
JUST AS A CURIOSITY – NMT (Q) AND NATM CAN
BE COMBINED !
27

THOSE WHO INSIST ON NATM – CAN USE Q FOR TEMPORARY SUPPORT SELECTION…5Q + 1.5 x ESR
(25 years use in HK road tunnels and metro tunnels)
28

CONTRASTING THE TYPICAL COMPONENTS:
1. ‘DOUBLE-SHELL’ (‘NATM’) (Temporary: Sfr/Smr, B, steel/lattice girders, Permanent: fleece, membrane, cast concrete CCA)………..needs large work force
2. ‘SINGLE-SHELL’ (NMT)
(pre-grouting?) + B + Sfr + (RRS?)…………..
needs small work force (x 1/10?)
29
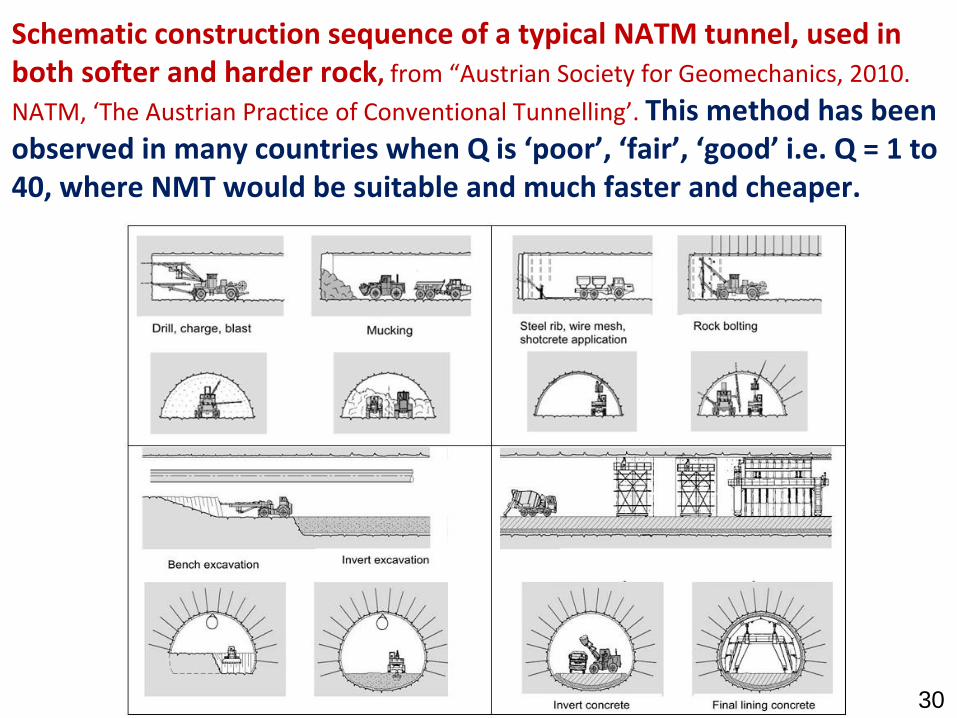
Schematic construction sequence of a typical NATM tunnel, used in both softer and harder rock, from “Austrian Society for Geomechanics, 2010.
NATM, ‘The Austrian Practice of Conventional Tunnelling’. This method has been observed in many countries when Q is ‘poor’, ‘fair’, ‘good’ i.e. Q = 1 to 40, where NMT would be suitable and much faster and cheaper.
30
31
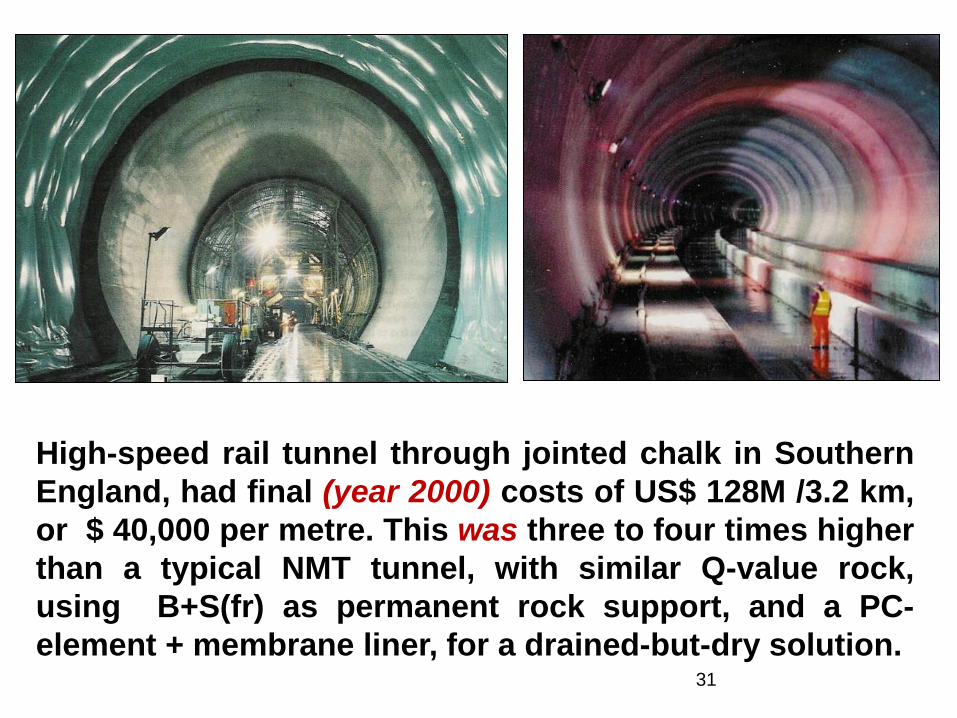
High-speed rail tunnel through jointed chalk in Southern
England, had final (year 2000) costs of US$ 128M /3.2 km,
or $ 40,000 per metre. This was three to four times higher
than a typical NMT tunnel, with similar Q-value rock,
using B+S(fr) as permanent rock support, and a PC-
element + membrane liner, for a drained-but-dry solution.
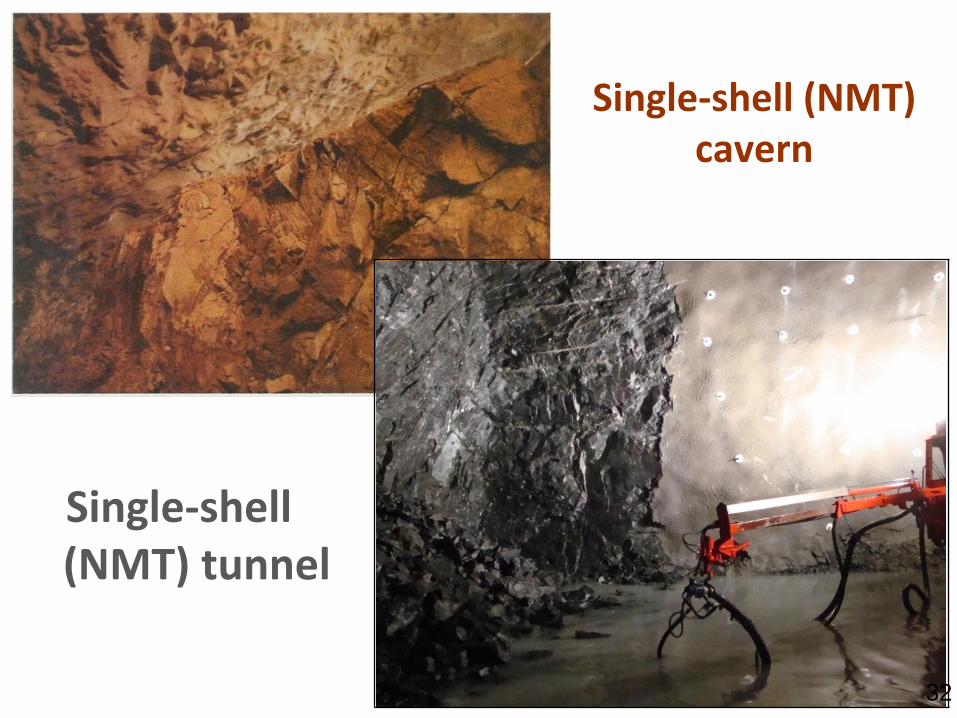
Single-shell (NMT) cavern
Single-shell (NMT) tunnel
32

33
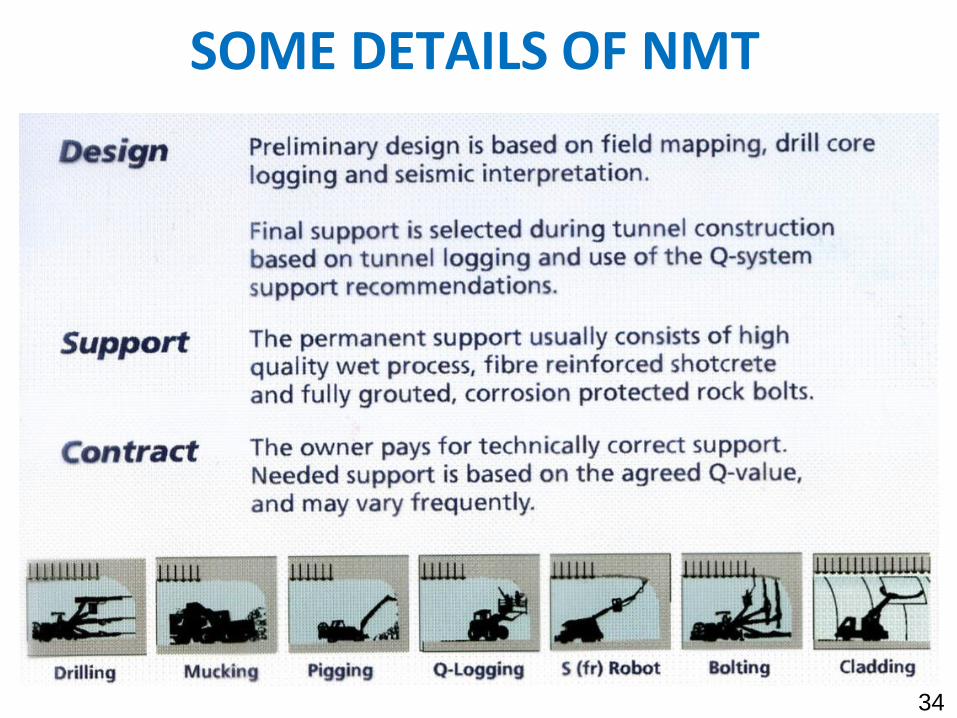
SOME DETAILS OF NMT
34
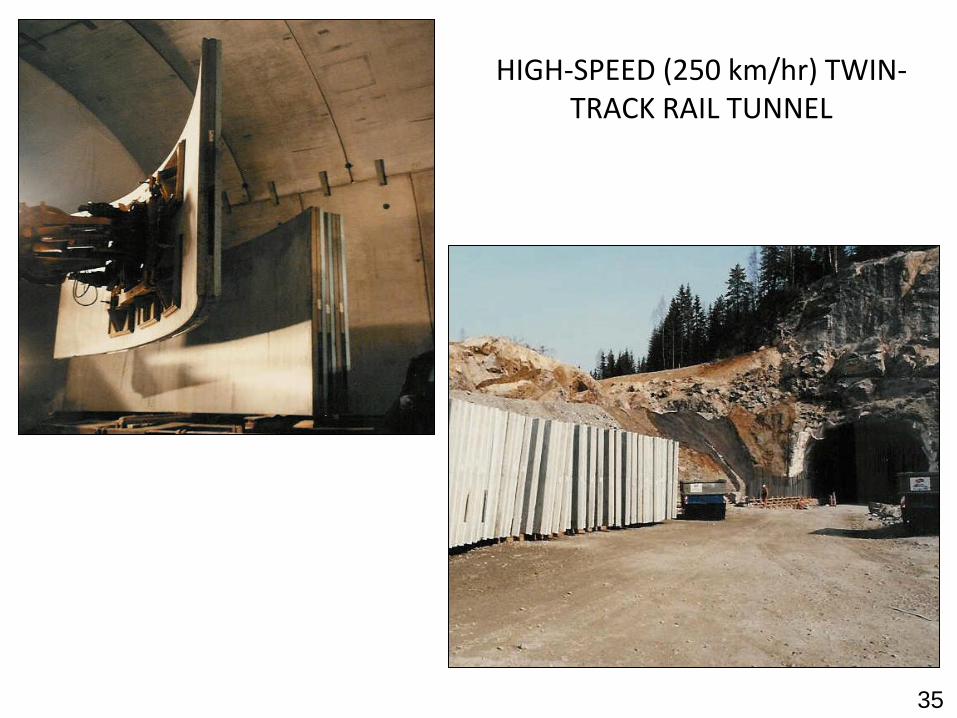
HIGH-SPEED (250 km/hr) TWIN-TRACK RAIL TUNNEL
35
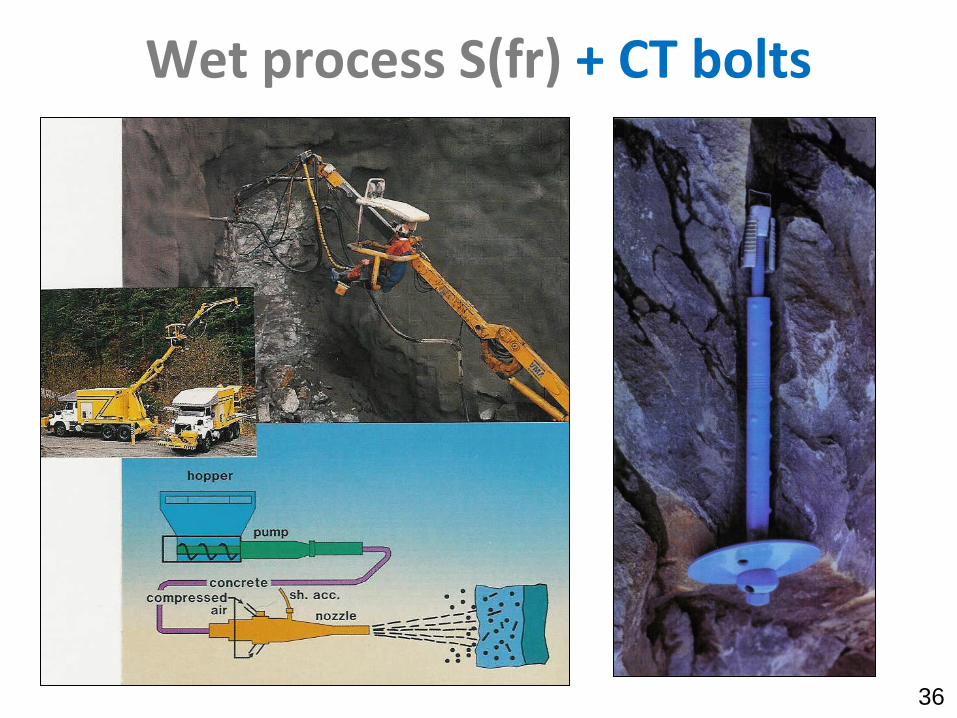
Wet process S(fr) + CT bolts
36

37
An over-cored CT
bolt showing crack
(joint) penetration to
outer layer of grout –
the usual potential
commencement
of corrosion
for a conventional
bolt near the face.
There remain four
layers of corrosion
protection even with
the joint/crack.

WHAT IF BAD CONDITIONS IN
SINGLE-SHELL (NMT) TUNNELS ?
(NEVER USE STEEL
ARCHES……because….)
38

STEEL ARCHES or LATTICE GIRDERS
THE CONSEQUENCES OF LOOSENING ROCK – SRF ? 39

40

41

Integration of rock mass quality (Q) with
seismic velocity (Vp),
deformation modulus Emass, deformation Δ,
Lugeon L?
42

P-wave velocity Vp conversion to Q
(useful for interpolating
between boreholes)
43
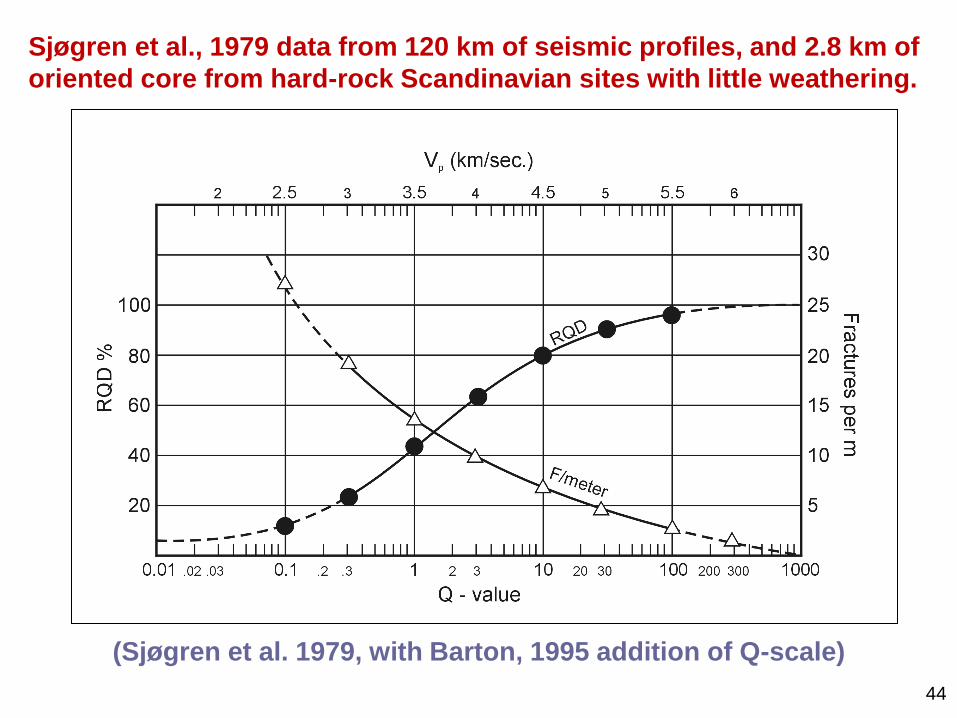
(Sjøgren et al. 1979, with Barton, 1995 addition of Q-scale)
44
Sjøgren et al., 1979 data from 120 km of seismic profiles, and 2.8 km of
oriented core from hard-rock Scandinavian sites with little weathering.
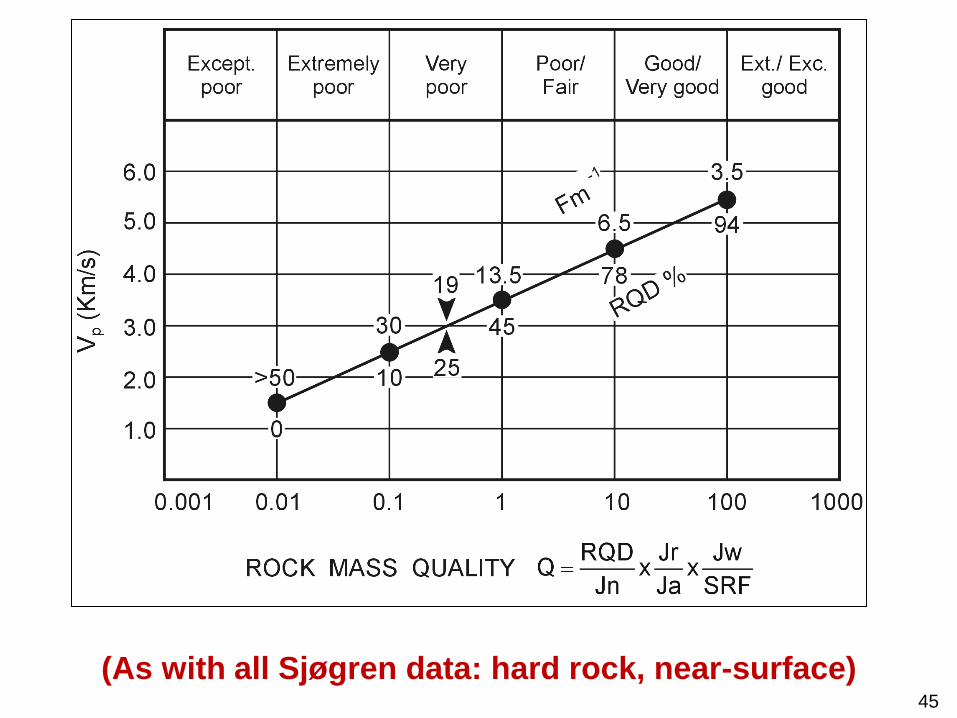
(As with all Sjøgren data: hard rock, near-surface) 45

In the case of correlating Q-values to engineering/ geophysical parameters like Vp (P-wave velocity) and Emass (deformation modulus) use of the term Qc = Q x c /100 is better than Q alone! (c in MPa)
The six-order of magnitude Q range of 0.001 to 1000 (approx.) and the larger (eight-orders-of-magnitude) range of Qc correlate fairly simply, to the huge - real world - range of rock mass properties.
46

47
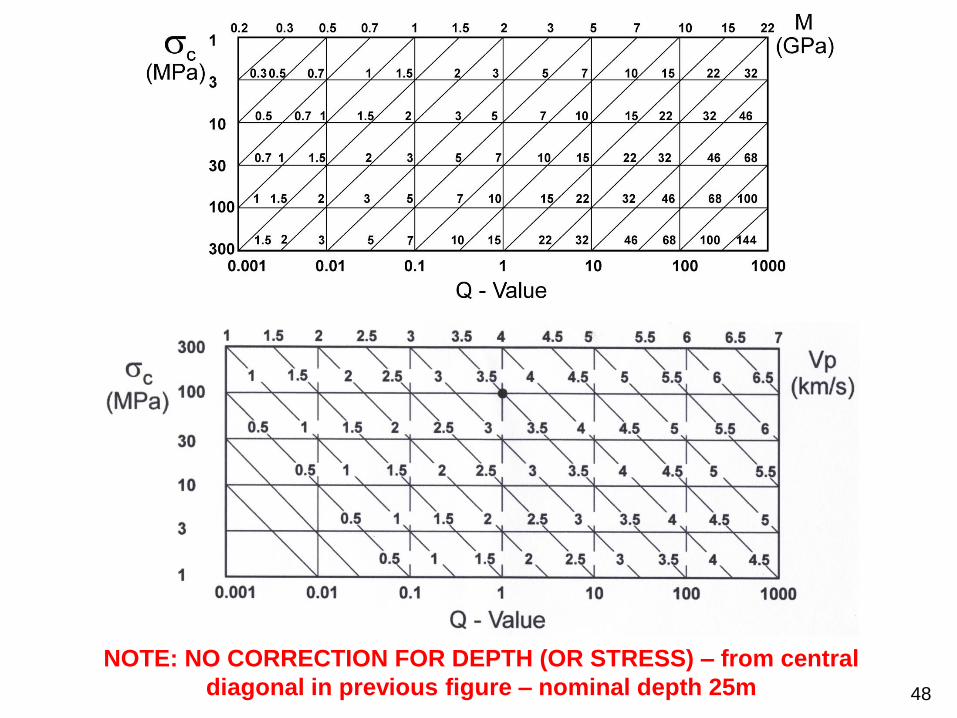
NOTE: NO CORRECTION FOR DEPTH (OR STRESS) – from central
diagonal in previous figure – nominal depth 25m 48

DEPTH-DEPENDENT Qc ‘iso-curves’. In practice ‘Qc-jumping’ is experienced, with both Vp and Qc increasing rapidly in the top 10 to
100 m, depending on weathering depth. (Note km/s per km = s-1 units of velocity gradient).
CONVERSION OF Qc TO DEFORMATION MODULUS
Emass (or M)
50
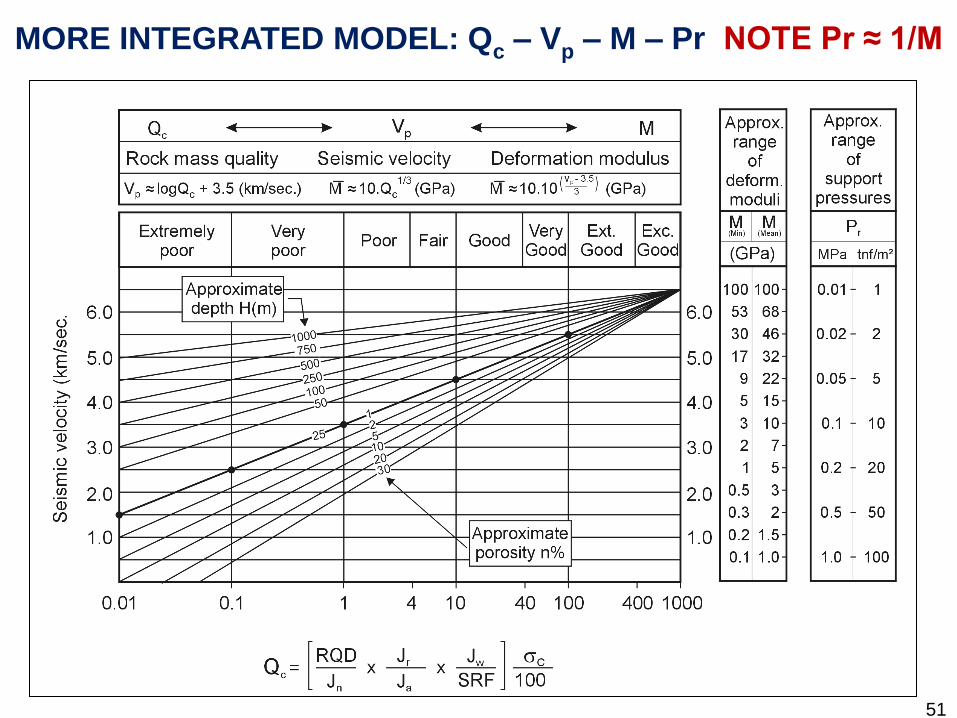
MORE INTEGRATED MODEL: Qc – Vp – M – Pr NOTE Pr ≈ 1/M
51

TUNNEL AND CAVERN DEFORMATION Δ IN RELATION TO
Q and SPAN

Q
SPAN
53
Q
SPAN

Units:
SPAN, HEIGHT, v and h (mm)
Rock stresses and rock strengths (MPa).
(But over-simplified central trend is Δ (mm) ≈ SPAN(m)/Q
from many hundreds of case records, many from Taiwan).
c
vv
Q100
SPAN
c
hh
Q100
HEIGHT
22
v
ho
HEIGHT
SPANk
54

Nathpa Jakri HEP powerhouse cavern
India
Gjøvik cavern
Norway

It is wise to check MODELLING RESULTS with these formulæ when doing numerical modelling (including UDEC), and obviously if doing continuum modelling.
THE EMPIRICAL FORMULÆ MIGHT BE CLOSER TO THE (FUTURE) MEASURED REALITY THAN THE NUMERICAL MODEL !
56
CONTINUUM (??) or
DISCONTINUUM MODELLING
57
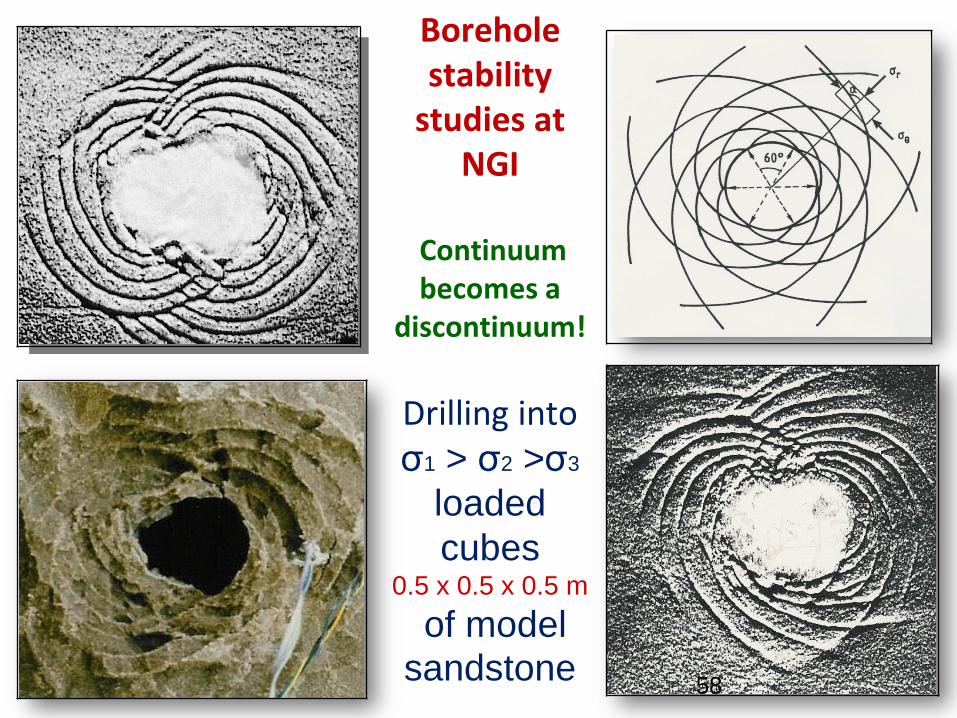
Borehole stability
studies at NGI
Continuum becomes a
discontinuum!
Drilling into σ1 > σ2 >σ3
loaded
cubes 0.5 x 0.5 x 0.5 m
of model
sandstone 58

Jinping II (D+B) – ISRM News Journal Physical model – bored under stress (NGI) Jinping II (TBM) – ISRM workshop (NB)
Log-spiral
shear modes in
weaker rock types
59
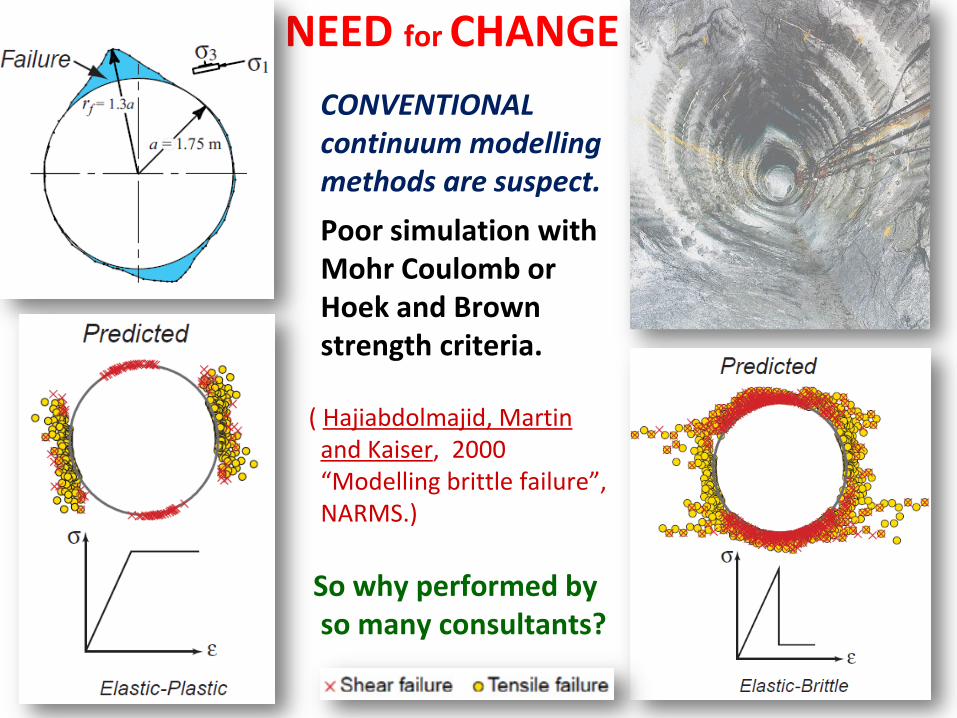
NEED for CHANGE CONVENTIONAL
continuum modelling methods are suspect.
Poor simulation with Mohr Coulomb or Hoek and Brown strength criteria.
( Hajiabdolmajid, Martin and Kaiser, 2000 “Modelling brittle failure”, NARMS.)
So why performed by so many consultants?
60

Degrade cohesion, mobilize friction: excellent match. ( Hajiabdolmajid, Martin and Kaiser, 2000 “Modelling brittle failure”, NARMS.) 61

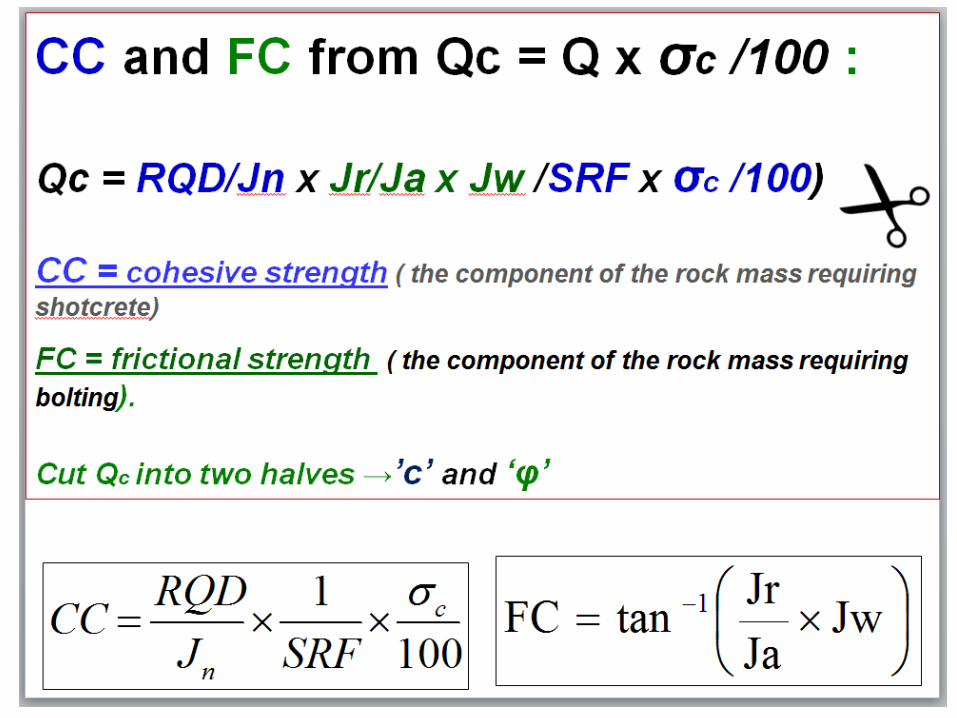
NOW HAVE AN ALTERNATIVE Q-BASED WAY TO ESTIMATE ‘c’
and ‘φ’ FOR ROCK MASSES!
(but still need to degrade c at small strain, and mobilize φ at
larger strain)
62
63

GSI-based algebra for ‘c’ and ‘φ’
contrasted
with
Q-based
‘empiricism’
Note:
shotcrete
needed when
low CC,
bolting
needed when
low FC.

65
Four rock masses with successively reducing character: more joints, more weathering, lower UCS, more clay.
Low CC –shotcrete preferred Low FC – bolting preferred 45
Unpredicted degrees of weathering have a directly negative effect on both
these strength (or weakness) components and therefore also on the
support requirements.
46
22
10.7
3.5
0.9
5.5
4.5
3.6
2.1
0.4
50
10
2.5
0.26
0.01
63°
45°
26°
9°
5°
100
10
1.2
0.04
0.0008
100
100
50
33
10
100
10
2.5
0.13
0.008
1
1
1
2.5
5
1
1
0.66
0.66
0.5
1
1
2
4
6
2
1
1.5
1
1
2
9
12
15
20
100
90
60
30
10
Emass GPaVp km/sCC MPaFC°QccQSRFJwJaJrJnRQD
Table of Q-parameters with declining quality (resembling weathering) (Barton, 2002).
48
48

ROCK MASS PERMEABILITY AND Q
(Can there possibly be some
relation?)
According to some simple theory in Barton, 2006 - the answer is ‘yes’!

A SERIES OF APPROXIMATIONS. STRONG LACK-OF-FIT WOULD SUGGEST CLAY-FILLED JOINTS
Q-value 0.1 1 10 100
Lugeon 10 1 0.1 0.01
K ≈ m/sec 10-6 10-7 10-8 10-9
VP km/s 2.5 3.5 4.5 5.5
67

TWO VERSIONS OF PERMEABILITY ESTIMATION
68

69

USUAL RANGE OF K at DAM SITES
70

?
71
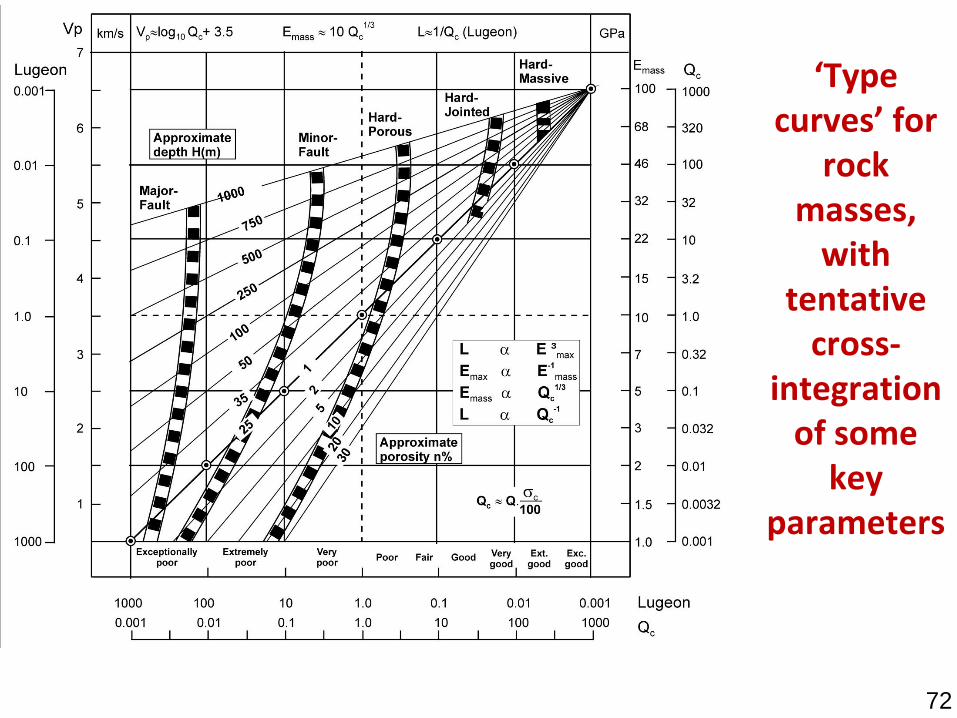
‘Type curves’ for
rock masses,
with tentative
cross-integration
of some key
parameters
72
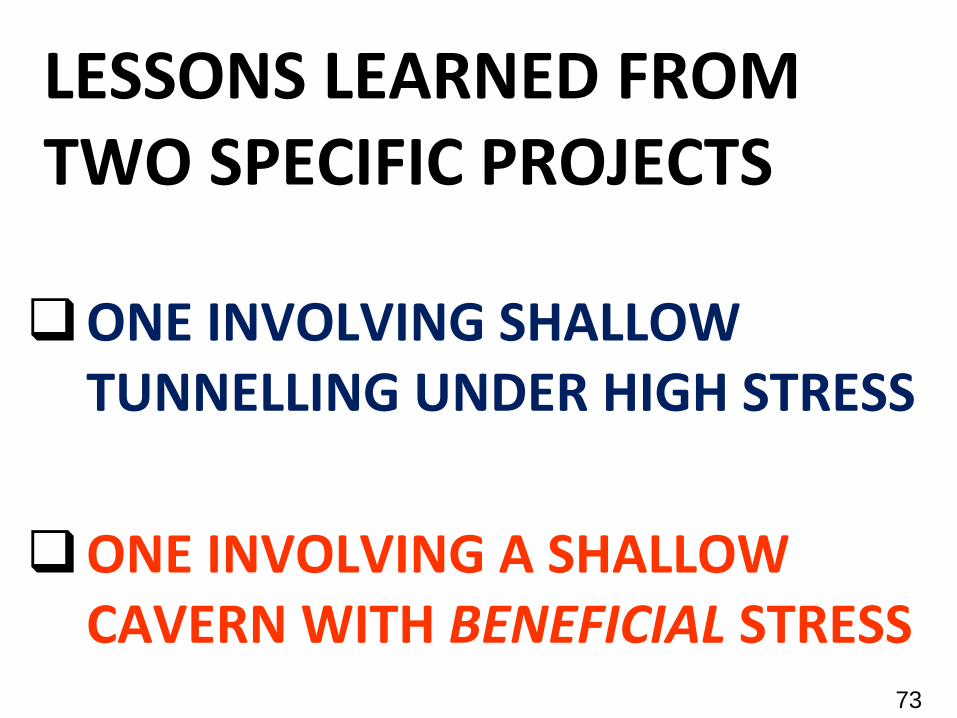
LESSONS LEARNED FROM TWO SPECIFIC PROJECTS
ONE INVOLVING SHALLOW TUNNELLING UNDER HIGH STRESS
ONE INVOLVING A SHALLOW CAVERN WITH BENEFICIAL STRESS
73
HYDROELECTRIC PROJECT TUNNELLING
ITA HEP, BRAZIL
SUFFERED FROM VERY HIGH ROCK STRESS DESPITE SHALLOW
TUNNELLING

Major horizontal stress = NNW.
Ridge formed of
intrusive dyke has same orientation.
HEP ITA CONSTRUCTED ACROSS NARROWEST < 1km wide RIDGE
75

Regional stress of long ago, induces fracturing which prejudices the meander direction of the river.
The river eventually causes a stress concentration in the ridge.
σH2/σh2 >> σH1/σh1
76


AT THE SITE THERE ARE 4 SPECIFIC BASALT FLOWS
TWO ARE MASSIVE……………….HIGH Q-value………HIGH E MODULUS TWO ARE JOINTED………………LOWER Q-value……LOWER E MODULUS
(THE ‘H’ AND ‘I’ FLOWS ARE MASSIVE….and apparently attract higher stress) Flows G and J (jointed flows) Q = 5 to 13 Flows H and I: (massive flows) Q = 30 to 100 Prior to assumption of significant stress difference between the two pairs of flows, following preliminary Q-ranges of 5 to 13, and 30 to 100 respectively.
78
1
66.
21
25.1
96
9070xxQ
1
1x
175.
45.1x
63
10090Q

LAYOUT OF THE ITA HYDRO-ELECTRIC PROJECT
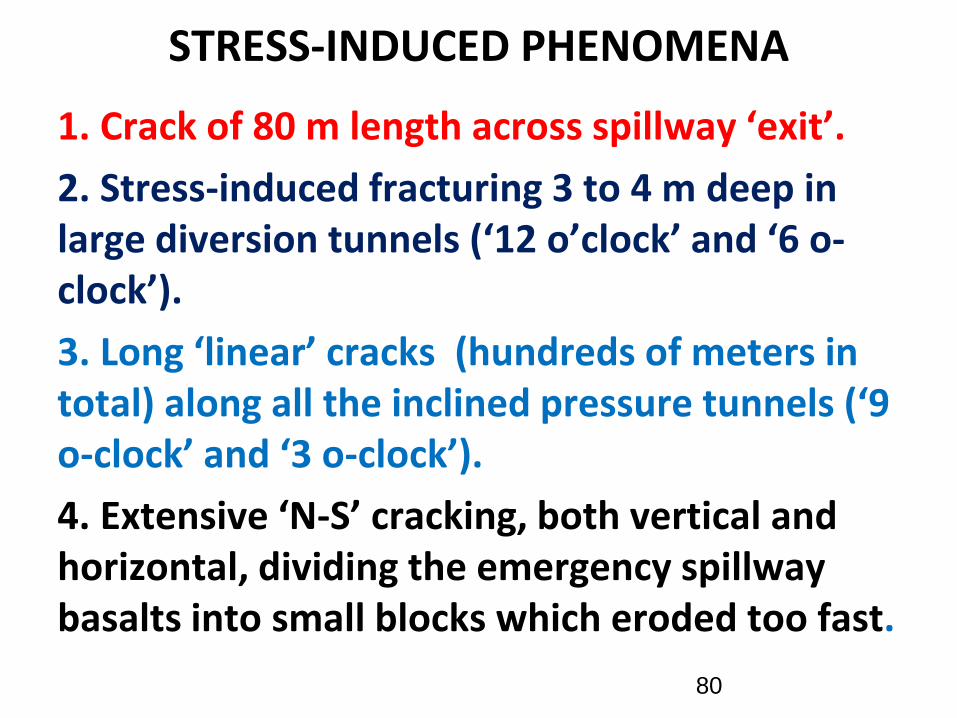
STRESS-INDUCED PHENOMENA
1. Crack of 80 m length across spillway ‘exit’.
2. Stress-induced fracturing 3 to 4 m deep in large diversion tunnels (‘12 o’clock’ and ‘6 o-clock’).
3. Long ‘linear’ cracks (hundreds of meters in total) along all the inclined pressure tunnels (‘9 o-clock’ and ‘3 o-clock’).
4. Extensive ‘N-S’ cracking, both vertical and horizontal, dividing the emergency spillway basalts into small blocks which eroded too fast.
80

STRESS-INDUCED PROBLEMS IN:
River diversion tunnels: two main tunnels (1 and 2) 14,0m x 14,0m
Three auxiliary tunnels (3, 4 and 5) 15,0m x 17,0m high, (operate during floods)
Pressure tunnels 5@ 120m, 9 m diameter, 53º inclined (concrete lined: lower section: steel penstock)
Emergency spillway
Exploratory boreholes?

THE REALITY OF STRESS-INDUCED FAILURES IN THE ARCHES
(AND INVERTS) OF THE DIVERSION TUNNELS. MANY THOUSAND m3 OF
ROCK FAILED…and were then eroded by the water – most in the invert.
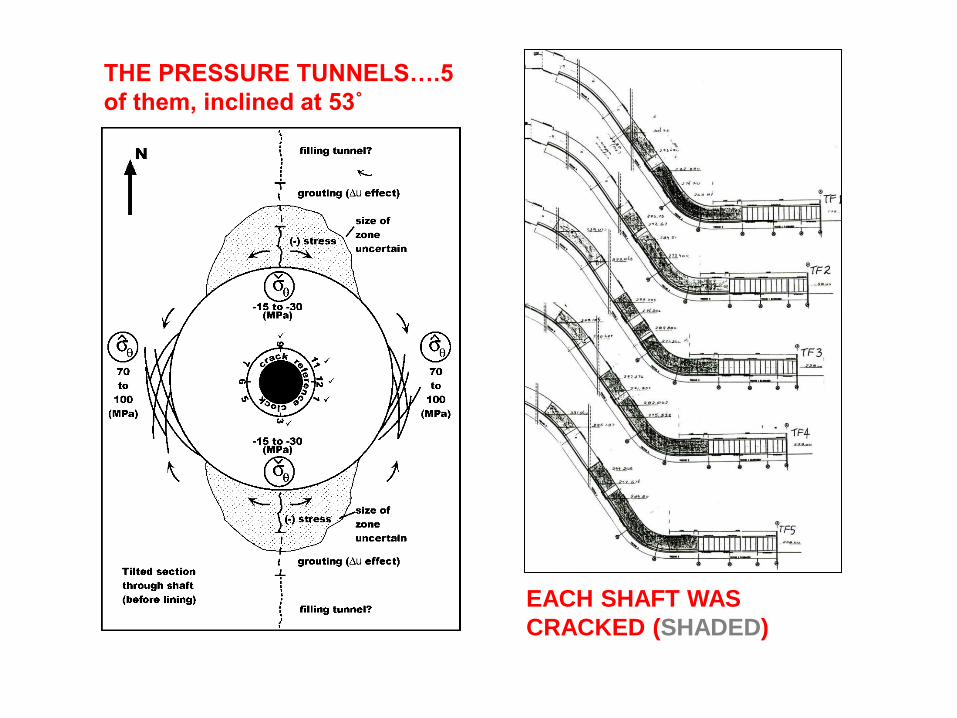
THE PRESSURE TUNNELS….5
of them, inclined at 53˚
EACH SHAFT WAS
CRACKED (SHADED)

GJØVIK OLYMPIC CAVERN
INCREASE OF LARGEST CAVERN SPAN BY ALMOST 2 x
85

Gjøvik Olympic cavern represented a big jump…….in
span and confidence!
(Figure from Sharp,
1996: UK Nirex study)
BLUE: Lærdal
Tunnel (three, lorry-turning
and ‘wake-up-driver’ caverns in
24.5 km long tunnel)

LÆRDAL TUNNEL lorry-turning caverns (three of them) 30 m span, depths 1,000 to 1,400 m (Photo G.Lotsberg)
87

PHYSICAL (2D) MODELS of ROCK CAVERNS, PERFORMED SOME
YEARS BEFORE UDEC-BB FLEXIBILITY
EARLIER STUDIES FOR UNDERGROUND
NUCLEAR POWER PLANTS
with 50 m spans in 1970’s. These were fore-runners for future ‘Gjøvik’.
88

“Jointed rock-mass” (1968-1969 photos)
Barton, 1971
Tension-fracture models for slope and cavern
investigations (pre-UDEC)
90
Post-seismic loading result (0.2 to 0.5 g)
91

Physical and FEM modelling (Barton and
Hansteen, 1979) suggested possible ‘heave’ resulting from large-cavern construction near the surface…….. ……….depended on joint pattern and horizontal stress level in the physical models.
92

FEM continuum modelling of large caverns had also
suggested the possibility of
‘heave’ if σH was large enough (H.Hansteen),
But we did not know what to
expect for the 62 m span jointed
structure (10 years later)

94
Gjøvik cavern : represented an ’extension’ of 1974 Q-system data base.
(Qmin, Qmean, and Qmax values of 1, 12, 30 logged in the cavern arch) RQD = 60-90%, UCS = 90 MPa was typical.

95
Q-characterization using pre-construction data Core logging = ////////////// Existing nearby cavern = █
The boreholes used
for core recovery were
also permeability
tested (K mostly ≈ 10-7
to 10-8 m/s), ≈
consistent with
L ≈ 1/QC
96

97
Cross-hole seismic tomography at Gjøvik showed the expected
increase in velocity with depth........
but it was more than
expected due to stress-gradient effects....
the quality was not
’as-good-as-the-velocity’
(Barton, 2006)
98
Despite no improvements to rock
quality with depth (below top 5 m), velocity
continued to rise.
(Barton et al. 1994)

99
GJØVIK CAVERN JOINT-GEOMETRY ASSUMPTIONS Input data, boundary stresses
Barton, N., By, T.L., Chryssanthakis, P., Tunbridge, L., Kristiansen, J., Løset, F., Bhasin, R.K., Westerdahl, H. & Vik, G. 1994. Predicted and measured performance of the 62m span Norwegian Olympic Ice Hockey
Cavern at Gjøvik. Int. J. Rock Mech, Min. Sci. & Geomech. Abstr. 31:6: 617-641. Pergamon.
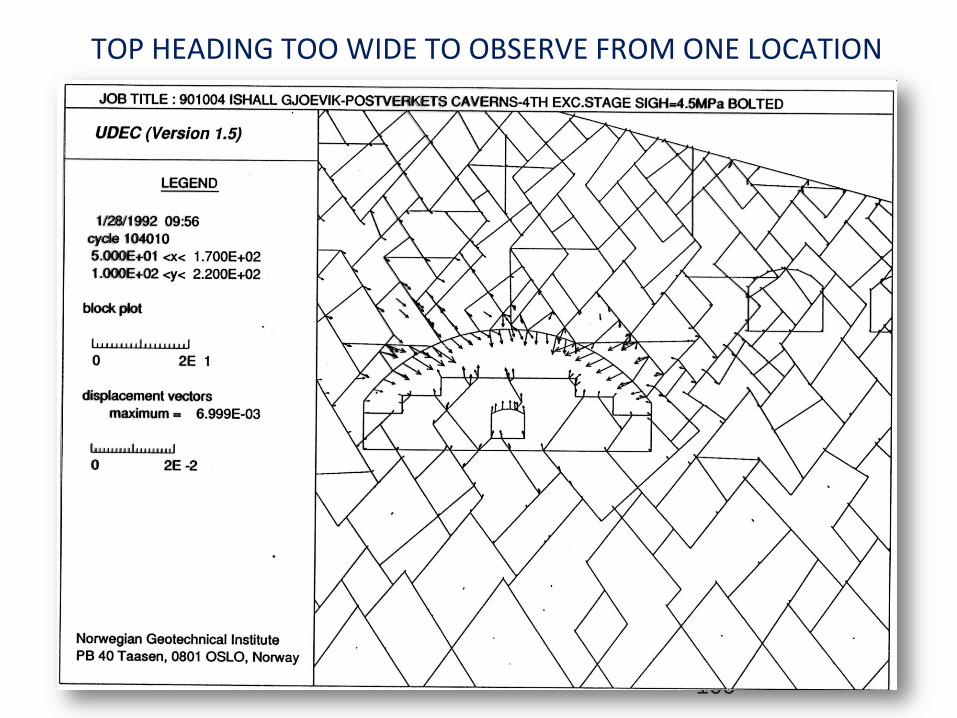
100
TOP HEADING TOO WIDE TO OBSERVE FROM ONE LOCATION

101

102
The final modelled 7 to 9 mm (downwards directed) deformations matched the subsequently measured MPBX results almost perfectly.
(UDEC-BB modelling by Chryssanthakis, NGI)

Stress arching calculations …..were affected by the subsequent near-by caverns for the Post Service

104
DEFORMATION RECORDS FROM MPBX AND LEVELLING
Δ = 7 to 8 mm
was typical.
Construction period:
week 24 to week
50, following
arrival of access
tunnels (top and
bottom).
B x H x L
= 62 x 24 x 90
= 140,000 m3

105
SUPPORT/ REINFORCEMENT S(fr) 100mm + B c/c 2.5 m + A c/c 5.0 m
(mean S (fr) thickness from numerous control borings = 98 mm)
(bolts and twin-strand anchors:
L = 6 m bolts, and L = 12 m anchors)
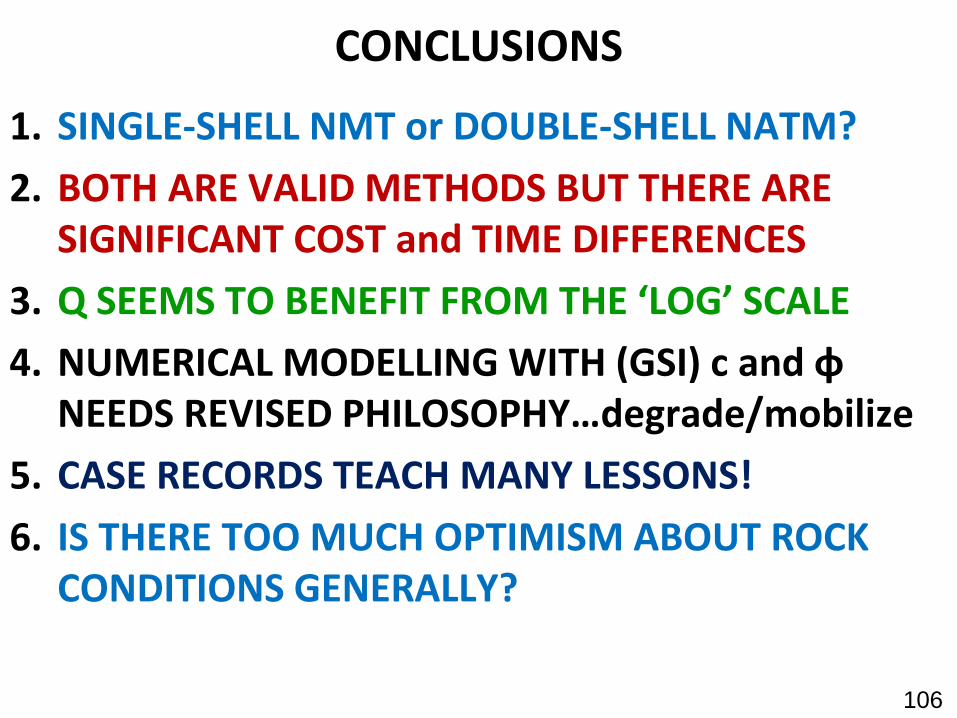
CONCLUSIONS
1. SINGLE-SHELL NMT or DOUBLE-SHELL NATM?
2. BOTH ARE VALID METHODS BUT THERE ARE SIGNIFICANT COST and TIME DIFFERENCES
3. Q SEEMS TO BENEFIT FROM THE ‘LOG’ SCALE
4. NUMERICAL MODELLING WITH (GSI) c and φ NEEDS REVISED PHILOSOPHY…degrade/mobilize
5. CASE RECORDS TEACH MANY LESSONS!
6. IS THERE TOO MUCH OPTIMISM ABOUT ROCK CONDITIONS GENERALLY?
106

107