
les5e_ptb_08
28
Ch. 8 Hypothesis Testing with Two Samples 8.1 Testing the Difference Between Means (Large Independent Samples) 1 Determine the Difference Between Dependent and Independent Samples MULTIPLE CHOICE. Choose the one alternative that best completes the statement or answers the question. Provide an appropriate response. 1) Classify the two given samples as independent or dependent. Sample 1: Pre-training weights of 19 people Sample 2: Post-training weights of 19 people A) dependent B) independent 2) Classify the two given samples as independent or dependent. Sample 1: The weights in pounds of 26 newborn females Sample 2: The weights in pounds of 26 newborn males A) independent B) dependent 3) Classify the two given samples as independent or dependent. Sample 1: The scores of 10 students who took the ACT Sample 2: The scores of 10 different students who took the SAT A) independent B) dependent 4) As part of a marketing experiment, a department store regularly mailed discount coupons to 25 of its credit card holders. Their total credit card purchases over the next three months were compared to their prior credit card purchases during the previous three months. Determine whether the samples are dependent or independent. A) dependent B) independent 5) As part of a marketing experiment, a department store regularly mailed discount coupons to 25 of its credit card holders. Their total credit card purchases over the next three months were compared to the credit card purchases over the next three months for 25 credit card holders who were not sent discount coupons. Determine whether the samples are dependent or independent. A) independent B) dependent 6) As part of a Masterʹs thesis project, a mathematics teacher is interested in the effects of two different teaching methods on mathematics achievement. She randomly chooses one class of students to learn an algebraic concept using traditional methods and another class of students to learn the same algebraic concept using manipulatives. The teacher then compares their test scores. Determine whether the samples are dependent or independent. A) independent B) dependent 7) As part of a Masterʹs thesis project, a mathematics teacher is interested in the effects of two different teaching methods on mathematics achievement. She randomly chooses a class of students to learn one algebraic concept using traditional methods. Then on another day, the same students learn a similar algebraic concept using manipulatives. The teacher then compares their test scores. Determine whether the samples are dependent or independent. A) dependent B) independent Page 151 Copyright © 2012 Pearson Education, Inc.
-
Upload
jiger-shah -
Category
Documents
-
view
205 -
download
95
description
Elementary Statistics Picturing the World ( 5th Edition ) Larson - Farber test bnk Nursing RN
Transcript of les5e_ptb_08

Ch. 8 Hypothesis Testing with Two Samples
8.1 Testing the Difference Between Means (Large Independent Samples)
1 Determine the Difference Between Dependent and Independent Samples
MULTIPLE CHOICE. Choose the one alternative that best completes the statement or answers the question.
Provide an appropriate response.1) Classify the two given samples as independent or dependent.
Sample 1: Pre-training weights of 19 peopleSample 2: Post-training weights of 19 people
A) dependent B) independent
2) Classify the two given samples as independent or dependent.
Sample 1: The weights in pounds of 26 newborn femalesSample 2: The weights in pounds of 26 newborn males
A) independent B) dependent
3) Classify the two given samples as independent or dependent.
Sample 1: The scores of 10 students who took the ACTSample 2: The scores of 10 different students who took the SAT
A) independent B) dependent
4) As part of a marketing experiment, a department store regularly mailed discount coupons to 25 of its creditcard holders. Their total credit card purchases over the next three months were compared to their prior creditcard purchases during the previous three months. Determine whether the samples are dependent orindependent.
A) dependent B) independent
5) As part of a marketing experiment, a department store regularly mailed discount coupons to 25 of its creditcard holders. Their total credit card purchases over the next three months were compared to the credit cardpurchases over the next three months for 25 credit card holders who were not sent discount coupons.Determine whether the samples are dependent or independent.
A) independent B) dependent
6) As part of a Masterʹs thesis project, a mathematics teacher is interested in the effects of two different teachingmethods on mathematics achievement. She randomly chooses one class of students to learn an algebraicconcept using traditional methods and another class of students to learn the same algebraic concept usingmanipulatives. The teacher then compares their test scores. Determine whether the samples are dependent orindependent.
A) independent B) dependent
7) As part of a Masterʹs thesis project, a mathematics teacher is interested in the effects of two different teachingmethods on mathematics achievement. She randomly chooses a class of students to learn one algebraic conceptusing traditional methods. Then on another day, the same students learn a similar algebraic concept usingmanipulatives. The teacher then compares their test scores. Determine whether the samples are dependent orindependent.
A) dependent B) independent
Page 151
Copyright © 2012 Pearson Education, Inc.
2 Test a Claim About the Difference Between Two Population Means
MULTIPLE CHOICE. Choose the one alternative that best completes the statement or answers the question.
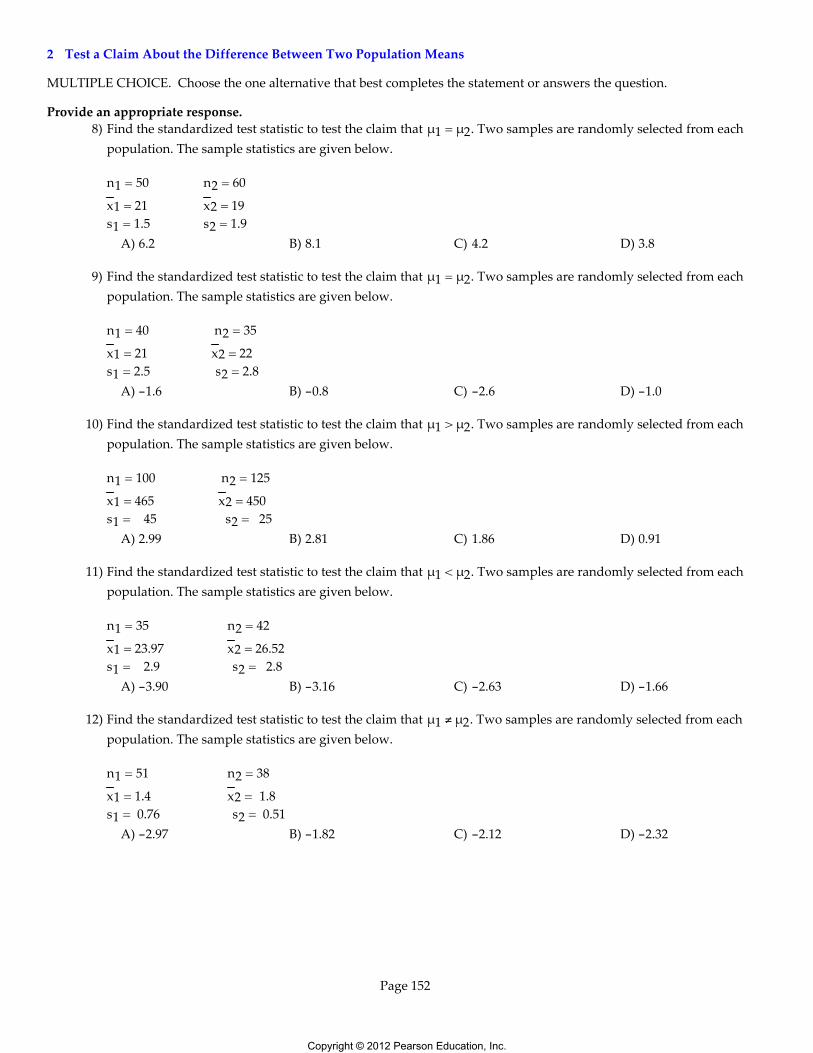
Provide an appropriate response.8) Find the standardized test statistic to test the claim that μ1 = μ2. Two samples are randomly selected from each
population. The sample statistics are given below.
n1 = 50 n2 = 60
x1 = 21 x2 = 19s1 = 1.5 s2 = 1.9
A) 6.2 B) 8.1 C) 4.2 D) 3.8
9) Find the standardized test statistic to test the claim that μ1 = μ2. Two samples are randomly selected from eachpopulation. The sample statistics are given below.
n1 = 40 n2 = 35
x1 = 21 x2 = 22s1 = 2.5 s2 = 2.8
A) -1.6 B) -0.8 C) -2.6 D) -1.0
10) Find the standardized test statistic to test the claim that μ1 > μ2. Two samples are randomly selected from eachpopulation. The sample statistics are given below.
n1 = 100 n2 = 125
x1 = 465 x2 = 450s1 = 45 s2 = 25
A) 2.99 B) 2.81 C) 1.86 D) 0.91
11) Find the standardized test statistic to test the claim that μ1 < μ2. Two samples are randomly selected from eachpopulation. The sample statistics are given below.
n1 = 35 n2 = 42
x1 = 23.97 x2 = 26.52s1 = 2.9 s2 = 2.8
A) -3.90 B) -3.16 C) -2.63 D) -1.66
12) Find the standardized test statistic to test the claim that μ1 ≠ μ2. Two samples are randomly selected from eachpopulation. The sample statistics are given below.
n1 = 51 n2 = 38
x1 = 1.4 x2 = 1.8s1 = 0.76 s2 = 0.51
A) -2.97 B) -1.82 C) -2.12 D) -2.32
Page 152
Copyright © 2012 Pearson Education, Inc.

13) Suppose you want to test the claim that μ1 ≠ μ2. Two samples are randomly selected from each population.The sample statistics are given below. At a level of significance of α = 0.05, when should you reject H0?
n1 = 50 n2 = 60
x1 = 19 x2 = 17s1 = 1.5 s2 = 1.9
A) Reject H0 if the standardized test statistic is less than -1.96 or greater than 1.96.B) Reject H0 if the standardized test statistic is less than -2.33 or greater than 2.33.C) Reject H0 if the standardized test statistic is less than -1.645 or greater than 1.645.D) Reject H0 if the standardized test statistic is less than -2.575 or greater than 2.575.
14) Suppose you want to test the claim that μ1 = μ2. Two samples are randomly selected from each population. If ahypothesis test is performed, how should you interpret a decision that rejects the null hypothesis?
A) There is sufficient evidence to reject the claim μ1 = μ2.B) There is not sufficient evidence to reject the claim μ1 = μ2.C) There is sufficient evidence to support the claim μ1 = μ2.D) There is not sufficient evidence to support the claim μ1 = μ2.
SHORT ANSWER. Write the word or phrase that best completes each statement or answers the question.
15) Test the claim that μ1 = μ2. Two samples are randomly selected from each population. The sample statistics aregiven below. Use α = 0.05.
n1 = 50 n2 = 60
x1 = 31 x2 = 29s1 = 1.5 s2 = 1.9
MULTIPLE CHOICE. Choose the one alternative that best completes the statement or answers the question.
16) Suppose you want to test the claim that μ1 > μ2. Two samples are randomly selected from each population.The sample statistics are given below. At a level of significance of α = 0.01, when should you reject H0?
n1 = 100 n2 = 125
x1 = 690 x2 = 675s1 = 45 s2 = 25
A) Reject H0 if the standardized test statistic is greater than 2.33.B) Reject H0 if the standardized test statistic is greater than 1.96.C) Reject H0 if the standardized test statistic is greater than 1.645.D) Reject H0 if the standardized test statistic is greater than 2.575.
17) Suppose you want to test the claim that μ1 > μ2. Two samples are randomly selected from each population. If ahypothesis test is performed, how should you interpret a decision that rejects the null hypothesis?
A) There is sufficient evidence to support the claim μ1 > μ2.B) There is sufficient evidence to reject the claim μ1 > μ2.C) There is not sufficient evidence to reject the claim μ1 > μ2.D) There is not sufficient evidence to support the claim μ1 > μ2.
Page 153
Copyright © 2012 Pearson Education, Inc.
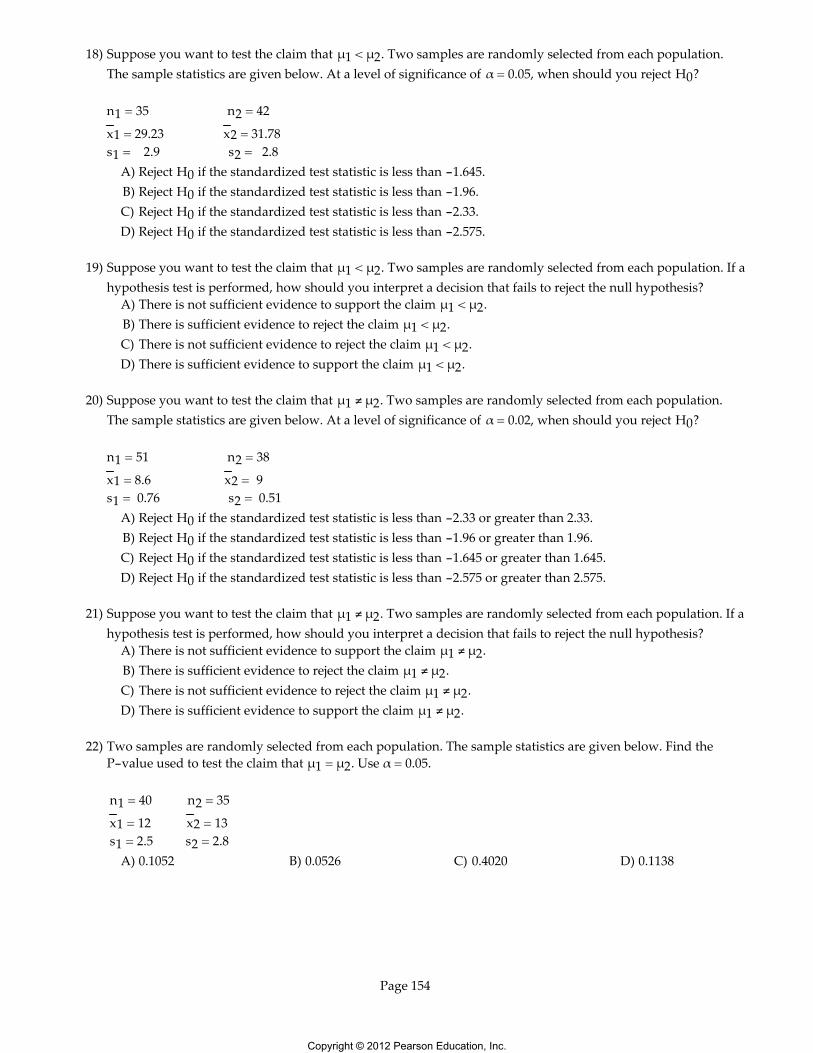
18) Suppose you want to test the claim that μ1 < μ2. Two samples are randomly selected from each population.The sample statistics are given below. At a level of significance of α = 0.05, when should you reject H0?
n1 = 35 n2 = 42
x1 = 29.23 x2 = 31.78s1 = 2.9 s2 = 2.8
A) Reject H0 if the standardized test statistic is less than -1.645.B) Reject H0 if the standardized test statistic is less than -1.96.C) Reject H0 if the standardized test statistic is less than -2.33.D) Reject H0 if the standardized test statistic is less than -2.575.
19) Suppose you want to test the claim that μ1 < μ2. Two samples are randomly selected from each population. If ahypothesis test is performed, how should you interpret a decision that fails to reject the null hypothesis?
A) There is not sufficient evidence to support the claim μ1 < μ2.B) There is sufficient evidence to reject the claim μ1 < μ2.C) There is not sufficient evidence to reject the claim μ1 < μ2.D) There is sufficient evidence to support the claim μ1 < μ2.
20) Suppose you want to test the claim that μ1 ≠ μ2. Two samples are randomly selected from each population.The sample statistics are given below. At a level of significance of α = 0.02, when should you reject H0?
n1 = 51 n2 = 38
x1 = 8.6 x2 = 9s1 = 0.76 s2 = 0.51
A) Reject H0 if the standardized test statistic is less than -2.33 or greater than 2.33.B) Reject H0 if the standardized test statistic is less than -1.96 or greater than 1.96.C) Reject H0 if the standardized test statistic is less than -1.645 or greater than 1.645.D) Reject H0 if the standardized test statistic is less than -2.575 or greater than 2.575.
21) Suppose you want to test the claim that μ1 ≠ μ2. Two samples are randomly selected from each population. If ahypothesis test is performed, how should you interpret a decision that fails to reject the null hypothesis?
A) There is not sufficient evidence to support the claim μ1 ≠ μ2.B) There is sufficient evidence to reject the claim μ1 ≠ μ2.C) There is not sufficient evidence to reject the claim μ1 ≠ μ2.D) There is sufficient evidence to support the claim μ1 ≠ μ2.
22) Two samples are randomly selected from each population. The sample statistics are given below. Find theP-value used to test the claim that μ1 = μ2. Use α = 0.05.
n1 = 40 n2 = 35
x1 = 12 x2 = 13 s1 = 2.5 s2 = 2.8
A) 0.1052 B) 0.0526 C) 0.4020 D) 0.1138
Page 154
Copyright © 2012 Pearson Education, Inc.

23) Two samples are randomly selected from each population. The sample statistics are given below. Find theP-value used to test the claim that μ1 > μ2. Use α = 0.05.
n1 = 100 n2 = 125
x1 = 615 x2 = 600 s1 = 40 s2 = 24
A) 0.0005 B) 0.0505 C) 0.1015 D) 0.5105
SHORT ANSWER. Write the word or phrase that best completes each statement or answers the question.
24) Test the claim that μ1 > μ2. Two samples are randomly selected from each population. The sample statistics aregiven below. Use α = 0.01.
n1 = 100 n2 = 125
x1 = 455 x2 = 440s1 = 45 s2 = 25
25) Test the claim that μ1 < μ2. Two samples are randomly selected from each population. The sample statistics aregiven below. Use α = 0.05.
n1 = 35 n2 = 42
x1 = 25.79 x2 = 28.34s1 = 2.9 s2 = 2.8
26) Test the claim that μ1 ≠ μ2. Two samples are randomly selected from each population. The sample statistics aregiven below. Use α = 0.02.
n1 = 51 n2 = 38
x1 = 7.9 x2 = 8.3s1 = 0.76 s2 = 0.51
27) A study was conducted to determine if the salaries of elementary school teachers from two neighboring stateswere equal. A sample of 100 teachers from each state was randomly selected. The mean from the first state was$28,700 with a standard deviation of $2300. The mean from the second state was $30,100 with a standarddeviation of $2100. Test the claim that the salaries from both states are equal. Use α = 0.05.
28) At a local college, 65 female students were randomly selected and it was found that their mean monthly incomewas $609 with a standard deviation of $121.50. Seventy-five male students were also randomly selected andtheir mean monthly income was found to be $651 with a standard deviation of $168.70. Test the claim that malestudents have a higher monthly income than female students. Use α = 0.01.
29) A medical researcher suspects that the pulse rate of smokers is higher than the pulse rate of non-smokers. Usethe sample statistics below to test the researcherʹs suspicion. Use α = 0.05.
Smokers Nonsmokers n1 = 100 n2 = 100
x1 = 86 x2 = 83 s1 = 4.8 s2 = 5.3
Page 155
Copyright © 2012 Pearson Education, Inc.
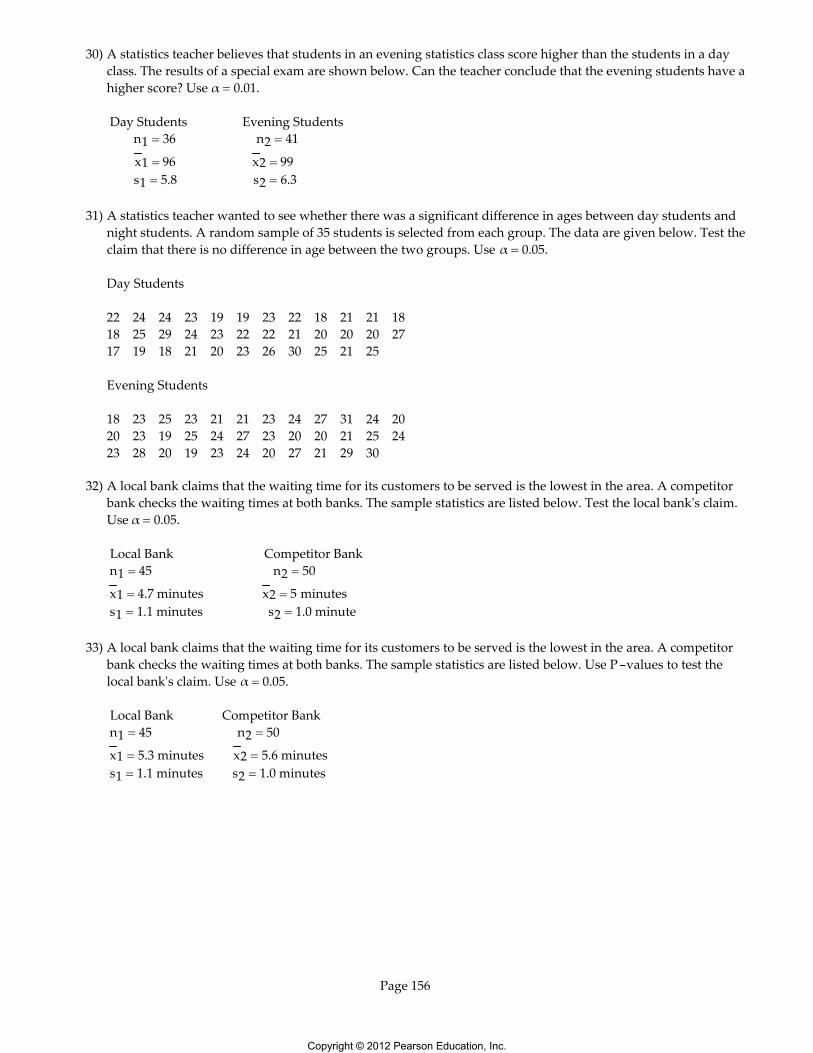
30) A statistics teacher believes that students in an evening statistics class score higher than the students in a dayclass. The results of a special exam are shown below. Can the teacher conclude that the evening students have ahigher score? Use α = 0.01.
Day Students Evening Students n1 = 36 n2 = 41
x1 = 96 x2 = 99 s1 = 5.8 s2 = 6.3
31) A statistics teacher wanted to see whether there was a significant difference in ages between day students andnight students. A random sample of 35 students is selected from each group. The data are given below. Test theclaim that there is no difference in age between the two groups. Use α = 0.05.
Day Students
22 24 24 23 19 19 23 22 18 21 21 1818 25 29 24 23 22 22 21 20 20 20 2717 19 18 21 20 23 26 30 25 21 25
Evening Students
18 23 25 23 21 21 23 24 27 31 24 2020 23 19 25 24 27 23 20 20 21 25 2423 28 20 19 23 24 20 27 21 29 30
32) A local bank claims that the waiting time for its customers to be served is the lowest in the area. A competitorbank checks the waiting times at both banks. The sample statistics are listed below. Test the local bankʹs claim.Use α = 0.05.
Local Bank Competitor Bank n1 = 45 n2 = 50
x1 = 4.7 minutes x2 = 5 minutes s1 = 1.1 minutes s2 = 1.0 minute
33) A local bank claims that the waiting time for its customers to be served is the lowest in the area. A competitorbank checks the waiting times at both banks. The sample statistics are listed below. Use P-values to test thelocal bankʹs claim. Use α = 0.05.
Local Bank Competitor Bank n1 = 45 n2 = 50
x1 = 5.3 minutes x2 = 5.6 minutes s1 = 1.1 minutes s2 = 1.0 minutes
Page 156
Copyright © 2012 Pearson Education, Inc.

34) A financial advisor wants to know whether there is a significant difference between the NYSE and NASDAQmarkets in the annual dividend rates for preferred stocks. A random sample of 30 returns is selected from eachmarket. The data are given below. Test the claim that there is no difference in the annual dividend rates for thetwo markets. Use α = 0.05.
NASDAQ2.00 1.02 2.11 2.56 2.15 0.93 0.91 1.67 1.88 2.132.44 1.97 2.00 1.81 2.25 1.72 1.75 1.05 0.90 2.340.51 1.00 2.25 0.85 1.50 2.33 1.59 2.25 0.23 1.63
NYSE1.46 3.00 1.74 5.19 1.69 1.88 2.85 2.00 2.19 2.031.81 5.00 1.72 3.38 2.09 4.50 3.07 1.97 1.78 1.501.97 4.65 3.12 2.19 2.19 3.50 1.56 4.10 3.00 4.40
35) A recent study of 100 elementary school teachers in a southern state found that their mean salary was $23,400with a standard deviation of $2100. A similar study of 100 elementary school teachers in a western state foundthat their mean salary was $33,800 with a standard deviation of $3200. Test the claim that the salaries ofelementary school teachers in the western state is more than $10,000 greater than that of elementary teachers inthe southern state. Use α = 0.05.
36) At α = 0.05, test a financial advisorʹs claim that the difference between the mean dividend rate for listings in theNYSE market and the mean dividend rate for listings in the NASDAQ market is more than 0.75. The samplestatistics from randomly selected listings from each market are listed below.
NYSE NASDAQn1 = 30 n2 = 50x1 = 2.75% x2 = 1.66%s1 = 1.14% s2 = 0.63%
37) Two groups of patients with colorectal cancer are treated with a different drug to reduce pain. A randomsample of 140 patients are treated using the drug Irinotican and a random sample of 127 patients are treatedusing the drug Fluorouracil. The sample statistics are listed below. At α = 0.01, test a pharmaceuticalrepresentativeʹs claim that the difference between the mean number of pain-free months for patients usingFluorouracil and the mean number of pain-free months for patients using Irinotican is less than two months.
Fluorouracil Irinoticann1 = 127 n2 =140x1 = 8.5 months x2 = 10.3 monthss1 = 1.5 months s2 = 1.2 months
Page 157
Copyright © 2012 Pearson Education, Inc.

3 Construct a Confidence Interval for the Difference Between Two Population Means
SHORT ANSWER. Write the word or phrase that best completes each statement or answers the question.
Provide an appropriate response.38) A local bank claims that the waiting time for its customers to be served is the lowest in the area. A competitor
bank checks the waiting times at both banks. The sample statistics are listed below. Use α = 0.05 and aconfidence interval to test the local bankʹs claim.
Local Bank Competitor Bankn1 = 45 n2 = 50x1 = 5.3 minutes x2 = 5.6 minutess1 = 1.1 minutes s2 = 1.0 minute
MULTIPLE CHOICE. Choose the one alternative that best completes the statement or answers the question.
39) Construct a 95% confidence interval for μ1 - μ2. Two samples are randomly selected from each population.The sample statistics are given below.
n1 = 50 n2 = 60
x1 = 25 x2 = 23 s1 = 1.5 s2 = 1.9
A) (1.364, 2.636) B) (1.572, 2.987) C) (1.723, 3.012) D) (1.919, 3.142)
40) Construct a 95% confidence interval for μ1 - μ2. Two samples are randomly selected from each population.The sample statistics are given below.
n1 = 40 n2 = 35
x1 = 12 x2 = 13 s1 = 2.5 s2 = 2.8
A) (-2.209, 0.209) B) (-2.001, -1.873) C) (-1.968, 1.561) D) (-1.673, 1.892)
41) For which confidence interval for the difference in the means μ1 - μ2, would you reject the null hypothesis?A) (-2.001, -1.873) B) (-1.968, 1.561) C) (-1.673, 1.892) D) (-2.209, 0.209)
SHORT ANSWER. Write the word or phrase that best completes each statement or answers the question.
42) A researcher wishes to determine whether people with high blood pressure can lower their blood pressure byfollowing a certain diet. A treatment group and a control group are selected. The sample statistics are givenbelow. Construct a 90% confidence interval for the difference between the two population means, μ1 - μ2.Would you recommend using this diet plan? Explain your reasoning.
Treatment Group Control Group n1 = 100 n2 = 100
x1 = 178 x2 = 193 s1 = 35 s2 = 37
Page 158
Copyright © 2012 Pearson Education, Inc.
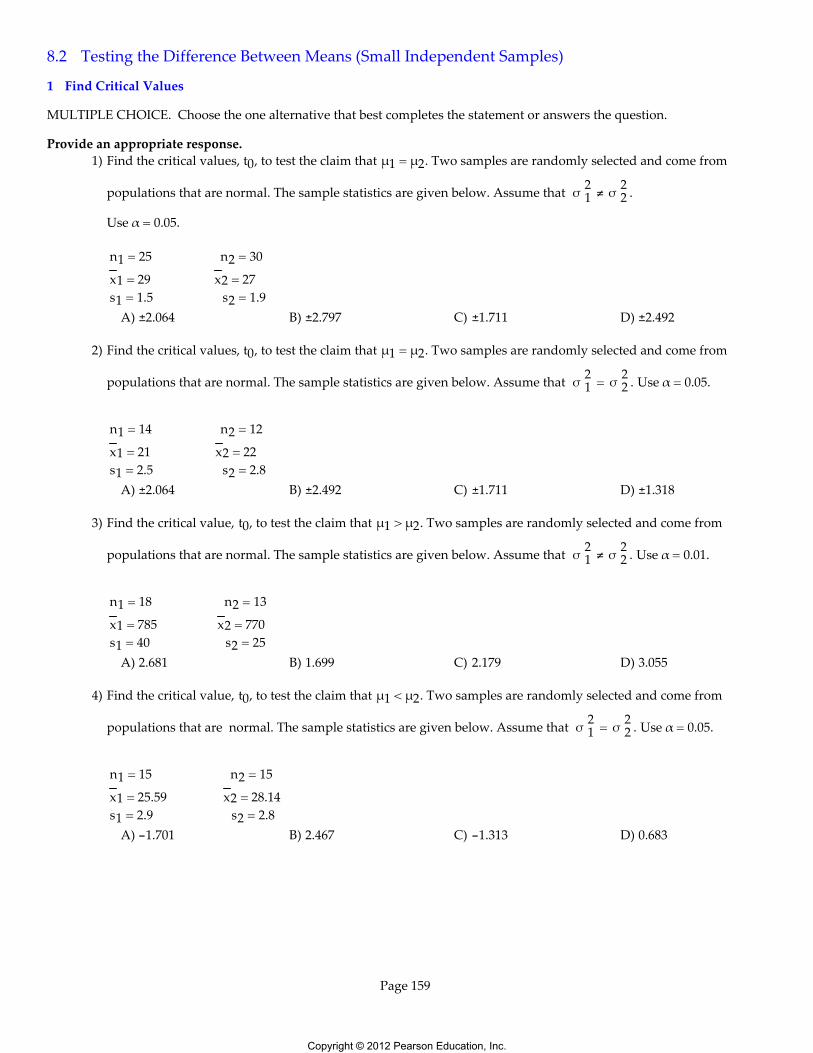
8.2 Testing the Difference Between Means (Small Independent Samples)
1 Find Critical Values
MULTIPLE CHOICE. Choose the one alternative that best completes the statement or answers the question.
Provide an appropriate response.1) Find the critical values, t0, to test the claim that μ1 = μ2. Two samples are randomly selected and come from
populations that are normal. The sample statistics are given below. Assume that σ 21 ≠ σ
22 .
Use α = 0.05.
n1 = 25 n2 = 30
x1 = 29 x2 = 27 s1 = 1.5 s2 = 1.9
A) ±2.064 B) ±2.797 C) ±1.711 D) ±2.492
2) Find the critical values, t0, to test the claim that μ1 = μ2. Two samples are randomly selected and come from
populations that are normal. The sample statistics are given below. Assume that σ 21 = σ
22 . Use α = 0.05.
n1 = 14 n2 = 12
x1 = 21 x2 = 22 s1 = 2.5 s2 = 2.8
A) ±2.064 B) ±2.492 C) ±1.711 D) ±1.318
3) Find the critical value, t0, to test the claim that μ1 > μ2. Two samples are randomly selected and come from
populations that are normal. The sample statistics are given below. Assume that σ 21 ≠ σ
22 . Use α = 0.01.
n1 = 18 n2 = 13
x1 = 785 x2 = 770 s1 = 40 s2 = 25
A) 2.681 B) 1.699 C) 2.179 D) 3.055
4) Find the critical value, t0, to test the claim that μ1 < μ2. Two samples are randomly selected and come from
populations that are normal. The sample statistics are given below. Assume that σ 21 = σ
22 . Use α = 0.05.
n1 = 15 n2 = 15
x1 = 25.59 x2 = 28.14 s1 = 2.9 s2 = 2.8
A) -1.701 B) 2.467 C) -1.313 D) 0.683
Page 159
Copyright © 2012 Pearson Education, Inc.
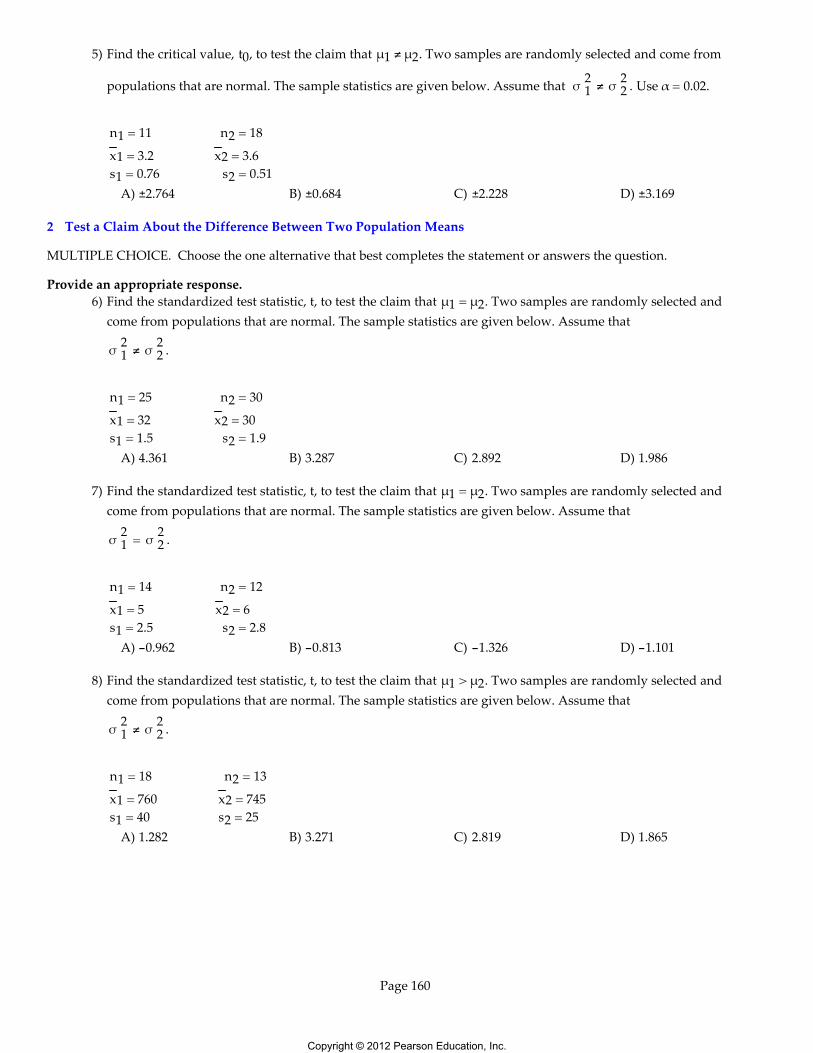
5) Find the critical value, t0, to test the claim that μ1 ≠ μ2. Two samples are randomly selected and come from
populations that are normal. The sample statistics are given below. Assume that σ 21 ≠ σ
22 . Use α = 0.02.
n1 = 11 n2 = 18
x1 = 3.2 x2 = 3.6 s1 = 0.76 s2 = 0.51
A) ±2.764 B) ±0.684 C) ±2.228 D) ±3.169
2 Test a Claim About the Difference Between Two Population Means
MULTIPLE CHOICE. Choose the one alternative that best completes the statement or answers the question.
Provide an appropriate response.6) Find the standardized test statistic, t, to test the claim that μ1 = μ2. Two samples are randomly selected and
come from populations that are normal. The sample statistics are given below. Assume that
σ 21 ≠ σ
22 .
n1 = 25 n2 = 30
x1 = 32 x2 = 30 s1 = 1.5 s2 = 1.9
A) 4.361 B) 3.287 C) 2.892 D) 1.986
7) Find the standardized test statistic, t, to test the claim that μ1 = μ2. Two samples are randomly selected andcome from populations that are normal. The sample statistics are given below. Assume that
σ 21 = σ
22 .
n1 = 14 n2 = 12
x1 = 5 x2 = 6 s1 = 2.5 s2 = 2.8
A) -0.962 B) -0.813 C) -1.326 D) -1.101
8) Find the standardized test statistic, t, to test the claim that μ1 > μ2. Two samples are randomly selected andcome from populations that are normal. The sample statistics are given below. Assume that
σ 21 ≠ σ
22 .
n1 = 18 n2 = 13
x1 = 760 x2 = 745 s1 = 40 s2 = 25
A) 1.282 B) 3.271 C) 2.819 D) 1.865
Page 160
Copyright © 2012 Pearson Education, Inc.
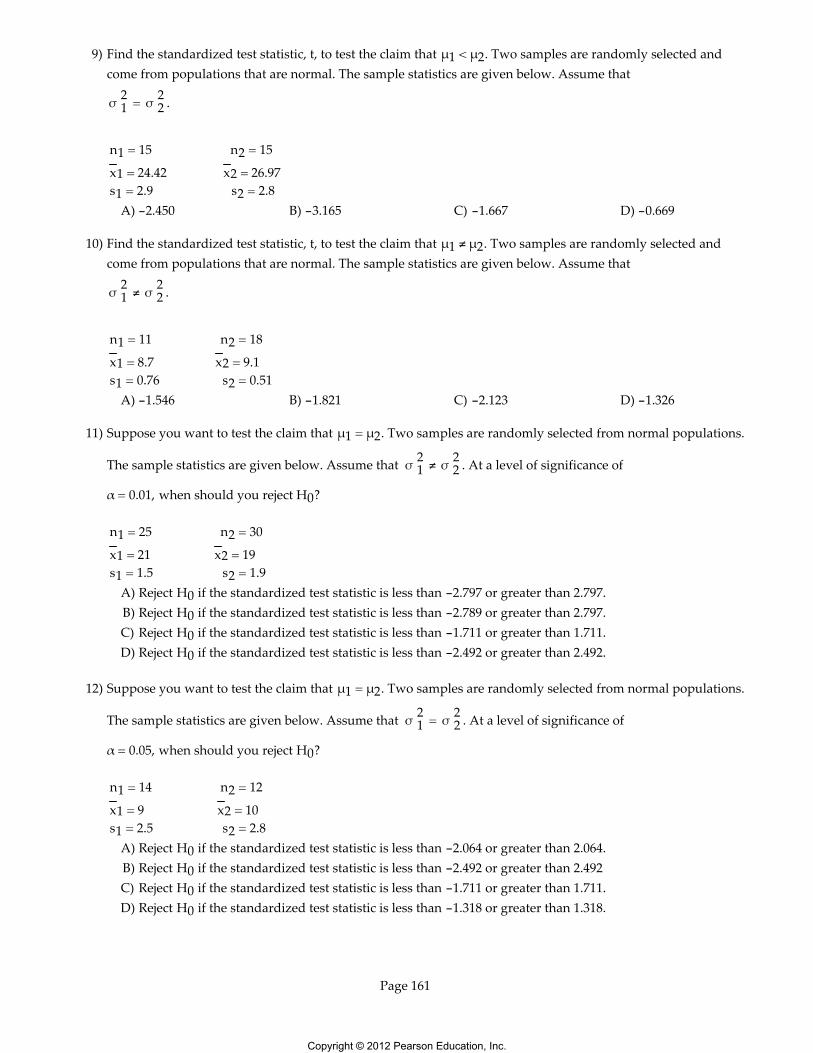
9) Find the standardized test statistic, t, to test the claim that μ1 < μ2. Two samples are randomly selected andcome from populations that are normal. The sample statistics are given below. Assume that
σ 21 = σ
22 .
n1 = 15 n2 = 15
x1 = 24.42 x2 = 26.97 s1 = 2.9 s2 = 2.8
A) -2.450 B) -3.165 C) -1.667 D) -0.669
10) Find the standardized test statistic, t, to test the claim that μ1 ≠ μ2. Two samples are randomly selected andcome from populations that are normal. The sample statistics are given below. Assume that
σ 21 ≠ σ
22 .
n1 = 11 n2 = 18
x1 = 8.7 x2 = 9.1 s1 = 0.76 s2 = 0.51
A) -1.546 B) -1.821 C) -2.123 D) -1.326
11) Suppose you want to test the claim that μ1 = μ2. Two samples are randomly selected from normal populations.
The sample statistics are given below. Assume that σ 21 ≠ σ
22 . At a level of significance of
α = 0.01, when should you reject H0?
n1 = 25 n2 = 30
x1 = 21 x2 = 19 s1 = 1.5 s2 = 1.9
A) Reject H0 if the standardized test statistic is less than -2.797 or greater than 2.797.B) Reject H0 if the standardized test statistic is less than -2.789 or greater than 2.797.C) Reject H0 if the standardized test statistic is less than -1.711 or greater than 1.711.D) Reject H0 if the standardized test statistic is less than -2.492 or greater than 2.492.
12) Suppose you want to test the claim that μ1 = μ2. Two samples are randomly selected from normal populations.
The sample statistics are given below. Assume that σ 21 = σ
22 . At a level of significance of
α = 0.05, when should you reject H0?
n1 = 14 n2 = 12
x1 = 9 x2 = 10 s1 = 2.5 s2 = 2.8
A) Reject H0 if the standardized test statistic is less than -2.064 or greater than 2.064.B) Reject H0 if the standardized test statistic is less than -2.492 or greater than 2.492C) Reject H0 if the standardized test statistic is less than -1.711 or greater than 1.711.D) Reject H0 if the standardized test statistic is less than -1.318 or greater than 1.318.
Page 161
Copyright © 2012 Pearson Education, Inc.
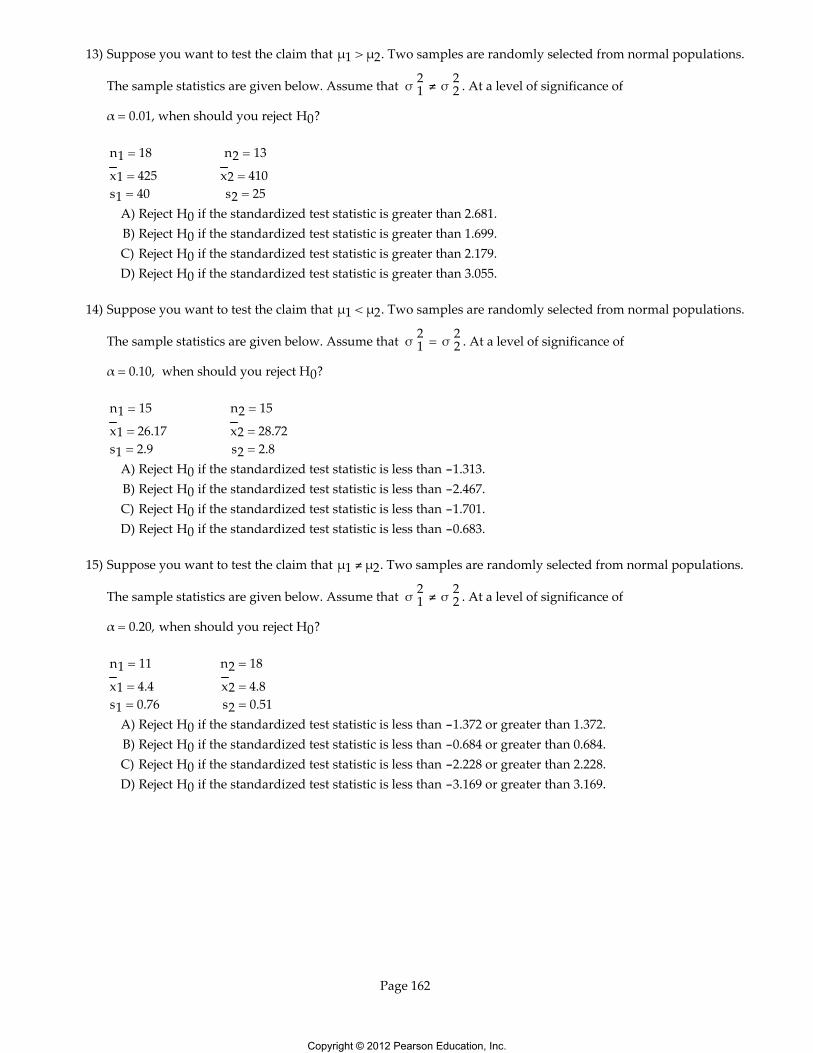
13) Suppose you want to test the claim that μ1 > μ2. Two samples are randomly selected from normal populations.
The sample statistics are given below. Assume that σ 21 ≠ σ
22 . At a level of significance of
α = 0.01, when should you reject H0?
n1 = 18 n2 = 13
x1 = 425 x2 = 410 s1 = 40 s2 = 25
A) Reject H0 if the standardized test statistic is greater than 2.681.B) Reject H0 if the standardized test statistic is greater than 1.699.C) Reject H0 if the standardized test statistic is greater than 2.179.D) Reject H0 if the standardized test statistic is greater than 3.055.
14) Suppose you want to test the claim that μ1 < μ2. Two samples are randomly selected from normal populations.
The sample statistics are given below. Assume that σ 21 = σ
22 . At a level of significance of
α = 0.10, when should you reject H0?
n1 = 15 n2 = 15
x1 = 26.17 x2 = 28.72 s1 = 2.9 s2 = 2.8
A) Reject H0 if the standardized test statistic is less than -1.313.B) Reject H0 if the standardized test statistic is less than -2.467.C) Reject H0 if the standardized test statistic is less than -1.701.D) Reject H0 if the standardized test statistic is less than -0.683.
15) Suppose you want to test the claim that μ1 ≠ μ2. Two samples are randomly selected from normal populations.
The sample statistics are given below. Assume that σ 21 ≠ σ
22 . At a level of significance of
α = 0.20, when should you reject H0?
n1 = 11 n2 = 18
x1 = 4.4 x2 = 4.8 s1 = 0.76 s2 = 0.51
A) Reject H0 if the standardized test statistic is less than -1.372 or greater than 1.372.B) Reject H0 if the standardized test statistic is less than -0.684 or greater than 0.684.C) Reject H0 if the standardized test statistic is less than -2.228 or greater than 2.228.D) Reject H0 if the standardized test statistic is less than -3.169 or greater than 3.169.
Page 162
Copyright © 2012 Pearson Education, Inc.
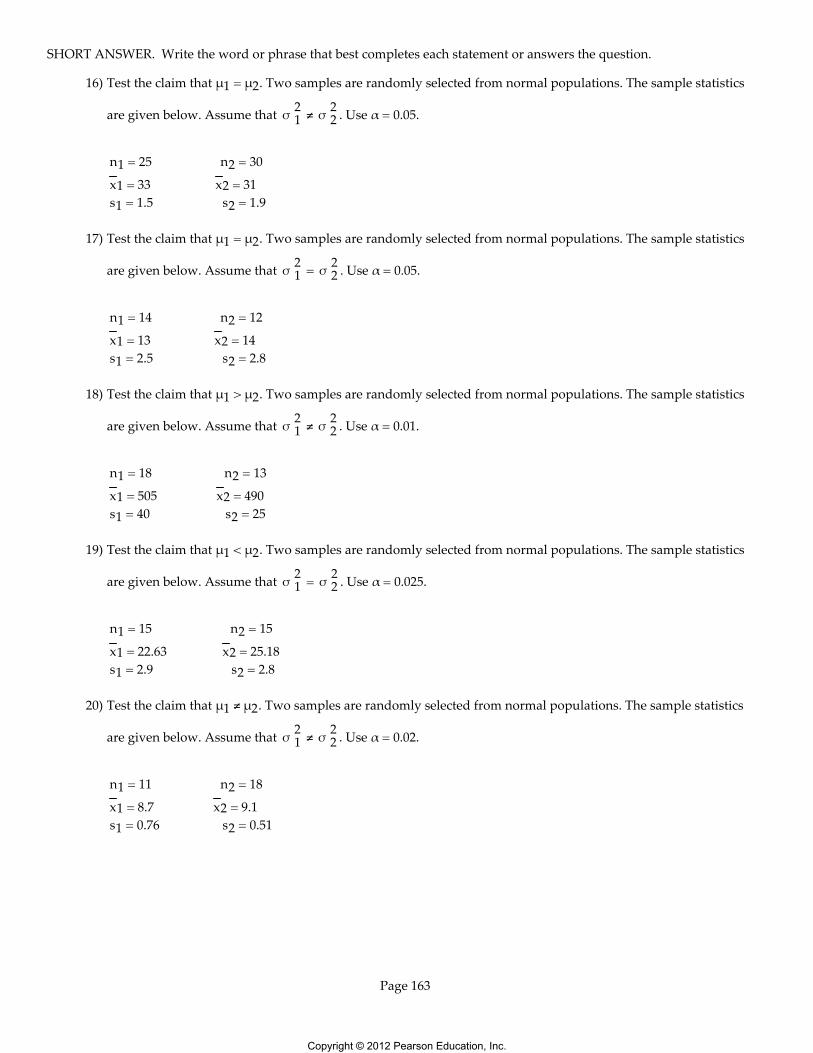
SHORT ANSWER. Write the word or phrase that best completes each statement or answers the question.
16) Test the claim that μ1 = μ2. Two samples are randomly selected from normal populations. The sample statistics
are given below. Assume that σ 21 ≠ σ
22 . Use α = 0.05.
n1 = 25 n2 = 30
x1 = 33 x2 = 31 s1 = 1.5 s2 = 1.9
17) Test the claim that μ1 = μ2. Two samples are randomly selected from normal populations. The sample statistics
are given below. Assume that σ 21 = σ
22 . Use α = 0.05.
n1 = 14 n2 = 12
x1 = 13 x2 = 14 s1 = 2.5 s2 = 2.8
18) Test the claim that μ1 > μ2. Two samples are randomly selected from normal populations. The sample statistics
are given below. Assume that σ 21 ≠ σ
22 . Use α = 0.01.
n1 = 18 n2 = 13
x1 = 505 x2 = 490 s1 = 40 s2 = 25
19) Test the claim that μ1 < μ2. Two samples are randomly selected from normal populations. The sample statistics
are given below. Assume that σ 21 = σ
22 . Use α = 0.025.
n1 = 15 n2 = 15
x1 = 22.63 x2 = 25.18 s1 = 2.9 s2 = 2.8
20) Test the claim that μ1 ≠ μ2. Two samples are randomly selected from normal populations. The sample statistics
are given below. Assume that σ 21 ≠ σ
22 . Use α = 0.02.
n1 = 11 n2 = 18
x1 = 8.7 x2 = 9.1 s1 = 0.76 s2 = 0.51
Page 163
Copyright © 2012 Pearson Education, Inc.
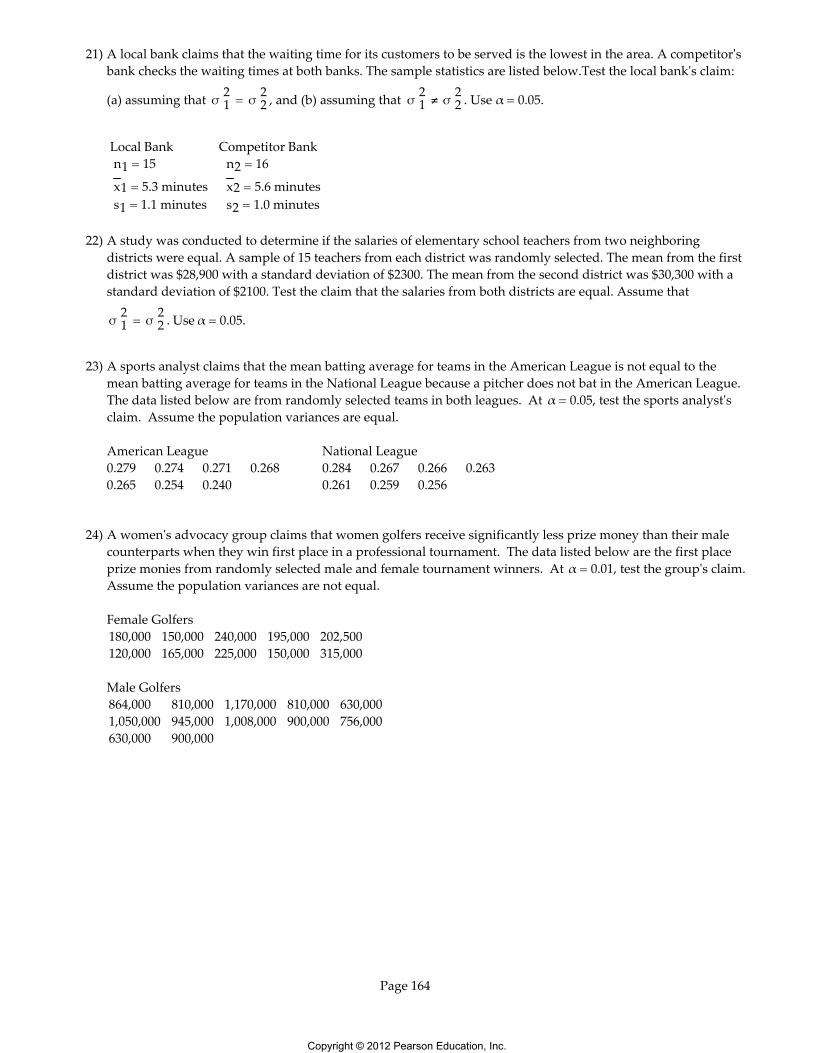
21) A local bank claims that the waiting time for its customers to be served is the lowest in the area. A competitorʹsbank checks the waiting times at both banks. The sample statistics are listed below.Test the local bankʹs claim:
(a) assuming that σ 21 = σ
22 , and (b) assuming that σ 2
1 ≠ σ22 . Use α = 0.05.
Local Bank Competitor Bank n1 = 15 n2 = 16
x1 = 5.3 minutes x2 = 5.6 minutes s1 = 1.1 minutes s2 = 1.0 minutes
22) A study was conducted to determine if the salaries of elementary school teachers from two neighboringdistricts were equal. A sample of 15 teachers from each district was randomly selected. The mean from the firstdistrict was $28,900 with a standard deviation of $2300. The mean from the second district was $30,300 with astandard deviation of $2100. Test the claim that the salaries from both districts are equal. Assume that
σ 21 = σ
22 . Use α = 0.05.
23) A sports analyst claims that the mean batting average for teams in the American League is not equal to themean batting average for teams in the National League because a pitcher does not bat in the American League.The data listed below are from randomly selected teams in both leagues. At α = 0.05, test the sports analystʹsclaim. Assume the population variances are equal.
American League National League0.279 0.274 0.271 0.268 0.284 0.267 0.266 0.2630.265 0.254 0.240 0.261 0.259 0.256
24) A womenʹs advocacy group claims that women golfers receive significantly less prize money than their malecounterparts when they win first place in a professional tournament. The data listed below are the first placeprize monies from randomly selected male and female tournament winners. At α = 0.01, test the groupʹs claim.Assume the population variances are not equal.
Female Golfers180,000 150,000 240,000 195,000 202,500120,000 165,000 225,000 150,000 315,000
Male Golfers864,000 810,000 1,170,000 810,000 630,0001,050,000 945,000 1,008,000 900,000 756,000630,000 900,000
Page 164
Copyright © 2012 Pearson Education, Inc.
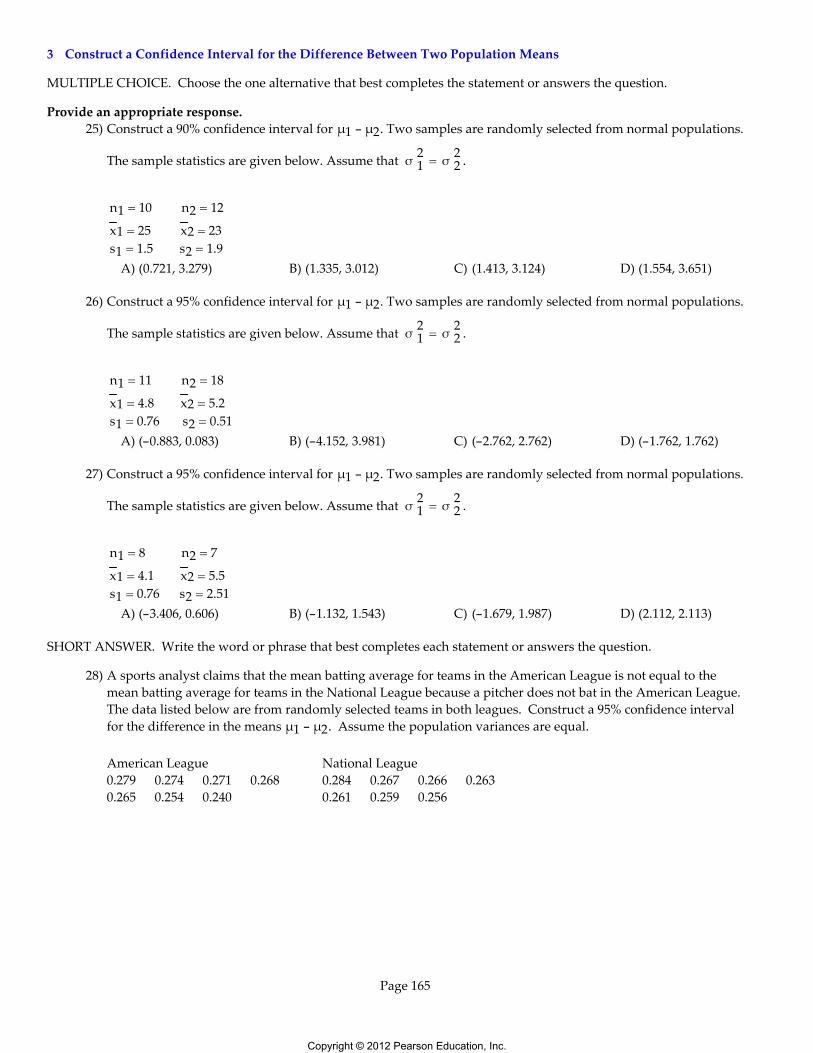
3 Construct a Confidence Interval for the Difference Between Two Population Means
MULTIPLE CHOICE. Choose the one alternative that best completes the statement or answers the question.
Provide an appropriate response.25) Construct a 90% confidence interval for μ1 - μ2. Two samples are randomly selected from normal populations.
The sample statistics are given below. Assume that σ 21 = σ
22 .
n1 = 10 n2 = 12
x1 = 25 x2 = 23 s1 = 1.5 s2 = 1.9
A) (0.721, 3.279) B) (1.335, 3.012) C) (1.413, 3.124) D) (1.554, 3.651)
26) Construct a 95% confidence interval for μ1 - μ2. Two samples are randomly selected from normal populations.
The sample statistics are given below. Assume that σ 21 = σ
22 .
n1 = 11 n2 = 18
x1 = 4.8 x2 = 5.2 s1 = 0.76 s2 = 0.51
A) (-0.883, 0.083) B) (-4.152, 3.981) C) (-2.762, 2.762) D) (-1.762, 1.762)
27) Construct a 95% confidence interval for μ1 - μ2. Two samples are randomly selected from normal populations.
The sample statistics are given below. Assume that σ 21 = σ
22 .
n1 = 8 n2 = 7
x1 = 4.1 x2 = 5.5 s1 = 0.76 s2 = 2.51
A) (-3.406, 0.606) B) (-1.132, 1.543) C) (-1.679, 1.987) D) (2.112, 2.113)
SHORT ANSWER. Write the word or phrase that best completes each statement or answers the question.
28) A sports analyst claims that the mean batting average for teams in the American League is not equal to themean batting average for teams in the National League because a pitcher does not bat in the American League.The data listed below are from randomly selected teams in both leagues. Construct a 95% confidence intervalfor the difference in the means μ1 - μ2. Assume the population variances are equal.
American League National League0.279 0.274 0.271 0.268 0.284 0.267 0.266 0.2630.265 0.254 0.240 0.261 0.259 0.256
Page 165
Copyright © 2012 Pearson Education, Inc.

29) A womenʹs advocacy group claims that women golfers receive significantly less prize money than their malecounterparts when they win first place in a professional tournament. The data listed below are the first placeprize monies from randomly selected male and female tournament winners. Construct a 99% confidenceinterval for the difference in the means μ1 - μ2. Assume the population variances are not equal.
Female Golfers180,000 150,000 240,000 195,000 202,500120,000 165,000 225,000 150,000 315,000
Male Golfers864,000 810,000 1,170,000 810,000 630,0001,050,000 945,000 1,008,000 900,000 756,000630,000 900,000
MULTIPLE CHOICE. Choose the one alternative that best completes the statement or answers the question.
30) A study was conducted to determine if the salaries of elementary school teachers from two neighboringdistricts were equal. A sample of 15 teachers from each district was randomly selected. The mean from the firstdistrict was $28,900 with a standard deviation of $2300. The mean from the second district was $30,300 with a
standard deviation of $2100. Construct a 95% confidence interval for μ1 - μ2. Assume that σ 21 = σ
22 .
A) (-3047, 247) B) (-2054, 238) C) (-2871, 567) D) (-4081, 597)
8.3 Testing the Difference Between Means (Dependent Samples)
1 Test a Claim About the Difference Between Two Population Means
MULTIPLE CHOICE. Choose the one alternative that best completes the statement or answers the question.
Provide an appropriate response.1) Data sets A and B are dependent. Find d.
A 36 34 53 49 37 B 34 30 31 41 28A) 9.0 B) -5.1 C) 33.1 D) 25.2
2) Data sets A and B are dependent. Find d.
A 2.1 3.1 5.0 2.0 2.1 B 4.5 3.4 3.3 3.2 4.6A) -0.94 B) -0.76 C) 0.58 D) 0.89
3) Data sets A and B are dependent. Find sd.
A 40 38 57 53 41 B 38 34 35 45 32A) 7.8 B) 5.6 C) 6.8 D) 8.9
Page 166
Copyright © 2012 Pearson Education, Inc.
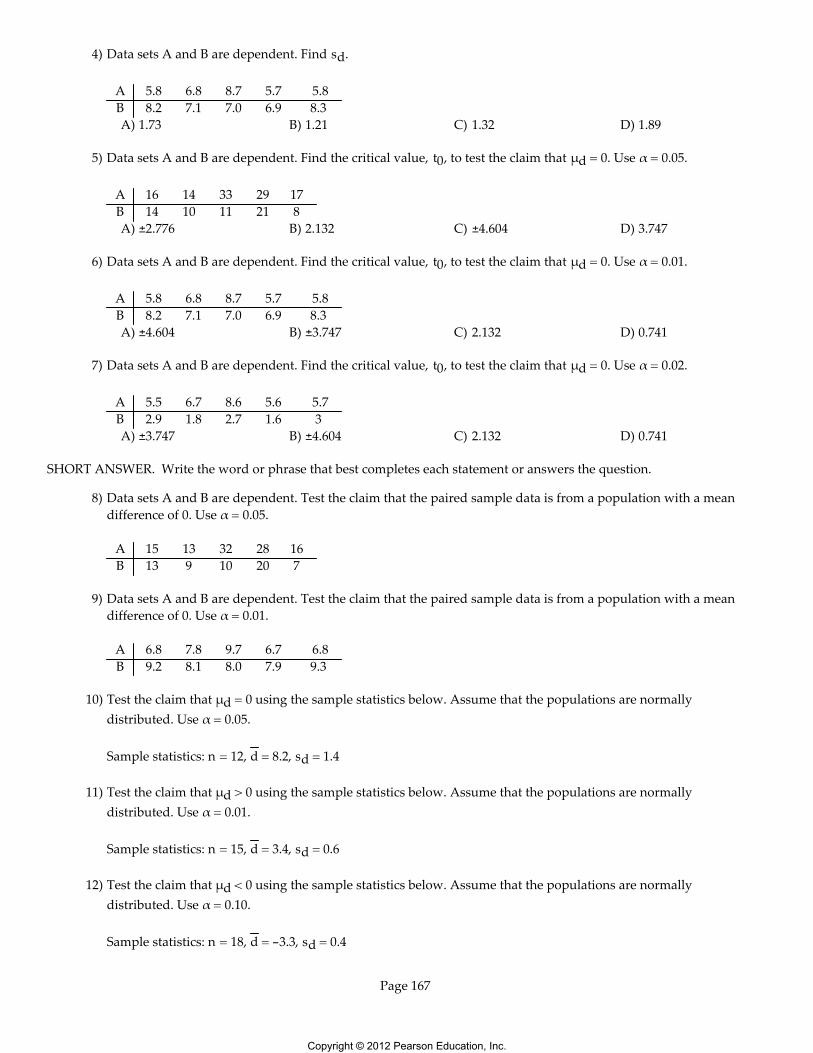
4) Data sets A and B are dependent. Find sd.
A 5.8 6.8 8.7 5.7 5.8 B 8.2 7.1 7.0 6.9 8.3A) 1.73 B) 1.21 C) 1.32 D) 1.89
5) Data sets A and B are dependent. Find the critical value, t0, to test the claim that μd = 0. Use α = 0.05.
A 16 14 33 29 17 B 14 10 11 21 8A) ±2.776 B) 2.132 C) ±4.604 D) 3.747
6) Data sets A and B are dependent. Find the critical value, t0, to test the claim that μd = 0. Use α = 0.01.
A 5.8 6.8 8.7 5.7 5.8 B 8.2 7.1 7.0 6.9 8.3A) ±4.604 B) ±3.747 C) 2.132 D) 0.741
7) Data sets A and B are dependent. Find the critical value, t0, to test the claim that μd = 0. Use α = 0.02.
A 5.5 6.7 8.6 5.6 5.7 B 2.9 1.8 2.7 1.6 3A) ±3.747 B) ±4.604 C) 2.132 D) 0.741
SHORT ANSWER. Write the word or phrase that best completes each statement or answers the question.
8) Data sets A and B are dependent. Test the claim that the paired sample data is from a population with a meandifference of 0. Use α = 0.05.
A 15 13 32 28 16 B 13 9 10 20 7
9) Data sets A and B are dependent. Test the claim that the paired sample data is from a population with a meandifference of 0. Use α = 0.01.
A 6.8 7.8 9.7 6.7 6.8 B 9.2 8.1 8.0 7.9 9.3
10) Test the claim that μd = 0 using the sample statistics below. Assume that the populations are normallydistributed. Use α = 0.05.
Sample statistics: n = 12, d = 8.2, sd = 1.4
11) Test the claim that μd > 0 using the sample statistics below. Assume that the populations are normallydistributed. Use α = 0.01.
Sample statistics: n = 15, d = 3.4, sd = 0.6
12) Test the claim that μd < 0 using the sample statistics below. Assume that the populations are normallydistributed. Use α = 0.10.
Sample statistics: n = 18, d = -3.3, sd = 0.4
Page 167
Copyright © 2012 Pearson Education, Inc.
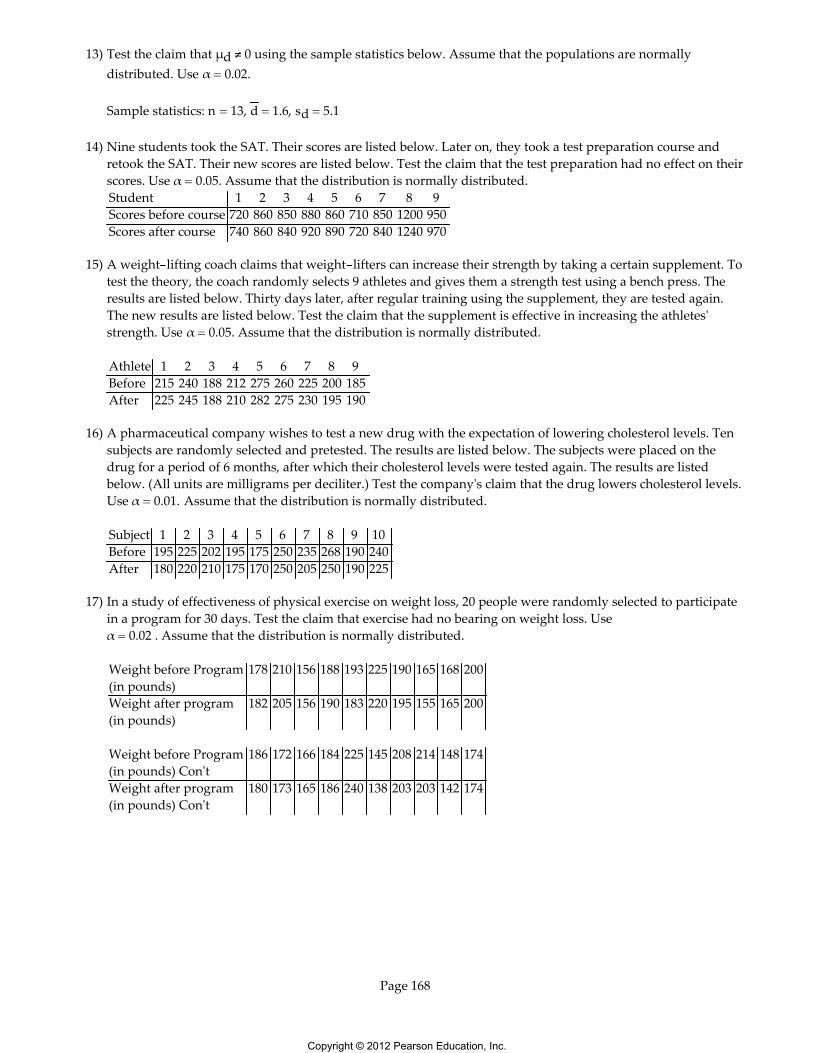
13) Test the claim that μd ≠ 0 using the sample statistics below. Assume that the populations are normallydistributed. Use α = 0.02.
Sample statistics: n = 13, d = 1.6, sd = 5.1
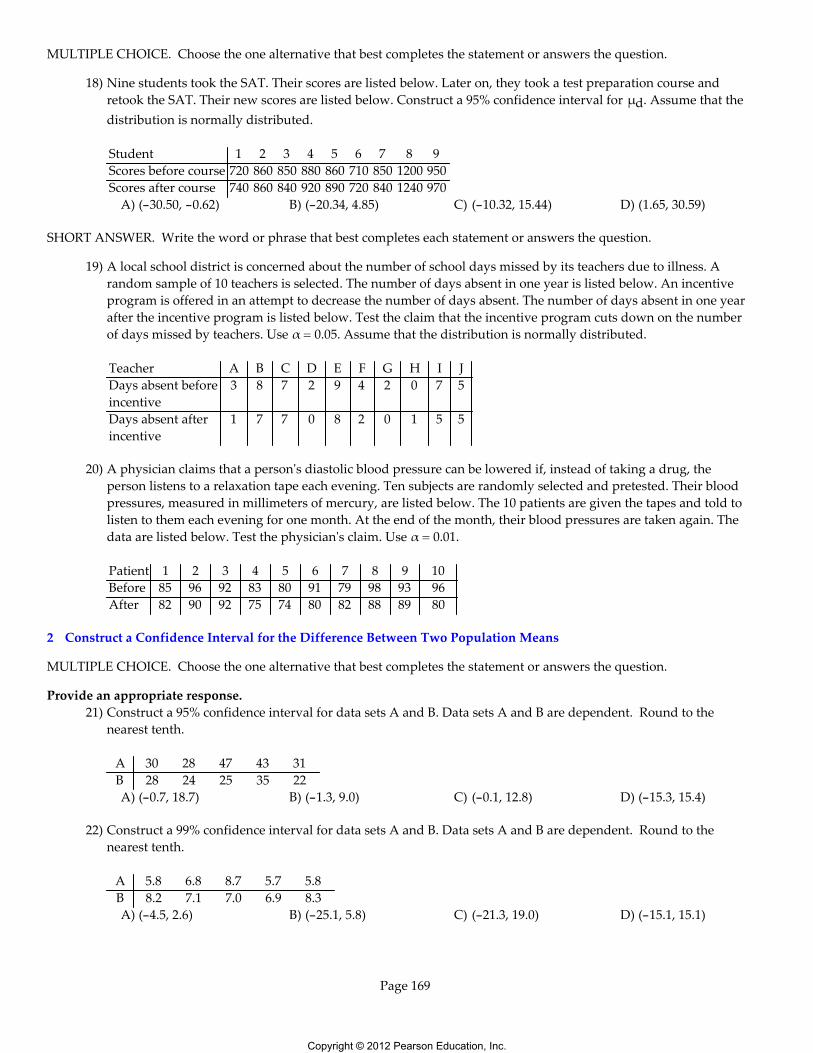
14) Nine students took the SAT. Their scores are listed below. Later on, they took a test preparation course andretook the SAT. Their new scores are listed below. Test the claim that the test preparation had no effect on theirscores. Use α = 0.05. Assume that the distribution is normally distributed.Student 1 2 3 4 5 6 7 8 9Scores before course 720 860 850 880 860 710 850 1200 950Scores after course 740 860 840 920 890 720 840 1240 970
15) A weight-lifting coach claims that weight-lifters can increase their strength by taking a certain supplement. Totest the theory, the coach randomly selects 9 athletes and gives them a strength test using a bench press. Theresults are listed below. Thirty days later, after regular training using the supplement, they are tested again.The new results are listed below. Test the claim that the supplement is effective in increasing the athletesʹstrength. Use α = 0.05. Assume that the distribution is normally distributed.
Athlete 1 2 3 4 5 6 7 8 9Before 215 240 188 212 275 260 225 200 185After 225 245 188 210 282 275 230 195 190
16) A pharmaceutical company wishes to test a new drug with the expectation of lowering cholesterol levels. Tensubjects are randomly selected and pretested. The results are listed below. The subjects were placed on thedrug for a period of 6 months, after which their cholesterol levels were tested again. The results are listedbelow. (All units are milligrams per deciliter.) Test the companyʹs claim that the drug lowers cholesterol levels.Use α = 0.01. Assume that the distribution is normally distributed.
SubjectBeforeAfter
1195180
2225220
3202210
4195175
5175170
6250250
7235205
8268250
9190190
10240225
17) In a study of effectiveness of physical exercise on weight loss, 20 people were randomly selected to participatein a program for 30 days. Test the claim that exercise had no bearing on weight loss. Useα = 0.02 . Assume that the distribution is normally distributed.
Weight before Program(in pounds)Weight after program(in pounds)
178
182
210
205
156
156
188
190
193
183
225
220
190
195
165
155
168
165
200
200
Weight before Program(in pounds) ConʹtWeight after program(in pounds) Conʹt
186
180
172
173
166
165
184
186
225
240
145
138
208
203
214
203
148
142
174
174
Page 168
Copyright © 2012 Pearson Education, Inc.
MULTIPLE CHOICE. Choose the one alternative that best completes the statement or answers the question.
18) Nine students took the SAT. Their scores are listed below. Later on, they took a test preparation course andretook the SAT. Their new scores are listed below. Construct a 95% confidence interval for μd. Assume that thedistribution is normally distributed.
Student 1 2 3 4 5 6 7 8 9Scores before course 720 860 850 880 860 710 850 1200 950Scores after course 740 860 840 920 890 720 840 1240 970A) (-30.50, -0.62) B) (-20.34, 4.85) C) (-10.32, 15.44) D) (1.65, 30.59)
SHORT ANSWER. Write the word or phrase that best completes each statement or answers the question.
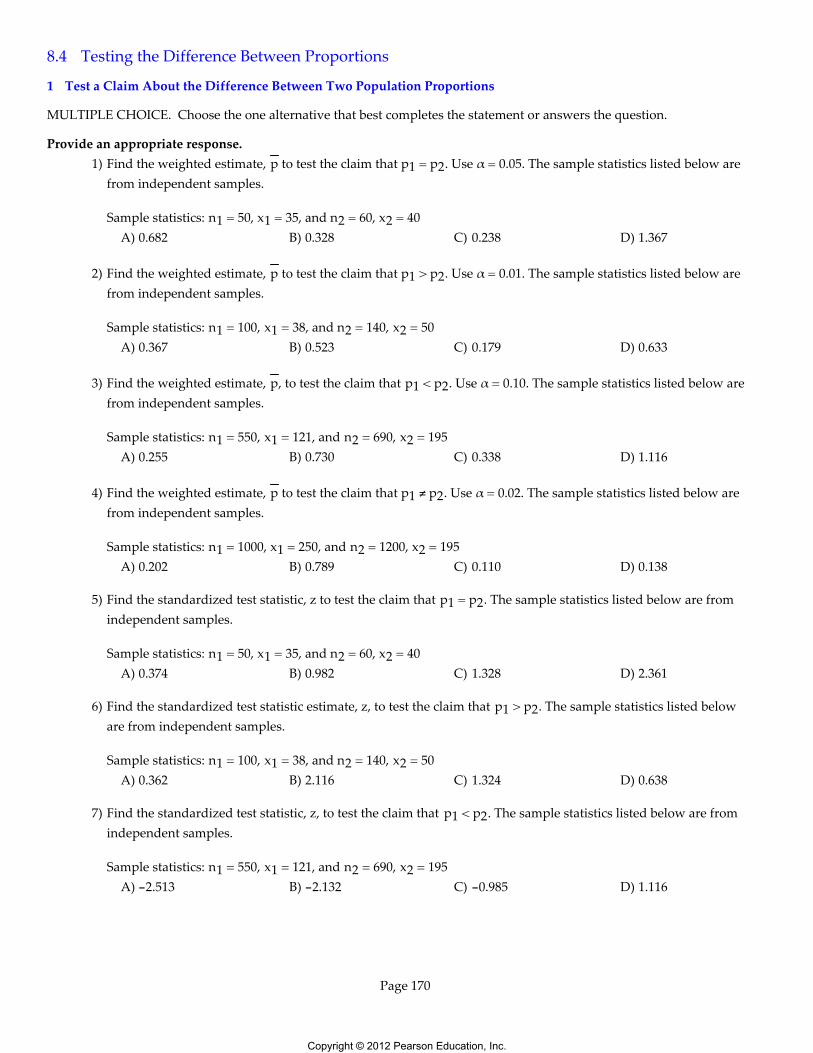
19) A local school district is concerned about the number of school days missed by its teachers due to illness. Arandom sample of 10 teachers is selected. The number of days absent in one year is listed below. An incentiveprogram is offered in an attempt to decrease the number of days absent. The number of days absent in one yearafter the incentive program is listed below. Test the claim that the incentive program cuts down on the numberof days missed by teachers. Use α = 0.05. Assume that the distribution is normally distributed.
TeacherDays absent beforeincentiveDays absent afterincentive
A3
1
B8
7
C7
7
D2
0
E9
8
F4
2
G2
0
H0
1
I7
5
J5
5
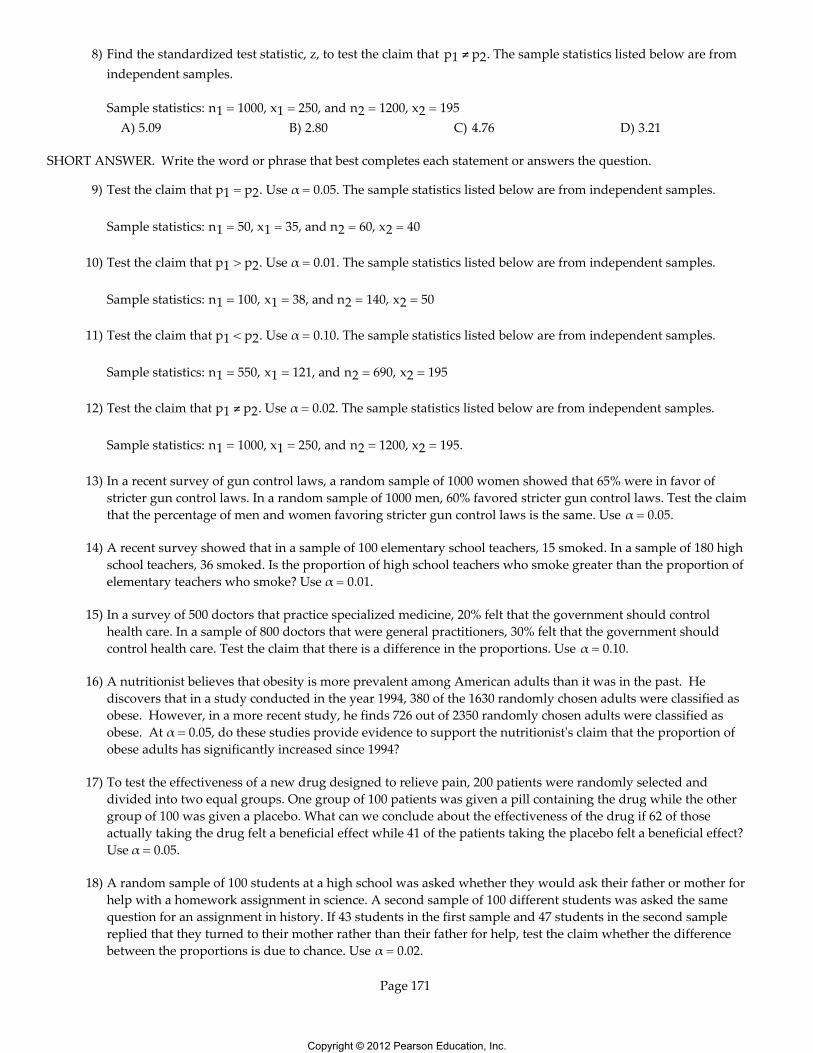
20) A physician claims that a personʹs diastolic blood pressure can be lowered if, instead of taking a drug, theperson listens to a relaxation tape each evening. Ten subjects are randomly selected and pretested. Their bloodpressures, measured in millimeters of mercury, are listed below. The 10 patients are given the tapes and told tolisten to them each evening for one month. At the end of the month, their blood pressures are taken again. Thedata are listed below. Test the physicianʹs claim. Use α = 0.01.
PatientBeforeAfter
18582
29690
39292
48375
58074
69180
77982
89888
99389
109680
2 Construct a Confidence Interval for the Difference Between Two Population Means
MULTIPLE CHOICE. Choose the one alternative that best completes the statement or answers the question.
Provide an appropriate response.21) Construct a 95% confidence interval for data sets A and B. Data sets A and B are dependent. Round to the
nearest tenth.
A 30 28 47 43 31B 28 24 25 35 22A) (-0.7, 18.7) B) (-1.3, 9.0) C) (-0.1, 12.8) D) (-15.3, 15.4)
22) Construct a 99% confidence interval for data sets A and B. Data sets A and B are dependent. Round to thenearest tenth.
A 5.8 6.8 8.7 5.7 5.8 B 8.2 7.1 7.0 6.9 8.3A) (-4.5, 2.6) B) (-25.1, 5.8) C) (-21.3, 19.0) D) (-15.1, 15.1)
Page 169
Copyright © 2012 Pearson Education, Inc.
8.4 Testing the Difference Between Proportions
1 Test a Claim About the Difference Between Two Population Proportions
MULTIPLE CHOICE. Choose the one alternative that best completes the statement or answers the question.
Provide an appropriate response.1) Find the weighted estimate, p to test the claim that p1 = p2. Use α = 0.05. The sample statistics listed below are
from independent samples.
Sample statistics: n1 = 50, x1 = 35, and n2 = 60, x2 = 40A) 0.682 B) 0.328 C) 0.238 D) 1.367
2) Find the weighted estimate, p to test the claim that p1 > p2. Use α = 0.01. The sample statistics listed below arefrom independent samples.
Sample statistics: n1 = 100, x1 = 38, and n2 = 140, x2 = 50A) 0.367 B) 0.523 C) 0.179 D) 0.633
3) Find the weighted estimate, p, to test the claim that p1 < p2. Use α = 0.10. The sample statistics listed below arefrom independent samples.
Sample statistics: n1 = 550, x1 = 121, and n2 = 690, x2 = 195A) 0.255 B) 0.730 C) 0.338 D) 1.116
4) Find the weighted estimate, p to test the claim that p1 ≠ p2. Use α = 0.02. The sample statistics listed below arefrom independent samples.
Sample statistics: n1 = 1000, x1 = 250, and n2 = 1200, x2 = 195A) 0.202 B) 0.789 C) 0.110 D) 0.138
5) Find the standardized test statistic, z to test the claim that p1 = p2. The sample statistics listed below are fromindependent samples.
Sample statistics: n1 = 50, x1 = 35, and n2 = 60, x2 = 40A) 0.374 B) 0.982 C) 1.328 D) 2.361
6) Find the standardized test statistic estimate, z, to test the claim that p1 > p2. The sample statistics listed beloware from independent samples.
Sample statistics: n1 = 100, x1 = 38, and n2 = 140, x2 = 50A) 0.362 B) 2.116 C) 1.324 D) 0.638
7) Find the standardized test statistic, z, to test the claim that p1 < p2. The sample statistics listed below are fromindependent samples.
Sample statistics: n1 = 550, x1 = 121, and n2 = 690, x2 = 195A) -2.513 B) -2.132 C) -0.985 D) 1.116
Page 170
Copyright © 2012 Pearson Education, Inc.
8) Find the standardized test statistic, z, to test the claim that p1 ≠ p2. The sample statistics listed below are fromindependent samples.
Sample statistics: n1 = 1000, x1 = 250, and n2 = 1200, x2 = 195A) 5.09 B) 2.80 C) 4.76 D) 3.21
SHORT ANSWER. Write the word or phrase that best completes each statement or answers the question.
9) Test the claim that p1 = p2. Use α = 0.05. The sample statistics listed below are from independent samples.
Sample statistics: n1 = 50, x1 = 35, and n2 = 60, x2 = 40
10) Test the claim that p1 > p2. Use α = 0.01. The sample statistics listed below are from independent samples.
Sample statistics: n1 = 100, x1 = 38, and n2 = 140, x2 = 50
11) Test the claim that p1 < p2. Use α = 0.10. The sample statistics listed below are from independent samples.
Sample statistics: n1 = 550, x1 = 121, and n2 = 690, x2 = 195
12) Test the claim that p1 ≠ p2. Use α = 0.02. The sample statistics listed below are from independent samples.
Sample statistics: n1 = 1000, x1 = 250, and n2 = 1200, x2 = 195.
13) In a recent survey of gun control laws, a random sample of 1000 women showed that 65% were in favor ofstricter gun control laws. In a random sample of 1000 men, 60% favored stricter gun control laws. Test the claimthat the percentage of men and women favoring stricter gun control laws is the same. Use α = 0.05.
14) A recent survey showed that in a sample of 100 elementary school teachers, 15 smoked. In a sample of 180 highschool teachers, 36 smoked. Is the proportion of high school teachers who smoke greater than the proportion ofelementary teachers who smoke? Use α = 0.01.
15) In a survey of 500 doctors that practice specialized medicine, 20% felt that the government should controlhealth care. In a sample of 800 doctors that were general practitioners, 30% felt that the government shouldcontrol health care. Test the claim that there is a difference in the proportions. Use α = 0.10.
16) A nutritionist believes that obesity is more prevalent among American adults than it was in the past. Hediscovers that in a study conducted in the year 1994, 380 of the 1630 randomly chosen adults were classified asobese. However, in a more recent study, he finds 726 out of 2350 randomly chosen adults were classified asobese. At α = 0.05, do these studies provide evidence to support the nutritionistʹs claim that the proportion ofobese adults has significantly increased since 1994?
17) To test the effectiveness of a new drug designed to relieve pain, 200 patients were randomly selected anddivided into two equal groups. One group of 100 patients was given a pill containing the drug while the othergroup of 100 was given a placebo. What can we conclude about the effectiveness of the drug if 62 of thoseactually taking the drug felt a beneficial effect while 41 of the patients taking the placebo felt a beneficial effect?Use α = 0.05.
18) A random sample of 100 students at a high school was asked whether they would ask their father or mother forhelp with a homework assignment in science. A second sample of 100 different students was asked the samequestion for an assignment in history. If 43 students in the first sample and 47 students in the second samplereplied that they turned to their mother rather than their father for help, test the claim whether the differencebetween the proportions is due to chance. Use α = 0.02.
Page 171
Copyright © 2012 Pearson Education, Inc.
19) In the initial test of the Salk vaccine for polio, 400,000 children were selected and divided into two groups of200,000. One group was vaccinated with the Salk vaccine while the second group was vaccinated with aplacebo. Of those vaccinated with the Salk vaccine, 33 later developed polio. Of those receiving the placebo, 115later developed polio. Test the claim that the Salk vaccine is effective in lowering the polio rate. Use α = 0.01.
20) A well-known study of 22,000 male physicians was conducted to determine if taking aspirin daily reduces thechances of a heart attack. Half of the physicians were given a regular dose of aspirin while the other half wasgiven placebos. Six years later, among those who took aspirin, 104 suffered heart attacks while among thosewho took placebos, 189 suffered heart attacks. Does it appear that the aspirin can reduce the number of heartattacks among the sample group that took aspirin? Use α = 0.01.
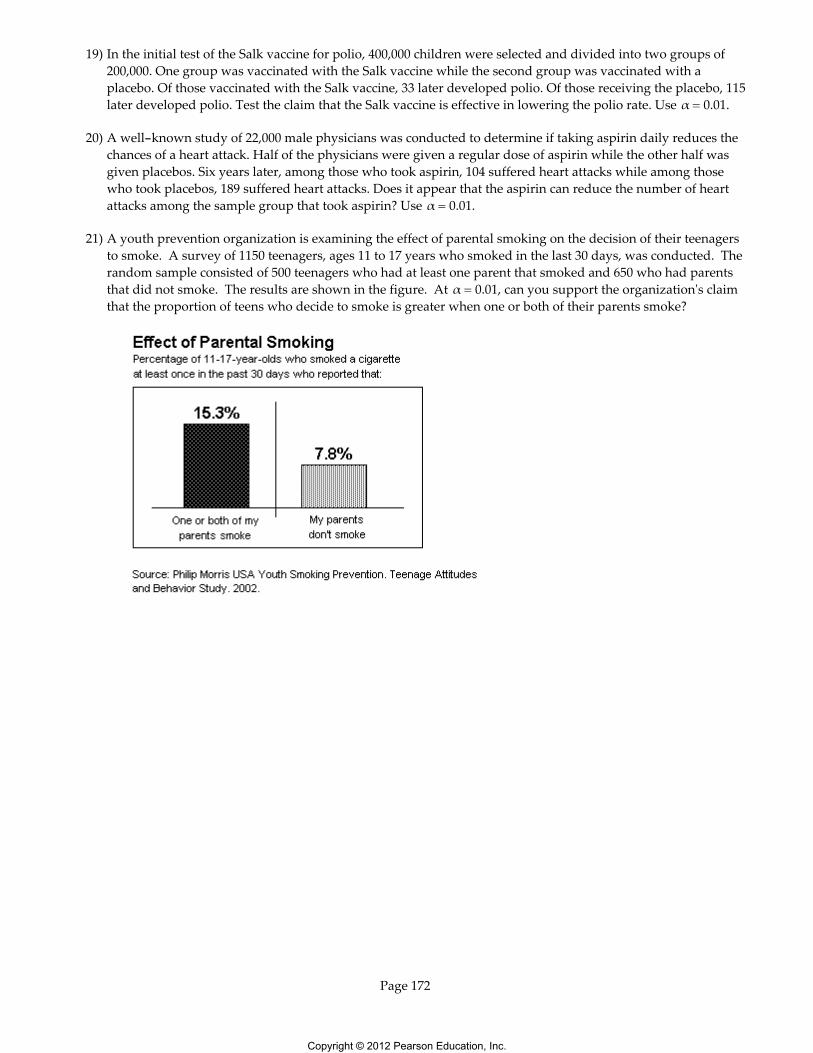
21) A youth prevention organization is examining the effect of parental smoking on the decision of their teenagersto smoke. A survey of 1150 teenagers, ages 11 to 17 years who smoked in the last 30 days, was conducted. Therandom sample consisted of 500 teenagers who had at least one parent that smoked and 650 who had parentsthat did not smoke. The results are shown in the figure. At α = 0.01, can you support the organizationʹs claimthat the proportion of teens who decide to smoke is greater when one or both of their parents smoke?
Page 172
Copyright © 2012 Pearson Education, Inc.
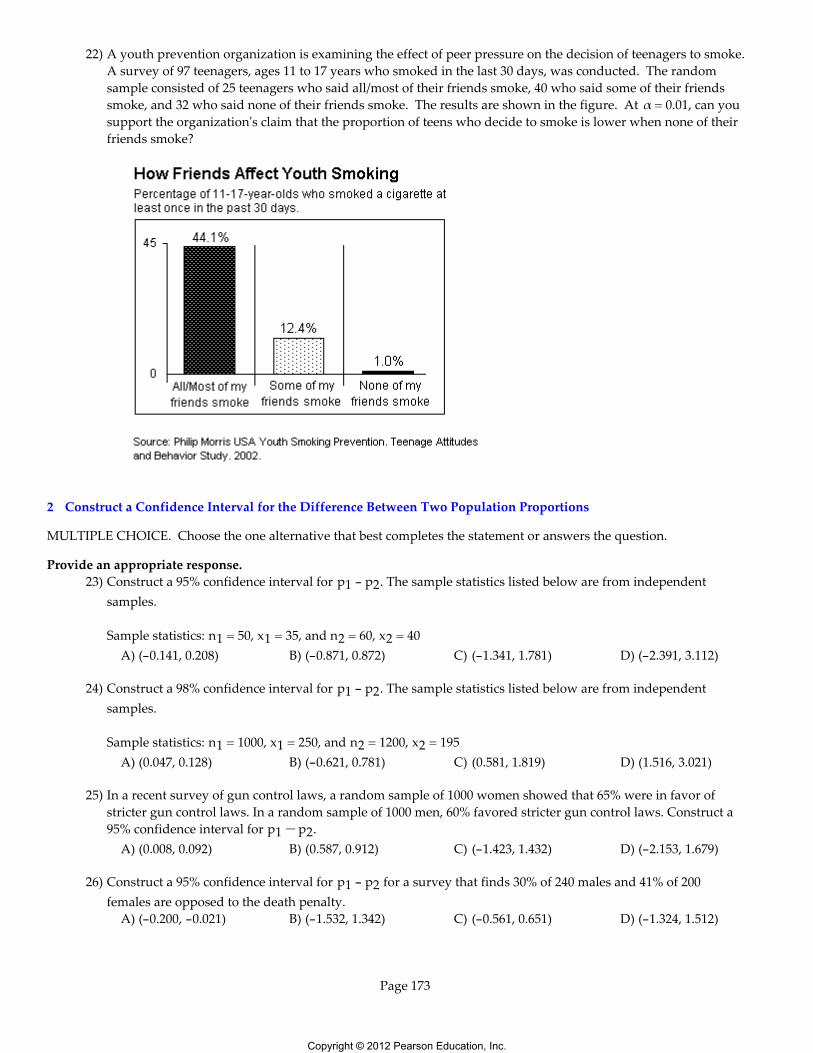
22) A youth prevention organization is examining the effect of peer pressure on the decision of teenagers to smoke.A survey of 97 teenagers, ages 11 to 17 years who smoked in the last 30 days, was conducted. The randomsample consisted of 25 teenagers who said all/most of their friends smoke, 40 who said some of their friendssmoke, and 32 who said none of their friends smoke. The results are shown in the figure. At α = 0.01, can yousupport the organizationʹs claim that the proportion of teens who decide to smoke is lower when none of theirfriends smoke?
2 Construct a Confidence Interval for the Difference Between Two Population Proportions
MULTIPLE CHOICE. Choose the one alternative that best completes the statement or answers the question.
Provide an appropriate response.23) Construct a 95% confidence interval for p1 - p2. The sample statistics listed below are from independent
samples.
Sample statistics: n1 = 50, x1 = 35, and n2 = 60, x2 = 40A) (-0.141, 0.208) B) (-0.871, 0.872) C) (-1.341, 1.781) D) (-2.391, 3.112)
24) Construct a 98% confidence interval for p1 - p2. The sample statistics listed below are from independentsamples.
Sample statistics: n1 = 1000, x1 = 250, and n2 = 1200, x2 = 195A) (0.047, 0.128) B) (-0.621, 0.781) C) (0.581, 1.819) D) (1.516, 3.021)
25) In a recent survey of gun control laws, a random sample of 1000 women showed that 65% were in favor ofstricter gun control laws. In a random sample of 1000 men, 60% favored stricter gun control laws. Construct a95% confidence interval for p1 p2.
A) (0.008, 0.092) B) (0.587, 0.912) C) (-1.423, 1.432) D) (-2.153, 1.679)
26) Construct a 95% confidence interval for p1 - p2 for a survey that finds 30% of 240 males and 41% of 200females are opposed to the death penalty.
A) (-0.200, -0.021) B) (-1.532, 1.342) C) (-0.561, 0.651) D) (-1.324, 1.512)
Page 173
Copyright © 2012 Pearson Education, Inc.
SHORT ANSWER. Write the word or phrase that best completes each statement or answers the question.
27) A nutritionist believes that obesity is more prevalent among American adults than it was in the past. Hediscovers that in a study conducted in the year 1994, 380 of the1630 randomly chosen adults were classified asobese. However, in a more recent study, he finds 726 out of 2350 randomly chosen adults were classified asobese. Construct a 95% confidence interval for the difference in proportions p1 - p2.
MULTIPLE CHOICE. Choose the one alternative that best completes the statement or answers the question.
28) A random sample of 100 students at a high school was asked whether they would ask their father or mother forhelp with a homework assignment in science. A second sample of 100 different students was asked the samequestion for an assignment in history. Forty-three students in the first sample and 47 students in the secondsample replied that they turned to their mother rather than their father for help. Construct a 98% confidenceinterval for p1 - p2.
A) (-0.204, 0.124) B) (-1.324, 1.521) C) (-0.591, 0.762) D) (-1.113, 1.311)
Page 174
Copyright © 2012 Pearson Education, Inc.
Ch. 8 Hypothesis Testing with Two SamplesAnswer Key
8.1 Testing the Difference Between Means (Large Independent Samples)1 Determine the Difference Between Dependent and Independent Samples
1) A2) A3) A4) A5) A6) A7) A
2 Test a Claim About the Difference Between Two Population Means8) A9) A10) A11) A12) A13) A14) A15) critical value z0 = ±1.96; standardized test statistic ≈ 6.17; reject H0; There is sufficient evidence to reject the claim.16) A17) A18) A19) A20) A21) A22) A23) A24) critical value z0 = 2.33; standardized test statistic ≈ 2.99; reject H0; There is sufficient evidence to support the claim.25) critical value z0 = -1.645; standardized test statistic ≈ -3.90; reject H0; There is sufficient evidence to support the claim.26) critical value z0 = ±2.33; standardized test statistic ≈ -2.97; reject H0; There is sufficient evidence to support the claim.27) critical values z0 = ±1.96; standardized test statistic z ≈ -4.50; reject H0; There is sufficient evidence to reject the claim.28) critical value z0 = 2.33; standardized test statistic ≈ 1.71; fail to reject H0; There is not sufficient evidence to support
the claim.29) critical value z0 = 1.645; standardized test statistic z ≈ 4.20; reject H0; There is sufficient evidence to support the claim.30) critical value z0 = -2.33; standardized test statistic z ≈ -2.18; fail to reject H0; There is not sufficient evidence to
support the claim.31) day students x1 = 22, s1 = 3.134; evening students x2 = 23.29, s2 = 3.268; critical values z0 = ±1.96; standardized test
statistic z = -1.69; fail to reject H0; There is not sufficient evidence to reject the claim.32) critical value z0 = -1.645; standardized test statistic z ≈ -1.39; fail to reject H0; There is not sufficient evidence to
support the claim.33) P-value = 0.0823; α = 0.05, P > α; fail to reject H0; There is not sufficient evidence to support the claim.34) NASDAQ: x1 = 1.66, s1 = 0.627; NYSE: x2 = 2.72, s2 = 1.139; standardized test statistic ≈ -4.47; critical value z0 =
±1.96; reject H0; There is enough evidence to reject the claim.35) critical value z0 = 1.645; standardized test statistic z ≈ 1.05; fail to reject H0; There is not sufficient evidence to support
the claim.36) Standardized test statistic ≈ 1.50; critical value z0 = 1.645; fail to reject H0; There is not sufficient evidence to support
the claim37) Standardized test statistic ≈ -1.20; critical value z0 = -2.326; fail to reject H0; There is not sufficient evidence to
support the claim.
Page 175
Copyright © 2012 Pearson Education, Inc.

3 Construct a Confidence Interval for the Difference Between Two Population Means38) Confidence interval (-0.656, 0.056); 0 lies in the interval, fail to reject H0; There is not sufficient evidence to support the
claim.39) A40) A41) A42) confidence interval: -23.38 < μ1 - μ2 < -6.623; Since the interval does not contain zero, we can reject the claim of μ1 =
μ2. Since the interval is negative, it appears that the diet lowers blood pressure.
8.2 Testing the Difference Between Means (Small Independent Samples)1 Find Critical Values
1) A2) A3) A4) A5) A
2 Test a Claim About the Difference Between Two Population Means6) A7) A8) A9) A10) A11) A12) A13) A14) A15) A16) critical value t0 = ±2.064; standardized test statistic ≈ 4.361; reject H0; There is sufficient evidence to reject the claim.17) critical value t0 = ±2.064; standardized test statistic ≈ -0.962; fail to reject H0; There is not sufficient evidence to reject
the claim.18) critical value t0 = 2.681; standardized test statistic ≈ 1.282; fail to reject H0; There is not sufficient evidence to support
the claim.19) critical value t0 = -2.048; standardized test statistic = -2.420; reject H0; There is sufficient evidence to support the
claim.20) critical value t0 = ±2.764; standardized test statistic ≈ -1.546; fail to reject H0; There is not sufficient evidence to
support the claim.21) (a) critical value t0 = -1.699; standardized test statistic ≈ -0.795; fail to reject H0; There is not sufficient evidence to
support the claim. (b) critical value t0 = -1.761; standardized test statistic ≈ -0.793; fail to reject H0; There is not sufficient evidence tosupport the claim.
22) critical value t0 = ±2.048; standardized test statistic t ≈ -1.741; fail to reject H0; There is not sufficient evidence to rejectthe claim.
23) Standardized test statistic ≈ -0.167; critical value t0 = ±2.179; fail to reject H0; There is not sufficient evidence tosupport the claim.
24) Standardized test statistic ≈ -13.663; critical value t0 = -2.821; reject H0; There is sufficient evidence to support theclaim.
3 Construct a Confidence Interval for the Difference Between Two Population Means25) A26) A27) A28) (-0.014, 0.012)29) (-839,897, -517,103)30) A
Page 176
Copyright © 2012 Pearson Education, Inc.
8.3 Testing the Difference Between Means (Dependent Samples)1 Test a Claim About the Difference Between Two Population Means
1) A2) A3) A4) A5) A6) A7) A8) critical values t0 = ±2.776; standardized test statistic t ≈ 2.580; fail to reject H0; There is not sufficient evidence to reject
the claim.9) critical values t0 = ±4.604; standardized test statistic t ≈ -1.213; fail to reject H0; There is not sufficient evidence to
reject the claim.10) critical values t0 = ±2.201; standardized test statistic t ≈ 20.29; reject H0; There is sufficient evidence to reject the claim.11) critical value t0 = 2.624; standardized test statistic t ≈ 21.947; reject H0; There is sufficient evidence to support the
claim.12) critical value t0 = -1.333; standardized test statistic t ≈ -35.002; reject H0; There is sufficient evidence to support the
claim.13) critical values t0 = ±2.681; standardized test statistic t ≈ 1.131; fail to reject H0; There is not sufficient evidence to
support the claim.14) claim: μd = 0; critical values t0 = ±2.306; standardized test statistic t ≈ -2.401; reject H0; There is sufficient evidence to
reject the claim.15) claim: μd < 0; critical value t0 = -1.860; standardized test statistic t ≈ -2.177; reject H0; There is sufficient evidence to
support the claim.16) claim: μd > 0; critical value t0 = 2.821; standardized test statistic t ≈ 2.752; fail to reject H0; There is not sufficient
evidence to support the claim.17) claim: μd = 0; critical values t0 = ±2.539; standardized test statistic t ≈ 1.451; fail to reject H0; There is not sufficient
evidence to reject the claim.18) A19) claim: μd > 0; critical values t0 = 1.833; standardized test statistic t ≈ 3.161; reject H0; There is sufficient evidence to
support the claim.20) claim: μd > 0; critical value t0 = 2.821; standardized test statistic t ≈ 3.490; reject H0; There is sufficient evidence to
support the claim.2 Construct a Confidence Interval for the Difference Between Two Population Means
21) A22) A
8.4 Testing the Difference Between Proportions1 Test a Claim About the Difference Between Two Population Proportions
1) A2) A3) A4) A5) A6) A7) A8) A9) critical values z0 = ±1.96; standardized test statistic t ≈ 0.374; fail to reject H0; There is not sufficient evidence to reject
the claim.10) critical values z0 = ±2.33; standardized test statistic t ≈ 0.362; fail to reject H0; There is not sufficient evidence to
support the claim.
Page 177
Copyright © 2012 Pearson Education, Inc.

11) critical value z0 = -1.28; standardized test statistic t ≈ -2.513; reject H0; There is sufficient evidence to support theclaim.
12) critical values z0 = ±2.33; standardized test statistic t ≈ 5.087; reject H0; There is sufficient evidence to support theclaim.
13) claim: p1 = p2; critical value z0 = 1.96; standardized test statistic t ≈ 2.309; reject the null hypothesis; There is sufficientevidence to reject the claim.
14) claim: p1 < p2; critical value z0 = -2.33; standardized test statistic t ≈ -1.039; fail to reject H0; There is not sufficientevidence to support the claim.
15) claim: p1 ≠ p2; critical values z0 = ±1.645; standardized test statistic ≈ -3.991; reject H0; There is sufficient evidence tosupport the claim.
16) Standardized test statistic ≈ 5.250; critical value z0 = 1.645; reject H0; There is sufficient evidence to support the claim.17) claim: p1 = p2; critical values z0 = ±1.96; standardized test statistic t ≈ 2.971; reject H0; The new drug is effective.18) claim: p1 = p2; critical values z0 = ±2.33; standardized test statistic t ≈ -0.569; fail to reject H0; There is not sufficient
evidence to reject the claim.19) claim: p1 < p2; critical value z0 = -2.33; standardized test statistic t ≈ -6.742; reject H0; There is sufficient evidence to
support the claim.20) claim: p1 < p2; critical value z0 = -2.33; standardized test statistic t ≈ -4.999; reject H0; There is sufficient evidence to
support the claim.21) Standardized test statistic ≈ 4.020; critical value z0 = 2.326; reject H0; There is sufficient evidence to support the claim.22) Standardized test statistic ≈ -2.92; critical value z0 = -2.326; reject H0; There is sufficient evidence to support the
claim.2 Construct a Confidence Interval for the Difference Between Two Population Proportions
23) A24) A25) A26) A27) (-0.104, -0.048)28) A
Page 178
Copyright © 2012 Pearson Education, Inc.


