Laser Raman Molecular Microprobe (MOLE)
6
Laser Raman Molecular Microprobe (MOLE) P. Dhamelincourt and F. Wallart Laboratoire de Spectrochemie Infrarouge et Raman, C.N.R.S., Université de Lille, B.P. 36, 59650 Villeneuve d'Ascq, France Most microanalysis physical meth- ods are based on atomic properties and only indirectly provide informa- tion on how atoms link together to form polyatomic structures. This is the case for electron or ion microprobe methods, which are based on the anal- ysis of electron X-rays or secondary ions emitted by samples under elec- tron or ion beam impact. These meth- ods often fail to yield information on chemical bonds and conformation of molecules. In the laser molecular microprobe (1, 2), photons generated by a laser are used to excite the sample and cause the emission of Raman lines of differ- ent components. By use of these Raman lines, each component can be detected, identified, and then located by forming a micrographie image that gives the "map" of its distribution in the sample. This is the principle of the nondestructive microanalytical meth- od described here. Instrument Description The basic instrument (3-6) com- bines a conventional optical micro- M. Leclercq and A. T. N'Guyen I.S.A. Nord 35 rue Inkermann 59000 Lille, France scope (with bright and dark field illu- mination), an optical filter possessing a very low stray light level, and a mul- tichannel and/or monochannel detec- tion system. This configuration gives a very versatile instrument because it permits different modes of opera- tion without disturbing the sample. A block diagram of the instrument is shown in Figure 1. A laser (argon, krypton, dye laser, etc.) is the monochromatic source of light used for irradiating the sample. A conventional optical microscope provides an illuminatory stage and forms part of the imaging system. The sample under study is placed on the microscope stage. All modes of obser- vation available in a standard optical microscope are available in the instru- ment; therefore, the samples can be studied in air, liquid, or transparent media. A double monochromator spectrom- eter with two concave aberration cor- rected gratings is the central part of the instrument. This device permits spectral separation of the chosen spec- tral line, which corresponds to a par- ticular vibrational mode, and it trans- D. O. Landon I.S.A. Inc. 173 Essex Avenue Metuchen, N.J. 08840 mits good images in a wide spectral range without changing components. The detection system is composed of two separate assemblies. One, which has a photomultiplier, records the spectrum on a chart recorder. The other has a three-stage image intensi- fier, a TV-type detector, and a visual- ization system that displays micro- graphic images. A computer and disc or tape memory can be attached to the system for information processing and storage. Figure 2 gives the optical scheme of the instrument. Modes of Operation The two modes of operation cur- rently used depend on the type of irra- diation of the sample. Punctual Illumination with Mo- nochannel or Multichannel Detec- tion. By use of the bright field illumi- nation system of the microscope, the same objective (50X, ΝΑ, 0.85-100Χ, N/A, 0.90) focuses the laser beam into a spot on the component of the sample to be identified and collects the scat- tered light. In this case, the top aper- ture of the objective, the grating sur- faces, the sample, and entrance slit are simultaneously optically aligned by the transfer optic. To obtain the Raman spectrum, the optical filter can function as a Raman spectrometer when the detector is a photomultiplier followed by an amplifier and a chart recorder, or as a Raman spectrograph when the detector is an intensifier phototube, followed by a low-level TV camera (SIT or SEC tube). Global Illumination and Imaging System. Selecting, in the Raman spec- trum, radiation characterizing one particular component forms a micro- This new microanalysis technique for detecting, identi- fying, and obtaining the distribution of the different com- ponents of an heterogeneous sample is similar to electron or ion microprobe methods. However, an important advan- tage is the ability to study samples in air, under a con- trolled atmosphere, or even inside transparent media rath- er than just in a vacuum 414 A · ANALYTICAL CHEMISTRY, VOL. 51, NO. 3, MARCH 1979 0003-2700/79/0351-414A$01.00/0 © 1979 American Chemical Society Instrumentation
Transcript of Laser Raman Molecular Microprobe (MOLE)

Laser Raman Molecular Microprobe (MOLE)
P. Dhamelincourt and F. Wallart Laboratoire de Spectrochemie Infrarouge et Raman, C.N.R.S., Université de Lille, B.P. 36, 59650 Villeneuve d'Ascq, France
Most microanalysis physical methods are based on atomic properties and only indirectly provide information on how atoms link together to form polyatomic structures. This is the case for electron or ion microprobe methods, which are based on the analysis of electron X-rays or secondary ions emitted by samples under electron or ion beam impact. These methods often fail to yield information on chemical bonds and conformation of molecules.
In the laser molecular microprobe (1, 2), photons generated by a laser are used to excite the sample and cause the emission of Raman lines of different components. By use of these Raman lines, each component can be detected, identified, and then located by forming a micrographie image that gives the " m a p " of its distribution in the sample. This is the principle of the nondestructive microanalytical method described here.
Instrument Description The basic instrument (3-6) com
bines a conventional optical micro-
M. Leclercq and A. T. N'Guyen I.S.A. Nord 35 rue Inkermann 59000 Lille, France
scope (with bright and dark field illumination), an optical filter possessing a very low stray light level, and a multichannel and/or monochannel detection system. This configuration gives a very versatile instrument because it permits different modes of operation without disturbing the sample. A block diagram of the instrument is shown in Figure 1.
A laser (argon, krypton, dye laser, etc.) is the monochromatic source of light used for irradiating the sample.
A conventional optical microscope provides an illuminatory stage and forms part of the imaging system. The sample under study is placed on the microscope stage. All modes of observation available in a standard optical microscope are available in the instrument; therefore, the samples can be studied in air, liquid, or t ransparent media.
A double monochromator spectrometer with two concave aberration corrected gratings is the central part of the instrument. This device permits spectral separation of the chosen spectral line, which corresponds to a particular vibrational mode, and it trans-
D. O. Landon I.S.A. Inc. 173 Essex Avenue Metuchen, N.J. 08840
mits good images in a wide spectral range without changing components.
The detection system is composed of two separate assemblies. One, which has a photomultiplier, records the spectrum on a chart recorder. The other has a three-stage image intensifier, a TV-type detector, and a visualization system that displays micro-graphic images. A computer and disc or tape memory can be attached to the system for information processing and storage. Figure 2 gives the optical scheme of the instrument.
Modes of Operation The two modes of operation cur
rently used depend on the type of irradiation of the sample.
Punctual Illumination with Monochannel or Multichannel Detection. By use of the bright field illumination system of the microscope, the same objective (50X, ΝΑ, 0.85-100Χ, N/A, 0.90) focuses the laser beam into a spot on the component of the sample to be identified and collects the scattered light. In this case, the top aperture of the objective, the grating surfaces, the sample, and entrance slit are simultaneously optically aligned by the transfer optic. To obtain the Raman spectrum, the optical filter can function as a Raman spectrometer when the detector is a photomultiplier followed by an amplifier and a chart recorder, or as a Raman spectrograph when the detector is an intensifier phototube, followed by a low-level TV camera (SIT or SEC tube).
Global Illumination and Imaging System. Selecting, in the Raman spectrum, radiation characterizing one particular component forms a micro-
This new microanalysis technique for detecting, identifying, and obtaining the distribution of the different components of an heterogeneous sample is similar to electron or ion microprobe methods. However, an important advantage is the ability to study samples in air, under a controlled atmosphere, or even inside transparent media rather than just in a vacuum
414 A · ANALYTICAL CHEMISTRY, VOL. 51, NO. 3, MARCH 1979 0003-2700/79/0351-414A$01.00/0 © 1979 American Chemical Society
Instrumentation
graphic image that gives the distribution of this component. The aperture of the microscope objective (O) (Figure 2) is optically aligned with the three slits (Oi, 02 , 03) of the optical filter. The image (Si) of the sample (S) given by the objective is formed on the gratings (S2, S3) and goes through the aperture of the exit slit (O3) to the photocathode of the intensifier tube (S4). A rotating laser beam feeding the objective annular illuminator (dark field illuminator) homogeneously illuminates the sample and suppresses the "speckle noise" of the images. The spatial resolution of the images is about 1 μηι.
The Spectral Mode. In the mono-channel spectral mode classical Raman spectra can be recorded of the entire sample or of a specific portion selected to identify positively the nature of that portion.
In the multichannel spectral mode the Raman spectra can be observed in spectrographic form on an oscilloscope in real time in up to 100-cm-1
segments. This mode is particularly useful for monitoring the evolution of a sample.
The Imaging Mode. To locate one of the components of the sample, an image of the surface obtained from a characteristic line of this component can be directly observed on the TV monitor screen. This allows "mapping" the distribution of a given substance in a heterogeneous sample.
Some Applications of the Laser Raman Microprobe
To show the many possibilities opened by the laser Raman micro-probe, we now present some examples of applications of the instrument.
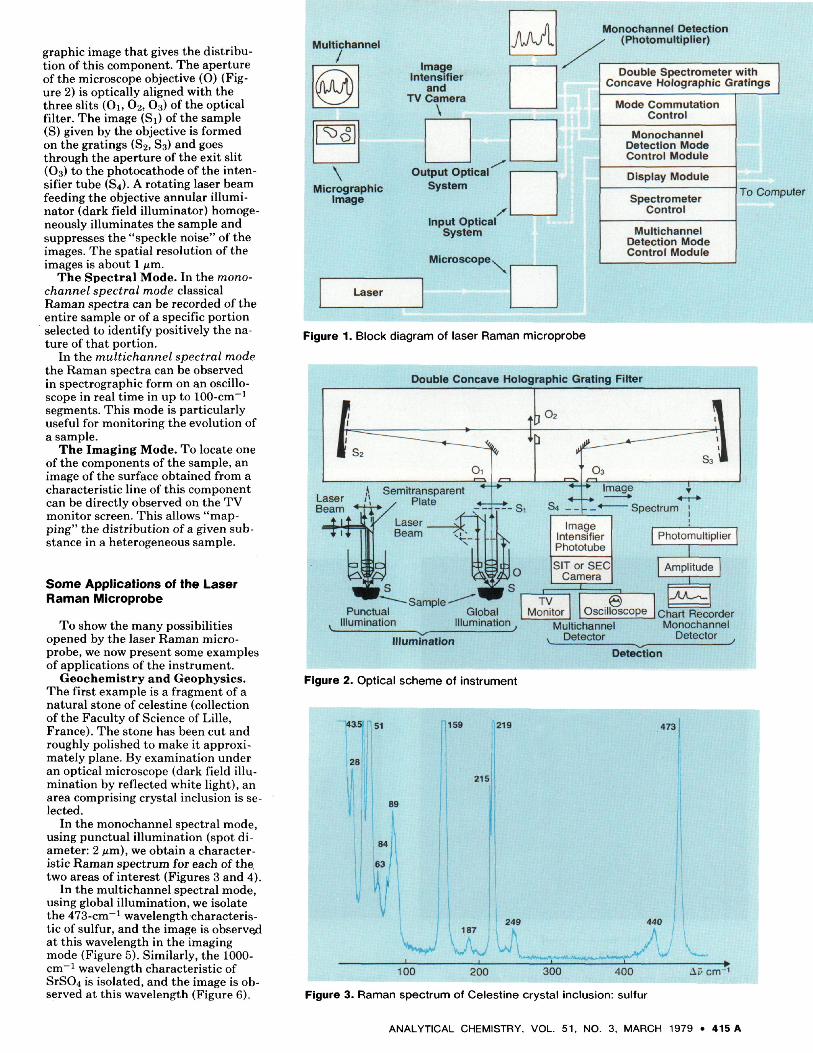
Geochemistry and Geophysics. The first example is a fragment of a natural stone of celestine (collection of the Faculty of Science of Lille, France). The stone has been cut and roughly polished to make it approximately plane. By examination under an optical microscope (dark field illumination by reflected white light), an area comprising crystal inclusion is selected.
In the monochannel spectral mode, using punctual illumination (spot diameter: 2 μπι), we obtain a characteristic Raman spectrum for each of the. two areas of interest (Figures 3 and 4).
In the multichannel spectral mode, using global illumination, we isolate the 473-cm-1 wavelength characteristic of sulfur, and the image is observe/1 at this wavelength in the imaging mode (Figure 5). Similarly, the 1000-cm_1 wavelength characteristic of SrSC>4 is isolated, and the image is observed at this wavelength (Figure 6).
Multichannel /
^ O
\ Micrographie
Image
ΛΑΛ Image
Intensifier and
TV Camera
Image Intensifier
and TV Camera
\
.•s"
System
Monochannel Detection (Photomultiplier)
Input Optical System
Microscope \
Double Spectrometer with Concave Holographic Gratings
Mode Commutation Control
Monochannel Detection Mode Control Module
Display Module
Spectrometer Control
Multichannel Detection Mode Control Module
To Computer
Laser
Figure 1. Block diagram of laser Raman microprobe
Double Concave Holographic Grating Filter
o2
,* Semitransparent Laser l\ . p ! a t e Beam * 7 r i r * / ^ c -
t l i \ y Laser jTJ' 1 1 I 11· Roam 7N ' '
S4 - .
Image Intensifier Phototube
SIT or SEC Camera
Photomultiplier
Amplitude
- Sample -Punctual Global
Illumination Illumination
TV Monitor
θ Oscilloscope
_ / U _ ^ _
Illumination
Figure 2. Optical scheme of instrument
Multichannel v Detector
Chart Recorder Monochannel
Detector
Detection
-4a, >ΙΓ]51 159 219 473
28
215
1 «
84
63
I
1 VI 187
249 440
100 200 300 400 Afcrrv 1
Figure 3. Raman spectrum of Celestine crystal inclusion: sulfur
ANALYTICAL CHEMISTRY, VOL. 51, NO. 3, MARCH 1979 · 415 A

450 1000
100 -f f 7k / lh r4i 450 600 700 1000 1100 AScrrr1
' Figure 4. Raman spectrum of area around same inclusion: Strontium sulfate
When the image at the characteristic line of SrSC>4 is observed, the sulfur is no longer obvious but its trace is still visible. The sulfur crystal in the plane of the surface is thin and therefore transparent to the radiation emitted by SrS0 4 . Further impurities at the surface appear as dark spots on the micrographie image. Fluid inclusions can also be directly analyzed (7) provided that the matrix is sufficiently transparent to the laser beam and scattered light.
Archeology and Gemnology. Knowing the exact nature of a stone object without taking a sample (even a microscopic one) would be greatly beneficial in any museum of art and archeology. With the laser Raman microprobe, it is possible to identify directly the nature of the stone.
Examining the precise location of a small area of the stone can prevent contact with fluorescent impurities, which are often present in natural materials and which, in most cases, prevent the recording of Raman spectra with a classical Raman spectrometer.
Figure 7 shows the comparison between Raman spectra obtained from
50 μΠΊ Figure 5. Raman image of sulfur inclusion obtained with 4 7 3 - c m _ 1 line
50 μϊΥ\ Figure 6. Raman image of same area obtained with 1000 -cm _ 1 characteristic line of sulfate
416 A · ANALYTICAL CHEMISTRY, VOL. 51, NO. 3, MARCH 1979

a precious Chinese vase and from a sample of serpentine (8).
Another important application is the determination of authenticity and geographical origins of gems by identifying in situ the solid inclusions present in precious stones.
Investigation of Defects in Industrial Materials. The formation of bubble-like inclusions is a problem currently encountered in the commercial production of glass. The in situ analysis of bubble content aids in properly selecting materials and process parameters which will inhibit their formation.
Figure 8 represents one example of the investigation of solid deposits on the wall of a bubble inside a sample of industrial glass (in collaboration with the Inorganic Chemistry Laboratory E.N.S.C. Strasbourg, France). Spectra a, b, and c represent sulfur, polysulfide, and sulfate of sodium, respectively. Each deposit can be imaged by use of a characteristic Raman line.
Pollution Analysis. This new nondestructive analytical tool is also perfectly suited to the study and identification of urban and industrial dusts. Figure 9 shows the results obtained from dust collected on a highway. The two broad maxima near 1400 and 1600 cm - 1 (Figure 9c) are often observed
Figure 7. Raman spectra obtained from a) precious Chinese vase, b) specimen of serpentine
on the spectra of air particulate dust. They can be attributed to degraded organic compounds or soot coating (9).
Industrial Quality Control. In the industrial field, it is very important to control the quality of manufactured products. Local defects in synthetic films or fibers impair their clarity and can cause rending. The compounds responsible for these defects can be identified with MOLE (molecular optics laser examiner) by simply recording in situ the Raman spectra of the
defects. Generally, the defects are caused by atmospheric dusts, local differences of crystallinity, degraded areas, or local concentration of copolymers.
These studies are useful for quality control of semiconductors and integrated circuits. Figure 10 shows the spectra of different parts of an integrated circuit and the pollutants discovered on its surface. The major pollutant found was lead acetate mixed with organic compounds.
Figure 8. Identification of solid deposits contained in a bubble inside a commercial glass Different areas appear on wall of bubble when it is observed through a microscope. By use of punctual illumination a characteristic Raman spectrum can be recorded from each of these areas. Raman spectrum characteristic of a) sulfur, b) sodium polysulfide, c) sodium sulfate
ANALYTICAL CHEMISTRY, VOL. 5 1 , NO. 3, MARCH 1979 · 417 A

Figure 9. Raman spectra of some particles (2 -10 μ in size) removed from surface of a collection filter placed near a highway Raman spectrum of a) quartz particle ((V-Si02), b) calcite particle (CaC03), c) Dolomite particle [CaMg(C03)2], d) Feldspar particle (Orthoclase)
Figure 10. Analysis of pollutants found at surface of a commercial integrated circuit
420 A · ANALYTICAL CHEMISTRY, VOL. 51, NO. 3, MARCH 1979
Figure 11. Micrographie image (X300) of part of an histological section of Blatella germanica L

Figure 12. Raman spectra obtained from a) commercial sample of uric acid (particle ~ 5 μ in size), b) fat body spherocrystal (~5 μ in diameter), c) commercial sample of potassium urate (particle ~ 5 μ in size)
Biology. Important information unattainable by electron or ion micro-probe can be obtained on biological samples. For example, Figure 11 shows spherocrystals (10) (1-12 μ) of fat body of Blatella germanica L. (In-secta Dictyoptera). Fat body can be roughly considered as the liver of invertebrates, and puric catabolism is
important. The samples are histological sections of fixed and paraffin-embedded material. Traditional methods of study have given the following results (10, 11): biochemistry, uric acid; X-ray, amorphous structure; and Castaing microprobe, abundant Κ and small quantities of Ca and P. Figure 12 represents the spectra obtained
from reference materials (uric acid, potassium urate) and fat body spherocrystals. A comparison between these spectra shows that fat body is mainly composed of uric acid with a small amount of potassium urate.
Conclusions The purpose of the results present
ed here is simply to show the widespread interest in this new microana-lytical technique.
Several other fields will be investigated, and studies are already in progress (i.e., corrosion, and photochemical and electrochemical reactions). We expect the laser Raman microprobe to find application in laboratories using such microprobe techniques as Auger (AES), low-energy electron diffraction (LEED), X-ray photoelectron spectroscopy (ESCA), secondary ion mass spectrometry (SIMS), and electron microscopy. The high-energy intensity required in some of these techniques and sample treatment prevent their use on delicate samples. The Raman microprobe probably provides the only approach to surface analysis on living materials. In addition, the instrument performs nondestructive analysis in various media (air, controlled atmosphere or liquid) for small quantities of sample down to a few pi-cograms.
The versatility of this new instrument should greatly facilitate microanalysis and structural determination, and complement other techniques.
References ( 1 ) M. Delhaye and P. Dhamelincourt, J.
Raman Spectrosc, 3, 33 (1975). (2) G. J. Rosasco, E. S. Etz, and W. A. Cas
satt, Appl. Spectrosc, 29, 396 (1975); in Proc. of the Fifth Int. Conf. on Raman Spectroscopy, E. 0 . Schmid et al., Freiburg, Germany, Sept. 2-8, 1976.
(3) M. Delhaye, P. Dhamelincourt, and Y. Moschetto, U.S. Patent 4,030,827 (1977).
(4) M. Delhaye, P. Dhamelincourt, and E. Da Silva, French Patent ANVAR 762 1539(1976).
(5) P. Dhamelincourt and P. Bisson, Mi-crosc. Acta, 79, 267 (1977).
(6) P. Dhamelincourt, "Lasers in Chemistry," Elsevier, Amsterdam, The Netherlands, 1977.
(7) G. J. Rosasco, E. Roedder, and J. H. Simmons, Science, 190, 557 (1975).
(8) P. Dhamelincourt and H. J. Schubnel, Rev. Gemnol., 52, 11 (1977).
(9) E. S. Etz and G. J. Rosasco, "Environmental Analysis," Academic Press, New York, N.Y., 1977.
(10) C. Ballan-Du Français, doctoral thesis, Paris, France, 1975.
(11) C. Ballan-Du Français, Cellule, 70, 317(1974).
This study financially supported by C.N.R.S., University of Lille, the Direction Générale de la Recherche Scientifique, and the Agence Nationale pour la valorisation de la Recherche of France.
From left to right: P. Dhamelincourt has played a major role in the conception and realization of the molecular microprobe. He specializes in micro Raman spectroscopy. M. Leclercq was in charge of the Mole Laboratory at Lirinord Division Instrument S.A. He is now technical manager at D.I.L.O.R. (rue des Bois Blancs à Lille, France). A. T. N'Guyen worked in the Mole Laboratory at Lirinord Division Instrument S.A. He is now in charge of the Application Laboratory at D.I.L.O.R. F. Wallart is assistant professor at the University of Lille. He specializes in Raman spectroscopy and instrumentation. D. O. London (not shown) is manager of research and development at Instruments S.A., Metuch-en, N.J. His interests include optical spectroscopy and instrument design.
ANALYTICAL CHEMISTRY, VOL. 51, NO. 3, MARCH 1979 · 421 A