LAPPEENRANTA-LAHTI UNIVERSITY OF TECHNOLOGY Master's ...
68
LAPPEENRANTA-LAHTI UNIVERSITY OF TECHNOLOGY School of Engineering Science Master's Programme in Software Engineering and Digital Transformation PETER THE GREAT ST. PETERSBURG POLYTECHNIC UNIVERSITY Graduate School of Management and Business of Institute of Industrial Management, Economics and Trade Master’s Programme in Business-Engineering Technologies Mikhail Mazurovskiy INTERNET OF THINGS IN GREENHOUSE FARMING 1 st Supervisor/Examiner: Professor Ajantha Dahanayake, LUT University 2 nd Supervisor/Examiner: Professor Igor Ilin, Peter the Great St. Petersburg Polytechnic University Lappeenranta – Saint Petersburg 2019
Transcript of LAPPEENRANTA-LAHTI UNIVERSITY OF TECHNOLOGY Master's ...

LAPPEENRANTA-LAHTI UNIVERSITY OF TECHNOLOGY
School of Engineering Science
Master's Programme in Software Engineering and Digital Transformation
PETER THE GREAT ST. PETERSBURG POLYTECHNIC UNIVERSITY
Graduate School of Management and Business of Institute of Industrial Management,
Economics and Trade
Master’s Programme in Business-Engineering Technologies
Mikhail Mazurovskiy
INTERNET OF THINGS IN GREENHOUSE FARMING
1st Supervisor/Examiner: Professor Ajantha Dahanayake, LUT University
2nd Supervisor/Examiner: Professor Igor Ilin, Peter the Great St. Petersburg Polytechnic
University
Lappeenranta – Saint Petersburg
2019
ii
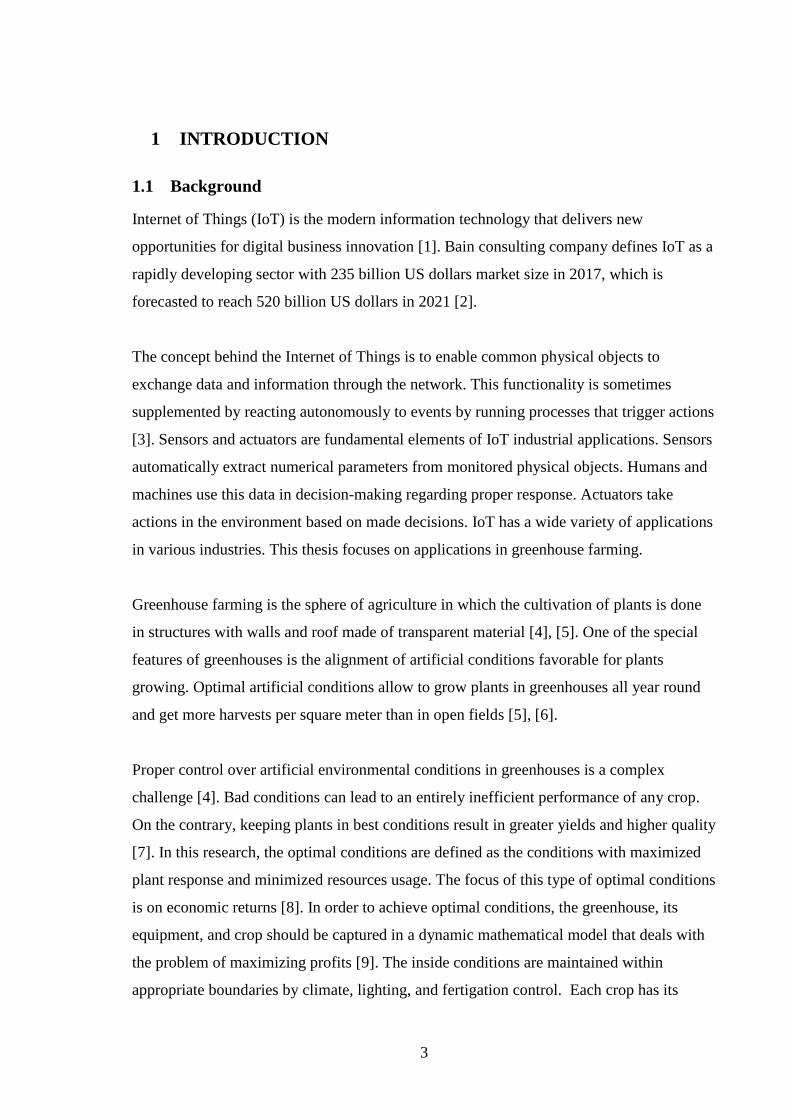
ABSTRACT
Lappeenranta-Lahti University of Technology
School of Engineering Science
Master's Programme in Software Engineering and Digital Transformation
Mikhail Mazurovskiy
Internet of Things in greenhouse farming
Master’s Thesis
2019
65 pages, 12 figures, 16 tables
Examiners: Professor Ajantha Dahanayake, LUT University
Professor Igor V. Ilin, Peter the Great St. Petersburg Polytechnic
University
Keywords: IoT, precision agriculture, smart farming, autonomous greenhouse
The goal of this research is to specify requirements and create the high-view architecture of
the Internet of Things system applied in greenhouse farming. The research was conducted
based on the Middle East pharmaceutical company producing medicines made of cannabis.
Four direct users of the system representing three main user groups were interviewed on the
requirements elicitation stage. The collected requirements were specified separately
according to their types. The level of detail of specified requirements enabled the creation of
several architectural views. The developed architecture is based on a wireless sensor
network, wired actuators network, and cloud-based IoT platform. The main elements used in
the solution are devices provided by Libelium and cloud-based services offered by Amazon
Web Services. The specified requirements and developed architecture were verified and
validated by representatives of the pharmaceutical company and third-party IoT expert.

iii
ACKNOWLEDGEMENTS
I want to thank my family for their sincere love and support. I am also grateful to my
supervisors Ajantha Dahanayake and Igor Ilin for their invaluable contribution to this work.

1
TABLE OF CONTENTS
1 INTRODUCTION ............................................................................................. 3
1.1 BACKGROUND.......................................................................................................... 3
1.2 GOALS AND DELIMITATIONS .................................................................................... 4
1.3 STRUCTURE OF THE THESIS ...................................................................................... 5
2 RELATED WORK ............................................................................................ 6
2.1 INTERNET OF THINGS ............................................................................................... 6
2.2 IOT APPLICATIONS ................................................................................................... 9
2.3 IOT SYSTEM DEVELOPMENT ................................................................................... 16
2.3.1 IoT system requirements development ............................................................. 16
2.3.2 IoT system architecture creation ..................................................................... 18
3 METHODOLOGY .......................................................................................... 22
3.1 RESEARCH CLASSIFICATION ................................................................................... 22
3.2 RELATED WORKS REVIEW METHODS ...................................................................... 25
3.3 REQUIREMENTS DEVELOPMENT METHODS ............................................................. 26
3.4 IOT SYSTEM ARCHITECTURE CREATION AND VERIFICATION METHODS ................... 28
4 RESULTS ...................................................................................................... 29
4.1 RESEARCHED COMPANY INTRODUCTION ................................................................ 29
4.2 IOT SYSTEM REQUIREMENTS .................................................................................. 30
4.2.1 Business requirements ..................................................................................... 31
4.2.2 Vision of solution ............................................................................................. 34
4.2.3 User requirements and functional requirements ............................................. 38
4.2.4 Non-functional requirements ........................................................................... 47
4.3 IOT SYSTEM ARCHITECTURE .................................................................................. 48
4.3.1 IoT context view ............................................................................................... 48
4.3.2 Physical entity view ......................................................................................... 49
4.3.3 Functional view ................................................................................................ 53
5 DISCUSSION AND CONCLUSIONS ............................................................ 59
REFERENCES ...................................................................................................... 61

2
LIST OF SYMBOLS AND ABBREVIATIONS
AI Artificial Intelligence
API Application programming interface
AWS Amazon Web Services
BLE Bluetooth Low Energy
BN Business Need
CEA Controlled Environment Agriculture
EC Electrical Conductivity
GPRS General Packet Radio Services
GSM Global System for Mobile Communications
GUI Graphical User Interface
IaaS Infrastructure as a Service
IAM Identity and Access Management
IoT Internet of Things
ISO International Organization for Standardization
IT Information technologies
LTE Long-Term Evolution
PaaS Platform as a Service
PAR Photosynthetically active radiation
PE Physical Entity
PLC Programmable Logic Controller
SaaS Software as a Service
SNS Simple Notification Service
UML Unified Modeling Language
WAN Wide Area Network
WPAN Wireless Personal Area Network
WSN Wireless Sensor Network
3
1 INTRODUCTION
1.1 Background
Internet of Things (IoT) is the modern information technology that delivers new
opportunities for digital business innovation [1]. Bain consulting company defines IoT as a
rapidly developing sector with 235 billion US dollars market size in 2017, which is
forecasted to reach 520 billion US dollars in 2021 [2].
The concept behind the Internet of Things is to enable common physical objects to
exchange data and information through the network. This functionality is sometimes
supplemented by reacting autonomously to events by running processes that trigger actions
[3]. Sensors and actuators are fundamental elements of IoT industrial applications. Sensors
automatically extract numerical parameters from monitored physical objects. Humans and
machines use this data in decision-making regarding proper response. Actuators take
actions in the environment based on made decisions. IoT has a wide variety of applications
in various industries. This thesis focuses on applications in greenhouse farming.
Greenhouse farming is the sphere of agriculture in which the cultivation of plants is done
in structures with walls and roof made of transparent material [4], [5]. One of the special
features of greenhouses is the alignment of artificial conditions favorable for plants
growing. Optimal artificial conditions allow to grow plants in greenhouses all year round
and get more harvests per square meter than in open fields [5], [6].
Proper control over artificial environmental conditions in greenhouses is a complex
challenge [4]. Bad conditions can lead to an entirely inefficient performance of any crop.
On the contrary, keeping plants in best conditions result in greater yields and higher quality
[7]. In this research, the optimal conditions are defined as the conditions with maximized
plant response and minimized resources usage. The focus of this type of optimal conditions
is on economic returns [8]. In order to achieve optimal conditions, the greenhouse, its
equipment, and crop should be captured in a dynamic mathematical model that deals with
the problem of maximizing profits [9]. The inside conditions are maintained within
appropriate boundaries by climate, lighting, and fertigation control. Each crop has its
4
optimal climate, lighting, water, and nutrition requirements, which are hard to find and
maintain. Decision-making regarding climate, lighting, and fertigation control is usually
done by agronomists. In order to understand what control actions to take, agronomists need
to understand the current values of the environmental parameters precisely. That is one of
the possible applications of the Internet of Things technology in greenhouse farming.
Sensors enable accurate remote monitoring over the greenhouse environment. This
monitoring capability can be extended to full automation of optimal conditions
maintenance by digital control agents and actuators.
The Autonomous Greenhouse Challenge competition held by Wageningen University in
2018 [10] has shown that IoT systems with implemented control agent for decision-making
can surpass experienced agronomists in climate control, fertigation and lighting and make
more profit from the sale of grown cucumbers. The designed system used both sensors and
actuators for climate control, lighting, and fertigation automation. This master’s thesis aims
to design a similar IoT solution for cannabis cultivation.
The drug derived from cannabis buds is used by people in medical purposes to relieve pain,
muscle spasms, headache, anxiety; improve sleep and appetite [11]. Cannabis cultivation
must be strictly regulated in accordance with the Single Convention on Narcotic Drugs
prepared by the United Nations in 1961 [12]. Recently, however, several governments
have begun to soften legislation on cannabis regulation, especially in the medical sphere.
According to Euromonitor International research company, the global legal cannabis
market was worth 12 billion US dollars in 2018 and is expected to grow to 166 billion US
dollars by 2025 [13]. This research is conducted based on one of the fastest growing
cannabis production companies in the Middle East. The researched company produces a
variety of medicines made of cannabis.
1.2 Goals and delimitations
The goal of this research is to collect, analyze, and specify requirements from the
researched company and create the architecture of the IoT system based on the
requirements. The IoT system should automate climate control, fertigation, and lighting to
maintain optimal conditions in greenhouses on the stage of adult cannabis plants cultivation.
5
Thus, the following research questions are addressed in the study:
1. What are the requirements of the IoT system for greenhouse farming from the
researched company perspective?
2. How should the high-view architecture of the IoT system look?
Delimitations reveal the topics which are out of the scope of the thesis. The research
doesn’t cover the following subjects: creation of detailed technical architecture of the IoT
system; development and performance evaluation of the described IoT system; topics
related to project management including cost estimation, scheduling, cost-benefit analysis;
detailed description of the control agent that is going to be used in the proposed IoT
system.
1.3 Structure of the thesis
Initially, the related works connected with IoT are reviewed. First, the basic theory of IoT
and its supporting technologies is given. Then IoT applications are reviewed, applications
in greenhouses are described in detail. Finally, the development stages of the IoT system
are presented with a focus on parts related to requirements and architecture. In the
methodology chapter classification of the research is provided, and research methods are
represented in detail. In the results chapter, first subchapter is dedicated to the description
of the researched company. The second subchapter presents the specified requirements of
the IoT system that were collected from the researched company. The third subchapter
describes the high-view architecture of the future system that was developed based on the
requirements, reviewed literature, and IoT reference architecture. The fourth chapter
presents the discussion and conclusions of the research, the most important outputs of the
conducted study, and the ideas for future research.

6
2 RELATED WORK
2.1 Internet of Things
According to [14], the term Internet of Things is referred to as:
• the global network interconnecting smart objects (common physical objects with
embedded electronics) by means of extended Internet technologies;
• the set of supporting technologies necessary to realize such a vision;
• the ensemble of applications and services leveraging such technologies to open new
business and market opportunities.
Industrial Internet of Things applications are supported by such technologies as wireless
sensor networks (WSNs), actuators, cloud computing, and IoT platforms. These
technologies are the most relevant in the research. They are described in this subchapter.
The first supporting technology is a wireless sensor network. Recent technological
advances have led to the appearance of efficient, low cost, low power miniature wireless
devices for use in remote sensing applications [3]. These devices can be called sensor
nodes or motes; WSN is a group of connected sensor nodes. WSNs demonstrated the lower
total cost of ownership compared to wired networks [15] and proven useful in a variety of
scenarios to collect environmental data (e.g., humidity, temperature, amount of rainfall,
light intensity) [16]. The sensor nodes are embedded in the physical entities that should be
monitored. One unit usually consists of four basic units: sensing unit, processing unit,
transceiver unit, and power supply [3]. The motes may also have additional units, including
a location finding system and power generator [17]. Sensing unit extracts data from the
environment by sensor probes and converts the obtained analog signal to a digital signal by
analog-to-digital converters [17]. The processing unit, which is associated with a small
storage unit, manages procedures to collaborate with other units in the network. Transceiver
unit connects the node to the network. Location finding system can be used in WSNs where
routing techniques or sensing tasks require knowledge of the node’s location [17].
Sensor nodes are low-power devices, which means they require a special low-power
network to communicate efficiently. Many communication technologies can be used in
7
WSNs and IoT applications. They include Bluetooth Low Energy (BLE), ZigBee, LoRa,
SigFox, Bluetooth, Long-Term Evolution (LTE), General Packet Radio Services (GPRS),
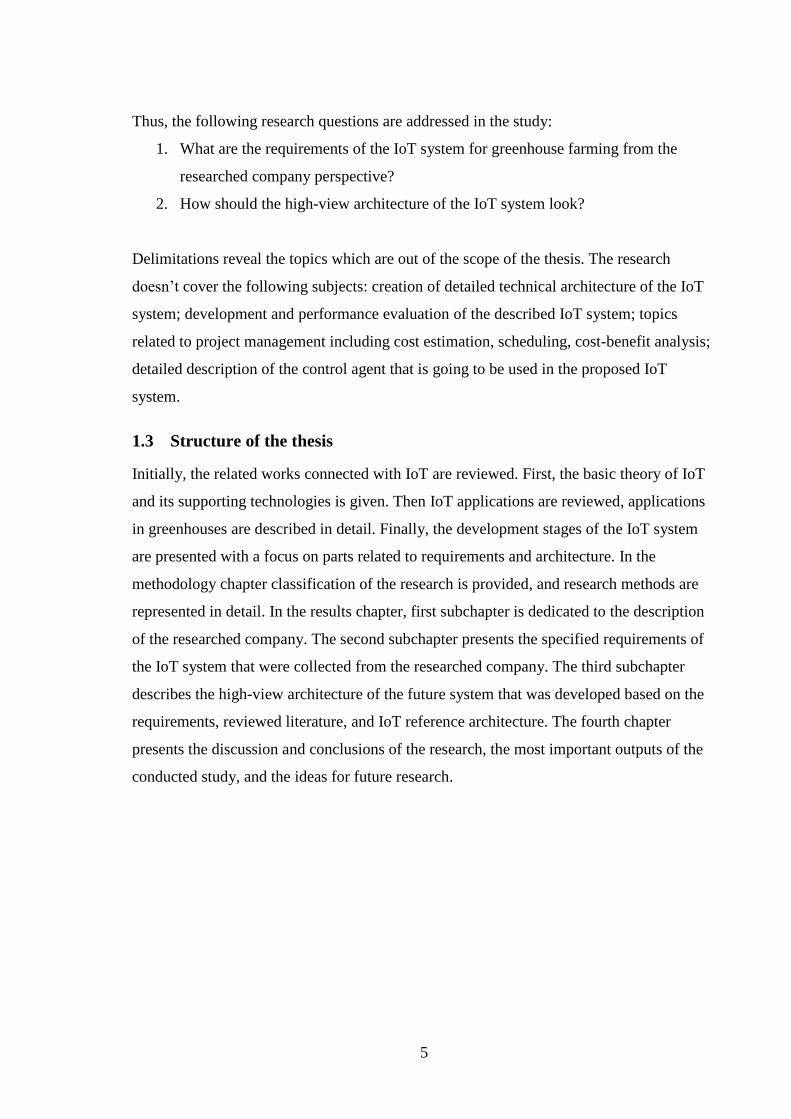
WiFi. The choice of specific technology primarily depends on power consumption and
communication distance. Power consumption and communication distances of mentioned
technologies are represented in Fig. 1.
Fig. 1. Power consumption (mW) and communication distance (m) of communication
technologies. [18]
ZigBee technology provides the best tradeoff between power consumption and
communication distance for greenhouse application. ZigBee is a low-cost wireless personal
area network (WPAN) that was designed for battery-powered devices; it has a sleep mode
feature to extend the battery lifetime [18]. ZigBee wireless protocol is considered one of
the best candidate technologies for the agriculture and farming domains even though it
reduces the communication distance by up to 30 meters in indoor conditions such as
greenhouse [18]. ZigBee does not provide capabilities to connect devices to a remote
server directly. Physical gateways are used for this purpose to bridge WPAN like ZigBee
with other networks like the Internet or other wide area networks (WANs) [19]. Gateway
nodes have higher processing capability, battery power, and transmission (radio) range
than sensor nodes [20].
The second supporting technology is actuators (in some scientific papers they are called
actors). Actuators are devices that convert energy into motion; they drive the motion into
mechanical systems [21]. These machines execute decisions either rendered by humans or
software-agents on their behalf [22] usually based on data from sensors. The information
flow in the IoT systems that use actuators is not unidirectional (from the sensors to the
gateway), but bi-directional (sensors to gateway and controller node to actuators) [16],

8
[16]. The three types of actuators are electrical, hydraulic, and pneumatic [21]. Electrical
actuators are alternating current and direct current motors, stepper motors and solenoids.
Hydraulic actuators use hydraulic fluid to actuate motion. Pneumatic actuators use
compressed air to actuate motion. Unlike sensors, actors are resource-rich nodes [23] that
are rigidly connected to physical entities [24] in the greenhouse case. The number of actors
is usually much less than the number of sensors in the IoT applications [23]. These
differences make wireless actuators not as attractive as wireless sensors and leave the
option of using wired actuators in IoT systems.
The third supporting technology is cloud computing. According to [25] cloud computing is
a model for enabling ubiquitous, convenient, on-demand network access to a shared pool
of configurable computing resources (e.g., networks, servers, storage, applications, and
services) that can be rapidly provisioned and released with minimal management effort or
service provider interaction. While IoT devices (sensors and actuators) have limited
storage and processing capacity, cloud computing has virtually unlimited capabilities in
terms of storage and processing power [26]. The high computing power of the cloud allows
to process large amounts of data quickly and use complex algorithms to automate processes.
There are three types of service models for accessing cloud capabilities. According to [25],
they include:
• Software as a Service (SaaS). The capability provided to the consumer is to use the
provider’s applications running on a cloud infrastructure;
• Platform as a Service (PaaS). The capability provided to the consumer is to deploy
onto the cloud infrastructure consumer-created or acquired applications created
using programming languages, libraries, services, and tools supported by the
provider;
• Infrastructure as a Service (IaaS). The capability provided to the consumer is to
provision processing, storage, networks, and other fundamental computing
resources where the consumer can deploy and run arbitrary software, which can
include operating systems and applications.
The fourth supporting technology is IoT platforms. According to [27], the IoT system can
be decomposed into three layers: users or applications; IoT platform; devices and
9
infrastructure. Users and applications layer addresses the users and auxiliary applications,
such as decision support tools. IoT platform is a software package that integrates devices,
networks, and applications. Devices and infrastructure layer includes network devices and
other physical IoT infrastructure. IoT platforms are the focus of this paragraph. IoT
platform can be seen as a software layer that sits between applications and objects
(devices) [28]. It aims to provide solutions to frequently encountered problems, such as
heterogeneity, interoperability, security, and dependability [29]. IoT and cloud computing
development lead to the emergence of cloud-based IoT platforms that leverage the IoT
system resources. According to [30], Amazon Web Services (AWS), Microsoft Azure, and
Google Cloud are the most popular cloud providers. All these providers have their own
cloud-based IoT services.
There are also other technologies that support the Internet of Things applications. They
include radio-frequency identification, near-field communication, digital twin, machine to
machine, cyber-physical systems, and others.
2.2 IoT applications
There are various applications of IoT in different industries. Examples are predictive
maintenance [31] and smart factory [32] applications in manufacturing; smart grids in
energy industry [33]; automated checkout in retail [34]; health monitoring in healthcare
[35]; items location tracking in supply chain industry [36]; pest and disease detection [37]
and environment monitoring in agriculture. There are also non-industry applications such
as electric devices management in homes [38] or street lighting control in cities [39]. This
thesis focuses on applications in greenhouse farming.
IoT applications in greenhouses relate to many different concepts, including precision
agriculture, smart agriculture (smart farming), and autonomous greenhouses. The objective
of precision agriculture is to improve the control of input variables such as fertilizer, seed,
chemicals or water concerning the desired outcomes of increased profitability, reduced
environmental risk or better product quality [40]. Precision agriculture is driven by sensing
technologies which are part of IoT. Smart agriculture or smart farming concept represents
the application of modern information technologies (IT) into agriculture [41]. IoT can be

10
seen as one of these technologies. Autonomous greenhouses are described as greenhouses
driven by IoT and artificial intelligence (AI) that can operate without human interventions.
The possible purposes for applying IoT in greenhouse farming are the following:
continuous control over facility [42], reduced human labour [43], reduced water usage
[43], [44], reduced energy usage [43], [44], minimized environmental impact [44],
enhanced production safety [42], improved crop health [45], improved crop quality [44],
increased yields [43], [45], diseases prevention [46].
In this thesis, the author distinguishes the applications by two criteria: information flow
type and computing power localization. The applications that have only sensors to gateway
information flow are called unidirectional; the applications that also have a controller node
to actuators information flow are called bi-directional [16]. The applications that use
remote cloud capabilities are called cloud-based; other applications that do not use cloud
computing power are called local in accordance with [47].
The unidirectional applications include monitoring, alerting, and data analytics systems.
These applications are based only on WSNs and do not provide capabilities to act on the
environment by use of actuators. Monitoring systems are used to support decision making
regarding climate, irrigation, fertigation, and lighting control. Systems with alerting
capabilities allow to identify deviations in environmental parameters and emergency events
(e.g., diseases or pests) in time and quickly respond to them. Data analytics systems are
used in cases that require predictions to be made. The bi-directional applications include
remote manual control systems, partly automated control systems, and fully automated
control systems. These applications are based on sensor and actuator networks and provide
capabilities to act on the environment by use of actuators (actors).
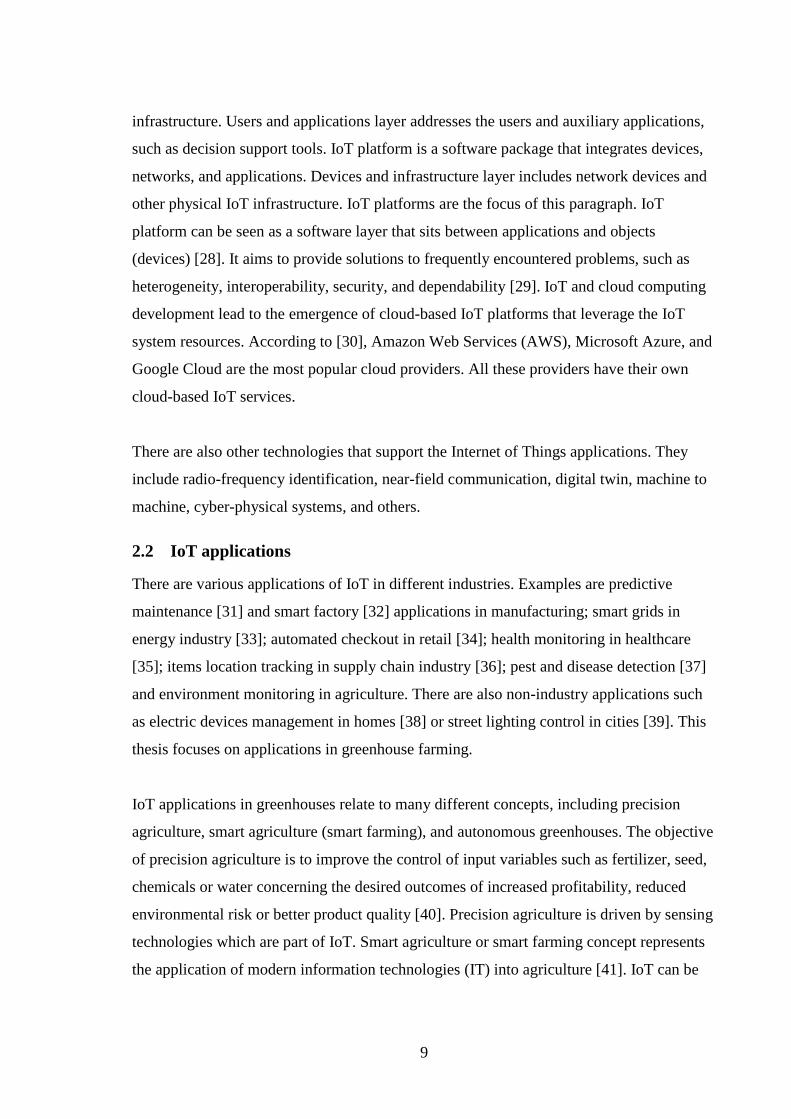
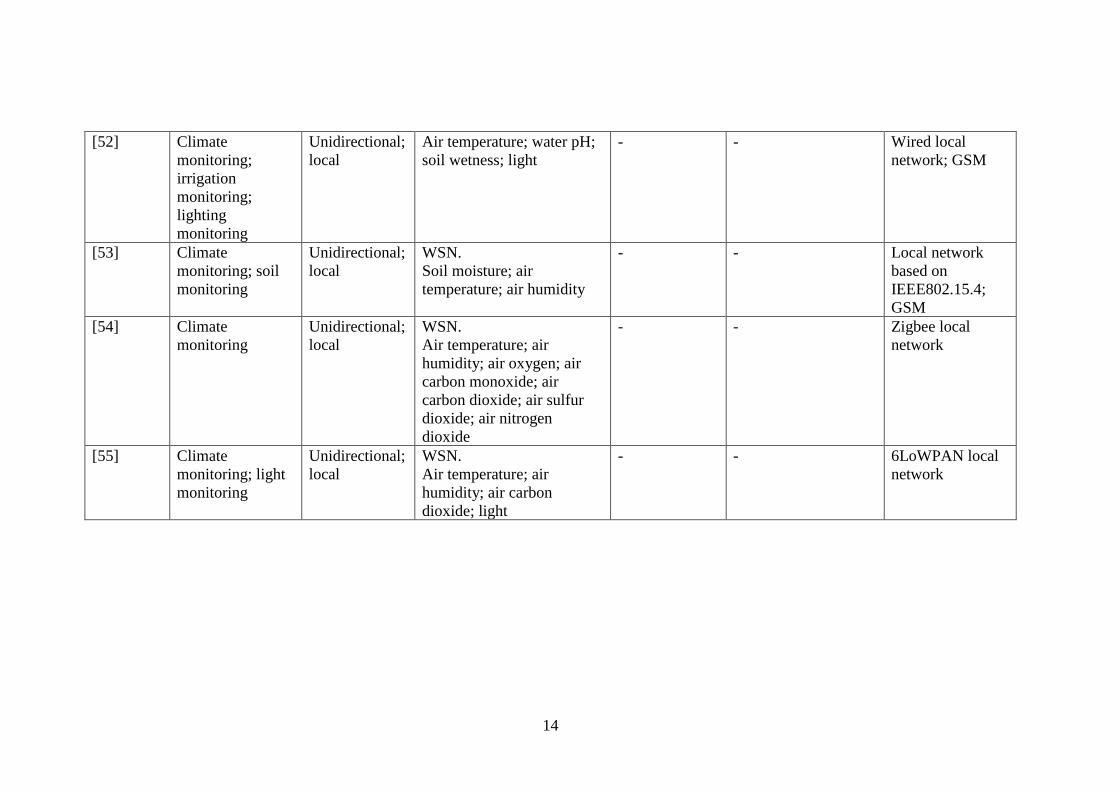
Table 1 aggregates the IoT and WSN applications in greenhouse farming field that were
captured in scientific literature and other sources. The purpose of the table is to present
approaches to IoT and WSN usage in greenhouse cultivation proposed by different
researchers earlier. Sensors, actuators, networks, and control agents were outlined as the
most important components in the architectures of described systems.

11
Table 1. IoT and WSN applications in greenhouse farming.
Reference Application Type Sensing
layer
Control
layer
Actuation
layer
Communication
layer
[48] Climate
automation;
fertigation
automation;
lighting
automation
Bi-directional;
cloud-based
Air temperature; air
humidity; leaf wetness;
cameras; the rest is not
specified
Reinforcement
learning
algorithm
Ventilation; heating;
artificial lighting; the
rest is unclear
Not specified
[45] Climate
automation;
irrigation alerting;
pests alerting;
climate data
analysis
Bi-directional;
local
WSN.
Air temperature; air
humidity; air temperature
near canopy; air humidity
near canopy; outside
weather
Fuzzy climate
controller
Actuator network
using RS-485
protocol.
Roof vents; exhaust
fan; cooling pad;
heaters
Zigbee-like local
network for
sensors, RS-485
protocol for
actuators
[44] Climate
automation and
alerting; irrigation
automation and
alerting; light
automation and
alerting
Bi-directional;
cloud-based
WSN.
Soil moisture; soil
temperature; air
temperature; air humidity;
light; water pH; water
electrical conductivity
(EC); water nitrogen; water
phosphorus; water
potassium; crop growth by
the camera
Not specified Fertigation system;
heater; lamps;
humidifier; water
pump; electro-valves;
air conditioning;
windows
WiFi and
Bluetooth Low
Energy as local
networks; the
Internet as WAN

12
[49] Climate
automation; light
automation
Bi-directional;
local
Air temperature; air
humidity; air carbon
dioxide; light
Fuzzy climate
controller
Artificial lighting;
window shutter; CO2;
solenoid valve;
humidifier; heaters;
ventilation
Zigbee local
network; Global
System for
Mobile
Communications
(GSM)/GPRS
[50] Irrigation
automation;
lighting
automation;
climate
automation
Bi-directional;
local
WSN.
Air temperature; air
humidity; light; pH; EC;
soil humidity
Not specified Window; shadow;
heater; fan; water
pump
Zigbee local
network
[46] Automated dew
condensation
prevention
Bi-directional;
local
WSN.
Air temperature; air
humidity; rain
Not specified Windows; ventilators;
heaters; circulating
fan
Zigbee local
network; Internet
WAN
[51] Irrigation
automation;
lighting
automation;
climate
automation
Bi-directional;
local
WSN.
Soil humidity; soil
temperature; soil pH; soil
EC; air temperature; air
pressure; air humidity; air
carbon dioxide; inside light;
outside wind flow; outside
wind direction; outside
light; outside temperature;
outside pressure; outside
humidity; outside carbon
dioxide
Event-based
controller
Ventilation; heating
system; screen shade;
sprinkler
Not specified
13
[24] Air temperature
and humidity
level automation
Bi-directional;
local
WSN.
Air temperature; air
humidity
Not specified Irrigation valves; air
humidifiers; heaters;
electric fans; motors
Zigbee and wired
controller area
local networks
[43] Irrigation
automation;
artificial lighting
automation; air
temperature and
humidity level
automation; water
level in tank
alerting
Bi-directional;
not specified
Air temperature; air
humidity; soil moisture;
light; water level
Not specified Water pump; lights;
relay attached to the
fogger
GSM
[15] Climate
monitoring;
lighting
automation
Bi-directional;
not specified
WSN.
Light; air temperature; air
humidity
Not specified Light RS-232 wired
local network;
Internet as WAN;
the local wireless
network is not
specified
[42] Climate
automation;
irrigation
automation; light
automation
Bi-directional;
local
Air temperature; air
humidity; light; pH; water
level
Fuzzy
controller
Water pump; fan;
window shutter
The local network
is not specified;
GSM
[4] Air temperature
and humidity
level monitoring
Unidirectional;
local
WSN.
Air temperature; air
humidity
- - Local network
based on
IEEE802.15.4
14
[52] Climate
monitoring;
irrigation
monitoring;
lighting
monitoring
Unidirectional;
local
Air temperature; water pH;
soil wetness; light
- - Wired local
network; GSM
[53] Climate
monitoring; soil
monitoring
Unidirectional;
local
WSN.
Soil moisture; air
temperature; air humidity
- - Local network
based on
IEEE802.15.4;
GSM
[54] Climate
monitoring
Unidirectional;
local
WSN.
Air temperature; air
humidity; air oxygen; air
carbon monoxide; air
carbon dioxide; air sulfur
dioxide; air nitrogen
dioxide
- - Zigbee local
network
[55] Climate
monitoring; light
monitoring
Unidirectional;
local
WSN.
Air temperature; air
humidity; air carbon
dioxide; light
- - 6LoWPAN local
network
15
As can be seen from the table, most of the applications are local and do not use the cloud.
The novelty of this technology and the high cost of its implementation in the past may be
the reason for low cloud adoption in the researched IoT applications. WSNs were used in
most of the applications due to its flexibility and low cost compared to wired solutions
[55]. On the contrary, none of the research papers reported the application of wireless
actuator network. The network of actuators was not specified in most of the cases. Only
[45] provided details about the actuators; wired actuator network based on RS-485
communication protocol was used in the research. Zigbee was chosen by most of the
authors as the local network in their greenhouses. The reason for it is low-power
consumption, low cost of implementation, and sufficient communication range for
greenhouses [50]. Cameras were the additional items that were used in the sensing layer.
[48] and [44] reported camera usage for crop monitoring. Most of the researchers reported
the application of fuzzy logic controllers for automatic process control. Fuzzy logic
controllers are conceptually very simple. On the first stage, they map sensors and other
inputs to the appropriate membership functions and truth values; then they invoke the
appropriate rules and generate a result for each; finally, on the output stage, they convert
the combined results into a specific control output value [56]. As opposed to most of the
applications that utilized simple controllers, in [48], authors developed a highly
sophisticated reinforcement learning algorithm that controlled all the main processes in a
greenhouse. The researchers reported significant efficiency of the applied controller. One
of the challenges stated in a couple of research papers was shortened communication
distance between nodes in greenhouses. High humidity and dense plant growth reduced the
communication range in the greenhouse to one-third of the respective communication
range in open space according to [55].
Many authors of the scientific papers concluded that application of IoT and WSNs were
valuable in their cases and shared plans to continue research in the area. For instance, [49]
stated that energy and water savings could achieve 22% and 33% respectively in their case.
In [48], the authors reported that the net profit of their IoT-driven autonomous system was
17 percent higher than that of expert growers who performed all the operations manually.
16
2.3 IoT system development
This subchapter focuses on IoT system development. IoT system development stages are
very similar to the ones of software engineering because the software is a fundamental part
of IoT applications. According to the waterfall model of software lifecycle the following
stages can be highlighted: system feasibility with subsequent validation, software plans and
requirements with subsequent validation, product design with subsequent verification,
detailed design with subsequent verification, code with subsequent unit test, integration
with subsequent product verification, implementation with subsequent system test,
operations and maintenance with subsequent revalidation [57]. In this thesis, the focus is
on the requirements and product design (high-view architecture). These stages of IoT
system development are described below separately.
2.3.1 IoT system requirements development
Due to a lack of scientific literature on IoT system requirements, this section is based
mostly on software requirements development. As was stated earlier, it does not differ
much from IoT system development.
According to [58], the path to quality software begins with excellent requirements. Karl
Wiegers distinguishes several types of requirements:
• Business requirements represent the high-level objectives of the organization or
customer requesting the system or product;
• User requirements describe the tasks that users must be able to perform using the
new product;
• Functional requirements itemize the specific behaviors the software must exhibit;
• Non-functional requirements include quality attribute goals, performance
objectives, business rules, design, and implementation constraints, and external
interface requirements.
Karl Wiegers suggests using three types of documents or containers which should
aggregate different types of requirements. Business requirements should be collected in
vision and scope document; user requirements should be represented in use cases;
functional requirements should be in software requirements specification. Requirements
types, containers, and their relations are represented in Fig. 2.

17
Fig. 2. Requirements types and their containers. [58]
Requirements are unique for every single application. However, there are some quality
attributes which are relevant in most of the cases in software development. Karl Wiegers
highlighted the general quality attributes of software systems which are represented in Fig.
3 with clarifications.
Fig. 3. Quality attributes of software systems. [59]
A couple of authors concentrated their work specifically on requirements of IoT systems.
In [60], authors describe such quality attributes of IoT systems as scalability, flexibility,
interoperability, diverse Quality of Service support, and security. In [61], authors concentrated
on security-related requirements of IoT system and highlighted the following characteristics:
access control, authorization, data integrity, authentication, contextual integrity.

18
2.3.2 IoT system architecture creation
Creation of IoT architectures starts from more abstract IoT reference model. IoT reference
model shows the abstract elements of the general IoT system and interactions between them.
Several standards describe the reference model and reference architecture of IoT systems.
The most well-known ones are ISO/IEC 30141 from International Organization for
Standardization (ISO) and IoT-A standard developed during the project, conducted between
2010 and 2013 and funded by the European Union. Since ISO/IEC 30141 is not available for
open academic access and strictly protected by copyright, the content of the section will be
based on the open access book [62] that summarizes the results of the IoT-A project.
The IoT Reference Model provides the concepts and definitions on which IoT architectures
can be built. The Reference Model consists of several sub-models that set the scope for the
IoT design space. The sub-models are IoT Domain Model, IoT Information Model, IoT
Functional Model, IoT Communication model and IoT Trust, Security, and Privacy Model.
Only the IoT Domain Model is described in this thesis. Details about other models can be
found in [62].
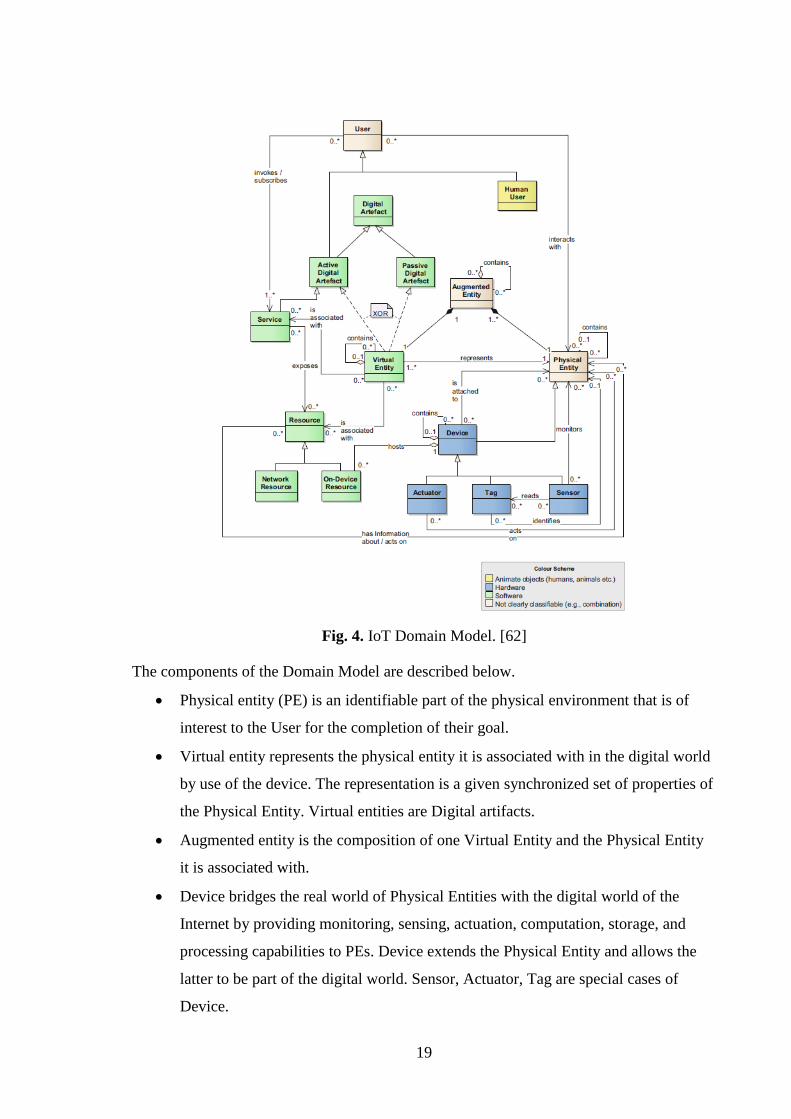
IoT Domain Model is the key model, which describes all the concepts that are relevant to
the Internet of Things. The IoT Domain Model is designed in Unified Modeling Language
(UML) and is represented in Fig. 4.
19
Fig. 4. IoT Domain Model. [62]
The components of the Domain Model are described below.
• Physical entity (PE) is an identifiable part of the physical environment that is of
interest to the User for the completion of their goal.
• Virtual entity represents the physical entity it is associated with in the digital world
by use of the device. The representation is a given synchronized set of properties of
the Physical Entity. Virtual entities are Digital artifacts.
• Augmented entity is the composition of one Virtual Entity and the Physical Entity
it is associated with.
• Device bridges the real world of Physical Entities with the digital world of the
Internet by providing monitoring, sensing, actuation, computation, storage, and
processing capabilities to PEs. Device extends the Physical Entity and allows the
latter to be part of the digital world. Sensor, Actuator, Tag are special cases of
Device.

20
• Sensor provides information, knowledge, or data about the Physical Entity they
monitor. In this context, this ranges from the identity of the Physical Entity to
measures of the physical state of the Physical Entity. Sensor is a Device.
• Actuator can modify the physical state of a Physical Entity. Actuator is a Device.
• Tag identifies the physical entity it is physically attached to. Tag is a Device.
• Resources are software components that provide some functionality. When
associated with a Physical Entity, they either provide some information about or
allow changing some aspects in the digital or physical world pertaining to one or
more Physical Entities.
• Network resources are software components that provide some functionality and
are run not on the device.
• On-device resource is a software component that provides some functionality and
runs on the device. Examples are sensing resources, actuating resources, data
storing resources.
• Services expose the functionality, usually of a Device, by accessing its hosted
Resources; provide access to information at a Virtual Entity level. Service is an
active digital artifact.
• Digital artifact is a software element (e.g., a Service, an application, or a software
agent). Active digital artifact, Passive digital artifact, Service are special cases of
Digital artifact.
• Active digital artifacts are running software applications, agents, or Services that
may access other Services or Resources. Active digital artifact is User.
• Passive digital artifact is a passive software element such as database entry that can
be a digital representation of the Physical Entity.
• User is a human person or Active Digital Artefact that needs to interact with a
Physical Entity.
• Human user is a human person; a special case of a User.
The domain model and other models provide common ground for IoT architects. The
models form an abstract framework that comprises a minimal set of unifying concepts,
axioms, and relationships for understanding significant relationships between the entities
of an IoT environment [62]. The framework enables the development of specific
21
architectures, which are more specific than models. [62] proposes a special process of
creating architectures based on the models. The relations between the models and
architectural views that are used in the process of specific architectures creation are
represented in Fig. 5.
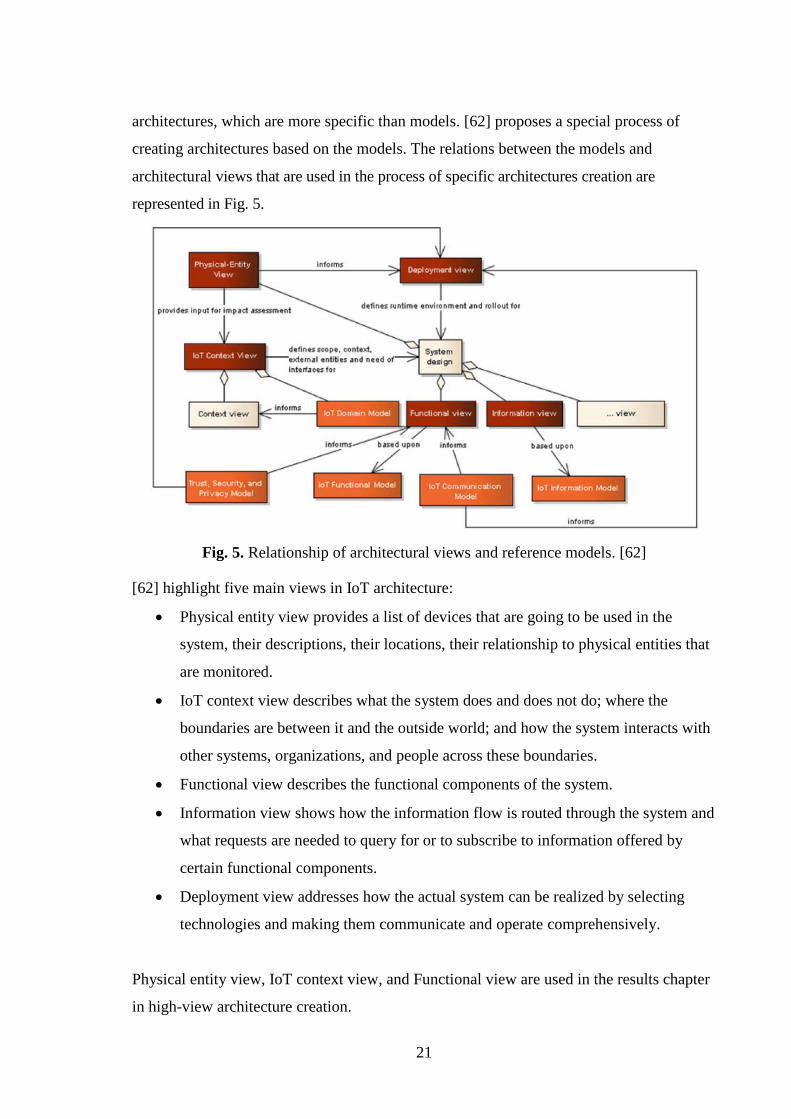
Fig. 5. Relationship of architectural views and reference models. [62]
[62] highlight five main views in IoT architecture:
• Physical entity view provides a list of devices that are going to be used in the
system, their descriptions, their locations, their relationship to physical entities that
are monitored.
• IoT context view describes what the system does and does not do; where the
boundaries are between it and the outside world; and how the system interacts with
other systems, organizations, and people across these boundaries.
• Functional view describes the functional components of the system.
• Information view shows how the information flow is routed through the system and
what requests are needed to query for or to subscribe to information offered by
certain functional components.
• Deployment view addresses how the actual system can be realized by selecting
technologies and making them communicate and operate comprehensively.
Physical entity view, IoT context view, and Functional view are used in the results chapter
in high-view architecture creation.
22
3 METHODOLOGY
The research consists of four central actions: systematic related works review,
requirements development, IoT system architecture creation, and architecture verification.
The first subchapter presents the general methodology and classification. The specific
methods applied for each action are given in subchapters 3.2 - 3.5.
3.1 Research classification
Before moving to subchapters with the description of specific methods, it is important to
classify the research for better understanding of what was done in the study and what is the
place of the research in science. The classification method that is used in the study is based
on Pasteur's quadrant from [63], the research «onion» from [64], the Jarvinen’s taxonomy
of research methods [65] and research framework in information technology from [66].
The research was inspired by the results of the Autonomous Greenhouses Challenge
competition held by Wageningen University in 2018 [10] where the IoT system with
applied AI outperformed professional agronomists in cucumber cultivation. In this
research, the author tries to create a model of a similar IoT solution that can replicate the
results of Autonomous Greenhouse Challenge for cannabis cultivation. The research is
conducted on the base of a pharmaceutical company and aims to solve its specific
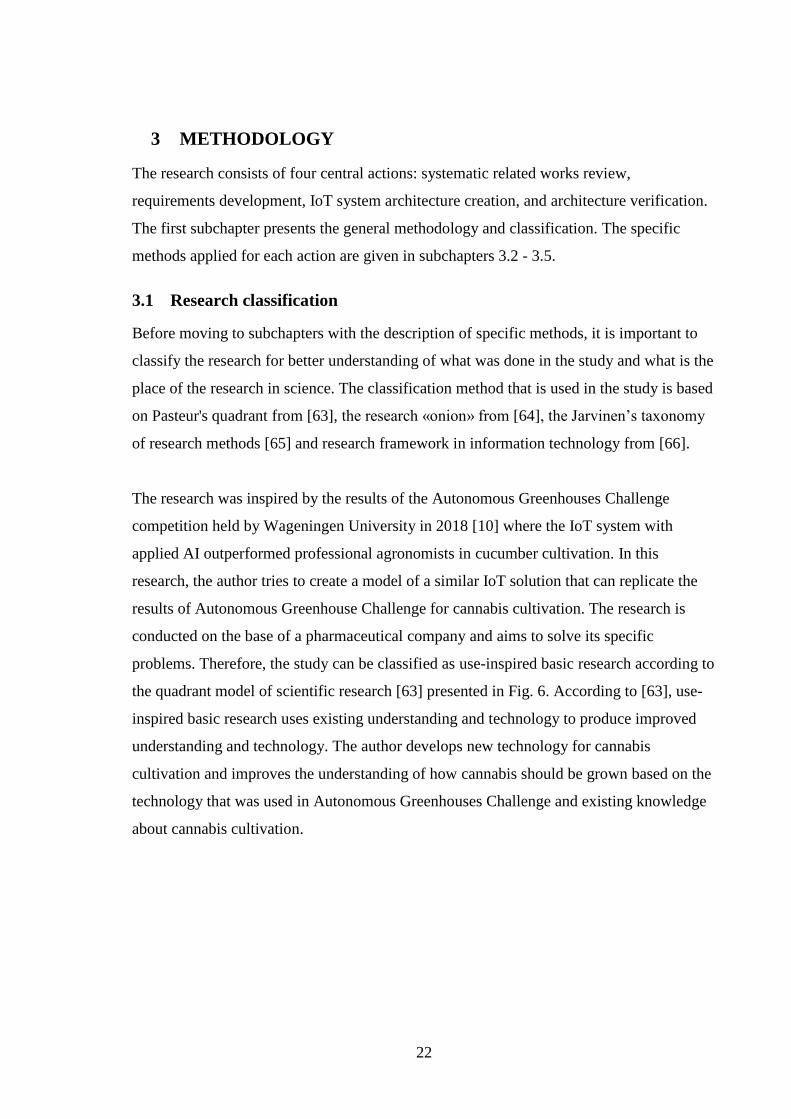
problems. Therefore, the study can be classified as use-inspired basic research according to
the quadrant model of scientific research [63] presented in Fig. 6. According to [63], use-
inspired basic research uses existing understanding and technology to produce improved
understanding and technology. The author develops new technology for cannabis
cultivation and improves the understanding of how cannabis should be grown based on the
technology that was used in Autonomous Greenhouses Challenge and existing knowledge
about cannabis cultivation.
23
Fig. 6. Quadrant model of scientific research. [63]
According to [64], credible research philosophy underpins methodological choice, research
strategy, and data collection techniques with analysis procedures. It allows designing a
coherent research project, in which all elements of research fit together. The philosophy of
this research is pragmatism. In pragmatic research theories, concepts, ideas, hypotheses,
and research findings are considered not in an abstract form, but in terms of the roles they
play as instruments of thought and action, and in terms of their practical consequences in
specific contexts. Pragmatic research starts with a problem and aims to contribute practical
solutions that inform future practice [64].
After research philosophy is defined, an approach to theory development should be chosen.
Even though theory development is not the primary goal of the research, the theoretical
conclusions are still present. The approach that is used in this study is induction. In induction,
the researcher moves from the specific to the general; he uses data collection to explore the
phenomenon, identify patterns, and create a conceptual framework [64].
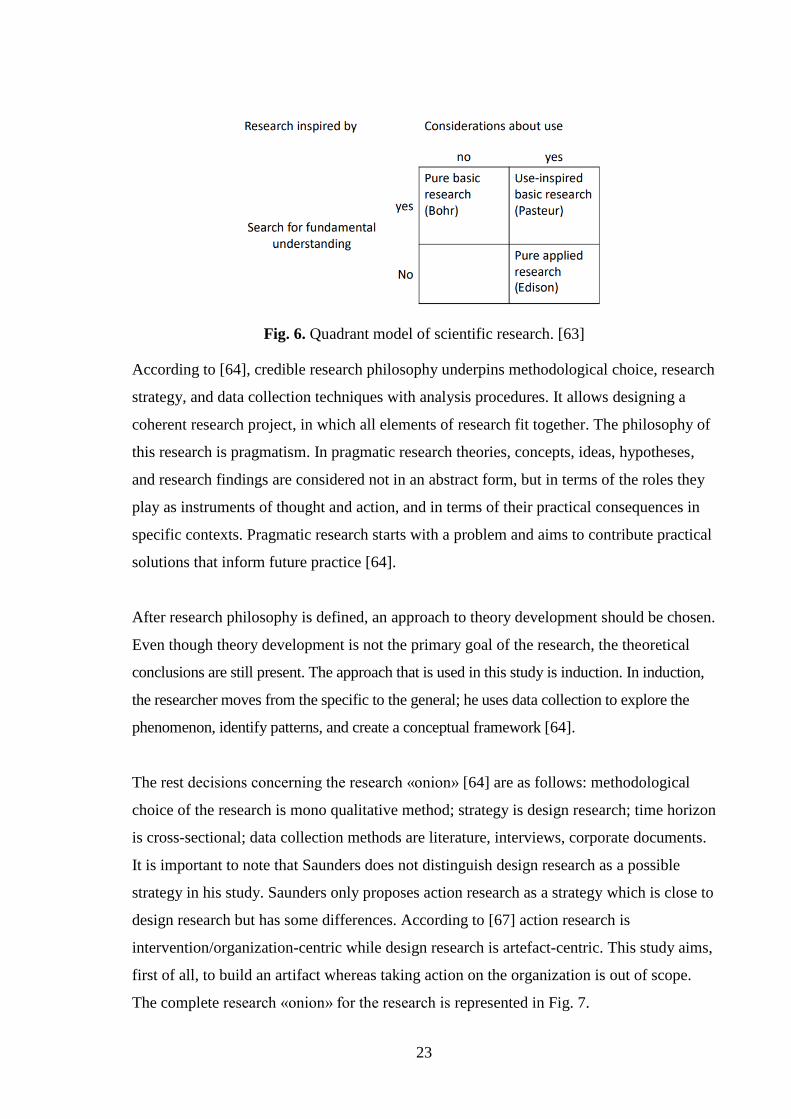
The rest decisions concerning the research «onion» [64] are as follows: methodological
choice of the research is mono qualitative method; strategy is design research; time horizon
is cross-sectional; data collection methods are literature, interviews, corporate documents.
It is important to note that Saunders does not distinguish design research as a possible
strategy in his study. Saunders only proposes action research as a strategy which is close to
design research but has some differences. According to [67] action research is
intervention/organization-centric while design research is artefact-centric. This study aims,
first of all, to build an artifact whereas taking action on the organization is out of scope.
The complete research «onion» for the research is represented in Fig. 7.
24
Fig. 7. Research methodology structure.
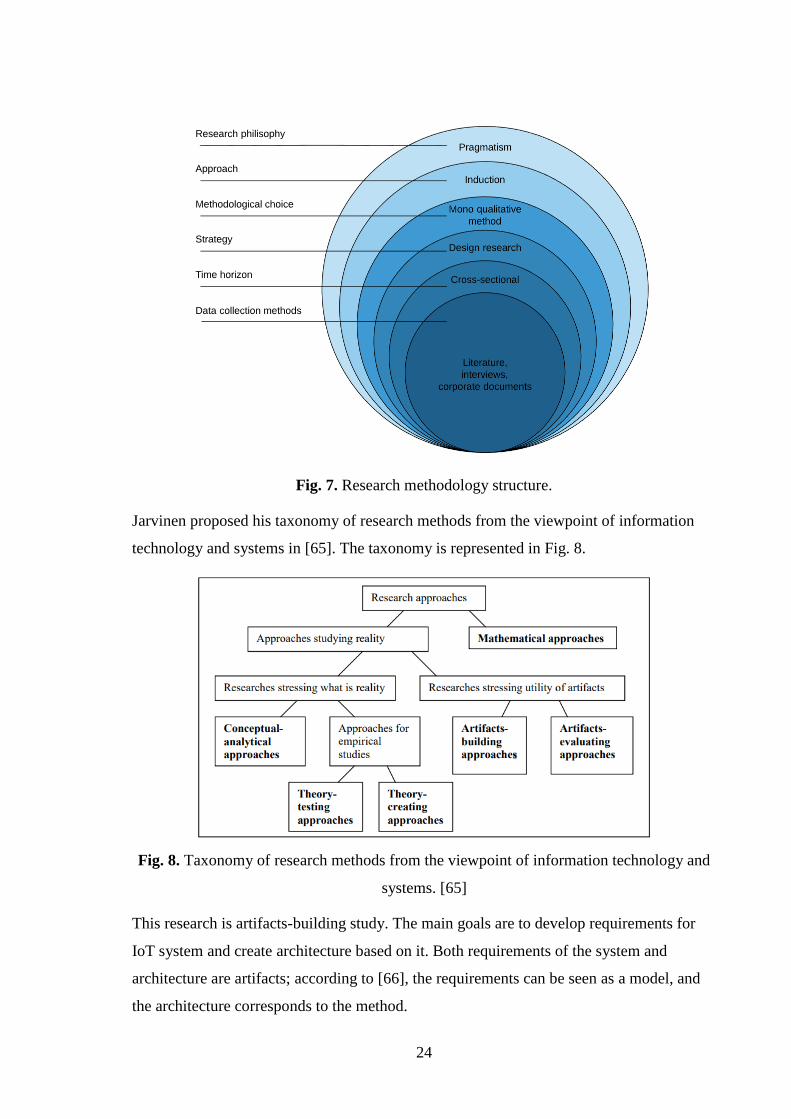
Jarvinen proposed his taxonomy of research methods from the viewpoint of information
technology and systems in [65]. The taxonomy is represented in Fig. 8.
Fig. 8. Taxonomy of research methods from the viewpoint of information technology and
systems. [65]
This research is artifacts-building study. The main goals are to develop requirements for
IoT system and create architecture based on it. Both requirements of the system and
architecture are artifacts; according to [66], the requirements can be seen as a model, and
the architecture corresponds to the method.

25
March and Smith propose a research framework in information technology that is driven
by the distinction between research activities and research outputs [66]. The framework
applied for this research is represented in Table 2.
Table 2. Research framework in information technology applied to the thesis.
Research activities
Build Evaluate Theorize Justify
Research
outputs
Constructs
Model
Method
Instantiation
The first dimension of the framework is based on design science research outputs or
artifacts: constructs, models, methods, and instantiations. The second dimension is based
on broad types of design science and natural science research activities: build, evaluate,
theorize, and justify. This four by four framework produces sixteen cells describing viable
research efforts. Different cells have different objectives and appropriate methods. In this
research, efforts cover multiple cells of the framework, as can be seen from the table.
3.2 Related works review methods
Most of the related works were found in Google Scholar, LUT Finna, Scopus, and IEEE
databases and digital libraries. The search queries that were used included such keywords
as «Internet of Things», «IoT», «IoT architecture», «IoT platform», «WSN», «climate
control», «fertigation control», «lighting control», «irrigation control», «greenhouse
farming», «CEA», «smart farming», «precision agriculture» and others. As a result, a huge
number of scientific papers were found. It was necessary to select the most appropriate.
Thus, the results of each search query were sorted by citation count, and then the latest
research papers with high citation count were opened. Firstly, the author went through
abstract; secondly, figures, graphs, and charts were checked; finally, if something
interesting was spotted, the author read results and conclusions or the whole research. The
papers that provided new information on the topic were saved to Zotero reference
management software for systematization and more convenient work with citations and
bibliography afterward.
26
After the process of selection was finished, all the research papers were read again for
further analysis. The most important information was highlighted with the use of a special
commenting tool in Adobe Acrobat Reader document management system. When the
analysis was done, the chapter of the related work was split, and the information from
selected researches was put into associated subchapters.
3.3 Requirements development methods
Requirements engineering consists of two stages: requirements development and
requirements management [59]. Requirements development is in focus of the research. It
consists of requirements elicitation, analysis, specification, and validation.
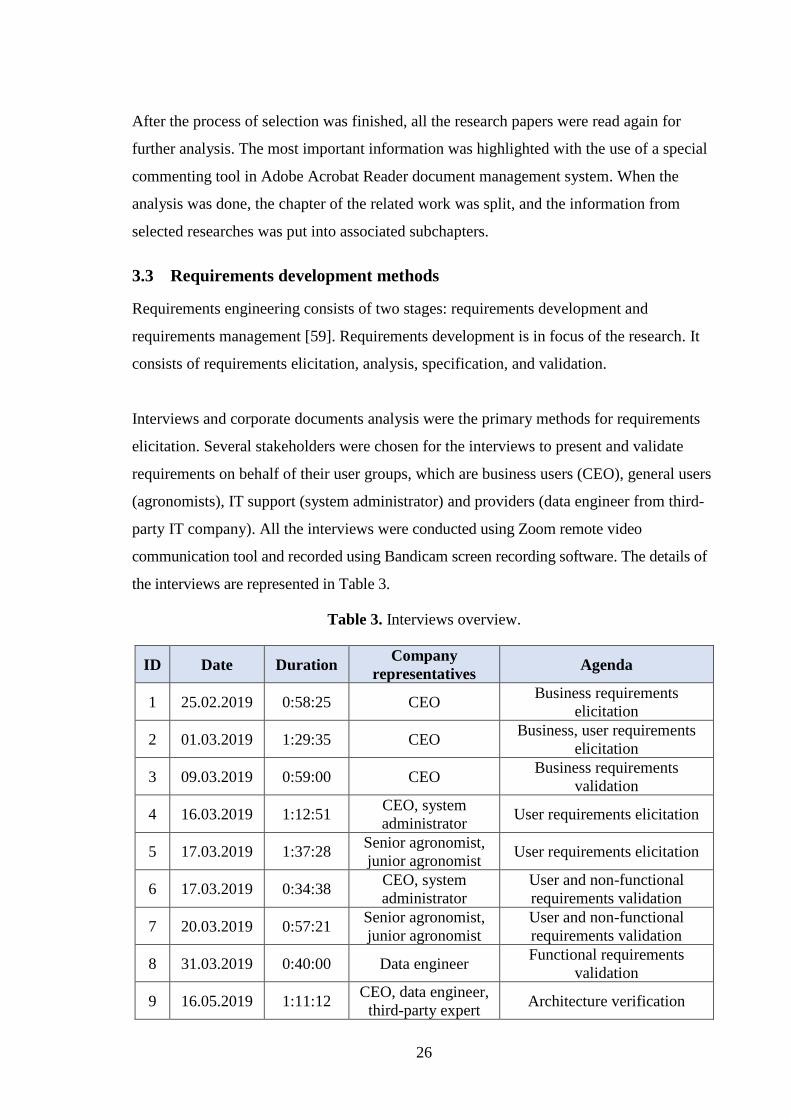
Interviews and corporate documents analysis were the primary methods for requirements
elicitation. Several stakeholders were chosen for the interviews to present and validate
requirements on behalf of their user groups, which are business users (CEO), general users
(agronomists), IT support (system administrator) and providers (data engineer from third-
party IT company). All the interviews were conducted using Zoom remote video
communication tool and recorded using Bandicam screen recording software. The details of
the interviews are represented in Table 3.
Table 3. Interviews overview.
ID Date Duration Company
representatives Agenda
1 25.02.2019 0:58:25 CEO Business requirements
elicitation
2 01.03.2019 1:29:35 CEO Business, user requirements
elicitation
3 09.03.2019 0:59:00 CEO Business requirements
validation
4 16.03.2019 1:12:51 CEO, system
administrator User requirements elicitation
5 17.03.2019 1:37:28 Senior agronomist,
junior agronomist User requirements elicitation
6 17.03.2019 0:34:38 CEO, system
administrator
User and non-functional
requirements validation
7 20.03.2019 0:57:21 Senior agronomist,
junior agronomist
User and non-functional
requirements validation
8 31.03.2019 0:40:00 Data engineer Functional requirements
validation
9 16.05.2019 1:11:12 CEO, data engineer,
third-party expert Architecture verification
27
All the video records with interviews were manually transformed into text format for further
analysis. The requirements list was checked on repeating, contradictory, ambiguous, infeasible,
unverifiable, and unnecessary requirements. Company representatives were contacted via
messenger for clarifications of requirements when they were unclear. If the problem needed an
extended discussion, it was raised in separate requirements validation calls.
The business requirements were collected from the CEO of the researched company.
Possible metrics that can be used to evaluate the level of achievement of each business
requirement were developed for each business need. The most important metrics were
singled out among the rest and specified in the success criteria section. These metrics are
going to be used to assess the success of the project upon its completion. The CEO
prioritized selected metrics according to 1 to 5 conventional scale.
The user requirements were collected from the CEO, system administrator, senior
agronomist, and junior agronomist. The user requirements were analyzed and put into
simple user stories. The user stories were chosen instead of use cases because the
information that was collected in interviews 4 and 5 was not detailed enough to develop
use cases. Also, user stories helped to simplify the overall work with requirements.
The author developed functional and non-functional requirements based on the collected
business requirements and user stories. Functional requirements were mapped to
corresponding user stories, whereas non-functional requirements were specified separately.
Functional and non-functional requirements were validated in interviews 6, 7, and 8.
Corporate documents analysis was used as the additional requirements elicitation method.
Three corporate documents describing the company in general, its production process, and
the design of greenhouses were obtained and studied for a better understanding of the
requirements that were collected in the interviews.
The IoT system requirements subchapter aggregated all the requirements. The subchapter’s
structure is partly based on templates for requirements specification proposed by Karl Wiegers.

28
The specified requirements were demonstrated to the stakeholders for their feedback
during validation interviews. Specifications were updated based on collected comments
and send back to stakeholders via messengers; if stakeholders detected some more
problems, the process of updating specifications and requesting new feedback repeated.
Thus, the acceptance test was conducted in the form of continuous informal ad hoc
reviews. The specified requirements were checked on the completeness, correctness,
feasibility, necessity, priority, unambiguity, verifiability as recommended in [59].
3.4 IoT system architecture creation and verification methods
The architecture was developed based on the process and the models proposed in [62] for
specific architecture creation. The information from the reviewed literature was
considered; the final version of specified requirements from the researched company was
deeply analyzed. After that, a couple of solutions from well-known vendors were
reviewed. The solutions from Libelium for physical devices and from AWS for digital
services were evaluated as the most optimal ones for the case of the researched company.
The data that was collected from the researched company was not enough for the creation
of architecture with all the details which are required for the development and deployment
of the system. The final architecture was limited to the IoT context view, Physical entity
view, and Functional view. The views were developed in Lucidchart online diagram
software. The models were represented in ad hoc notations that were clear for the main
decision-maker, which is CEO of the researched company.
The architecture was verified by CEO, data engineer, and third-party IoT expert during the
interview 9. The architecture was verified using expert judgment method. This method was
chosen due to its low-complexity and rapidity. Some of the criteria for verification were
taken from [68].

29
4 RESULTS
4.1 Researched company introduction
The researched company is a vertically integrated Middle East pharmaceutical cannabis
company which controls the entire life cycle of the cannabis drug development process
from plant cultivation to wholesale. The company grows Indica and Hybrid strains of
cannabis and sells cannabidiol-based medical products: tablets, spray, and suppositories.
The researched company uses vegetative propagation technique or cloning in their
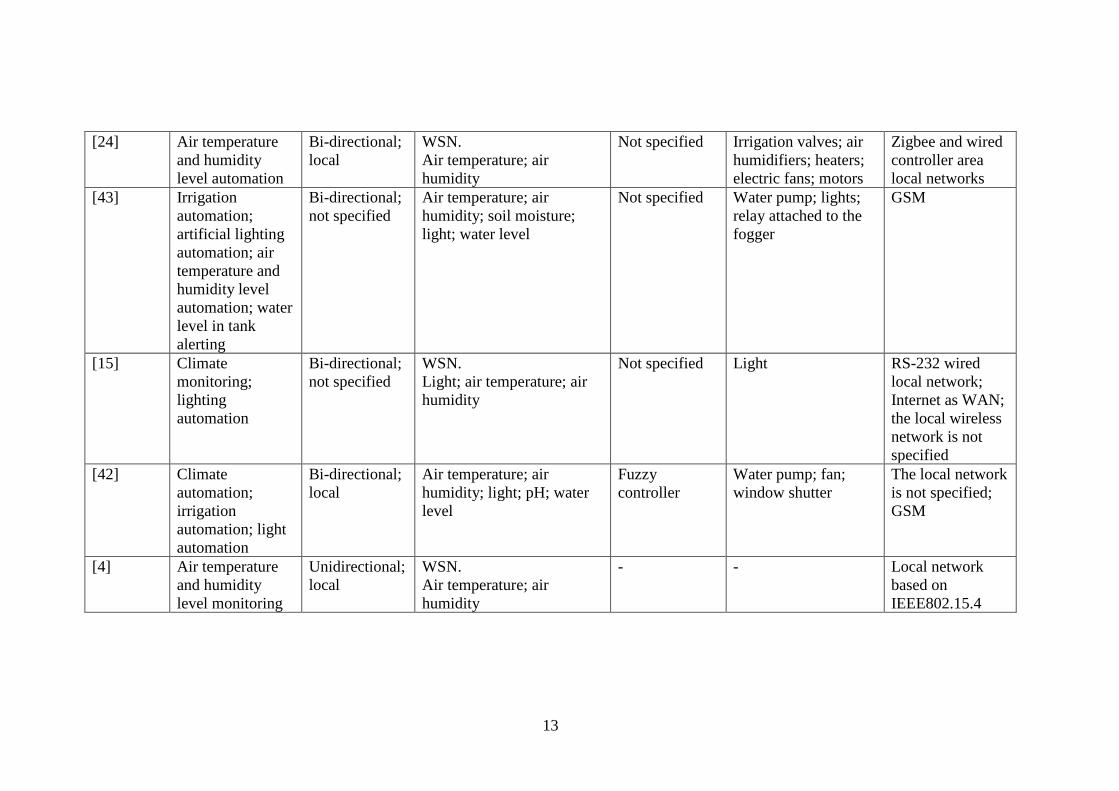
cannabis cultivation. The new plants are formed from pieces of mother plants. The stages
of new plants cultivation with the use of vegetative propagation are represented in Fig. 9.
They form one full cycle of cannabis production. The scope of the thesis is limited to
cultivation stage.
Fig. 9. Stages of cannabis plants cultivation in the researched company.
The company owns six globally distributed facilities. Two of them are functional facilities;
others are under construction or planned to be constructed.
• Greenhouse in the Middle East – active, 4500 square meters.
• Greenhouse in the Middle East – active, 3000 square meters.
• Greenhouse in Europe – currently under construction.
• Greenhouse in North America – currently under construction.
• Greenhouse in Europe – construction is planned.
• Greenhouse in South America – construction is planned.
The functional 4500 square meters greenhouse in the Middle East is the object of this
study. It is called the researched greenhouse in this research. The cultivation of plants takes
place in the flowering room, which is 76,8 by 52 meters. The flowering room has eight
sections, 9,6 by 52 meters each. The sections are independent in terms of fertigation, so
each section has its fertigation requirement. The flowering room has a 3 meters wide aisle
that goes through all the eight sections.

30
4.2 IoT system requirements
The problems faced by the researched company that led to the recognition that it needs a
new system to be developed are the following:
• unsatisfactory production volume;
• unsatisfactory decision-making regarding climate control, fertigation, and lighting
made by agronomists of the company;
• lack of automation and, consequently, high human resource usage and high risk of
human errors;
• absence of suitable turnkey solution on the market.
Currently, climate control, fertigation, and lighting are done without IoT usage. Climate
control is done by maintaining inside air temperature and humidity in certain boundaries
by a programmable logic controller (PLC) that is located in each functional greenhouse.
Fertigation control is done by setting specific irrigation schedule, amount of water, and
fertilizer composition for each irrigation zone in fertigation system. Lighting control is
done by switching on or off artificial lighting or covering greenhouse with screens.
Decisions on when to irrigate, how much to irrigate, when to fertilize and how much to
fertilize are the most complicated in the whole workflow. Agronomists make all the
decisions concerning climate control, fertigation, and lighting by themselves without IT
support.
The CEO of the company has an idea of creating an IoT system that fully automates
climate, fertigation, and lighting control during plant cultivation stage in all greenhouses.
The system must find optimal conditions for plants by itself and maintain it without human
interventions. The system must also have monitoring, data analytics, and manual remote
control capabilities that can be used by agronomists.
Several stakeholders were chosen to participate in requirements development. Their
profiles are represented in Table 4.

31
Table 4. Profiles of stakeholders involved in requirements development.
Stakeholder Roles Responsibilities
in RD Interests Provides
CEO
Product
champion,
sponsor,
direct
business user
Facilitate the
collection, and
validation of
requirements;
provide a holistic
vision of the
solution; fund
project; verify the
architecture
To get the project
done by the end of
2020; to get the
high-quality system
for the lowest
possible price; to
meet business
needs
Business
requirements,
user
requirements,
non-functional
requirements;
architecture
verification
Senior
agronomist
Direct general
user
Take part in user
requirements
collection and
validation
To get the system
that will help to
perform tasks
User
requirements,
non-functional
requirements
Junior
agronomist
Direct general
user
Take part in user
requirements
collection and
validation
To get the system
that will help to
perform tasks
User
requirements,
non-functional
requirements
System
administrator
Direct IT
support user
Take part in user
requirements
collection and
validation
To get paid for
system
maintenance
User
requirements,
non-functional
requirements;
architecture
verification
Data
engineer Provider
Take part in
functional
requirements
validation; verify
the architecture
To get paid for
system
development
Functional
requirements;
architecture
verification
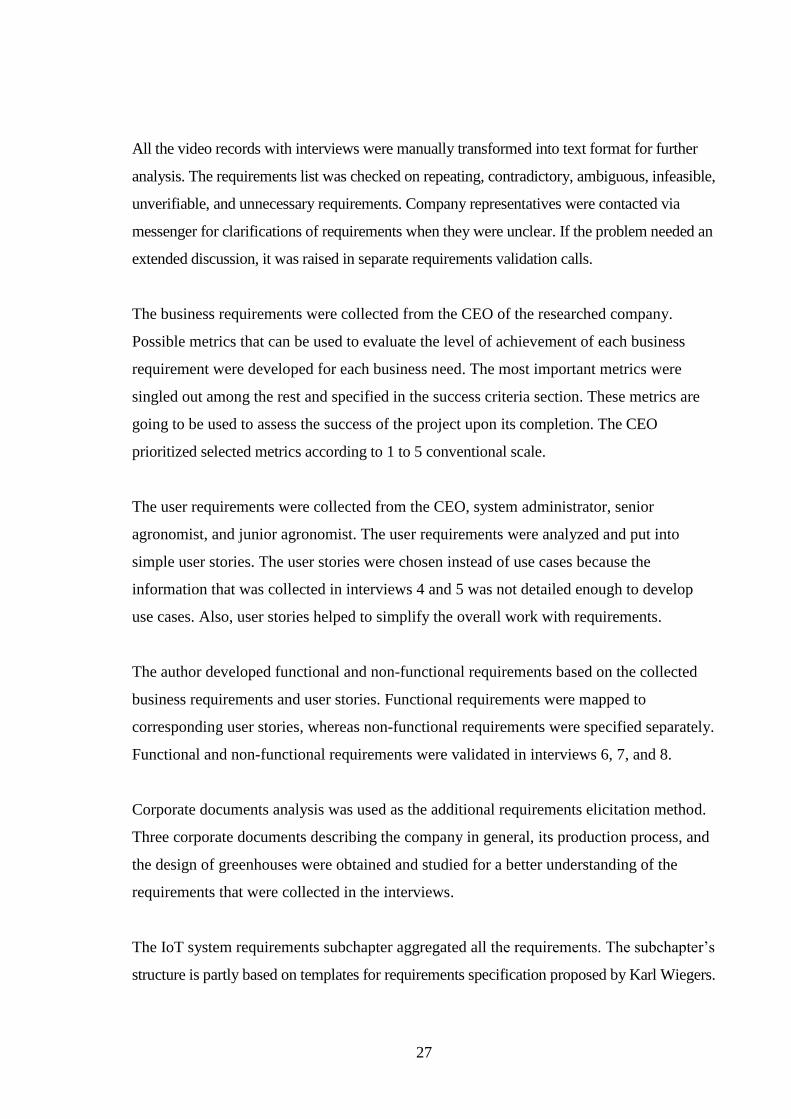
4.2.1 Business requirements
The business needs (BNs) relate to the general activities of the company, its financial well-
being, and general stability. The founder of the company outlined seven business needs
that need to be fulfilled by the IoT system in the first place.
Table 5 represents the business needs together with descriptions, metrics, and parameters
that can be tracked.
32
Table 5. Business needs of the researched company.
ID Business
need Description
Possible metrics or
parameters
1
To increase
production
volume
The company needs to increase its
production volume. After the
production volume is increased, the
company needs to make it constant
over time
• Gram per square
meter per cycle in
dynamic
• Number of cycles per
square meter per year in
dynamic
2 To improve
crop quality
The company needs to increase active
ingredients concentration in the end
product while sustaining the absence
of contamination. After the crop
quality is improved, the company
needs to make it uniform for most of
the plants in the greenhouse and make
it constant over time.
• Active ingredients
concentration
• Contamination level
3
To maintain
adequate
resources
usage
The company needs to maintain
adequate resources (labor, energy,
fertilizers, water) usage while
increasing production volume.
Production volume increase must not
be accompanied by a significant
increase in resources usage
• Total cost per gram
• Labor cost per gram
• Energy cost per gram
• Fertilizers cost per
gram
• Water usage per gram
4
To reduce
highly
qualified
labor usage
The company needs to cut senior
agronomist positions in the company
and reduce the working hours of the
rest senior agronomists because they
have high salaries and are extremely
hard to find on the labor market
• Number of senior
agronomists per facility
• Working hours of
senior agronomists per
month
• Highly qualified labor
cost
5
To reduce
human error
in decision
making
The company needs to reduce human
error in decision making regarding
climate, fertigation and lighting
operations because these operations
are the most important for plant
growth
• Maturity level of
process regarding
climate, fertigation and
lighting control
6
To use the
solution in
geographicall
y distributed
greenhouses
The company needs to use the solution
in all the regions of presence for all
the greenhouses
• Ability to be used in
the Middle East,
Europe, North America,
South America
7 To sell the
solution to
other
companies
The company needs to be able to sell
the solution to other farming
companies as a service (SaaS) after the
system prove its effectiveness
• The ability of the end
solution to be sold as a
service
33
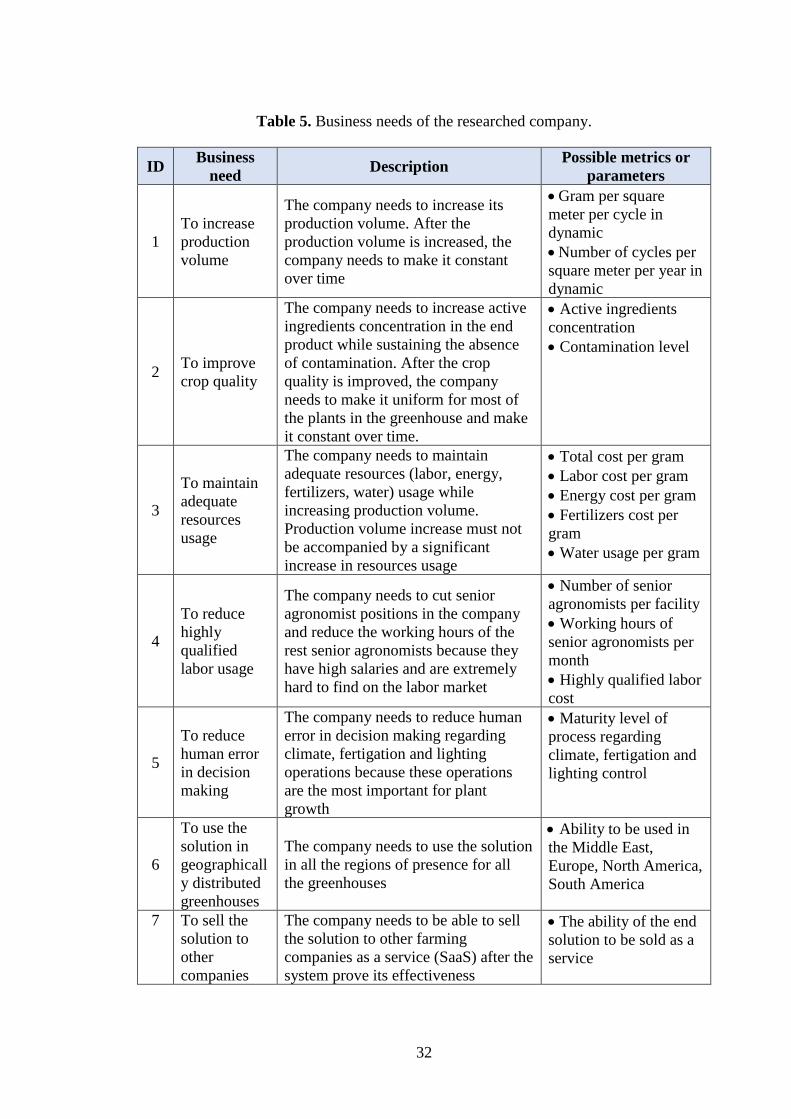
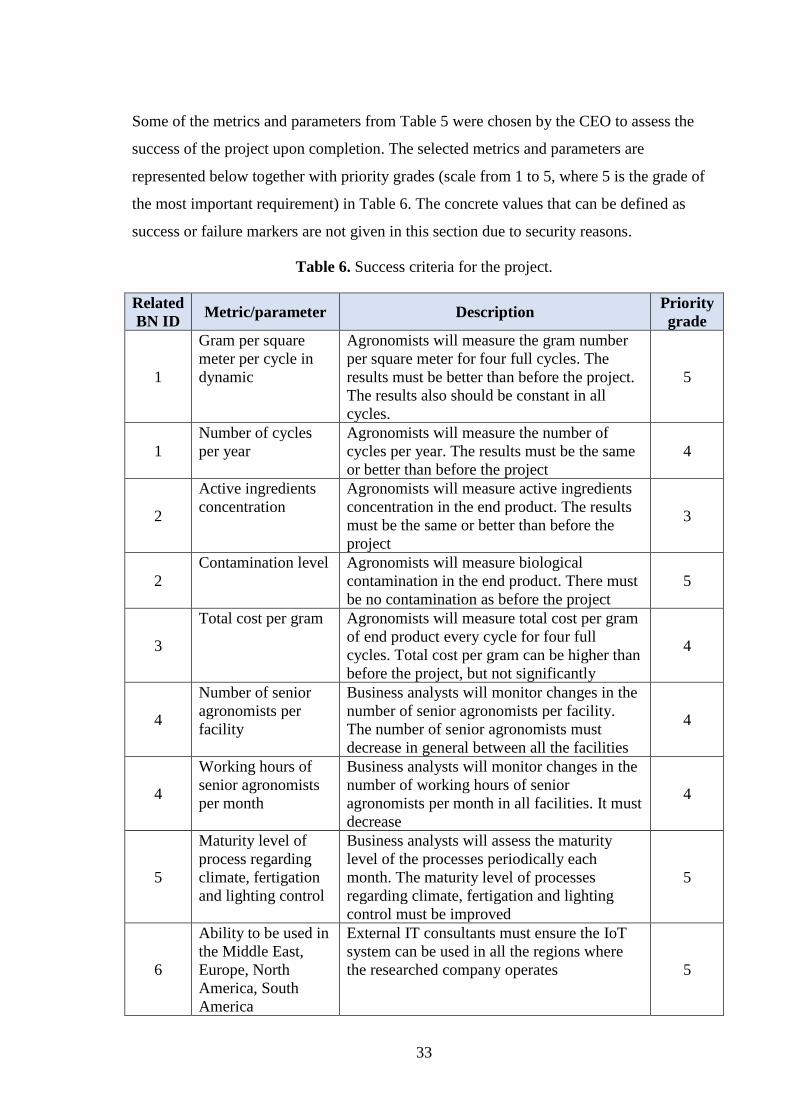
Some of the metrics and parameters from Table 5 were chosen by the CEO to assess the
success of the project upon completion. The selected metrics and parameters are
represented below together with priority grades (scale from 1 to 5, where 5 is the grade of
the most important requirement) in Table 6. The concrete values that can be defined as
success or failure markers are not given in this section due to security reasons.
Table 6. Success criteria for the project.
Related
BN ID Metric/parameter Description
Priority
grade
1
Gram per square
meter per cycle in
dynamic
Agronomists will measure the gram number
per square meter for four full cycles. The
results must be better than before the project.
The results also should be constant in all
cycles.
5
1
Number of cycles
per year
Agronomists will measure the number of
cycles per year. The results must be the same
or better than before the project
4
2
Active ingredients
concentration
Agronomists will measure active ingredients
concentration in the end product. The results
must be the same or better than before the
project
3
2
Contamination level Agronomists will measure biological
contamination in the end product. There must
be no contamination as before the project
5
3
Total cost per gram Agronomists will measure total cost per gram
of end product every cycle for four full
cycles. Total cost per gram can be higher than
before the project, but not significantly
4
4
Number of senior
agronomists per
facility
Business analysts will monitor changes in the
number of senior agronomists per facility.
The number of senior agronomists must
decrease in general between all the facilities
4
4
Working hours of
senior agronomists
per month
Business analysts will monitor changes in the
number of working hours of senior
agronomists per month in all facilities. It must
decrease
4
5
Maturity level of
process regarding
climate, fertigation
and lighting control
Business analysts will assess the maturity
level of the processes periodically each
month. The maturity level of processes
regarding climate, fertigation and lighting
control must be improved
5
6
Ability to be used in
the Middle East,
Europe, North
America, South
America
External IT consultants must ensure the IoT
system can be used in all the regions where
the researched company operates 5

34
7
Ability of the end
solution to be sold
as a service
External IT consultants must ensure the IoT
system that is going to be build can be sold as
a service with temporary access to other
companies
4
4.2.2 Vision of solution
The solution is the cloud-based IoT system that is composed of various devices and
abstract services presented in Table 7 with their functionalities.
Table 7. Elements of IoT system.
Element Functionality
Physical devices
Sensors Extracts data from the environment and plants and transfers it
to the physical gateway
Physical gateway Transfers collected data to the virtual server
Meters Collects resources usage data and transfers it to server directly
Actuators Act on the environment based on incoming commands that
come from the virtual server
Key services
Incoming data
management service
Identifies physical elements and routes incoming data from
them to corresponding services
Monitoring service Allows users to monitor latest incoming data (environmental,
plant state and resources usage data)
Storage service Allows to store archival incoming data to perform analysis in
future
Analytics service Allows users to analyze incoming data and gain insights
Alerting service Notifies users about certain events when they occur
Control agent Manages greenhouse automatically by changing actuators state
day and night
Manual remote control
service
Allows users to manage greenhouse by changing actuators state
remotely
Actuators management
service
Ensures real actuators have the same states as their virtual
representations
Administration services
Device management
service
Allows to manage physical elements of the system remotely
System monitoring and
management service
Allows to monitor actions of other users and manage the
performance of other services
Identity and access
management service
Allows to manage access to various services by setting access
levels for users
The key element of the solution is incoming data generated by sensors and meters. The
data extracted by sensors is environmental data and plant state data. Environmental data is
used to monitor current environmental conditions in a greenhouse. Plant state data is used
to analyze plant reaction to current environmental conditions. The data extracted by meters

35
is resources usage data. Resources usage data is used to monitor the consumption of
different resources that are used in climate control, fertigation, and lighting. The specific
parameters of environmental, plant state, and resources usage data that are going to be
collected are represented in Table 8. These parameters are going to be used as inputs in
decision-making regarding climate, fertigation, and lighting control. The parameters listed
in the table were provided by agronomists of the researched company. The parameters are
not described in detail in this thesis.
Table 8. Parameters collected by sensors and meters.
Data type Parameter Device collecting data
Environmental
Outside air temperature
Sensors
Outside air humidity
Outside wind direction
Outside wind speed
Outside solar irradiance
Air temperature
Air humidity
Air carbon dioxide
Air particle pollution
Photosynthetically active radiation (PAR)
Water temperature
Water dissolved oxygen
Water electrical conductivity (EC)
Water pH
Water nitrate
Water calcium
Water potassium
Substrate temperature
Substrate moisture
Substrate dissolved oxygen
Substrate EC
Plant state
Leaf temperature
Bud temperature
Leaf wetness
Stem diameter
Resources usage
Electricity consumption
Meters Fertilizers consumption
Water consumption
Listed parameters are going to be monitored, analyzed, and controlled by some of the
services presented previously in Table 7. These services are described below.

36
Monitoring service allows human users to watch listed parameters of a greenhouse
remotely almost in real time with minimal delays. It makes management over facility
easier as one senior agronomist can monitor many facilities at once from one location. The
service provides capabilities to compare different data and visualize it in a convenient way
suitable for finding valuable insights.
Alerting service notifies human users about deviations taking place in the system. The
deviations can relate to incoming data, activities of users, the performance of devices and
services. The purpose of the alerting service is to send alerts to users in time and provide
information about the arisen problem.
Control agent is the intelligent agent that makes decisions concerning climate, fertigation,
and lighting control automatically. It makes decisions to continuously maintain
environmental parameters in which the plant manifests itself in the best way. The agent
also considers resources usage and tries to minimize it. The intelligent agent gets
environmental, plant state, and resource usage data as input and provides changes to
actuators state as output. The intelligent agent is the major controlling option that must
work most of the time except in emergencies. The commands from the control agent go to
actuators management service.
Manual remote control service allows human users to control the state of each connected
actuator using a graphical user interface (GUI). It can be used in emergency cases when the
intelligent agent is not working properly or is not available. The commands from the
manual remote control service go to actuators management service.
Actuators management service manages each actuator by changing the state of its digital
twin. The digital twin is a virtual representation of one actuator in the IoT system.
Actuators management service maintains a separate digital twin for each actuator (or group
of actuators). The state of digital twin (for example, on or off) can be changed by the
control agent or by a human user (through manual remote control service). The state of the
real actuator changes according to its digital twin when it connects to the system. The
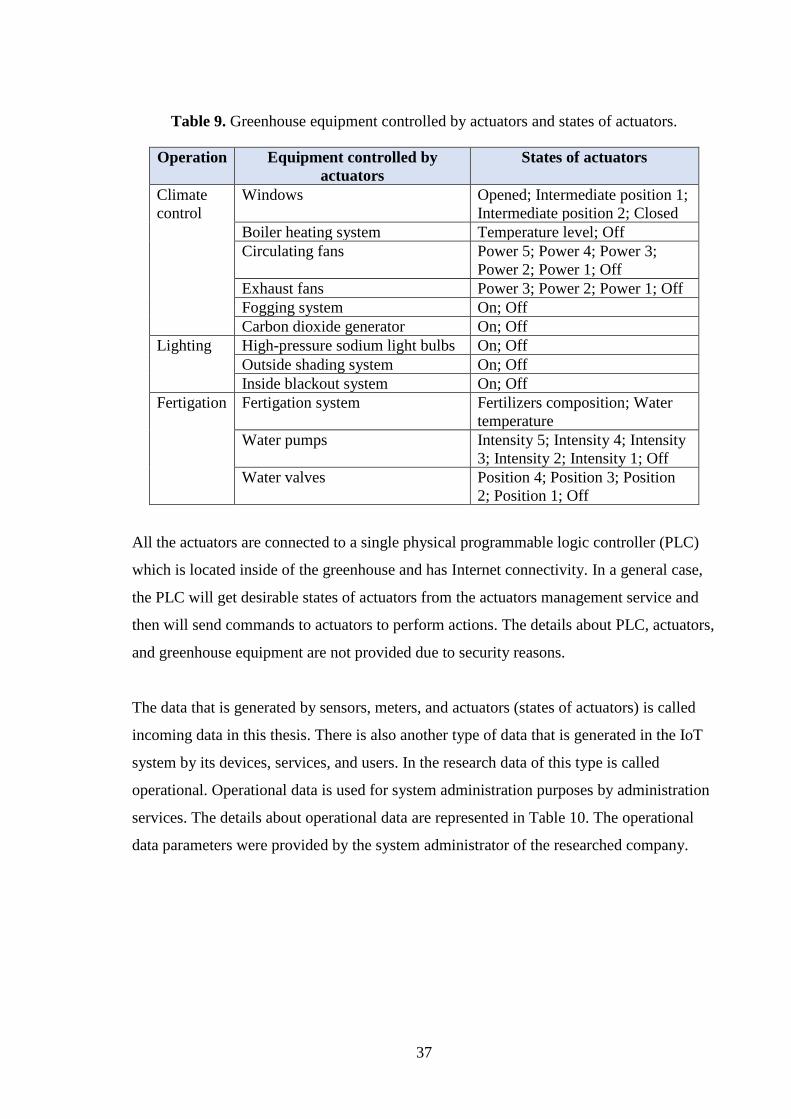
equipment that is controlled by actuators in the researched greenhouse is listed in Table 9.
37
Table 9. Greenhouse equipment controlled by actuators and states of actuators.
Operation Equipment controlled by
actuators
States of actuators
Climate
control
Windows Opened; Intermediate position 1;
Intermediate position 2; Closed
Boiler heating system Temperature level; Off
Circulating fans Power 5; Power 4; Power 3;
Power 2; Power 1; Off
Exhaust fans Power 3; Power 2; Power 1; Off
Fogging system On; Off
Carbon dioxide generator On; Off
Lighting High-pressure sodium light bulbs On; Off
Outside shading system On; Off
Inside blackout system On; Off
Fertigation Fertigation system Fertilizers composition; Water
temperature
Water pumps Intensity 5; Intensity 4; Intensity
3; Intensity 2; Intensity 1; Off
Water valves Position 4; Position 3; Position
2; Position 1; Off
All the actuators are connected to a single physical programmable logic controller (PLC)
which is located inside of the greenhouse and has Internet connectivity. In a general case,
the PLC will get desirable states of actuators from the actuators management service and
then will send commands to actuators to perform actions. The details about PLC, actuators,
and greenhouse equipment are not provided due to security reasons.
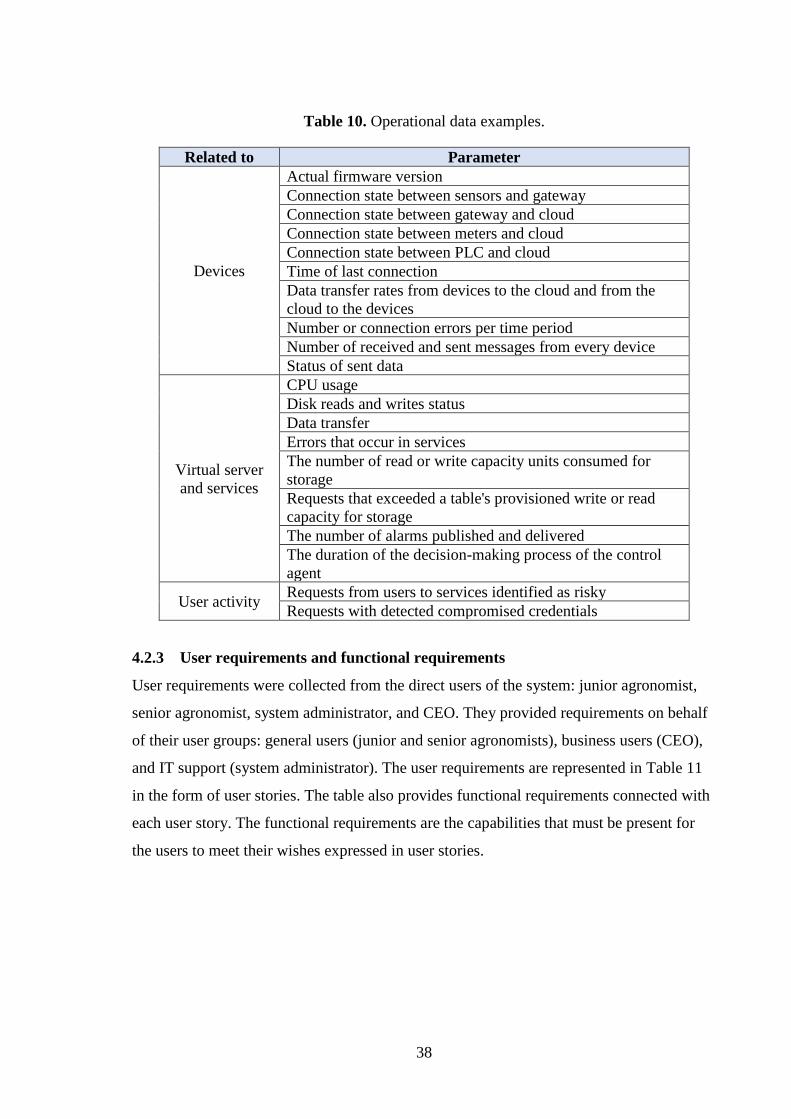
The data that is generated by sensors, meters, and actuators (states of actuators) is called
incoming data in this thesis. There is also another type of data that is generated in the IoT
system by its devices, services, and users. In the research data of this type is called
operational. Operational data is used for system administration purposes by administration
services. The details about operational data are represented in Table 10. The operational
data parameters were provided by the system administrator of the researched company.
38
Table 10. Operational data examples.
Related to Parameter
Devices
Actual firmware version
Connection state between sensors and gateway
Connection state between gateway and cloud
Connection state between meters and cloud
Connection state between PLC and cloud
Time of last connection
Data transfer rates from devices to the cloud and from the
cloud to the devices
Number or connection errors per time period
Number of received and sent messages from every device
Status of sent data
Virtual server
and services
CPU usage
Disk reads and writes status
Data transfer
Errors that occur in services
The number of read or write capacity units consumed for
storage
Requests that exceeded a table's provisioned write or read
capacity for storage
The number of alarms published and delivered
The duration of the decision-making process of the control
agent
User activity Requests from users to services identified as risky
Requests with detected compromised credentials
4.2.3 User requirements and functional requirements
User requirements were collected from the direct users of the system: junior agronomist,
senior agronomist, system administrator, and CEO. They provided requirements on behalf
of their user groups: general users (junior and senior agronomists), business users (CEO),
and IT support (system administrator). The user requirements are represented in Table 11
in the form of user stories. The table also provides functional requirements connected with
each user story. The functional requirements are the capabilities that must be present for
the users to meet their wishes expressed in user stories.

39
Table 11. User stories and functional requirements.
Name AS A junior agronomist
Functional requirements I WANT SO THAT
Access system
regardless of
location
To access the system from
any location using the
Internet on my device
I perform needed tasks in the
system regardless of my
location
User may use a personal computer, laptop, or mobile
device with Windows, Linux, macOS, iOS, or
Android operating system that is connected to the
Internet.
Access system
using browser
To access the system using
my browser
I do not need to download
software on my computer and
update it manually
User may use such browsers as Chrome, Safari,
Firefox of last versions.
Log in to
system
To log in to the system by
my corporate email and
constant password
I perform needed tasks in the
system whenever needed
without waiting for one-time
password
The system provides access to the services if user fills
correct email and password in login form.
Log out of
system
To log out of the system I prevent unauthorized access
to the system by another user
or log in to another account to
perform my tasks
The system allows to log out.
Reset
password
To reset my constant
password if I forget it
I continue performing needed
tasks in the system
The system allows resetting forgotten password in the
login form by sending an email with the password
resetting link to the corporate email of the user.
See date and
time of data
records
To see the date and time of
each data record in all IoT
system services
I can distinguish the older data
from the newer one
Sensors, meters, and actuators must deliver data
records with embedded epoch timestamps. The format
of date and time of data records for users must be
YYYY-MM-DD, HH:MM:SS.
Get new
sensor data
To get new environmental
and plant state data records
from sensors every 15
minutes
I have the latest data to monitor Sensors deliver new data every 15 minutes (as
recommended in [69] for dynamic statistics
extraction)
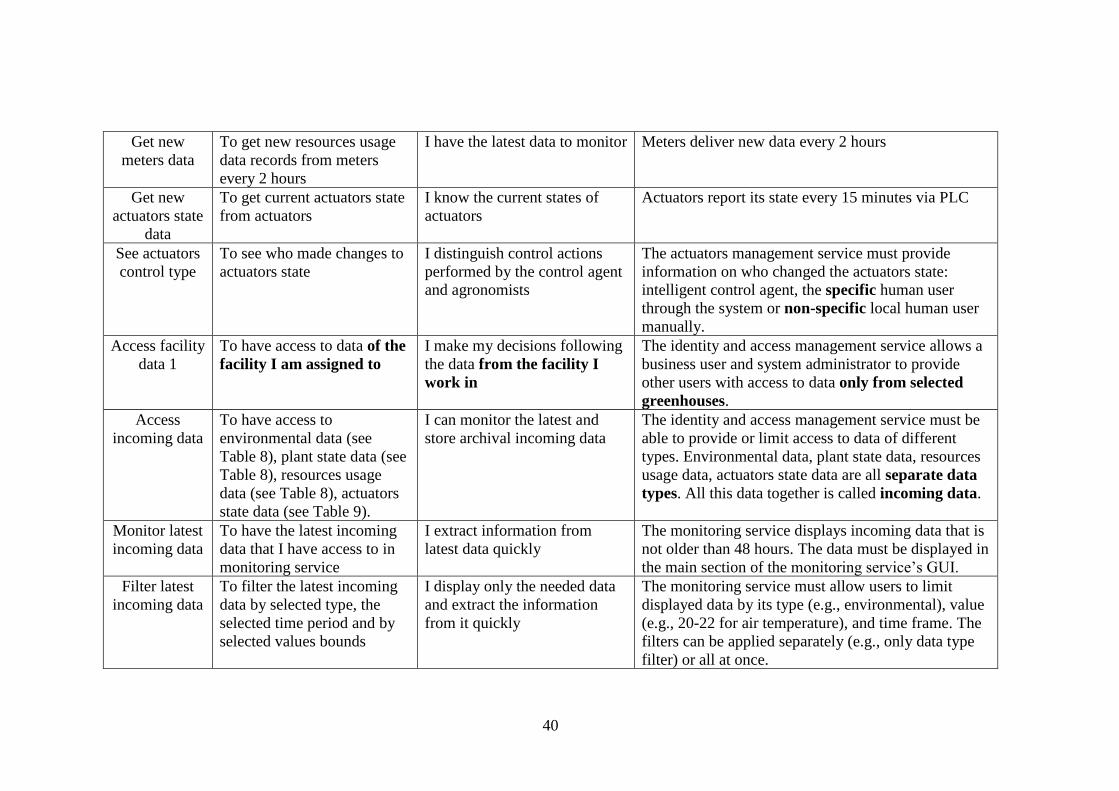
40
Get new
meters data
To get new resources usage
data records from meters
every 2 hours
I have the latest data to monitor Meters deliver new data every 2 hours
Get new
actuators state
data
To get current actuators state
from actuators
I know the current states of
actuators
Actuators report its state every 15 minutes via PLC
See actuators
control type
To see who made changes to
actuators state
I distinguish control actions
performed by the control agent
and agronomists
The actuators management service must provide
information on who changed the actuators state:
intelligent control agent, the specific human user
through the system or non-specific local human user
manually.
Access facility
data 1
To have access to data of the
facility I am assigned to
I make my decisions following
the data from the facility I
work in
The identity and access management service allows a
business user and system administrator to provide
other users with access to data only from selected
greenhouses.
Access
incoming data
To have access to
environmental data (see
Table 8), plant state data (see
Table 8), resources usage
data (see Table 8), actuators
state data (see Table 9).
I can monitor the latest and
store archival incoming data
The identity and access management service must be
able to provide or limit access to data of different
types. Environmental data, plant state data, resources
usage data, actuators state data are all separate data
types. All this data together is called incoming data.
Monitor latest
incoming data
To have the latest incoming
data that I have access to in
monitoring service
I extract information from
latest data quickly
The monitoring service displays incoming data that is
not older than 48 hours. The data must be displayed in
the main section of the monitoring service’s GUI.
Filter latest
incoming data
To filter the latest incoming
data by selected type, the
selected time period and by
selected values bounds
I display only the needed data
and extract the information
from it quickly
The monitoring service must allow users to limit
displayed data by its type (e.g., environmental), value
(e.g., 20-22 for air temperature), and time frame. The
filters can be applied separately (e.g., only data type
filter) or all at once.

41
Store latest
and archival
incoming data
To have latest and archival
incoming data that I have
access to in storage service
I use data from storage when
necessary
The storage service must store environmental, plant
state, resource usage, actuators state, and operational
data for five years since its generation.
Filter
incoming data
in storage
To filter latest and archival
incoming data by selected
type, selected time period
and by selected values
bounds
I display only the needed data
and extract the information
from it quickly
The storage service must allow users to limit
displayed data by its type (e.g., environmental), value
(e.g., 20-22 for air temperature), and time frame. The
filters can be applied separately (e.g., only data type
filter) or all at once.
Compare
same type data
To compare data of one time
frame with the same type
data of another time frame
I get a deeper understanding of
the current situation and past
situations
The analytics service must provide capabilities to
compare data of one time frame with the same type
data of another time frame.
Match
different type
data
To match data of one type
with data of another type in
the selected time frame
I analyze the connection
between different data types
and evaluate the effectiveness
of controlling actions on
actuators
The analytics service must provide capabilities to
match data of one type (e.g., environmental) with data
of another type (e.g., plant state) in the selected time
frame
Visualize data To visualize incoming data
with the use of a variety of
graphs
I extract information from data
quickly
The analytics service must have the following graphs
options: line charts, bar charts, pie charts, combo
charts, heat maps.
Share
visualized
reports
To share visualized reports
with my coworkers
My coworkers have the same
point of view as I have
The analytics service must provide an ability to share
visualized reports with other workers of the
organization securely
Get unsafe
conditions
alerts
To get alerts by email if
environmental, plant state or
resources usage parameters
values are unsafe
I react promptly to control the
situation
The alerting service must send alerts to users quickly.
System administrator and business users set unsafe
values of incoming data parameters.

42
Get critical
conditions
alerts
To get alerts by SMS and
email if environmental, plant
state or resources usage
parameters values are critical
I react promptly to return
parameters to safe values
The alerting service must send alerts to the monitoring
service, by SMS and email quickly. The monitoring
service must display the alerts once they come and
notify the user.
System administrator and business users set critical
values of incoming data parameters.
Name AS A senior agronomist
Functional requirements I WANT SO THAT
Same as a junior agronomist with additions presented below
Access facility
data 2
To have access to data of the
facilities I am assigned to
I make my decisions following
the data from the facilities I
work in
The identity and access management service allows
business users and system administrator to provide
other users with access to data only from selected
greenhouses.
Use
automated
greenhouse
control
The climate, fertigation, and
lighting in the greenhouses to
be controlled by the control
agent
I do not need to control it
manually
The control agent must make decisions on climate
control, fertigation, and lighting automatically. The
results of decisions are new states of actuators. The
control agent must transfer commands to change
states of actuators to the actuators management
service.
The actuators management service must update the
actuators state following the command from the
control agent
Switch active
control option
To switch active control
agent to manual remote
control or vice versa
I run manual mode when the
control agent is experiencing
errors and switch on the
control agent when it is fixed
The manual remote control service allows switching
between the control agent and manual remote control
in its GUI.
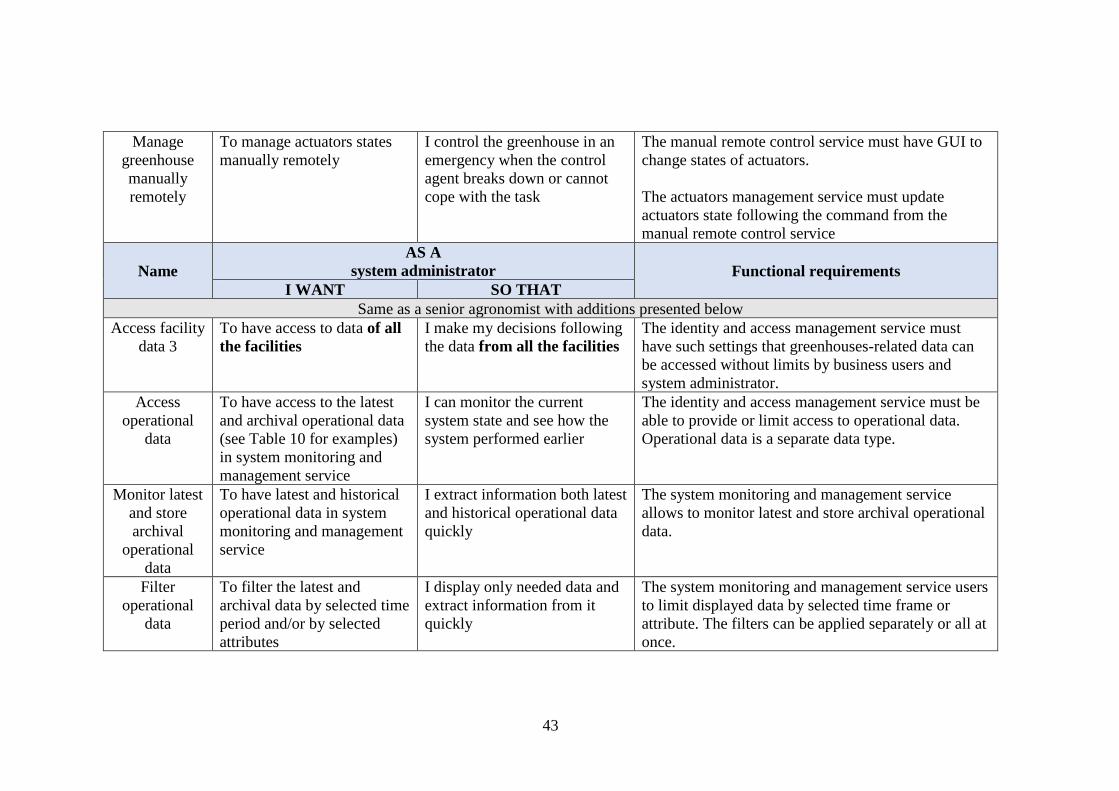
43
Manage
greenhouse
manually
remotely
To manage actuators states
manually remotely
I control the greenhouse in an
emergency when the control
agent breaks down or cannot
cope with the task
The manual remote control service must have GUI to
change states of actuators.
The actuators management service must update
actuators state following the command from the
manual remote control service
Name
AS A
system administrator Functional requirements
I WANT SO THAT
Same as a senior agronomist with additions presented below
Access facility
data 3
To have access to data of all
the facilities
I make my decisions following
the data from all the facilities
The identity and access management service must
have such settings that greenhouses-related data can
be accessed without limits by business users and
system administrator.
Access
operational
data
To have access to the latest
and archival operational data
(see Table 10 for examples)
in system monitoring and
management service
I can monitor the current
system state and see how the
system performed earlier
The identity and access management service must be
able to provide or limit access to operational data.
Operational data is a separate data type.
Monitor latest
and store
archival
operational
data
To have latest and historical
operational data in system
monitoring and management
service
I extract information both latest
and historical operational data
quickly
The system monitoring and management service
allows to monitor latest and store archival operational
data.
Filter
operational
data
To filter the latest and
archival data by selected time
period and/or by selected
attributes
I display only needed data and
extract information from it
quickly
The system monitoring and management service users
to limit displayed data by selected time frame or
attribute. The filters can be applied separately or all at
once.

44
Create new
user
To create new users and set
initial one-time passwords
for them
New users can log in, change
their password to the constant
one and perform their tasks in
the system
The identity and access management service allows to
create new users and set an initial one-time password
for them. After the user logs in he must change the
initial password to the constant one.
Set access
levels
To set the access level to data
and functionality for new and
existing users
Only trusted users have access
to sensitive data and critical
functionality; users do not have
access to what they do not need
for their work
The identity and access management service allows to
set and edit access level to data and functionality for
new and existing users.
Delete user To delete existing users The system does not keep old
accounts; irrelevant users
cannot access the system
The identity and access management service allows
deleting user accounts.
Get strange
activity alerts
To get alerts by SMS and
email when users perform
strange activities in the
system
I react promptly to stop
harmful impact on system or
facility
The alerting service must send alerts to users by SMS
and email quickly. Strange activities of users are part
of operational data. See Table 10 for examples.
Get system
error alerts
To get alerts by SMS and
email when system errors
occur
I find out about the error and
start fixing it
The alerting service must send alerts to users by SMS
and email quickly. System errors are part of
operational data. See Table 10 for examples.
Set unsafe
conditions
alerts
To set the rules for unsafe
conditions alerts generation
related to environmental,
plant state and resources
usage data for each
greenhouse
I can regulate when unsafe
conditions alerts are generated
for each greenhouse
The system monitoring and management service
allows to set and edit rules related to unsafe
conditions alert generation for each greenhouse. The
rules may be different for different greenhouses.
Example of the rule is the following: in greenhouse
one if the air temperature is above 30 then generate
unsafe conditions alert.
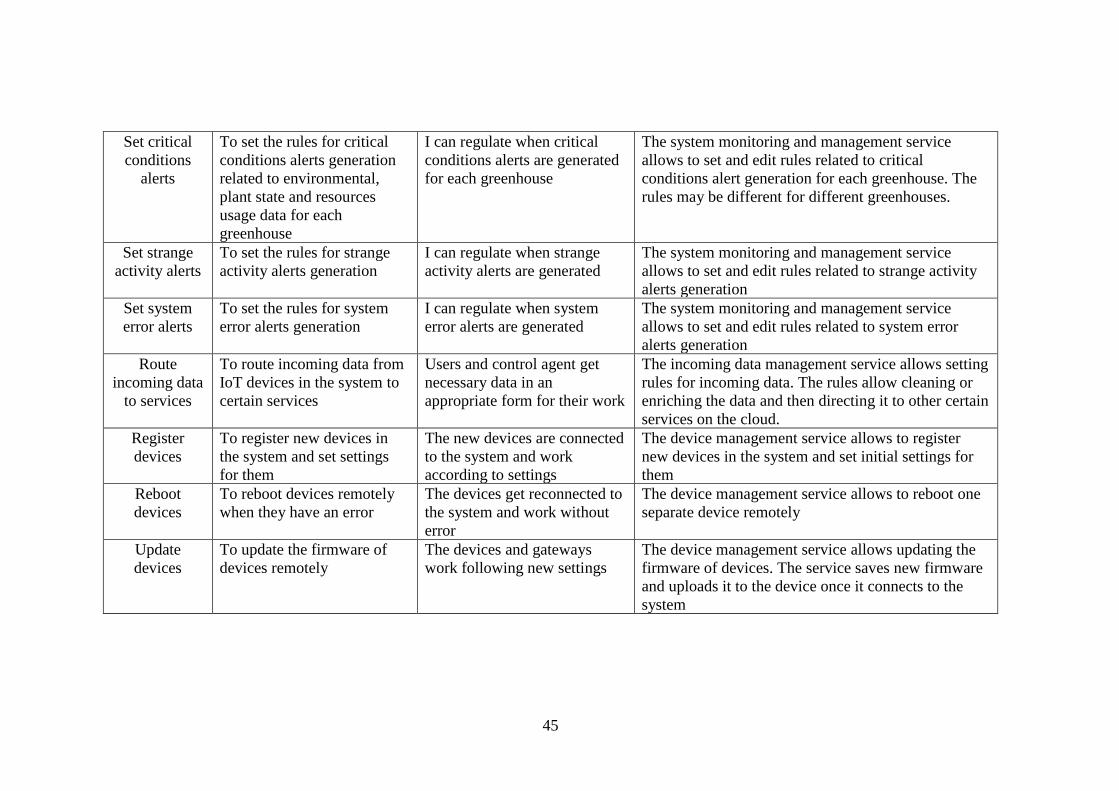
45
Set critical
conditions
alerts
To set the rules for critical
conditions alerts generation
related to environmental,
plant state and resources
usage data for each
greenhouse
I can regulate when critical
conditions alerts are generated
for each greenhouse
The system monitoring and management service
allows to set and edit rules related to critical
conditions alert generation for each greenhouse. The
rules may be different for different greenhouses.
Set strange
activity alerts
To set the rules for strange
activity alerts generation
I can regulate when strange
activity alerts are generated
The system monitoring and management service
allows to set and edit rules related to strange activity
alerts generation
Set system
error alerts
To set the rules for system
error alerts generation
I can regulate when system
error alerts are generated
The system monitoring and management service
allows to set and edit rules related to system error
alerts generation
Route
incoming data
to services
To route incoming data from
IoT devices in the system to
certain services
Users and control agent get
necessary data in an
appropriate form for their work
The incoming data management service allows setting
rules for incoming data. The rules allow cleaning or
enriching the data and then directing it to other certain
services on the cloud.
Register
devices
To register new devices in
the system and set settings
for them
The new devices are connected
to the system and work
according to settings
The device management service allows to register
new devices in the system and set initial settings for
them
Reboot
devices
To reboot devices remotely
when they have an error
The devices get reconnected to
the system and work without
error
The device management service allows to reboot one
separate device remotely
Update
devices
To update the firmware of
devices remotely
The devices and gateways
work following new settings
The device management service allows updating the
firmware of devices. The service saves new firmware
and uploads it to the device once it connects to the
system

46
Name
AS A
business user Functional requirements
I WANT SO THAT
Same as a system administrator with additions presented below
Download
incoming and
operational
data
To download selected
incoming and operational
data
I can analyze the data in
another software
The system monitoring and management service and
storage service must have an ability to download
incoming and operational data to a local computer

47
4.2.4 Non-functional requirements
The interviews conducted with direct users of the system helped to highlight the most
important non-functional requirements of the future IoT system. They are taken from Fig.
2 that was adopted from [59]. The requirements and their descriptions are represented in
Table 12.
Table 12. Non-functional requirements.
Non-functional
requirement Description
Security Defines how well the system protects against unauthorized access to the
system and its data. It is a requirement that is extremely important for
the researched company. The data that goes through the system is very
sensitive. The control agent will need the highest protection as its
development is highly resource-intensive and expensive. Unauthorized
access to the environmental, plant state, resources usage data, or code of
control agent must be prevented.
Availability Defines the extent to which the system’s services are available when
and where they are needed. This requirement is important because the
IoT system will manage the greenhouse in almost real-time and
maintain proper conditions for the plants. If the system fails, the
greenhouse is left unmanaged. That is why the monthly availability
must be at least 95%. Also, the system must be available in all the
regions where the greenhouses of the researched company are located.
Interoperability Defines how easily the system can interconnect and exchange data with
other systems or components. The IoT system must support wide-spread
communication methods and standards for interconnection with third-
party services or other components, including the physical devices
provided by various vendors.
Scalability Defines how easily the system can grow to handle more users, actions,
servers, and data records. The IoT system must be able to work with up
to 10 connected greenhouses at once in the beginning. The IoT system
must have the ability to be scaled to more than 100 foreign greenhouses
in the future.
Modifiability Defines how easy it is to maintain, change, enhance, and restructure the
system. The system’s architecture must be flexible enough for the
implementation of new services and applications. This requirement is
important because the CEO of the company plans to enhance the system
by connecting cameras and creating machine-vision service to monitor
the growth rate of the plants, detect diseases and pests.
Usability Defines how easy it is for people to learn, remember, and use the
system. The IoT system will be used first of all by agronomists, which
are not proficient computer users. The GUI of monitoring and analytics
services must be easy enough for them to perform their tasks according
to user stories.

48
4.3 IoT system architecture
This subchapter provides the architecture of the IoT system that is going to be developed.
The architecture includes the most important design decisions concerning the physical
devices, digital services, and communication elements of the IoT system. The subchapter is
structured according to the views on IoT system architecture proposed in [62] and
described in the chapter of the related work of this thesis. IoT context view provides the
scope of the system, Physical entity view describes the physical elements of the IoT system
and their means of communication with digital services, Functional view represents the
functional components (services) and their relationships.
4.3.1 IoT context view
The IoT system that is going to be made consists of physical devices and digital services.
The context view of the IoT system is represented in Fig. 10. The components of the
system are represented in pale blue and dark blue. The dark blue components were
predefined by the researched company. The IoT system has no external systems it connects
to; it is an isolated system.
Fig. 10. IoT context view.

49
The physical devices include sensors, meters, gateway, PLC, and actuators. Sensors extract
valuable data about greenhouse’s properties (air, water, substrate, plants) and transfer it to
digital services through the physical gateway. Meters measure the consumption of
resources (electricity, fertilizers, water) and transfer it to digital services directly. PLC gets
commands from digital services and manages actuators accordingly. Actuators act on the
equipment they are attached to in the greenhouse.
Digital services get the incoming data and provide users with monitoring, analyzing, and
management capabilities. One of the digital services is the control agent that can manage
the greenhouse without human interventions. The control agent makes decisions on how to
control equipment and send commands to PLC. Greenhouse PLC gets the command and
manages actuators which are attached to the equipment. As a result, the equipment changes
its state to a new one.
The user groups of the system are junior agronomists, senior agronomists, system
administrators, and business users. According to the user stories junior agronomist
monitors greenhouse and analyzes data including both the latest and archival records;
senior agronomist has additional capabilities to manage actuators in manual mode; system
administrator monitors and manages the whole IoT system, not only greenhouse; business
user has the capabilities of other groups plus an ability to download data from the system.
4.3.2 Physical entity view
The physical elements include sensors, meters, and gateway. Additional physical elements
that are predefined by the researched company and do not require design decisions to be
made are actuators and PLC. Communication elements are special protocols, methods, and
standards that are used to connect physical devices to digital services. All the indicated
elements are described below separately.
Wireless sensor nodes provided by vendor Libelium were chosen as a solution for the IoT
system. No other company except Libelium offers all the needed components for the
needed WSN application. The company offers a huge variety of sensor probes from
various manufacturers that can be connected to their nodes. Libelium has sensor nodes of
various types called, for instance, «Smart Agriculture». Each type of sensor nodes has a
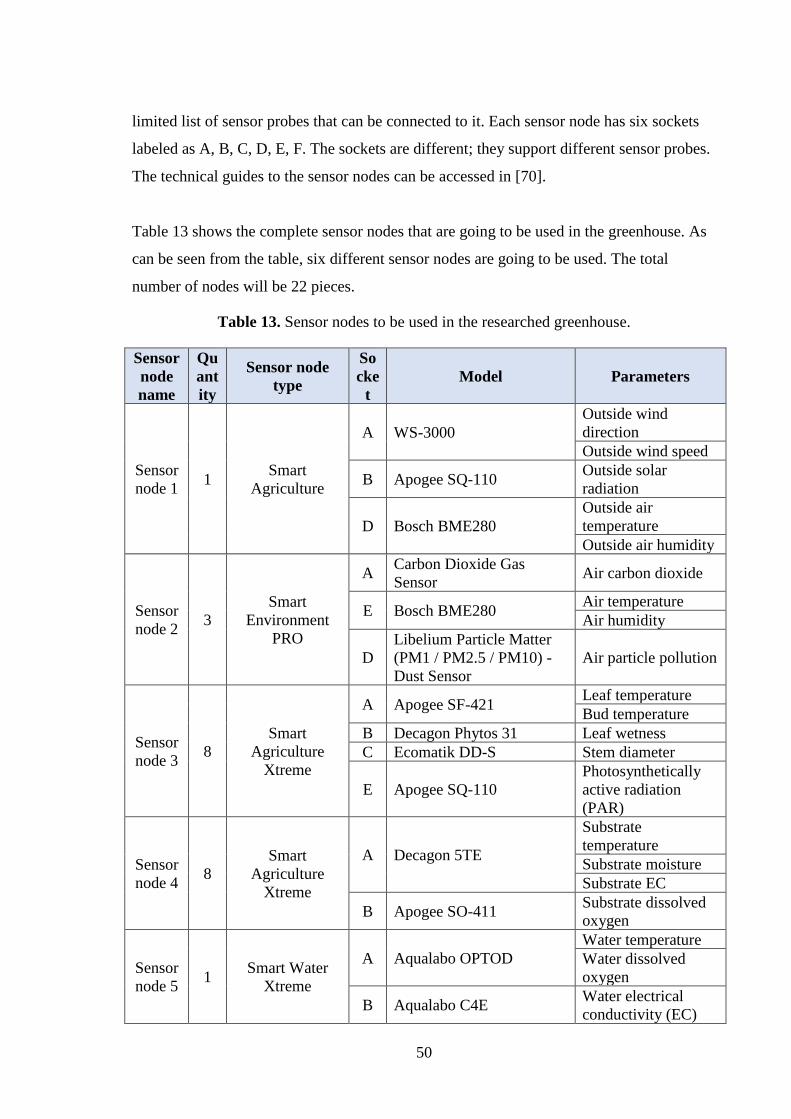
50
limited list of sensor probes that can be connected to it. Each sensor node has six sockets
labeled as A, B, C, D, E, F. The sockets are different; they support different sensor probes.
The technical guides to the sensor nodes can be accessed in [70].
Table 13 shows the complete sensor nodes that are going to be used in the greenhouse. As
can be seen from the table, six different sensor nodes are going to be used. The total
number of nodes will be 22 pieces.
Table 13. Sensor nodes to be used in the researched greenhouse.
Sensor
node
name
Qu
ant
ity
Sensor node
type
So
cke
t
Model Parameters
Sensor
node 1 1
Smart
Agriculture
A WS-3000
Outside wind
direction
Outside wind speed
B Apogee SQ-110 Outside solar
radiation
D Bosch BME280
Outside air
temperature
Outside air humidity
Sensor
node 2 3
Smart
Environment
PRO
A Carbon Dioxide Gas
Sensor Air carbon dioxide
E Bosch BME280 Air temperature
Air humidity
D
Libelium Particle Matter
(PM1 / PM2.5 / PM10) -
Dust Sensor
Air particle pollution
Sensor
node 3 8
Smart
Agriculture
Xtreme
A Apogee SF-421 Leaf temperature
Bud temperature
B Decagon Phytos 31 Leaf wetness
C Ecomatik DD-S Stem diameter
E Apogee SQ-110
Photosynthetically
active radiation
(PAR)
Sensor
node 4 8
Smart
Agriculture
Xtreme
A Decagon 5TE
Substrate
temperature
Substrate moisture
Substrate EC
B Apogee SO-411 Substrate dissolved
oxygen
Sensor
node 5 1
Smart Water
Xtreme
A Aqualabo OPTOD
Water temperature
Water dissolved
oxygen
B Aqualabo C4E Water electrical
conductivity (EC)
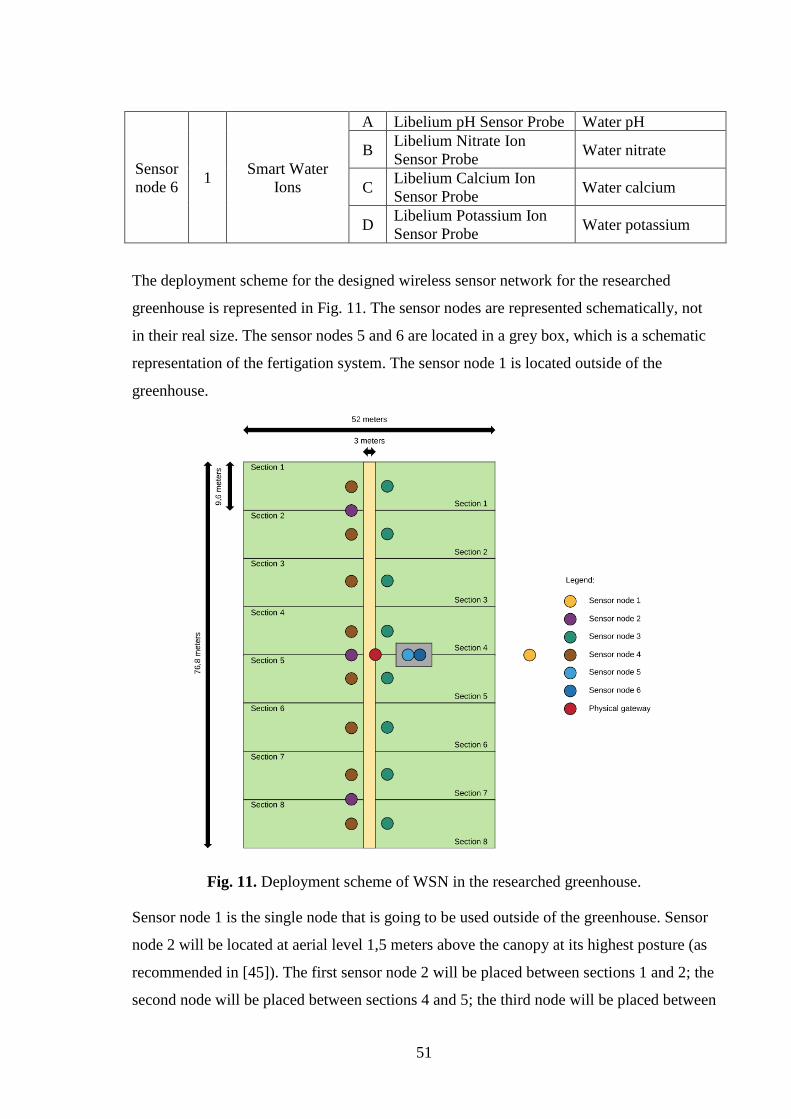
51
Sensor
node 6 1
Smart Water
Ions
A Libelium pH Sensor Probe Water pH
B Libelium Nitrate Ion
Sensor Probe Water nitrate
C Libelium Calcium Ion
Sensor Probe Water calcium
D Libelium Potassium Ion
Sensor Probe Water potassium
The deployment scheme for the designed wireless sensor network for the researched
greenhouse is represented in Fig. 11. The sensor nodes are represented schematically, not
in their real size. The sensor nodes 5 and 6 are located in a grey box, which is a schematic
representation of the fertigation system. The sensor node 1 is located outside of the
greenhouse.
Fig. 11. Deployment scheme of WSN in the researched greenhouse.
Sensor node 1 is the single node that is going to be used outside of the greenhouse. Sensor
node 2 will be located at aerial level 1,5 meters above the canopy at its highest posture (as
recommended in [45]). The first sensor node 2 will be placed between sections 1 and 2; the
second node will be placed between sections 4 and 5; the third node will be placed between

52
sections 7 and 8. Sensor node 3 is going to be located on the same height with canopy for
easy attachment of sensor probes to plants. Sensor node 4 is going to be located close to
the ground for easy attachment to the substrate. Sensor node 3 and sensor node 4 will be
placed in each of the 8 sections because the data from them is used for fertigation. Sensor
nodes 5 and 6 are going to be located in fertigation mixing tank (part of the fertigation
system where water is mixed with fertilizers before moving to plants).
All the sensor node types: Smart Agriculture, Smart Agriculture Xtreme, Smart
Environment PRO, Smart Water Xtreme, and Smart Water Ions provide radio interfaces
for a couple of radio frequency communication modules. The most suitable option in the
case is the XBee-PRO 802.15.4 certified module. The module uses the 802.15.4 protocol
and provides up to 90 meters communication range indoors [71].
Star network topology is going to be applied for the wireless sensor network. The size of
the greenhouse and chosen communication modules should provide an ability to connect
all the sensor nodes directly to the gateway. If the implementation of star topology goes
wrong, it can be substituted by mesh topology. In the mesh topology, some of the sensor
nodes are going to be used also as intermediate routers passing on data from other sensor
nodes that are located far from the gateway. The mesh topology is stated as preferable in
[45] due to its reliability and scalability. However, in the case of the researched company
star topology should be enough to meet requirements. The XBee-PRO 802.15.4 module
supports both star and mesh topologies [71].
Physical gateway Meshlium 4G 802.15.4 AP 868 provided by vendor Libelium is going to
be used in the IoT system. It supports the connection of sensor nodes that are using the
802.15.4 protocol. Meshlium can also forward sensor data directly to the Internet via
Ethernet or GPRS/3G/4G protocols, depending on the connectivity options available in the
area [72]. The gateway will be located close to the center of the flowering room of the
greenhouse, as shown in Fig. 11.
Three types of meters are going to be used in the IoT system, including electricity
consumption meter, fertilizers consumption meter, and water consumption meter.
Fertilizers consumption and water consumption meters are preinstalled in the fertigation
system and can transmit the consumption data using GPRS/3G. The electricity
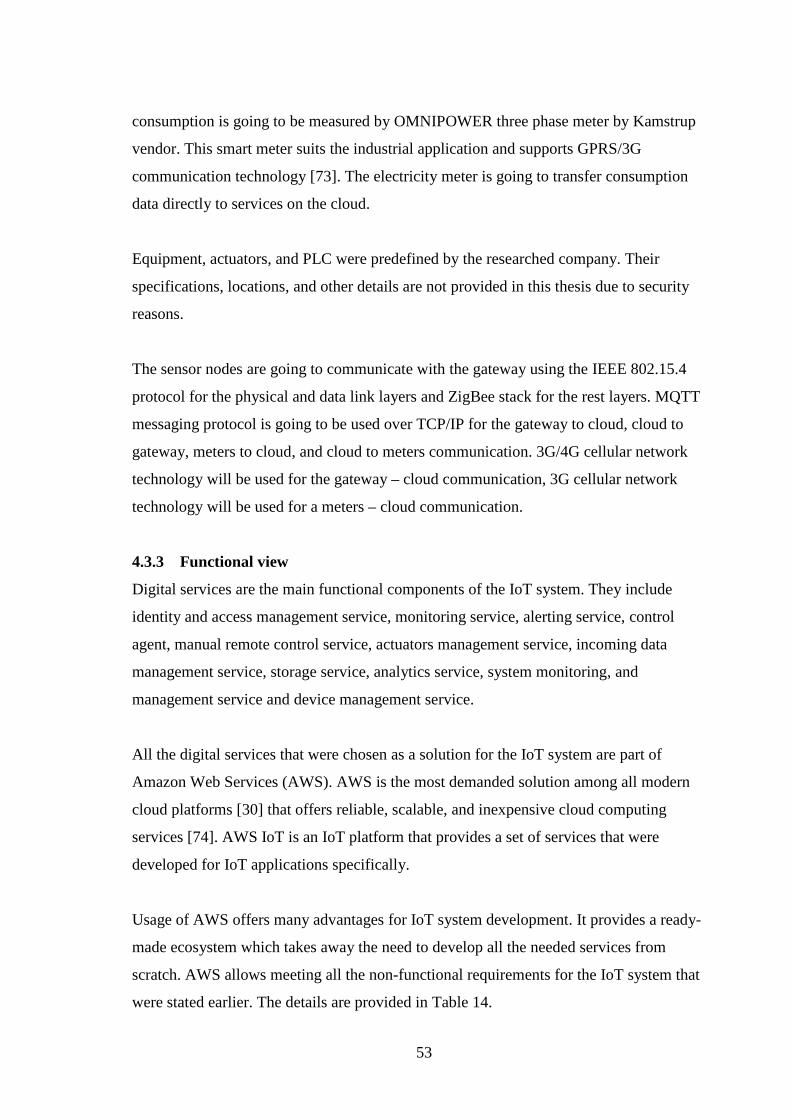
53
consumption is going to be measured by OMNIPOWER three phase meter by Kamstrup
vendor. This smart meter suits the industrial application and supports GPRS/3G
communication technology [73]. The electricity meter is going to transfer consumption
data directly to services on the cloud.
Equipment, actuators, and PLC were predefined by the researched company. Their
specifications, locations, and other details are not provided in this thesis due to security
reasons.
The sensor nodes are going to communicate with the gateway using the IEEE 802.15.4
protocol for the physical and data link layers and ZigBee stack for the rest layers. MQTT
messaging protocol is going to be used over TCP/IP for the gateway to cloud, cloud to
gateway, meters to cloud, and cloud to meters communication. 3G/4G cellular network
technology will be used for the gateway – cloud communication, 3G cellular network
technology will be used for a meters – cloud communication.
4.3.3 Functional view
Digital services are the main functional components of the IoT system. They include
identity and access management service, monitoring service, alerting service, control
agent, manual remote control service, actuators management service, incoming data
management service, storage service, analytics service, system monitoring, and
management service and device management service.
All the digital services that were chosen as a solution for the IoT system are part of
Amazon Web Services (AWS). AWS is the most demanded solution among all modern
cloud platforms [30] that offers reliable, scalable, and inexpensive cloud computing
services [74]. AWS IoT is an IoT platform that provides a set of services that were
developed for IoT applications specifically.
Usage of AWS offers many advantages for IoT system development. It provides a ready-
made ecosystem which takes away the need to develop all the needed services from
scratch. AWS allows meeting all the non-functional requirements for the IoT system that
were stated earlier. The details are provided in Table 14.

54
Table 14. Solutions to non-functional requirements.
Non-functional
requirement Solution
Security Protected access to the system and control agent:
AWS Identity and Access Management service enables to control access
to AWS services and resources securely. Multifactor authentication adds
a layer of protection on user access.
Data protection:
AWS IoT Core supports X.509 security certificates as device identities.
The registered device is associated with an IoT policy. An IoT policy
gives the ability to create fine-grained permissions per device. Fine-
grained permissions can ensure that one device only has permissions to
interact with its MQTT topics and messages.
Availability AWS ensures the following monthly availability for each AWS region [75]:
Amazon DynamoDB – 99.99%;
Amazon SageMaker - 99.95%;
AWS IoT Core - 99.9%;
AWS IoT Device Management - 99.9%;
AWS CloudWatch - 99.9%;
AWS CloudTrail - 99.9%;
Amazon QuickSight - 99.9%;
Amazon Simple Notification Service (SNS) - 99.9%;
Amazon S3 - 99%.
AWS is available in all the regions where the researched company
operates.
Interoperability AWS supports microservices architectures. Microservices are an
architectural and organizational approach to software development
where software is composed of small independent services that
communicate over well-defined APIs. Microservices architectures make
applications easier to scale and faster to develop.
AWS IoT has a partnership with Libelium and supports the integration
of its devices which were chosen for the project in the researched
company.
Scalability By default, AWS provides enough capacity to meet the initial scalability
requirement for the IoT system to be developed. If the system is
expanded, AWS Auto Scaling service can be applied. AWS Auto
Scaling allows to monitor applications and automatically adjust capacity
to maintain steady, predictable performance at the lowest possible cost.
Modifiability As was mentioned previously, AWS supports microservices
architectures. The IoT system’s architecture will be based on
microservices best practices to enable easy modifiability.
Usability AWS services hide implementation complexity from the users and
provide easy-to-use GUIs to operate in. The agronomists are going to
use Amazon QuickSight, which was designed specifically for business
users who are not proficient in technical aspects of information
technologies.
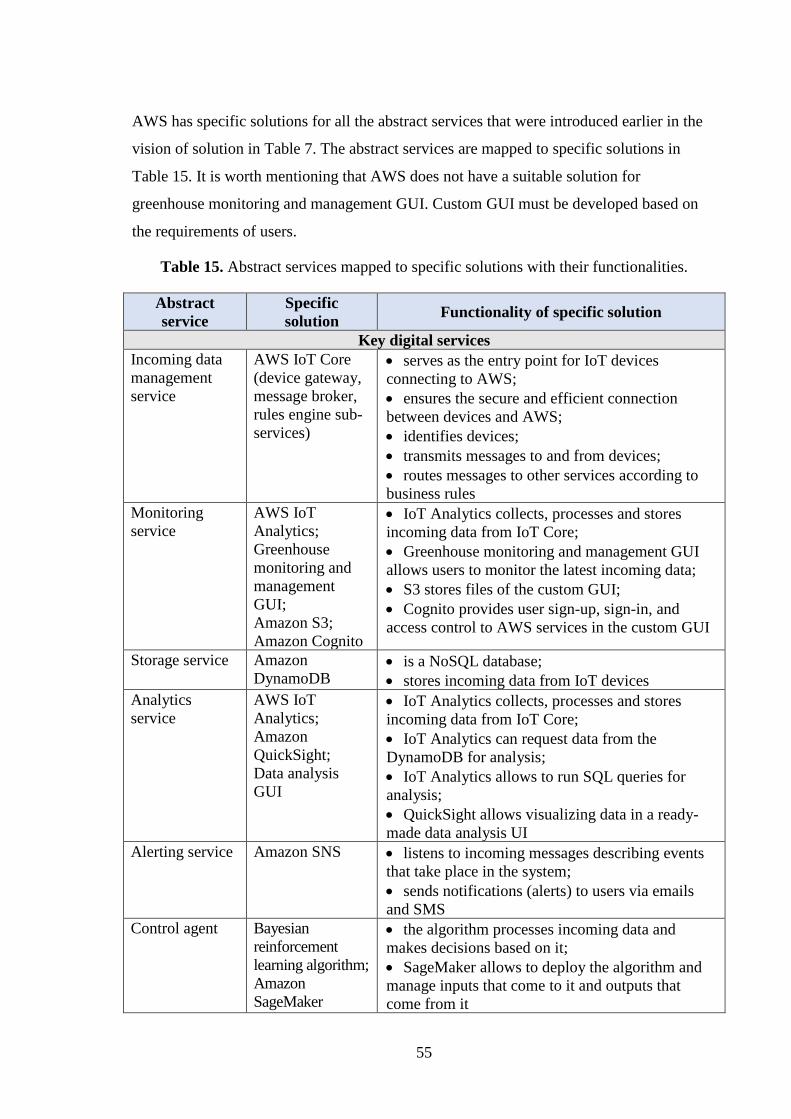
55
AWS has specific solutions for all the abstract services that were introduced earlier in the
vision of solution in Table 7. The abstract services are mapped to specific solutions in
Table 15. It is worth mentioning that AWS does not have a suitable solution for
greenhouse monitoring and management GUI. Custom GUI must be developed based on
the requirements of users.
Table 15. Abstract services mapped to specific solutions with their functionalities.
Abstract
service
Specific
solution Functionality of specific solution
Key digital services
Incoming data
management
service
AWS IoT Core
(device gateway,
message broker,
rules engine sub-
services)
• serves as the entry point for IoT devices
connecting to AWS;
• ensures the secure and efficient connection
between devices and AWS;
• identifies devices;
• transmits messages to and from devices;
• routes messages to other services according to
business rules
Monitoring
service
AWS IoT
Analytics;
Greenhouse
monitoring and
management
GUI;
Amazon S3;
Amazon Cognito
• IoT Analytics collects, processes and stores
incoming data from IoT Core;
• Greenhouse monitoring and management GUI
allows users to monitor the latest incoming data;
• S3 stores files of the custom GUI;
• Cognito provides user sign-up, sign-in, and
access control to AWS services in the custom GUI
Storage service Amazon
DynamoDB • is a NoSQL database;
• stores incoming data from IoT devices
Analytics
service
AWS IoT
Analytics;
Amazon
QuickSight;
Data analysis
GUI
• IoT Analytics collects, processes and stores
incoming data from IoT Core;
• IoT Analytics can request data from the
DynamoDB for analysis;
• IoT Analytics allows to run SQL queries for
analysis;
• QuickSight allows visualizing data in a ready-
made data analysis UI
Alerting service Amazon SNS • listens to incoming messages describing events
that take place in the system;
• sends notifications (alerts) to users via emails
and SMS
Control agent Bayesian
reinforcement
learning algorithm;
Amazon
SageMaker
• the algorithm processes incoming data and
makes decisions based on it;
• SageMaker allows to deploy the algorithm and
manage inputs that come to it and outputs that
come from it
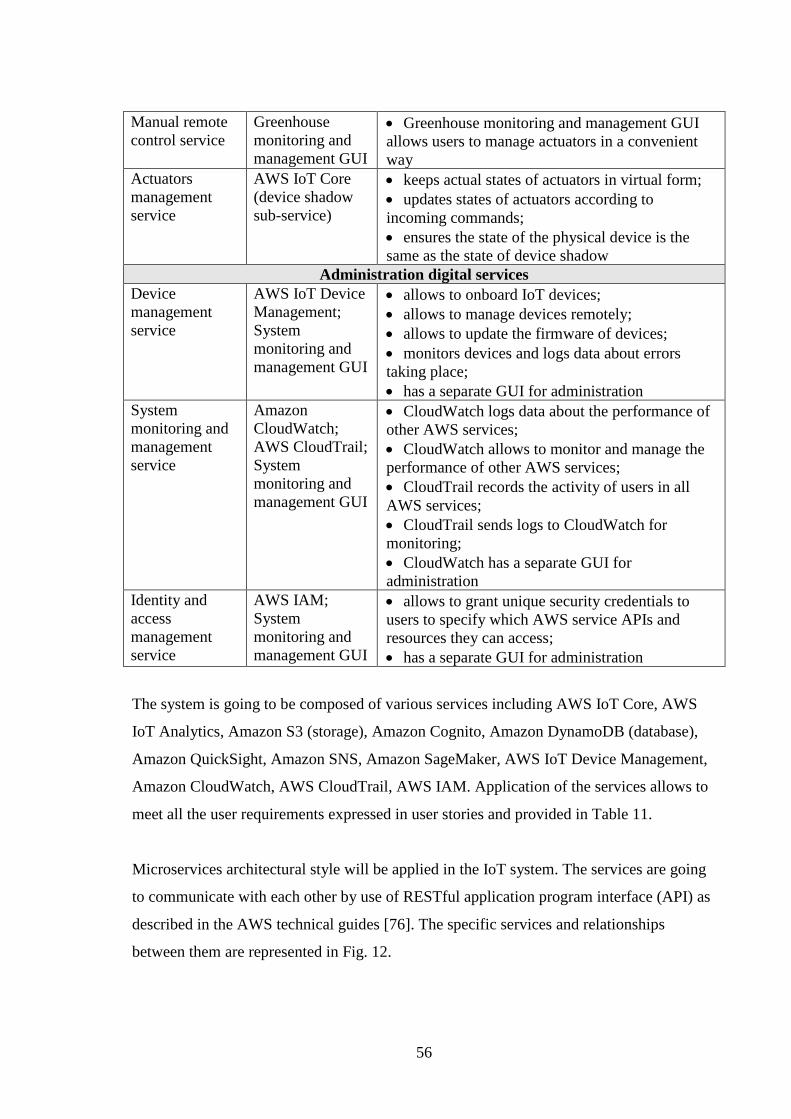
56
Manual remote
control service
Greenhouse
monitoring and
management GUI
• Greenhouse monitoring and management GUI
allows users to manage actuators in a convenient
way
Actuators
management
service
AWS IoT Core
(device shadow
sub-service)
• keeps actual states of actuators in virtual form;
• updates states of actuators according to
incoming commands;
• ensures the state of the physical device is the
same as the state of device shadow
Administration digital services
Device
management
service
AWS IoT Device
Management;
System
monitoring and
management GUI
• allows to onboard IoT devices;
• allows to manage devices remotely;
• allows to update the firmware of devices;
• monitors devices and logs data about errors
taking place;
• has a separate GUI for administration
System
monitoring and
management
service
Amazon
CloudWatch;
AWS CloudTrail;
System
monitoring and
management GUI
• CloudWatch logs data about the performance of
other AWS services;
• CloudWatch allows to monitor and manage the
performance of other AWS services;
• CloudTrail records the activity of users in all
AWS services;
• CloudTrail sends logs to CloudWatch for
monitoring;
• CloudWatch has a separate GUI for
administration
Identity and
access
management
service
AWS IAM;
System
monitoring and
management GUI
• allows to grant unique security credentials to
users to specify which AWS service APIs and
resources they can access;
• has a separate GUI for administration
The system is going to be composed of various services including AWS IoT Core, AWS
IoT Analytics, Amazon S3 (storage), Amazon Cognito, Amazon DynamoDB (database),
Amazon QuickSight, Amazon SNS, Amazon SageMaker, AWS IoT Device Management,
Amazon CloudWatch, AWS CloudTrail, AWS IAM. Application of the services allows to
meet all the user requirements expressed in user stories and provided in Table 11.
Microservices architectural style will be applied in the IoT system. The services are going
to communicate with each other by use of RESTful application program interface (API) as
described in the AWS technical guides [76]. The specific services and relationships
between them are represented in Fig. 12.

57
Fig. 12. Functional view.
As can be seen from Fig. 12, the system is going to have three main graphical user
interfaces (on the top of Figure 12). The data analysis GUI is a part of Amazon QuickSight
service, which is used for the analysis of the data extracted from the database. The
greenhouse monitoring and management GUI will be made from the scratch with the use
of Amazon Cognito (for user sign-up, sign-in, and access control) and Amazon S3 (for file
storage). The system monitoring and management GUI is a part of the AWS Management
Console [77], which is used for access control and system monitoring by system
administrators and business users. Some of the services have their own additional GUIs
which are not represented in the Functional view to simplify diagram perception.
For the convenience of representation, the descriptions of the relationships are given in Table 16.
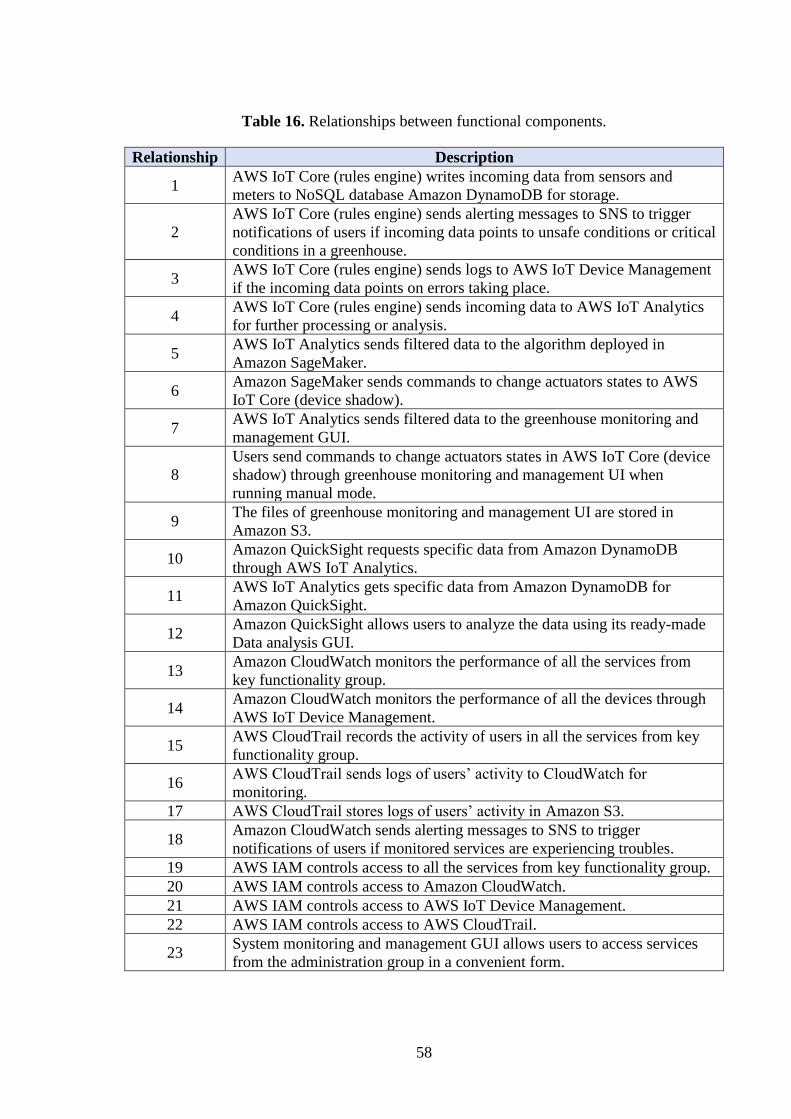
58
Table 16. Relationships between functional components.
Relationship Description
1 AWS IoT Core (rules engine) writes incoming data from sensors and
meters to NoSQL database Amazon DynamoDB for storage.
2
AWS IoT Core (rules engine) sends alerting messages to SNS to trigger
notifications of users if incoming data points to unsafe conditions or critical
conditions in a greenhouse.
3 AWS IoT Core (rules engine) sends logs to AWS IoT Device Management
if the incoming data points on errors taking place.
4 AWS IoT Core (rules engine) sends incoming data to AWS IoT Analytics
for further processing or analysis.
5 AWS IoT Analytics sends filtered data to the algorithm deployed in
Amazon SageMaker.
6 Amazon SageMaker sends commands to change actuators states to AWS
IoT Core (device shadow).
7 AWS IoT Analytics sends filtered data to the greenhouse monitoring and
management GUI.
8
Users send commands to change actuators states in AWS IoT Core (device
shadow) through greenhouse monitoring and management UI when
running manual mode.
9 The files of greenhouse monitoring and management UI are stored in
Amazon S3.
10 Amazon QuickSight requests specific data from Amazon DynamoDB
through AWS IoT Analytics.
11 AWS IoT Analytics gets specific data from Amazon DynamoDB for
Amazon QuickSight.
12 Amazon QuickSight allows users to analyze the data using its ready-made
Data analysis GUI.
13 Amazon CloudWatch monitors the performance of all the services from
key functionality group.
14 Amazon CloudWatch monitors the performance of all the devices through
AWS IoT Device Management.
15 AWS CloudTrail records the activity of users in all the services from key
functionality group.
16 AWS CloudTrail sends logs of users’ activity to CloudWatch for
monitoring.
17 AWS CloudTrail stores logs of users’ activity in Amazon S3.
18 Amazon CloudWatch sends alerting messages to SNS to trigger
notifications of users if monitored services are experiencing troubles.
19 AWS IAM controls access to all the services from key functionality group.
20 AWS IAM controls access to Amazon CloudWatch.
21 AWS IAM controls access to AWS IoT Device Management.
22 AWS IAM controls access to AWS CloudTrail.
23 System monitoring and management GUI allows users to access services
from the administration group in a convenient form.

59
5 DISCUSSION AND CONCLUSIONS
In the beginning of the thesis, the author stated two research questions that needed to be
addressed. The questions are:
1. What are the requirements of the IoT system for greenhouse farming from the
researched company perspective?
2. How should the high-view architecture of the IoT system look?
The answers to these questions are represented in the results chapter of the thesis. They
cannot be shortened for the conclusions because each answer contains lots of equally
important details. Below are the main findings which were discovered while answering the
research questions.
Business requirements were highlighted as the most important ones because they represent
the wishes of the main decision-makers of the company. The main business need that the
IoT system must satisfy is the increase in production volume of cannabis. The CEO of the
company sees the monitoring, data analysis, and automation capabilities as the solution.
The business representatives want the system to sense its greenhouses, make decisions
based on accurate data, and act on the environment all automatically. The company is
expanding fast and has more greenhouses each year. That is why the CEO of the company
wants the solution to be as scalable as possible. The author found that the cloud-based IoT
system can provide all the needed capabilities and scale to hundreds of globally distributed
greenhouses. That is why it was chosen as the solution.
Development of the architecture required decisions on both physical devices and IoT
platform with its services. A wide range of devices offered by Libelium and services
offered by AWS allowed to create the architecture that consists almost entirely of the
elements provided by these reputable companies. Libelium is specialized in the agricultural
field and has the sensors to measure all the parameters that the researched company needs
to monitor. AWS is not specialized in the agricultural field but has all the services which
are needed for the greenhouse monitoring and automation use case as the results shown.
Use of ready-made Libelium devices and AWS services can simplify the development of
the IoT system and reduce time to market.
60
The findings mean that both hardware and software vendors have all the necessary
products that can be used by agricultural companies in their IoT application projects.
Creation of architecture and subsequent implementation of the IoT system using the
solutions from vendors should not require much effort. This finding was surprising as the
previous work of other authors captured in the scientific literature does not cover the
application of ready-made solutions. Almost all the previous applications in greenhouse
farming that were analyzed provide a narrow view from one perspective, such as the
development of custom WSN. This thesis is different from what was done by most of the
researches previously in that it provides an extended view of the greenhouse monitoring
and automation system that utilizes the capabilities of many technologies such as WSN,
actuators, cloud computing, and IoT platform at once.
The thesis presented the high-view architecture of the IoT system for the researched
company. This architecture does not cover all the development and deployment issues and
can not be properly evaluated before the implementation. The future research must fill
these gaps by presenting detailed technical architecture and providing the results of test
implementation of the IoT system that was developed based on it.
61
REFERENCES
[1] G. Omale, “Gartner Identifies Top 10 Strategic IoT Technologies and Trends,”
Gartner website, 11-Jul-2018. [Online]. Available:
https://www.gartner.com/en/newsroom/press-releases/2018-11-07-gartner-identifies-
top-10-strategic-iot-technologies-and-trends. [Accessed: 22-May-2019].
[2] “Bain & Company predicts the Internet of Things market will more than double to
$520 billion by 2021,” Bain & Company website, 08-Aug-2018. [Online]. Available:
https://www.bain.com/about/media-center/press-releases/2018/bain-predicts-the-iot-
market-will-more-than-double-by-2021/. [Accessed: 22-May-2019].
[3] J. Gubbi, R. Buyya, S. Marusic, and M. Palaniswami, “Internet of Things (IoT): A
vision, architectural elements, and future directions,” Future Gener. Comput. Syst.,
vol. 29, no. 7, pp. 1645–1660, Sep. 2013.
[4] A. Jimenez, S. Jimenez, P. Lozada, and C. Jimenez, “Wireless Sensors Network in
the Efficient Management of Greenhouse Crops,” in 2012 Ninth International
Conference on Information Technology - New Generations, Las Vegas, NV, USA,
2012, pp. 680–685.
[5] R. Ramin Shamshiri et al., “Advances in greenhouse automation and controlled
environment agriculture: A transition to plant factories and urban agriculture,” Int. J.
Agric. Biol. Eng., vol. 11, no. 1, pp. 1–22, 2018.
[6] J. M. Wachira, P. M. Mshenga, and M. Saidi, Comparison of the Profitability of
Small-scale Greenhouse and Open-field Tomato Production Systems in Nakuru-North
District, Kenya, vol. 6. 2014.
[7] L. F. M. Marcelis and S. De Pascale, Crop management in greenhouses: Adapting the
growth conditions to the plant needs or adapting the plant to the growth conditions?,
vol. 807. 2009.
[8] G. van Straten, H. Challa, and F. Buwalda, “Towards user accepted optimal control of
greenhouse climate,” Comput. Electron. Agric., vol. 26, no. 3, pp. 221–238, May
2000.
[9] G. van Straten, W. van L. G, E. J. Van Henten, and R. J. C. Ooteghem, Optimal
Control of Greenhouse Cultivation. 2011.
[10] “AI takes control in the greenhouse: Team Sonoma wins Autonomous Greenhouse
Challenge,” Wageningen University & Research website, 12-Dec-2018. [Online].
Available: https://www.wur.nl/en/newsarticle/AI-takes-control-in-the-greenhouse-
Team-Sonoma-wins-Autonomous-Greenhouse-Challenge.htm. [Accessed: 22-May-
2019].
[11] M. O. Bonn-Miller, M. T. Boden, M. M. Bucossi, and K. A. Babson, “Self-reported
cannabis use characteristics, patterns and helpfulness among medical cannabis users,”
Am. J. Drug Alcohol Abuse, vol. 40, no. 1, pp. 23–30, 2014.
[12] “International Drug Control Conventions,” UNODC website. [Online]. Available:
https://www.unodc.org/unodc/en/commissions/CND/conventions.html. [Accessed:
22-May-2019].
[13] M. Bosler, “Global Legal Cannabis Market to Reach US$166 Billion By 2025,”
Euromonitor International, 26-Feb-2019. [Online]. Available:
https://blog.euromonitor.com/global-legal-cannabis-market-to-reach-us166-billion-
by-2025/. [Accessed: 22-May-2019].

62
[14] D. Miorandi, S. Sicari, F. De Pellegrini, and I. Chlamtac, “Internet of things: Vision,
applications and research challenges,” Ad Hoc Netw., vol. 10, no. 7, pp. 1497–1516,
Sep. 2012.
[15] S. Yoo, J. Kim, T. Kim, S. Ahn, J. Sung, and D. Kim, “A2S: Automated Agriculture
System based on WSN,” p. 5, 2007.
[16] F. Bonomi, R. Milito, J. Zhu, and S. Addepalli, “Fog Computing and Its Role in the
Internet of Things,” in Proceedings of the First Edition of the MCC Workshop on
Mobile Cloud Computing, New York, NY, USA, 2012, pp. 13–16.
[17] I. F. Akyildiz, Weilian Su, Y. Sankarasubramaniam, and E. Cayirci, “A survey on
sensor networks,” IEEE Commun. Mag., vol. 40, no. 8, pp. 102–114, Aug. 2002.
[18] H. Jawad, R. Nordin, S. Gharghan, A. Jawad, and M. Ismail, “Energy-Efficient
Wireless Sensor Networks for Precision Agriculture: A Review,” Sensors, vol. 17, no.
8, p. 1781, Aug. 2017.
[19] L. Ruiz-Garcia, L. Lunadei, P. Barreiro, and I. Robla, “A Review of Wireless Sensor
Technologies and Applications in Agriculture and Food Industry: State of the Art and
Current Trends,” Sensors, vol. 9, no. 6, pp. 4728–4750, Jun. 2009.
[20] J. Yick, B. Mukherjee, and D. Ghosal, “Wireless sensor network survey,” Comput.
Netw., vol. 52, no. 12, pp. 2292–2330, Aug. 2008.
[21] S. Madakam, R. Ramaswamy, and S. Tripathi, “Internet of Things (IoT): A Literature
Review,” J. Comput. Commun., vol. 03, no. 05, pp. 164–173, 2015.
[22] D. Uckelmann, M. Harrison, and F. Michahelles, “An Architectural Approach
Towards the Future Internet of Things,” in Architecting the Internet of Things, D.
Uckelmann, M. Harrison, and F. Michahelles, Eds. Berlin, Heidelberg: Springer
Berlin Heidelberg, 2011, pp. 1–24.
[23] I. F. Akyildiz and I. H. Kasimoglu, “Wireless sensor and actor networks: research
challenges,” Ad Hoc Netw., vol. 2, no. 4, pp. 351–367, Oct. 2004.
[24] O. Mirabella and M. Brischetto, “A Hybrid Wired/Wireless Networking
Infrastructure for Greenhouse Management,” IEEE Trans. Instrum. Meas., vol. 60,
no. 2, pp. 398–407, Feb. 2011.
[25] P. Mell and T. Grance, “The NIST Definition of Cloud Computing,” p. 7.
[26] A. Botta, W. de Donato, V. Persico, and A. Pescapé, “Integration of Cloud computing
and Internet of Things: A survey,” Future Gener. Comput. Syst., vol. 56, pp. 684–
700, Mar. 2016.
[27] M. A. A. da Cruz, J. J. P. C. Rodrigues, J. Al-Muhtadi, V. V. Korotaev, and V. H. C.
de Albuquerque, “A Reference Model for Internet of Things Middleware,” IEEE
Internet Things J., vol. 5, no. 2, pp. 871–883, Apr. 2018.
[28] A. Farahzadi, P. Shams, J. Rezazadeh, and R. Farahbakhsh, “Middleware
technologies for cloud of things: a survey,” Digit. Commun. Netw., vol. 4, no. 3, pp.
176–188, Aug. 2018.
[29] V. Issarny, M. Caporuscio, and N. Georgantas, “A Perspective on the Future of
Middleware-based Software Engineering,” in Future of Software Engineering (FOSE
’07), Minneapolis, MN, USA, 2007, pp. 244–258.
[30] “RightScale 2019 State of the Cloud Report from Flexera,” p. 50, 2019.
[31] F. Civerchia, S. Bocchino, C. Salvadori, E. Rossi, L. Maggiani, and M. Petracca,
“Industrial Internet of Things monitoring solution for advanced predictive
maintenance applications,” Enterp. Model. Syst. Integr. Smart Manuf., vol. 7, pp. 4–
12, 2017.

63
[32] S. Wang, J. Wan, D. Li, and C. Zhang, “Implementing Smart Factory of Industrie 4.0:
An Outlook,” Int. J. Distrib. Sens. Netw., vol. 12, no. 1, p. 3159805, 2016.
[33] Miao Yun and Bu Yuxin, “Research on the architecture and key technology of
Internet of Things (IoT) applied on smart grid,” in 2010 International Conference on
Advances in Energy Engineering, 2010, pp. 69–72.
[34] R. Li, T. Song, N. Capurso, J. Yu, J. Couture, and X. Cheng, “IoT Applications on
Secure Smart Shopping System,” IEEE Internet Things J., vol. 4, no. 6, pp. 1945–
1954, Dec. 2017.
[35] M. Hassanalieragh et al., “Health Monitoring and Management Using Internet-of-
Things (IoT) Sensing with Cloud-Based Processing: Opportunities and Challenges,”
in 2015 IEEE International Conference on Services Computing, 2015, pp. 285–292.
[36] Z. D. R. Gnimpieba, A. Nait-Sidi-Moh, D. Durand, and J. Fortin, “Using Internet of
Things Technologies for a Collaborative Supply Chain: Application to Tracking of
Pallets and Containers,” 10th Int. Conf. Future Netw. Commun. FNC 2015 12th Int.
Conf. Mob. Syst. Pervasive Comput. MobiSPC 2015 Affil. Workshop, vol. 56, pp.
550–557, 2015.
[37] Yun Shi, Zhen Wang, Xianfeng Wang, and Shanwen Zhang, “Internet of Things
Application to Monitoring Plant Disease and Insect Pests,” in 2015 International
conference on Applied Science and Engineering Innovation, 2015.
[38] B. L. Risteska Stojkoska and K. V. Trivodaliev, “A review of Internet of Things for
smart home: Challenges and solutions,” J. Clean. Prod., vol. 140, pp. 1454–1464,
2017.
[39] F. Leccese, C. Marco, and D. Trinca, A Smart City Application: A Fully Controlled
Street Lighting Isle Based on Raspberry-Pi Card, a ZigBee Sensor Network and
WiMAX, vol. 14. 2014.
[40] S. Cook and R. G. V. Bramley, Precision agriculture - Opportunities, benefits and
pitfalls of site-specific crop management in Australia, vol. 38. 1998.
[41] S. morteza Zahedi and S. Reza Zahedi, Role of Information and Communication
Technologies in Modern Agriculture, vol. 4. 2012.
[42] A. Abdullah, S. A. Enazi, and I. Damaj, “AgriSys: A smart and ubiquitous controlled-
environment agriculture system,” in 2016 3rd MEC International Conference on Big
Data and Smart City (ICBDSC), Muscat, Oman, 2016, pp. 1–6.
[43] R. K. Kodali, V. Jain, and S. Karagwal, “IoT based smart greenhouse,” in 2016 IEEE
Region 10 Humanitarian Technology Conference (R10-HTC), Agra, India, 2016, pp.
1–6.
[44] F. Ferrández-Pastor, J. García-Chamizo, M. Nieto-Hidalgo, J. Mora-Pascual, and J.
Mora-Martínez, “Developing Ubiquitous Sensor Network Platform Using Internet of
Things: Application in Precision Agriculture,” Sensors, vol. 16, no. 7, p. 1141, Jul.
2016.
[45] R. Pahuja, H. K. Verma, and M. Uddin, “A Wireless Sensor Network for Greenhouse
Climate Control,” IEEE Pervasive Comput., vol. 12, no. 2, pp. 49–58, Apr. 2013.
[46] D.-H. Park and J.-W. Park, “Wireless Sensor Network-Based Greenhouse
Environment Monitoring and Automatic Control System for Dew Condensation
Prevention,” Sensors, vol. 11, no. 4, pp. 3640–3651, Mar. 2011.
[47] J. Mineraud, O. Mazhelis, X. Su, and S. Tarkoma, “A gap analysis of Internet-of-
Things platforms,” Internet Things Res. Chall. Solut., vol. 89–90, pp. 5–16, 2016.
[48] “Competition win a steppingstone in the greater journey to create sustainable
farming,” Microsoft Research Blog, 18-Dec-2018. [Online]. Available:

64
https://www.microsoft.com/en-us/research/blog/competition-win-a-steppingstone-in-
the-greater-journey-to-create-sustainable-farming/. [Accessed: 22-May-2019].
[49] M. Azaza, C. Tanougast, E. Fabrizio, and A. Mami, “Smart greenhouse fuzzy logic
based control system enhanced with wireless data monitoring,” ISA Trans., vol. 61,
pp. 297–307, Mar. 2016.
[50] Y. Zhou, X. Yang, X. Guo, M. Zhou, and L. Wang, “A Design of Greenhouse
Monitoring & Control System Based on ZigBee Wireless Sensor Network,”
in 2007 International Conference on Wireless Communications, Networking and
Mobile Computing, Shanghai, China, 2007, pp. 2563–2567.
[51] D. D. Chaudhary, S. P. Nayse, and L. M. Waghmare, “Application of Wireless Sensor
Networks for Greenhouse Parameter Control in Precision Agriculture,” Int. J. Wirel.
Mob. Netw., vol. 3, no. 1, pp. 140–149, Feb. 2011.
[52] K. Rangan and T. Vigneswaran, “An Embedded systems approach to monitor green
house,” in Recent Advances in Space Technology Services and Climate Change 2010
(RSTS & CC-2010), Chennai, India, 2010, pp. 61–65.
[53] H. Liu, Z. Meng, and S. Cui, “A Wireless Sensor Network Prototype for
Environmental Monitoring in Greenhouses,” in 2007 International Conference on
Wireless Communications, Networking and Mobile Computing, Shanghai, China,
2007, pp. 2344–2347.
[54] A. Kumar and G. P. Hancke, “Energy Efficient Environment Monitoring System
Based on the IEEE 802.15.4 Standard for Low Cost Requirements,” IEEE Sens. J.,
vol. 14, no. 8, pp. 2557–2566, Aug. 2014.
[55] T. Ahonen, R. Virrankoski, and M. Elmusrati, “Greenhouse Monitoring with Wireless
Sensor Network,” in 2008 IEEE/ASME International Conference on Mechtronic and
Embedded Systems and Applications, Beijing, China, 2008, pp. 403–408.
[56] C. Duarte-Galvan et al., “Review. Advantages and disadvantages of control theories
applied in greenhouse climate control systems,” Span. J. Agric. Res., vol. 10, no. 4, p.
926, Nov. 2012.
[57] B. W. Boehm, “A Spiral Model of Software Development and Enhancement,” p. 12,
1988.
[58] K. E. Wiegers, “Karl Wiegers Describes 10 Requirements Traps to Avoid,” p. 8,
2000.
[59] K. E. Wiegers and J. Beatty, Software requirements, Third edition. Redmond,
Washington: Microsoft Press, s division of Microsoft Corporation, 2013.
[60] I. Yaqoob et al., “Internet of Things Architecture: Recent Advances, Taxonomy,
Requirements, and Open Challenges,” IEEE Wirel. Commun., vol. 24, no. 3, pp. 10–
16, Jun. 2017.
[61] I. Alqassem and D. Svetinovic, “A taxonomy of security and privacy requirements for
the Internet of Things (IoT),” in 2014 IEEE International Conference on Industrial
Engineering and Engineering Management, Selangor Darul Ehsan, Malaysia, 2014,
pp. 1244–1248.
[62] A. Bassi et al., Eds., Enabling things to talk: designing IoT solutions with the IoT
architectural reference model ; [Iot-A, Internet of things - architecture]. Heidelberg:
Springer, 2013.
[63] D. E. Stokes, Pasteur’s quadrant: Basic science and technological innovation.
Brookings Institution Press, 2011.
[64] M. N. K. Saunders, P. Lewis, and A. Thornhill, Research methods for business
students, Seventh edition. New York: Pearson Education, 2015.

65
[65] P. H. Jarvinen, “Research Questions Guiding Selection of an Appropriate Research
Method,” p. 10, Jan. 2000.
[66] S. T. March and G. F. Smith, “Design and natural science research on information
technology,” Decis. Support Syst., vol. 15, no. 4, pp. 251–266, Dec. 1995.
[67] K. Smolander, “Course CT10A9512 Research Design and Methods, Lappeenranta
University of Technology, School of Engineering Science, Master’s Programme in
Software Engineering and Digital Transformation, academic year 2018-2019.,” 2018.
[68] N. Prat, I. Wattiau, and J. Akoka, Artifact Evaluation in Information Systems Design
Science Research - A Holistic View. 2014.
[69] P. G. H. Kamp and G. J. Timmerman, Computerized environmental control in
greenhouses: a step by step approach. IPC-Plant, 1996.
[70] “Technical guides for Libelium sensor node models,” Libelium website. [Online].
Available: http://www.libelium.com/products/plug-sense/models/. [Accessed: 22-
May-2019].
[71] “Product page of Digi XBee 802.15.4,” Digi International. [Online]. Available:
https://www.digi.com/products/embedded-systems/rf-modules/2-4-ghz-
modules/xbee-802-15-4. [Accessed: 22-May-2019].
[72] “Technical guide for Libelium Meshlium gateway,” Libelium website, 22-May-2019.
[Online]. Available:
http://www.libelium.com/development/meshlium/documentation/. [Accessed: 22-
May-2019].
[73] “Product page of Kamstrup OMNIPOWER,” Kamstrup website. [Online]. Available:
https://www.kamstrup.com/en-en/electricity-solutions/smart-electricity-meters/three-
phase-meter. [Accessed: 22-May-2019].
[74] “AWS title webpage,” AWS website. [Online]. Available: https://aws.amazon.com/.
[Accessed: 22-May-2019].
[75] “AWS Service Level Agreements (SLAs),” AWS website. [Online]. Available:
https://aws.amazon.com/legal/service-level-agreements/. [Accessed: 22-May-2019].
[76] “AWS Documentation,” AWS website. [Online]. Available:
https://docs.aws.amazon.com/. [Accessed: 22-May-2019].
[77] “AWS Management Console,” AWS website. [Online]. Available:
https://aws.amazon.com/console/. [Accessed: 22-May-2019].