LAMPIRAN A KONVERSI PERHITUNGAN EKSTRAKrepository.wima.ac.id/3504/7/Lampiran.pdf · Uji Statistik...
77
97 LAMPIRAN A KONVERSI PERHITUNGAN EKSTRAK Cara perhitungan ekstrak kering seledri untuk formulasi sampo ekstrak kering seledri mengacu penelitian Nimas, Astuti dan Asriningdhiani (2012) bahwa konsentrasi terbaik sebagai anti bakteri adalah 10% sedangkan ekstrak kering yang didapatkan mengandung pengisi dengan perbandingan Seledri dengan pengisi adalah 5 : 1. Maka agar yang diformulasikan sama dengan konsentrasi seledri perlu dikonversikan terlebih dahulu. (ekstrak kering seledri yang telah dikonversi dengan pengisinya) Maka konsentrasi ekstrak kering seledri yang ditimbang adalah 12 % dengan penimbangan 1 bets yaitu 300 gram. (ekstrak kering seledri yang ditimbang dalam 1 formula sediaan)
-
Upload
phungthuan -
Category
Documents
-
view
216 -
download
1
Transcript of LAMPIRAN A KONVERSI PERHITUNGAN EKSTRAKrepository.wima.ac.id/3504/7/Lampiran.pdf · Uji Statistik...

97
LAMPIRAN A
KONVERSI PERHITUNGAN EKSTRAK
Cara perhitungan ekstrak kering seledri untuk formulasi sampo
ekstrak kering seledri mengacu penelitian Nimas, Astuti dan
Asriningdhiani (2012) bahwa konsentrasi terbaik sebagai anti bakteri
adalah 10% sedangkan ekstrak kering yang didapatkan mengandung
pengisi dengan perbandingan Seledri dengan pengisi adalah 5 : 1.
Maka agar yang diformulasikan sama dengan konsentrasi seledri
perlu dikonversikan terlebih dahulu.
(ekstrak kering seledri yang telah dikonversi dengan pengisinya)
Maka konsentrasi ekstrak kering seledri yang ditimbang adalah 12 %
dengan penimbangan 1 bets yaitu 300 gram.
(ekstrak kering seledri yang ditimbang dalam 1 formula sediaan)

98
LAMPIRAN B
STANDARISASI EKSTRAK NON SPESIFIK dan SPESIFIK EKSTRAK KERING SELEDRI (Apium graveolens L.)
A. STANDARISASI NON SPESIFIK
1. Penentuan Kadar Air Replikasi Berat cawan
(g) Berat ekstrak (g)
Berat ekstrak konstan (g)
% kadar (%)
I 43,0489 2,0070 1,9526 2,71 II 58,2802 2,0006 1,9439 2,83 III 56,3502 2,0020 1,9465 2,77 x ± SD 2,77±0,06
Contoh Perhitungan: Replikasi I:
2. Penentuan Kadar Abu Total
Replikasi Berat krus (g)
Berat ekstrak (g)
Berat krus+abu konstan (g)
% kadar (%)
I II III
32,4917 33,7279 33,3258
2,0117 2,0096 2,0770
32,6052 33,8386 33,4441
5,64 5,55 5,69
x ± SD 5,63±0,06
Contoh Perhitungan: Replikasi I:

99
3. Penentuan Kadar Abu Tidak Larut Asam Replikasi Berat krus
(g) Berat ekstrak (g)
Berat abu+HCl konstan (g)
% kadar (%)
I II III
32,4917 33,7279 33,3258
2,0117 2,0096 2,0770
32,4957 33,7326 33,3293
0,20 0,23 0,17
x ± SD 0,20±0,03
Contoh Perhitungan: Replikasi I:
4. Penentuan Kadar Abu Larut Air
Replikasi Berat krus (g)
Berat ekstrak (g)
Berat abu+ Aquadest (g)
% kadar (%)
I 33,7263 2,0166 33,7460 0,98 II 32,4913 2,0194 32,5065 0,75 III 33,2728 2,0770 33,2898 0,82
x ± SD 0,85±0,1
Contoh Perhitungan: Replikasi I:
100
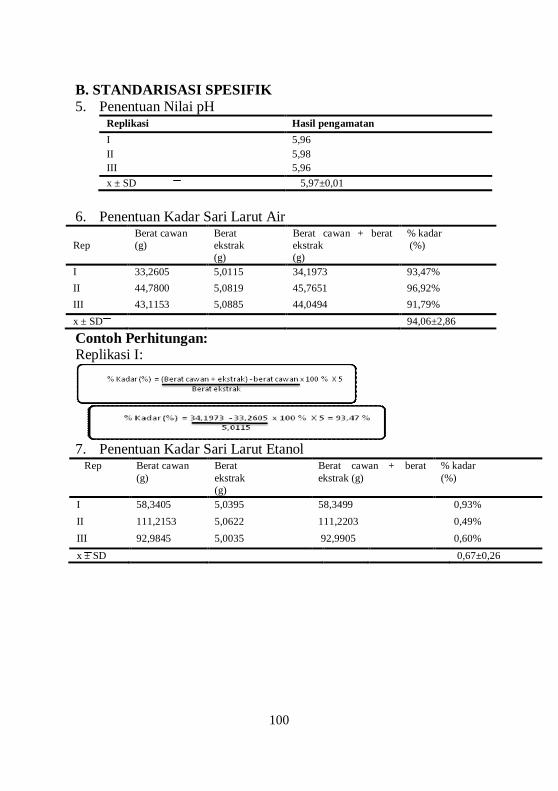
B. STANDARISASI SPESIFIK 5. Penentuan Nilai pH
Replikasi Hasil pengamatan I 5,96 II 5,98 III 5,96 x ± SD 5,97±0,01
6. Penentuan Kadar Sari Larut Air
Rep Berat cawan (g)
Berat ekstrak (g)
Berat cawan + berat ekstrak (g)
% kadar (%)
I 33,2605 5,0115 34,1973 93,47% II 44,7800 5,0819 45,7651 96,92% III 43,1153 5,0885 44,0494 91,79% x ± SD 94,06±2,86
Contoh Perhitungan: Replikasi I:
7. Penentuan Kadar Sari Larut Etanol Rep Berat cawan
(g) Berat ekstrak (g)
Berat cawan + berat ekstrak (g)
% kadar (%)
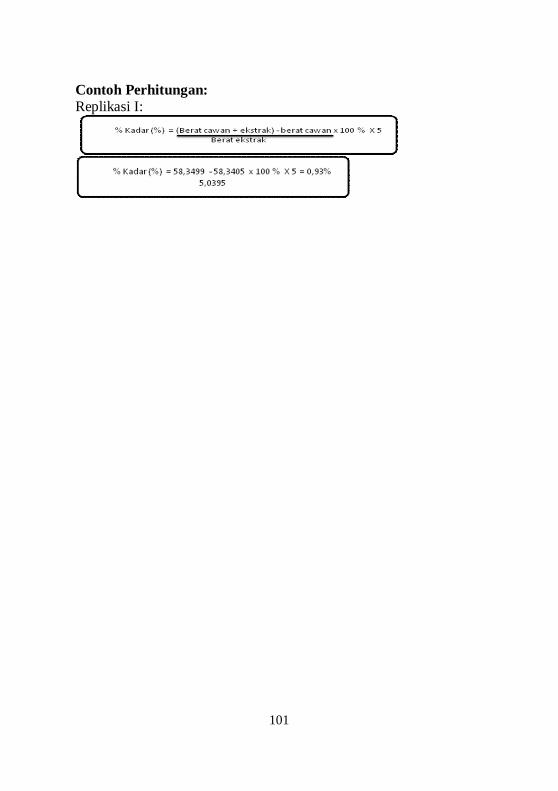
I 58,3405 5,0395 58,3499 0,93% II 111,2153 5,0622 111,2203 0,49% III 92,9845 5,0035 92,9905 0,60% x ± SD 0,67±0,26
101
Contoh Perhitungan: Replikasi I:

102
LAMPIRAN C
HASIL SEDIAAN SAMPO CAIR JERNIH EKSTRAK KERING SELEDRI (APIUM GRAVEOLENS L.)
Tabel Pengamatan sediaan sampo ekstrak kering seledri (apium graveolens l.)
Formula Parameter Uji Bets Bentuk Warna Bau
I 1 Cair Coklat jernih Berbau mint 2 Cair Coklat jernih Berbau mint
II 1 Cair Coklat jernih Berbau mint 2 Cair Coklat jernih Berbau mint
III 1 Cair Coklat jernih Berbau mint
Basis 2 1 2
Cair Cair Cair
Coklat jernih Coklat jernih Coklat jernih
Berbau mint Berbau mint Berbau mint
Keterangan I : Formula dengan konsentrasi xanthan gum 0,1% II : Formula dengan konsentrasi xanthan gum 0,3% III : Formula dengan konsentrasi xanthan gum 0,5% Blangko : Blangko tanpa xanthan gum
103
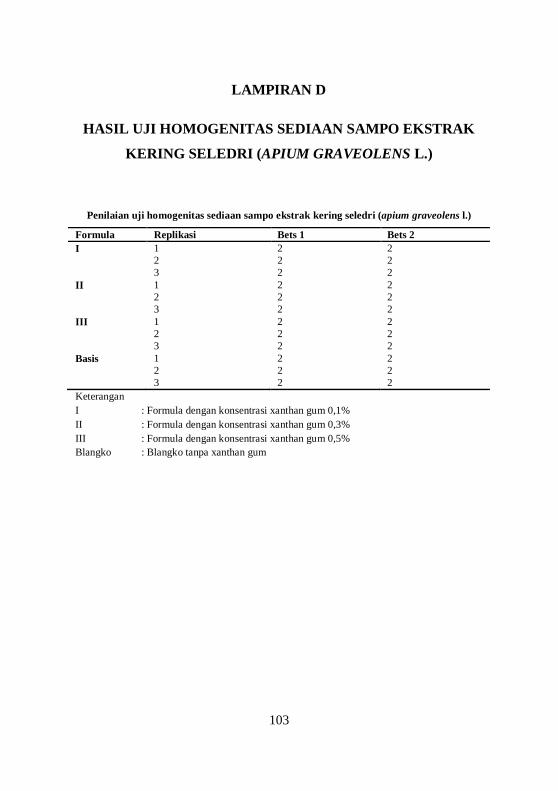
LAMPIRAN D
HASIL UJI HOMOGENITAS SEDIAAN SAMPO EKSTRAK
KERING SELEDRI (APIUM GRAVEOLENS L.)
Penilaian uji homogenitas sediaan sampo ekstrak kering seledri (apium graveolens l.)
Formula Replikasi Bets 1 Bets 2 I 1 2 2 2 2 2 3 2 2 II 1 2 2 2 2 2 3 2 2 III 1 2 2 2 2 2 3 2 2 Basis 1 2 2 2 2 2 3 2 2 Keterangan I : Formula dengan konsentrasi xanthan gum 0,1% II : Formula dengan konsentrasi xanthan gum 0,3% III : Formula dengan konsentrasi xanthan gum 0,5% Blangko : Blangko tanpa xanthan gum
104
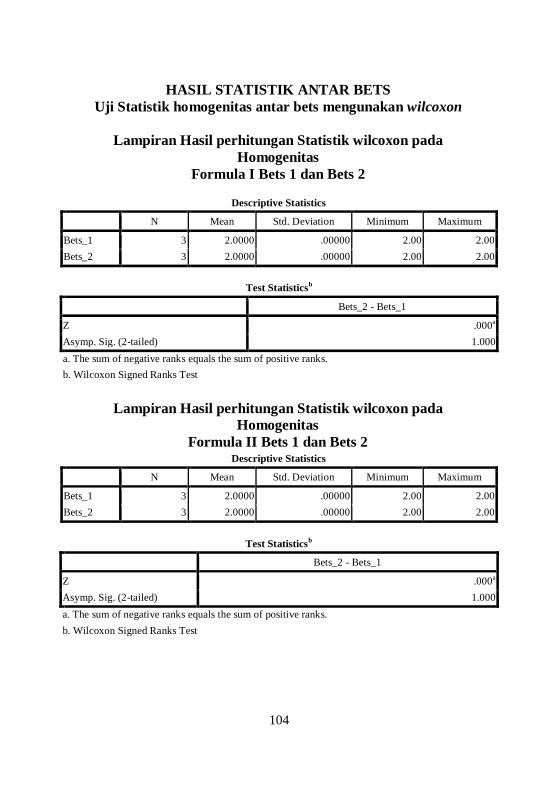
HASIL STATISTIK ANTAR BETS Uji Statistik homogenitas antar bets mengunakan wilcoxon
Lampiran Hasil perhitungan Statistik wilcoxon pada
Homogenitas Formula I Bets 1 dan Bets 2
Descriptive Statistics
N Mean Std. Deviation Minimum Maximum
Bets_1 3 2.0000 .00000 2.00 2.00 Bets_2 3 2.0000 .00000 2.00 2.00
Test Statisticsb
Bets_2 - Bets_1
Z .000a Asymp. Sig. (2-tailed) 1.000 a. The sum of negative ranks equals the sum of positive ranks. b. Wilcoxon Signed Ranks Test
Lampiran Hasil perhitungan Statistik wilcoxon pada
Homogenitas Formula II Bets 1 dan Bets 2
Descriptive Statistics
N Mean Std. Deviation Minimum Maximum
Bets_1 3 2.0000 .00000 2.00 2.00 Bets_2 3 2.0000 .00000 2.00 2.00
Test Statisticsb
Bets_2 - Bets_1
Z .000a Asymp. Sig. (2-tailed) 1.000 a. The sum of negative ranks equals the sum of positive ranks. b. Wilcoxon Signed Ranks Test
105
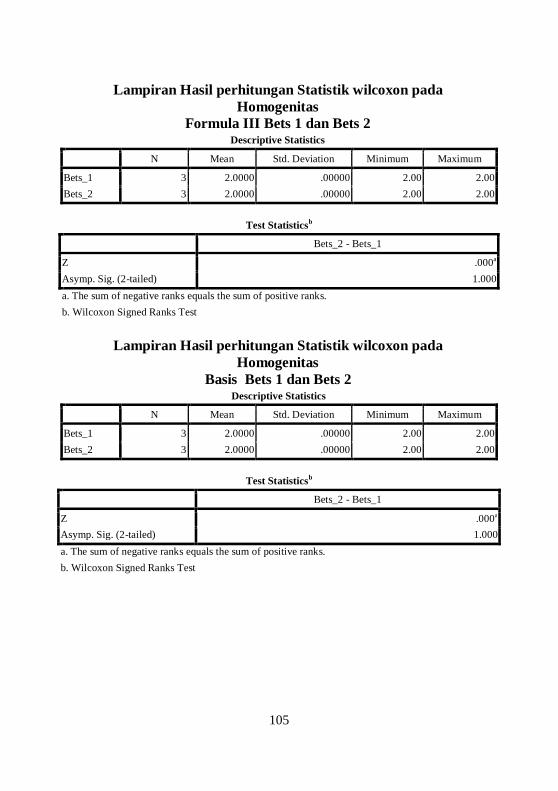
Lampiran Hasil perhitungan Statistik wilcoxon pada Homogenitas
Formula III Bets 1 dan Bets 2 Descriptive Statistics
N Mean Std. Deviation Minimum Maximum
Bets_1 3 2.0000 .00000 2.00 2.00 Bets_2 3 2.0000 .00000 2.00 2.00
Test Statisticsb
Bets_2 - Bets_1
Z .000a Asymp. Sig. (2-tailed) 1.000 a. The sum of negative ranks equals the sum of positive ranks. b. Wilcoxon Signed Ranks Test
Lampiran Hasil perhitungan Statistik wilcoxon pada
Homogenitas Basis Bets 1 dan Bets 2
Descriptive Statistics
N Mean Std. Deviation Minimum Maximum
Bets_1 3 2.0000 .00000 2.00 2.00 Bets_2 3 2.0000 .00000 2.00 2.00
Test Statisticsb
Bets_2 - Bets_1
Z .000a Asymp. Sig. (2-tailed) 1.000 a. The sum of negative ranks equals the sum of positive ranks. b. Wilcoxon Signed Ranks Test
106
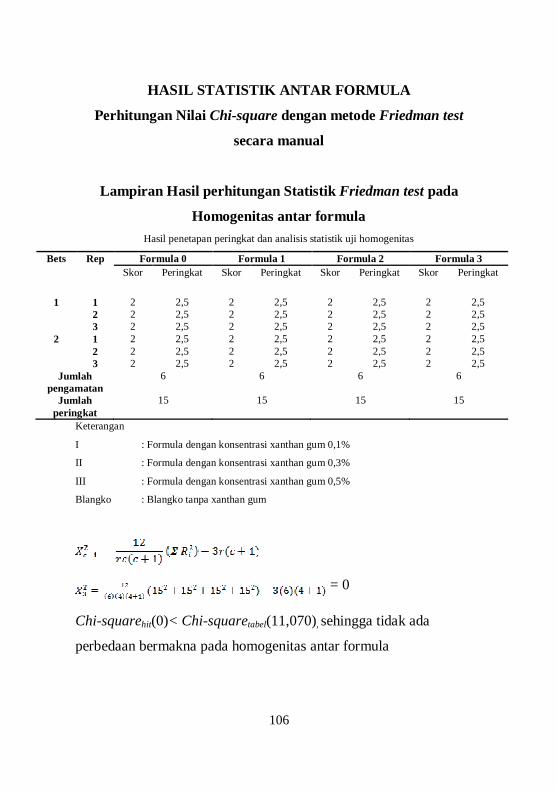
HASIL STATISTIK ANTAR FORMULA
Perhitungan Nilai Chi-square dengan metode Friedman test
secara manual
Lampiran Hasil perhitungan Statistik Friedman test pada
Homogenitas antar formula Hasil penetapan peringkat dan analisis statistik uji homogenitas
Bets Rep Formula 0 Formula 1 Formula 2 Formula 3 Skor Peringkat Skor Peringkat Skor Peringkat Skor Peringkat
1 1 2 2,5 2 2,5 2 2,5 2 2,5 2 2 2,5 2 2,5 2 2,5 2 2,5 3 2 2,5 2 2,5 2 2,5 2 2,5
2 1 2 2,5 2 2,5 2 2,5 2 2,5 2 2 2,5 2 2,5 2 2,5 2 2,5 3 2 2,5 2 2,5 2 2,5 2 2,5
Jumlah pengamatan
6 6 6 6
Jumlah peringkat
15 15 15 15
Keterangan
I : Formula dengan konsentrasi xanthan gum 0,1%
II : Formula dengan konsentrasi xanthan gum 0,3%
III : Formula dengan konsentrasi xanthan gum 0,5%
Blangko : Blangko tanpa xanthan gum
= 0
Chi-squarehit(0)< Chi-squaretabel(11,070), sehingga tidak ada
perbedaan bermakna pada homogenitas antar formula

107
LAMPIRAN E HASIL PH SAMPO SEDIAAN SAMPO EKSTRAK KERING
SELEDRI (APIUM GRAVEOLENS L.)
Nilai uji pH sediaan sampo ekstrak kering seledri (Apium graveolens L.) Formula Replikasi Bets 1 Bets 2
I 1 5,97 5,95 2 5,95 5,96 3 5,97 5,96
X ± SD 5,96±0,1 5,96±0,1
II 1 5,94 5,95 2 5,94 5,95 3 5,96 5,96
X ± SD 5,95±0,1 5,95±0,1
III 1 5,95 5,94 2 5,96 5,95
3 5,95 5,95
X ± SD 5,95±0,1 5,95±0,1
Basis 1 2 3
5,94 5,95 5,95
5,96 5,96 5,95
X ± SD 5,95±0,1 5,96±0,1
Keterangan I : Formula dengan konsentrasi xanthan gum 0,1% II : Formula dengan konsentrasi xanthan gum 0,3% III : Formula dengan konsentrasi xanthan gum 0,5% Blangko : Blangko tanpa xanthan gum

108
HASIL STATISTIK ANTAR BETS Uji Statistik pH antar bets mengunakan independent t-test
Lampiran Hasil perhitungan Statistik Uji t-bebas pada
Pengujian pH Formula I Bets 1 dan Bets 2
Group Statistics
Bets N Mean Std. Deviation Std. Error Mean
Nilai_pH 1.00 3 5.9633 .01155 .00667
2.00 3 5.9567 .00577 .00333
Independent Samples Test
Levene's Test for Equality of Variances t-test for Equality of Means
95% Confidence Interval of the
Difference
F Sig. t df Sig. (2-tailed)
Mean Differenc
e
Std. Error
Difference Lower Upper
Nilai_pH
Equal variances assumed
3.200 .148 .894 4 .422 .00667 .00745 -.01403 .02736
Equal variances not assumed .894 2.941 .438 .00667 .00745 -.01732 .03066
Lampiran Hasil perhitungan Statistik Uji t-bebas pada
Pengujian pH
Formula II Bets 1 dan Bets 2
Group Statistics
Bets N Mean Std. Deviation Std. Error Mean
Nilai_Ph 1.00 3 5.9467 .01155 .00667
2.00 3 5.9533 .00577 .00333

109
Independent Samples Test
Levene's Test for Equality of Variances t-test for Equality of Means
95% Confidence Interval of the
Difference
F Sig. t df Sig. (2-tailed)
Mean Differen
ce
Std. Error
Difference Lower Upper
Nilai_pH
Equal variances assumed
3.200 .148 -.894 4 .422 -.00667 .00745 -.02736 .01403
Equal variances not assumed -.894 2.941 .438 -.00667 .00745 -.03066 .01732
Lampiran Hasil perhitungan Statistik Uji t-bebas pada
Pengujian pH Formula III Bets 1 dan Bets 2
Group Statistics
Bets N Mean Std. Deviation Std. Error Mean
Nilai_pH 1.00 3 5.9533 .00577 .00333
2.00 3 5.9467 .00577 .00333
Independent Samples Test
Levene's Test for Equality of Variances t-test for Equality of Means
95% Confidence Interval of the
Difference
F Sig. t df
Sig. (2-tailed)
Mean Difference
Std. Error Difference Lower Upper
Nilai_pH
Equal variances assumed
.000 1.000 1.414 4 .230 .00667 .00471 -.00642 .01975
Equal variances not assumed
1.414 4.000 .230 .00667 .00471 -.00642 .01975

110
Lampiran Hasil perhitungan Statistik Uji t-bebas pada Pengujian pH Formula Basis Bets 1 dan Bets 2
Group Statistics
Bets N Mean Std. Deviation Std. Error Mean
Nilai_pH 1.00 3 5.9467 .00577 .00333
2.00 3 6.2900 .58026 .33501
Independent Samples Test
Levene's Test for Equality of Variances t-test for Equality of Means
95% Confidence Interval of the
Difference
F Sig. t df Sig. (2-tailed)
Mean Difference
Std. Error Difference Lower Upper
Nilai_pH
Equal variances assumed
15.671 .017 -1.025
4 .363 -.34333 .33503 -1.27352
.58686
Equal variances not assumed -
1.025 2.000 .413 -.34333 .33503 -
1.78457 1.09791
HASIL STATISTIK ANTAR FORMULA
Uji Statistik pH antar formula mengunakan One way anova
Descriptive Statistics
N Minimum Maximum Mean Std. Deviation
Nilai_pH 24 5.94 5.97 5.9529 .00859 Valid N (listwise) 24
ANOVA Nilai_Ph
Sum of Squares Df Mean Square F Sig.
Between Groups .000 3 .000 2.143 .127 Within Groups .001 20 .000 Total .002 23
111
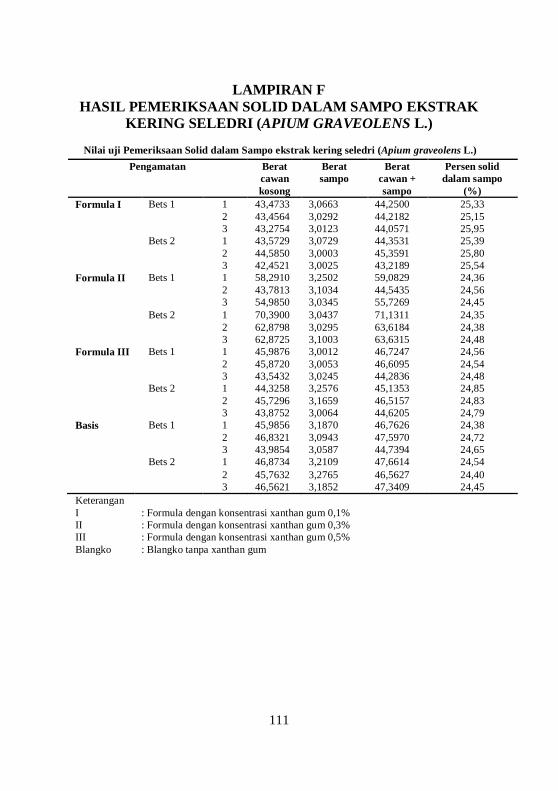
LAMPIRAN F HASIL PEMERIKSAAN SOLID DALAM SAMPO EKSTRAK
KERING SELEDRI (APIUM GRAVEOLENS L.)
Nilai uji Pemeriksaan Solid dalam Sampo ekstrak kering seledri (Apium graveolens L.)
Keterangan I : Formula dengan konsentrasi xanthan gum 0,1% II : Formula dengan konsentrasi xanthan gum 0,3% III : Formula dengan konsentrasi xanthan gum 0,5% Blangko : Blangko tanpa xanthan gum
Pengamatan Berat cawan kosong
Berat sampo
Berat cawan + sampo
Persen solid dalam sampo
(%) Formula I Bets 1 1 43,4733 3,0663 44,2500 25,33 2 43,4564 3,0292 44,2182 25,15 3 43,2754 3,0123 44,0571 25,95 Bets 2 1 43,5729 3,0729 44,3531 25,39 2 44,5850 3,0003 45,3591 25,80 3 42,4521 3,0025 43,2189 25,54 Formula II Bets 1 1 58,2910 3,2502 59,0829 24,36 2 43,7813 3,1034 44,5435 24,56 3 54,9850 3,0345 55,7269 24,45 Bets 2 1 70,3900 3,0437 71,1311 24,35 2 62,8798 3,0295 63,6184 24,38 3 62,8725 3,1003 63,6315 24,48 Formula III Bets 1 1 45,9876 3,0012 46,7247 24,56 2 45,8720 3,0053 46,6095 24,54 3 43,5432 3,0245 44,2836 24,48 Bets 2 1 44,3258 3,2576 45,1353 24,85 2 45,7296 3,1659 46,5157 24,83 3 43,8752 3,0064 44,6205 24,79 Basis Bets 1 1 45,9856 3,1870 46,7626 24,38 2 46,8321 3,0943 47,5970 24,72 3 43,9854 3,0587 44,7394 24,65 Bets 2 1 46,8734 3,2109 47,6614 24,54 2 45,7632 3,2765 46,5627 24,40 3 46,5621 3,1852 47,3409 24,45

112
Contoh Perhitungan: Formula I bets I replikasi I
Nilai Pemeriksaan solid dalam sampo ekstrak kering seledri
(Apium graveolens L.) Formula Replikasi Bets 1 Bets 2
I 1 25,33% 25,39% 2 25,15% 25,80% 3 25,95% 25,54%
X ± SD 25,48%±0,47 25,58%±0,22
II 1 24,36% 24,35% 2 24,56% 24,38% 3 24,45% 24,48%
X ± SD 24,46%±0,10 24,40%%±0,08
III 1 24,56% 24,85% 2 24,54% 24,83%
3 24,48% 24,79%
X ± SD 24,53%±0,05 24,82%±0,03
Basis 1 2 3
24,38% 24,72% 24,65%
24,54% 24,40% 24,45%
X ± SD 24,58%±0,14 24,46%±0,08
Keterangan I : Formula dengan konsentrasi xanthan gum 0,1% II : Formula dengan konsentrasi xanthan gum 0,3% III : Formula dengan konsentrasi xanthan gum 0,5% Blangko : Blangko tanpa xanthan gum
113
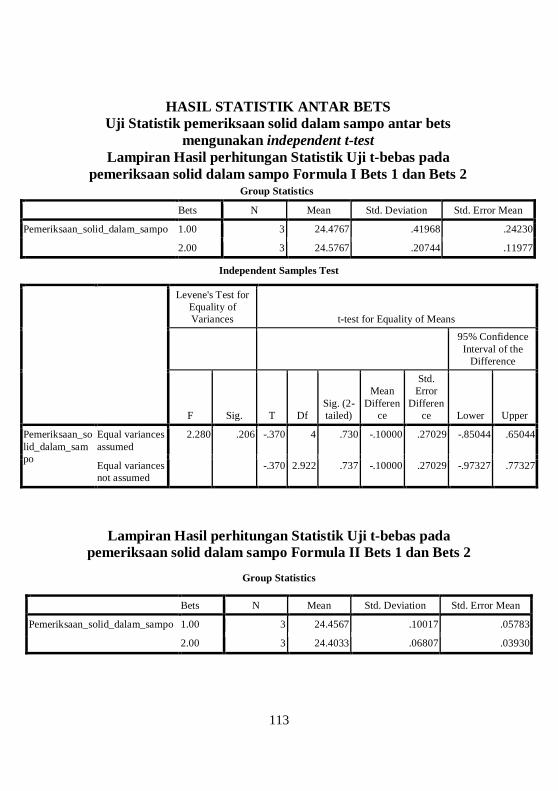
HASIL STATISTIK ANTAR BETS
Uji Statistik pemeriksaan solid dalam sampo antar bets mengunakan independent t-test
Lampiran Hasil perhitungan Statistik Uji t-bebas pada pemeriksaan solid dalam sampo Formula I Bets 1 dan Bets 2
Group Statistics
Bets N Mean Std. Deviation Std. Error Mean
Pemeriksaan_solid_dalam_sampo 1.00 3 24.4767 .41968 .24230
2.00 3 24.5767 .20744 .11977
Independent Samples Test
Levene's Test for Equality of Variances t-test for Equality of Means
95% Confidence Interval of the
Difference
F Sig. T Df Sig. (2-tailed)
Mean Differen
ce
Std. Error
Difference Lower Upper
Pemeriksaan_solid_dalam_sampo
Equal variances assumed
2.280 .206 -.370 4 .730 -.10000 .27029 -.85044 .65044
Equal variances not assumed -.370 2.922 .737 -.10000 .27029 -.97327 .77327
Lampiran Hasil perhitungan Statistik Uji t-bebas pada pemeriksaan solid dalam sampo Formula II Bets 1 dan Bets 2
Group Statistics
Bets N Mean Std. Deviation Std. Error Mean
Pemeriksaan_solid_dalam_sampo 1.00 3 24.4567 .10017 .05783
2.00 3 24.4033 .06807 .03930

114
Independent Samples Test
Levene's Test for Equality of
Variances t-test for Equality of Means
95% Confidence Interval of the
Difference
F Sig. T df
Sig. (2-tailed)
Mean Difference
Std. Error Difference Lower Upper
Pemeriksaan_solid_dalam_sampo
Equal variances assumed
.261 .636 .763 4 .488 .05333 .06992 -.14080 .24746
Equal variances not assumed
.763 3.522 .493 .05333 .06992 -.15163 .25830
Lampiran Hasil perhitungan Statistik Uji t-bebas pada
pemeriksaan solid dalam sampo Formula III Bets 1 dan Bets 2 Group Statistics
Bets N Mean Std. Deviation Std. Error Mean
Pemeriksaan_solid_dalam_sampo 1.00 3 24.5267 .04163 .02404
2.00 3 24.4500 .11269 .06506
Independent Samples Test
Levene's Test for Equality of Variances t-test for Equality of Means
95% Confidence Interval of the
Difference
F Sig. T df Sig. (2-tailed)
Mean Differen
ce
Std. Error
Difference Lower Upper
Pemeriksaan_solid_dalam_sampo
Equal variances assumed
5.400 .081 1.105 4 .331 .07667 .06936 -.11591 .26925
Equal variances not assumed
1.105 2.536 .363 .07667 .06936 -.16878 .32212
115
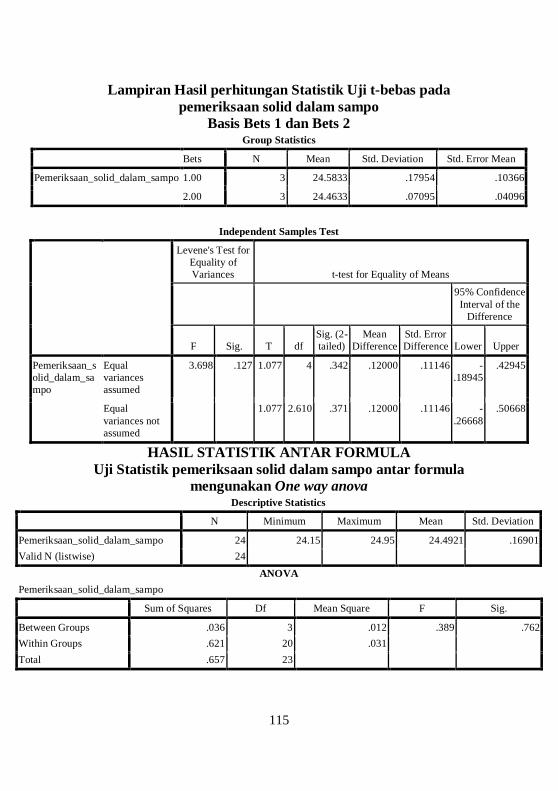
Lampiran Hasil perhitungan Statistik Uji t-bebas pada pemeriksaan solid dalam sampo
Basis Bets 1 dan Bets 2 Group Statistics
Bets N Mean Std. Deviation Std. Error Mean
Pemeriksaan_solid_dalam_sampo 1.00 3 24.5833 .17954 .10366
2.00 3 24.4633 .07095 .04096
HASIL STATISTIK ANTAR FORMULA Uji Statistik pemeriksaan solid dalam sampo antar formula
mengunakan One way anova Descriptive Statistics
N Minimum Maximum Mean Std. Deviation
Pemeriksaan_solid_dalam_sampo 24 24.15 24.95 24.4921 .16901 Valid N (listwise) 24
ANOVA Pemeriksaan_solid_dalam_sampo
Sum of Squares Df Mean Square F Sig.
Between Groups .036 3 .012 .389 .762 Within Groups .621 20 .031 Total .657 23
Independent Samples Test
Levene's Test for Equality of Variances t-test for Equality of Means
95% Confidence Interval of the
Difference
F Sig. T df
Sig. (2-tailed)
Mean Difference
Std. Error Difference Lower Upper
Pemeriksaan_solid_dalam_sampo
Equal variances assumed
3.698 .127 1.077 4 .342 .12000 .11146 -.18945
.42945
Equal variances not assumed
1.077 2.610 .371 .12000 .11146 -
.26668 .50668
116
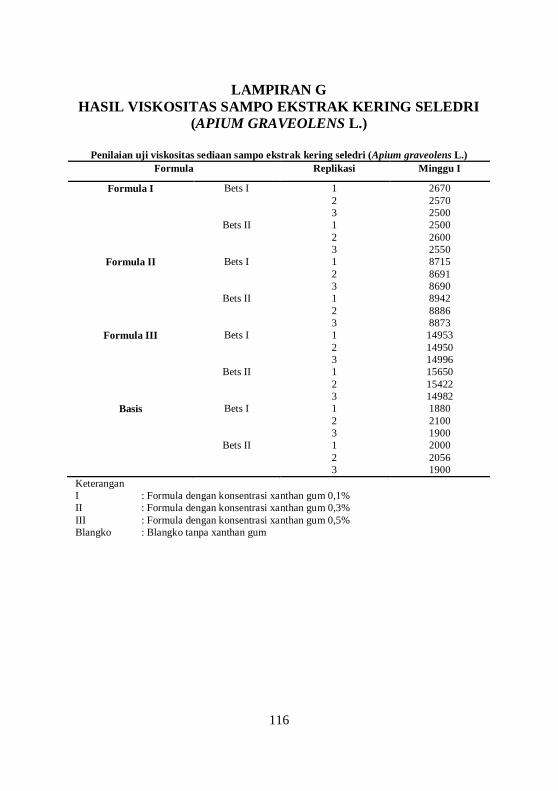
LAMPIRAN G HASIL VISKOSITAS SAMPO EKSTRAK KERING SELEDRI
(APIUM GRAVEOLENS L.)
Penilaian uji viskositas sediaan sampo ekstrak kering seledri (Apium graveolens L.) Formula Replikasi Minggu I
Formula I Bets I 1 2670 2 2570 3 2500 Bets II 1 2500 2 2600 3 2550
Formula II Bets I 1 8715 2 8691 3 8690 Bets II 1 8942 2 8886 3 8873
Formula III Bets I 1 14953 2 14950 3 14996 Bets II 1 15650 2 15422 3 14982
Basis Bets I 1 1880 2 2100 3 1900 Bets II 1 2000 2 2056 3 1900
Keterangan I : Formula dengan konsentrasi xanthan gum 0,1% II : Formula dengan konsentrasi xanthan gum 0,3% III : Formula dengan konsentrasi xanthan gum 0,5% Blangko : Blangko tanpa xanthan gum
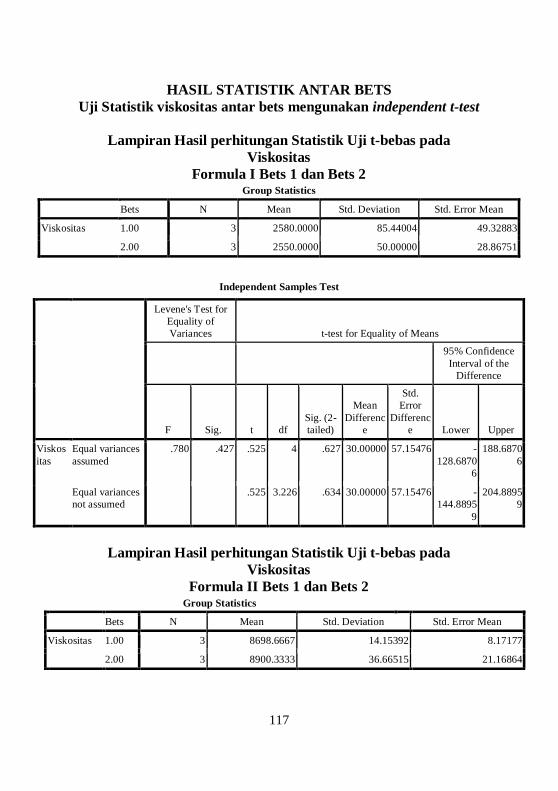
117
HASIL STATISTIK ANTAR BETS Uji Statistik viskositas antar bets mengunakan independent t-test
Lampiran Hasil perhitungan Statistik Uji t-bebas pada
Viskositas Formula I Bets 1 dan Bets 2
Group Statistics
Bets N Mean Std. Deviation Std. Error Mean
Viskositas 1.00 3 2580.0000 85.44004 49.32883
2.00 3 2550.0000 50.00000 28.86751
Independent Samples Test
Levene's Test for Equality of Variances t-test for Equality of Means
95% Confidence Interval of the
Difference
F Sig. t df Sig. (2-tailed)
Mean Differenc
e
Std. Error
Difference Lower Upper
Viskositas
Equal variances assumed
.780 .427 .525 4 .627 30.00000 57.15476 -128.6870
6
188.68706
Equal variances not assumed
.525 3.226 .634 30.00000 57.15476 -144.8895
9
204.88959
Lampiran Hasil perhitungan Statistik Uji t-bebas pada
Viskositas Formula II Bets 1 dan Bets 2
Group Statistics
Bets N Mean Std. Deviation Std. Error Mean
Viskositas 1.00 3 8698.6667 14.15392 8.17177
2.00 3 8900.3333 36.66515 21.16864

118
Independent Samples Test
Levene's Test for Equality of Variances t-test for Equality of Means
95% Confidence
Interval of the Difference
F Sig. t df
Sig. (2-tailed)
Mean Difference
Std. Error Difference Lower Upper
Viskositas
Equal variances assumed
4.086 .113 -0.887
4 .001 -201.66667 22.69116 -264.66
744
-138.665
90
Equal variances not assumed
-0.887
2.583 .005 -201.66667 22.69116 -280.94
222
-122.391
11
Lampiran Hasil perhitungan Statistik Uji t-bebas pada
Viskositas Formula III Bets 1 dan Bets 2
Group Statistics
Bets N Mean Std. Deviation Std. Error Mean
Viskositas 1.00 3 14966.3333 25.73584 14.85859
2.00 3 15351.3333 339.56050 196.04535
Independent Samples Test
Levene's Test for Equality of Variances t-test for Equality of Means
95% Confidence Interval of the
Difference
F Sig. t df Sig. (2-tailed)
Mean Differenc
e
Std. Error Differenc
e Lower Uppe
r
Viskositas
Equal variances assumed
6.295 .066 -1.958 4 .122 -385.0000
0
196.60762
-930.87026 160.87026
Equal variances not assumed
-1.958 2.023 .188 -385.0000
0
196.60762
-1221.79341 451.79341
119
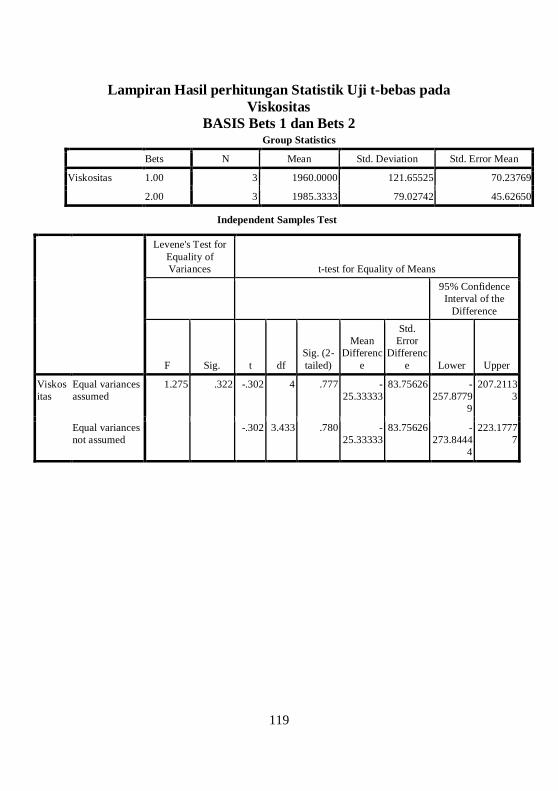
Lampiran Hasil perhitungan Statistik Uji t-bebas pada Viskositas
BASIS Bets 1 dan Bets 2 Group Statistics
Bets N Mean Std. Deviation Std. Error Mean
Viskositas 1.00 3 1960.0000 121.65525 70.23769
2.00 3 1985.3333 79.02742 45.62650
Independent Samples Test
Levene's Test for Equality of Variances t-test for Equality of Means
95% Confidence Interval of the
Difference
F Sig. t df Sig. (2-tailed)
Mean Differenc
e
Std. Error
Difference Lower Upper
Viskositas
Equal variances assumed
1.275 .322 -.302 4 .777 -25.33333
83.75626 -257.8779
9
207.21133
Equal variances not assumed
-.302 3.433 .780 -25.33333
83.75626 -273.8444
4
223.17777
120
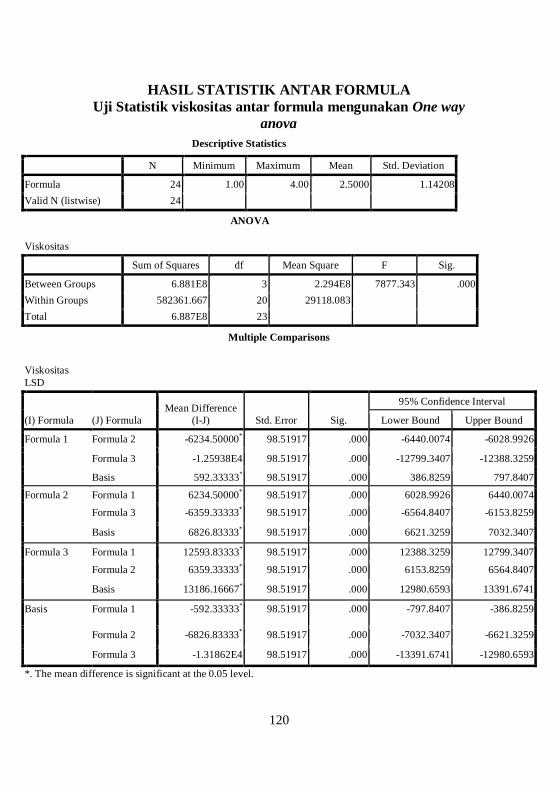
HASIL STATISTIK ANTAR FORMULA Uji Statistik viskositas antar formula mengunakan One way
anova Descriptive Statistics
N Minimum Maximum Mean Std. Deviation
Formula 24 1.00 4.00 2.5000 1.14208 Valid N (listwise) 24
ANOVA
Viskositas
Sum of Squares df Mean Square F Sig.
Between Groups 6.881E8 3 2.294E8 7877.343 .000 Within Groups 582361.667 20 29118.083 Total 6.887E8 23
Multiple Comparisons
Viskositas LSD
(I) Formula (J) Formula Mean Difference
(I-J) Std. Error Sig.
95% Confidence Interval
Lower Bound Upper Bound
Formula 1 Formula 2 -6234.50000* 98.51917 .000 -6440.0074 -6028.9926
Formula 3 -1.25938E4 98.51917 .000 -12799.3407 -12388.3259
Basis 592.33333* 98.51917 .000 386.8259 797.8407
Formula 2 Formula 1 6234.50000* 98.51917 .000 6028.9926 6440.0074
Formula 3 -6359.33333* 98.51917 .000 -6564.8407 -6153.8259
Basis 6826.83333* 98.51917 .000 6621.3259 7032.3407
Formula 3 Formula 1 12593.83333* 98.51917 .000 12388.3259 12799.3407
Formula 2 6359.33333* 98.51917 .000 6153.8259 6564.8407
Basis 13186.16667* 98.51917 .000 12980.6593 13391.6741
Basis Formula 1 -592.33333* 98.51917 .000 -797.8407 -386.8259
Formula 2 -6826.83333* 98.51917 .000 -7032.3407 -6621.3259
Formula 3 -1.31862E4 98.51917 .000 -13391.6741 -12980.6593
*. The mean difference is significant at the 0.05 level.
121
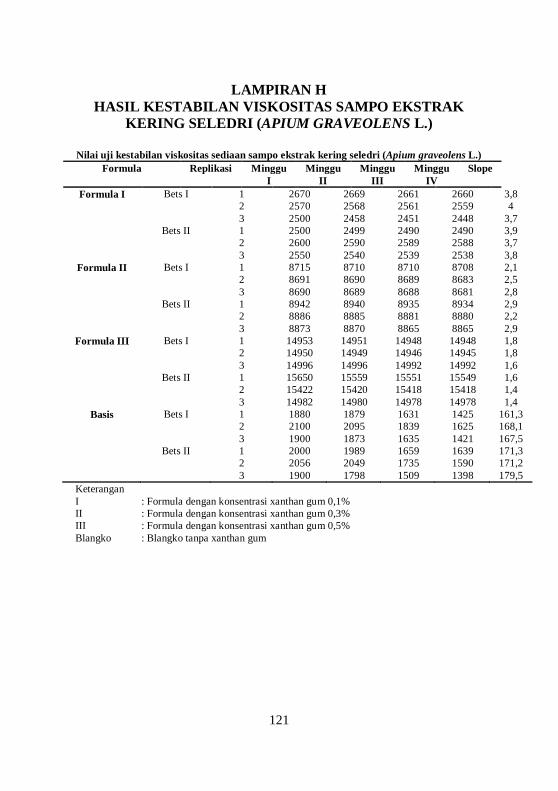
LAMPIRAN H HASIL KESTABILAN VISKOSITAS SAMPO EKSTRAK
KERING SELEDRI (APIUM GRAVEOLENS L.)
Nilai uji kestabilan viskositas sediaan sampo ekstrak kering seledri (Apium graveolens L.) Formula Replikasi Minggu
I Minggu
II Minggu
III Minggu
IV Slope
Formula I Bets I 1 2670 2669 2661 2660 3,8 2 2570 2568 2561 2559 4 3 2500 2458 2451 2448 3,7 Bets II 1 2500 2499 2490 2490 3,9 2 2600 2590 2589 2588 3,7 3 2550 2540 2539 2538 3,8
Formula II Bets I 1 8715 8710 8710 8708 2,1 2 8691 8690 8689 8683 2,5 3 8690 8689 8688 8681 2,8 Bets II 1 8942 8940 8935 8934 2,9 2 8886 8885 8881 8880 2,2 3 8873 8870 8865 8865 2,9
Formula III Bets I 1 14953 14951 14948 14948 1,8 2 14950 14949 14946 14945 1,8 3 14996 14996 14992 14992 1,6 Bets II 1 15650 15559 15551 15549 1,6 2 15422 15420 15418 15418 1,4 3 14982 14980 14978 14978 1,4
Basis Bets I 1 1880 1879 1631 1425 161,3 2 2100 2095 1839 1625 168,1 3 1900 1873 1635 1421 167,5 Bets II 1 2000 1989 1659 1639 171,3 2 2056 2049 1735 1590 171,2 3 1900 1798 1509 1398 179,5
Keterangan I : Formula dengan konsentrasi xanthan gum 0,1% II : Formula dengan konsentrasi xanthan gum 0,3% III : Formula dengan konsentrasi xanthan gum 0,5% Blangko : Blangko tanpa xanthan gum

122
HASIL STATISTIK ANTAR BETS Uji Statistik kestabilan viskositas antar bets mengunakan
independent t-test
Lampiran Hasil perhitungan Statistik Uji t-bebas pada Viskositas
Formula I Bets 1 dan Bets 2 Group Statistics
Bets N Mean Std. Deviation Std. Error Mean
Viskositas 1.00 3 3.8333 .15275 .08819
2.00 3 3.8000 .10000 .05774
Independent Samples Test
Levene's Test for Equality of Variances t-test for Equality of Means
95% Confidence Interval of the
Difference
F Sig. t df Sig. (2-tailed)
Mean Differenc
e
Std. Error
Difference Lower Upper
Viskositas
Equal variances assumed
.727 .442 .316 4 .768 .03333 .10541 -.25933 .32600
Equal variances not assumed .316 3.448 .770 .03333 .10541 -.27876 .34542
Lampiran Hasil perhitungan Statistik Uji t-bebas pada
Viskositas Formula II Bets 1 dan Bets 2
Group Statistics
Bets N Mean Std. Deviation Std. Error Mean
Viskositas 1.00 3 2.4667 .35119 .20276
2.00 3 2.6667 .40415 .23333

123
Independent Samples Test
Levene's Test for
Equality of Variances t-test for Equality of Means
95% Confidence Interval of the
Difference
F Sig. t Df Sig. (2-tailed)
Mean Differenc
e
Std. Error Differenc
e Lower Upper
Viskositas
Equal variances assumed .257 .639 -.647 4 .553 -.20000 .30912 -1.05826 .65826
Equal variances not assumed -.647 3.924 .554 -.20000 .30912 -1.06489 .66489
Lampiran Hasil perhitungan Statistik Uji t-bebas pada Viskositas
Formula III Bets 1 dan Bets 2 Group Statistics
Bets N Mean Std. Deviation Std. Error Mean
Viskositas 1.00 3 1.7333 .11547 .06667
2.00 3 1.4667 .11547 .06667
Independent Samples Test
Levene's Test for Equality of Variances t-test for Equality of Means
95% Confidence Interval of the
Difference
F Sig. t Df Sig. (2-tailed)
Mean Differenc
e
Std. Error Differenc
e Lower Upper
Viskositas
Equal variances assumed
.000 1.000 2.828 4 .047 .26667 .09428 .00490 .52843
Equal variances not assumed 2.828 4.000 .047 .26667 .09428 .00490 .52843

124
Lampiran Hasil perhitungan Statistik Uji t-bebas pada Viskositas
Basis Bets 1 dan Bets 2
Group Statistics
Bets N Mean Std. Deviation Std. Error Mean
Viskositas 1.00 3 165.6333 3.76475 2.17358
2.00 3 174.0000 4.76340 2.75015
Independent Samples Test
Levene's Test for Equality of Variances t-test for Equality of Means
95% Confidence Interval of the
Difference
F Sig. t Df Sig. (2-tailed)
Mean Differen
ce
Std. Error
Difference Lower Upper
Viskositas Equal variances assumed
.434 .546 -2.387
4 .075 -8.36667 3.50539 -18.0992
0
1.36586
Equal variances not assumed
-
2.387 3.797 .079 -8.36667 3.50539 -
18.30754
1.57420

125
HASIL STATISTIK ANTAR FORMULA Uji Statistik kestabilan viskositas antar formula mengunakan
One way anova Descriptive Statistics
N Minimum Maximum Mean Std. Deviation
Viskositas 24 1.40 179.50 44.4500 73.99437 Valid N (listwise) 24
ANOVA
Viskositas
Sum of Squares Df Mean Square F Sig.
Between Groups 125749.230 3 41916.410 4668.012 .000 Within Groups 179.590 20 8.979 Total 125928.820 23
Multiple Comparisons Viskositas LSD
(I) Formula (J) Formula Mean Difference (I-
J) Std. Error Sig.
95% Confidence Interval
Lower Bound Upper Bound
Formula 1 Formula 2 1.25000 1.73008 .478 -2.3589 4.8589
Formula 3 2.21667 1.73008 .215 -1.3922 5.8255
Basis -166.00000* 1.73008 .000 -169.6089 -162.3911
Formula 2 Formula 1 -1.25000 1.73008 .478 -4.8589 2.3589
Formula 3 .96667 1.73008 .583 -2.6422 4.5755
Basis -167.25000* 1.73008 .000 -170.8589 -163.6411
Formula 3 Formula 1 -2.21667 1.73008 .215 -5.8255 1.3922
Formula 2 -.96667 1.73008 .583 -4.5755 2.6422
Basis -168.21667* 1.73008 .000 -171.8255 -164.6078
Basis Formula 1 166.00000* 1.73008 .000 162.3911 169.6089
Formula 2 167.25000* 1.73008 .000 163.6411 170.8589
Formula 3 168.21667* 1.73008 .000 164.6078 171.8255 *. The mean difference is significant at the 0.05 level.
126
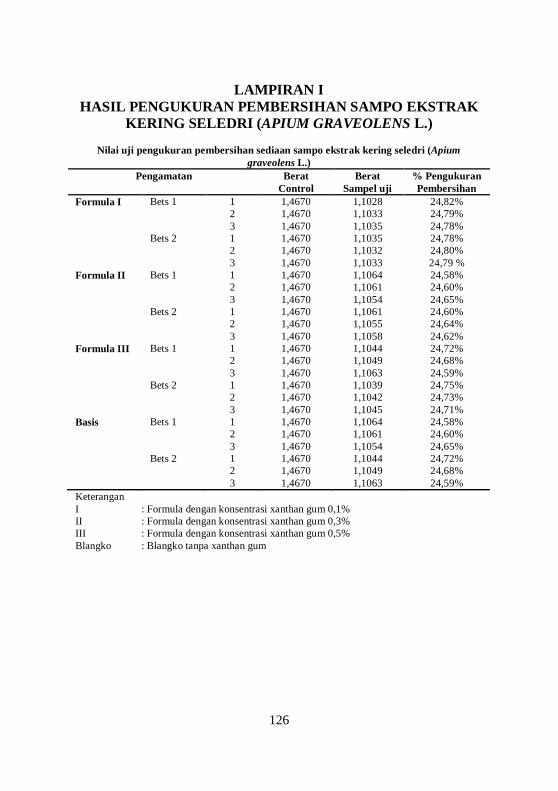
LAMPIRAN I HASIL PENGUKURAN PEMBERSIHAN SAMPO EKSTRAK
KERING SELEDRI (APIUM GRAVEOLENS L.)
Nilai uji pengukuran pembersihan sediaan sampo ekstrak kering seledri (Apium graveolens L.)
Pengamatan Berat Control
Berat Sampel uji
% Pengukuran Pembersihan
Formula I Bets 1 1 1,4670 1,1028 24,82% 2 1,4670 1,1033 24,79% 3 1,4670 1,1035 24,78% Bets 2 1 1,4670 1,1035 24,78% 2 1,4670 1,1032 24,80% 3 1,4670 1,1033 24,79 % Formula II Bets 1 1 1,4670 1,1064 24,58% 2 1,4670 1,1061 24,60% 3 1,4670 1,1054 24,65% Bets 2 1 1,4670 1,1061 24,60% 2 1,4670 1,1055 24,64% 3 1,4670 1,1058 24,62% Formula III Bets 1 1 1,4670 1,1044 24,72% 2 1,4670 1,1049 24,68% 3 1,4670 1,1063 24,59% Bets 2 1 1,4670 1,1039 24,75% 2 1,4670 1,1042 24,73% 3 1,4670 1,1045 24,71% Basis Bets 1 1 1,4670 1,1064 24,58% 2 1,4670 1,1061 24,60% 3 1,4670 1,1054 24,65% Bets 2 1 1,4670 1,1044 24,72% 2 1,4670 1,1049 24,68% 3 1,4670 1,1063 24,59% Keterangan I : Formula dengan konsentrasi xanthan gum 0,1% II : Formula dengan konsentrasi xanthan gum 0,3% III : Formula dengan konsentrasi xanthan gum 0,5% Blangko : Blangko tanpa xanthan gum

127
Contoh perhitungan Formula 1 bets 1 replikasi 1
Penilaian uji pengukuran pembersihan sediaan sampo ekstrak kering seledri (Apium
graveolens L.) Formula Replikasi Bets 1 Bets 2
I 1 24,82% 24,78% 2 24,79% 24,80% 3 24,78% 24,79 %
X ± SD 24,80%±0,02 24,79%±0,02
II 1 24,58% 24,60% 2 24,60% 24,64% 3 24,65% 24,62%
X ± SD 24,61%±0,04 24,62%±0,02
III 1 24,72% 24,75% 2 24,68% 24,73%
3 24,59% 24,71%
X ± SD 24,66%±0,07 24,73%±0,02
Basis 1 2 3
24,58% 24,60% 24,65%
24,72% 24,68% 24,59%
X ± SD 24,61%±0,04 24,66%±0,07 Keterangan I : Formula dengan konsentrasi xanthan gum 0,1% II : Formula dengan konsentrasi xanthan gum 0,3% III : Formula dengan konsentrasi xanthan gum 0,5% Blangko : Blangko tanpa xanthan gum

128
HASIL STATISTIK ANTAR BETS Uji Statistik pengukuran pembersihan antar bets mengunakan
independent t-test
Lampiran Hasil perhitungan Statistik Uji t-bebas pada pengukuran pembersihan dalam sampo
Formula I Bets 1 dan Bets 2 Group Statistics
Bets N Mean Std. Deviation Std. Error Mean
Pengukuran_pembersihan 1.00 3 24.7967 .02082 .01202
2.00 3 24.7900 .01000 .00577
Independent Samples Test
Levene's Test for Equality of Variances t-test for Equality of Means
95% Confidence Interval of the
Difference
F Sig. T df Sig. (2-tailed)
Mean Differen
ce
Std. Error
Difference Lower Upper
Pengukuran_pembersihan
Equal variances assumed
2.286 .205 .500 4 .643 .00667 .01333 -.03035 .04369
Equal variances not assumed
.500 2.876 .653 .00667 .01333 -.03682 .05015
Lampiran Hasil perhitungan Statistik Uji t-bebas pada pengukuran pembersihan dalam sampo
FormulaII Bets 1 dan Bets 2 Group Statistics
Bets N Mean Std. Deviation Std. Error Mean
Pengukuran_pembersihan 1.00 3 24.6100 .03606 .02082
2.00 3 24.6200 .02000 .01155
Independent Samples Test

129
Levene's Test for Equality of Variances t-test for Equality of Means
95% Confidence Interval of the
Difference
F Sig. T df Sig. (2-tailed)
Mean Difference
Std. Error
Difference Lower Upper
Pengukuran_pembersihan
Equal variances assumed
1.455 .294 -.420 4 .696 -.01000 .02380 -.07609 .05609
Equal variances not assumed -.420 3.124 .702 -.01000 .02380 -.08408 .06408
Lampiran Hasil perhitungan Statistik Uji t-bebas pada
pengukuran pembersihan dalam sampo Formula III Bets 1 dan Bets 2
Group Statistics
Bets N Mean Std. Deviation Std. Error Mean
Pengukuran_pembersihan 1.00 3 24.6633 .06658 .03844
2.00 3 24.7300 .02000 .01155 Independent Samples Test
Levene's Test for Equality of Variances t-test for Equality of Means
95% Confidence Interval of the
Difference
F Sig. T Df
Sig. (2-tailed)
Mean Difference
Std. Error Difference Lower Upper
Pengukuran_pembersihan
Equal variances assumed
3.864 .121 -1.661
4 .172 -.06667 .04014 -.17811 .04478
Equal variances not assumed
-
1.661 2.35
8 .219 -.06667 .04014 -.21652 .08319
Lampiran Hasil perhitungan Statistik Uji t-bebas pada
pengukuran pembersihan dalam sampo

130
Basis Bets 1 dan Bets 2 Group Statistics
Bets N Mean Std. Deviation Std. Error Mean
Pengukuran_pembersihan 1.00 3 24.6100 .03606 .02082
2.00 3 24.6633 .06658 .03844 Independent Samples Test
Levene's Test for Equality of Variances t-test for Equality of Means
95% Confidence
Interval of the Difference
F Sig. T df
Sig. (2-tailed)
Mean Difference
Std. Error Difference Lower Upper
Pengukuran_pembersihan
Equal variances assumed
1.370 .307 -1.220
4 .289 -.05333 .04372 -.17471
.06804
Equal variances not assumed
-
1.220 3.08
0 .308 -.05333 .04372 -
.19043 .08377
HASIL STATISTIK ANTAR FORMULA Uji Statistik pengukuran pembersihan antar formula
mengunakan One way anova Descriptive Statistics
N Minimum Maximum Mean Std. Deviation
Pengukuran_pembersihan 24 24.58 24.82 24.6854 .08113 Valid N (listwise) 24
ANOVA Pengukuran_pembersihan
Sum of Squares Df Mean Square F Sig.
Between Groups .115 3 .038 2.797 .000 Within Groups .037 20 .002 Total .151 23
131
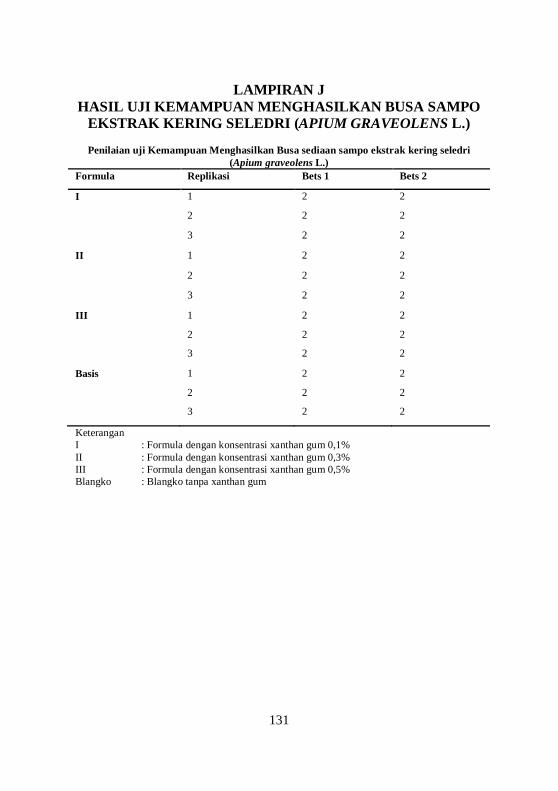
LAMPIRAN J HASIL UJI KEMAMPUAN MENGHASILKAN BUSA SAMPO
EKSTRAK KERING SELEDRI (APIUM GRAVEOLENS L.)
Penilaian uji Kemampuan Menghasilkan Busa sediaan sampo ekstrak kering seledri (Apium graveolens L.)
Formula Replikasi Bets 1 Bets 2
I 1 2 2
2 2 2
3 2 2
II 1 2 2
2 2 2
3 2 2
III 1 2 2
2 2 2
3 2 2
Basis 1 2 2
2 2 2
3 2 2
Keterangan I : Formula dengan konsentrasi xanthan gum 0,1% II : Formula dengan konsentrasi xanthan gum 0,3% III : Formula dengan konsentrasi xanthan gum 0,5% Blangko : Blangko tanpa xanthan gum
132
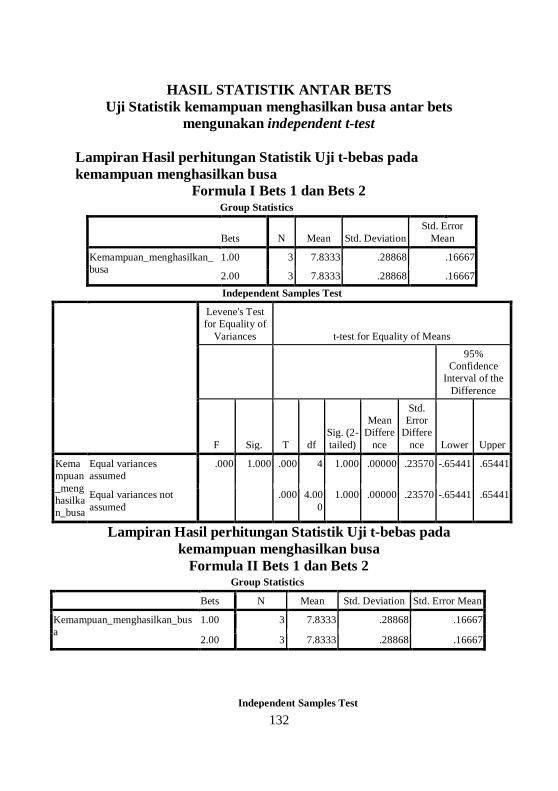
HASIL STATISTIK ANTAR BETS Uji Statistik kemampuan menghasilkan busa antar bets
mengunakan independent t-test
Lampiran Hasil perhitungan Statistik Uji t-bebas pada kemampuan menghasilkan busa
Formula I Bets 1 dan Bets 2 Group Statistics
Bets N Mean Std. Deviation
Std. Error Mean
Kemampuan_menghasilkan_busa
1.00 3 7.8333 .28868 .16667
2.00 3 7.8333 .28868 .16667 Independent Samples Test
Levene's Test for Equality of
Variances t-test for Equality of Means
95% Confidence
Interval of the Difference
F Sig. T df Sig. (2-tailed)
Mean Differe
nce
Std. Error
Difference Lower Upper
Kemampuan_menghasilkan_busa
Equal variances assumed
.000 1.000 .000 4 1.000 .00000 .23570 -.65441 .65441
Equal variances not assumed
.000 4.000
1.000 .00000 .23570 -.65441 .65441
Lampiran Hasil perhitungan Statistik Uji t-bebas pada kemampuan menghasilkan busa
Formula II Bets 1 dan Bets 2 Group Statistics
Bets N Mean Std. Deviation Std. Error Mean
Kemampuan_menghasilkan_busa
1.00 3 7.8333 .28868 .16667
2.00 3 7.8333 .28868 .16667
Independent Samples Test

133
Levene's Test for Equality of Variances t-test for Equality of Means
95% Confidence Interval of the
Difference
F Sig. t Df Sig. (2-tailed)
Mean Difference
Std. Error
Difference Lower Upper
Kemampuan_menghasilkan_busa
Equal variances assumed
.000 1.000 .000 4 1.000 .00000 .23570 -.65441 .65441
Equal variances not assumed
.000 4.000 1.000 .00000 .23570 -.65441 .65441
Lampiran Hasil perhitungan Statistik Uji t-bebas pada kemampuan menghasilkan busa
Formula III Bets 1 dan Bets 2 Group Statistics
Bets N Mean Std. Deviation Std. Error Mean
Kemampuan_menghasilkan_busa
1.00 3 7.8333 .28868 .16667
2.00 3 8.0000 .00000 .00000 Independent Samples Test
Levene's Test for Equality of Variances t-test for Equality of Means
95% Confidence Interval of the
Difference
F Sig. t df Sig. (2-tailed)
Mean Difference
Std. Error
Difference Lower Upper
Kemampuan_menghasilkan_busa
Equal variances assumed
16.000 .016 -1.000
4 .374 -.16667 .16667 -.62941 .29607
Equal variances not assumed
-1.000
2.000
.423 -.16667 .16667 -.88378 .55044
134
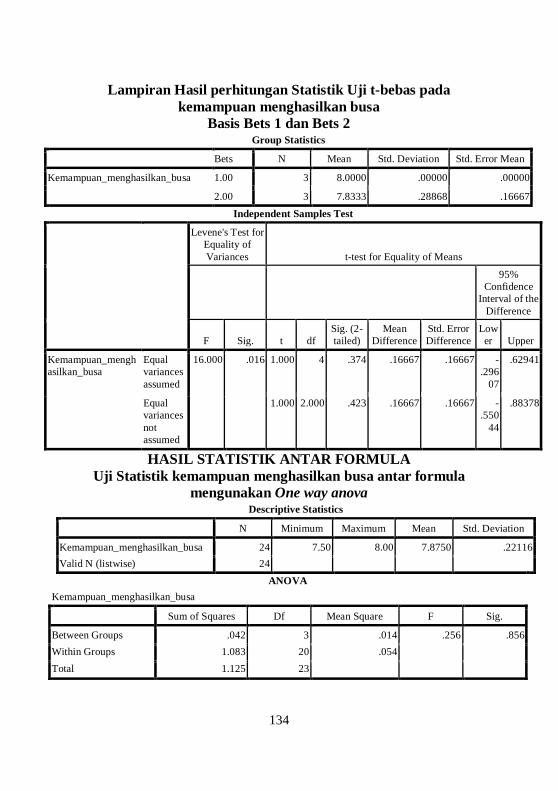
Lampiran Hasil perhitungan Statistik Uji t-bebas pada kemampuan menghasilkan busa
Basis Bets 1 dan Bets 2 Group Statistics
Bets N Mean Std. Deviation Std. Error Mean
Kemampuan_menghasilkan_busa 1.00 3 8.0000 .00000 .00000
2.00 3 7.8333 .28868 .16667 Independent Samples Test
Levene's Test for Equality of Variances t-test for Equality of Means
95% Confidence
Interval of the Difference
F Sig. t df
Sig. (2-tailed)
Mean Difference
Std. Error Difference
Lower Upper
Kemampuan_menghasilkan_busa
Equal variances assumed
16.000 .016 1.000 4 .374 .16667 .16667 -.296
07
.62941
Equal variances not assumed
1.000 2.000 .423 .16667 .16667 -.550
44
.88378
HASIL STATISTIK ANTAR FORMULA Uji Statistik kemampuan menghasilkan busa antar formula
mengunakan One way anova Descriptive Statistics
N Minimum Maximum Mean Std. Deviation
Kemampuan_menghasilkan_busa 24 7.50 8.00 7.8750 .22116 Valid N (listwise) 24
ANOVA Kemampuan_menghasilkan_busa
Sum of Squares Df Mean Square F Sig.
Between Groups .042 3 .014 .256 .856 Within Groups 1.083 20 .054 Total 1.125 23

135
LAMPIRAN K HASIL UJI STABILITAS MENGHASILKAN BUSA SAMPO EKSTRAK KERING SELEDRI (APIUM GRAVEOLENS L.)
Penilaian uji Stabilitas Busa sediaan sampo ekstrak kering seledri (Apium graveolens L.) Formula Replikasi Bets 1 Bets 2
I 1 8 cm 8 cm 2 7,5 cm 8 cm 3 8 cm 7,5 cm
X ± SD 7,83 ±0,33 cm 7,83 ±0,33 cm
II 1 7,5 cm 8 cm 2 8 cm 7,5 cm 3 8 cm 8 cm
X ± SD 7,83 ±0,33 cm 7,83 ±0,33 cm
III 1 8 cm 8 cm 2 7,5 cm 8 cm
3 8 cm 8 cm
X ± SD 7,83 ±0,33 cm 8 cm
Basis 1 2 3
8 cm 8 cm 8 cm
7,5 cm 8 cm 8 cm
X ± SD 8 cm 7,83 ±0,33 cm
Keterangan I : Formula dengan konsentrasi xanthan gum 0,1% II : Formula dengan konsentrasi xanthan gum 0,3% III : Formula dengan konsentrasi xanthan gum 0,5% Blangko : Blangko tanpa xanthan gum

136
HASIL STATISTIK ANTAR BETS Uji Statistik stabilitas busa antar bets mengunakan wilcoxon
Lampiran Hasil perhitungan Statistik wilcoxon pada Stabilitas
Busa Formula I Bets 1 dan Bets 2
Descriptive Statistics
N Mean Std. Deviation Minimum Maximum
Bets_1 3 2.0000 .00000 2.00 2.00 Bets_2 3 2.0000 .00000 2.00 2.00
Test Statisticsb
Bets_2 - Bets_1
Z .000a Asymp. Sig. (2-tailed) 1.000
a. The sum of negative ranks equals the sum of positive ranks. b. Wilcoxon Signed Ranks Test
Lampiran Hasil perhitungan Statistik wilcoxon pada Stabilitas Busa
Formula II Bets 1 dan Bets 2
Descriptive Statistics
N Mean Std. Deviation Minimum Maximum
Bets_1 3 2.0000 .00000 2.00 2.00 Bets_2 3 2.0000 .00000 2.00 2.00
Test Statisticsb
Bets_2 - Bets_1
Z .000a Asymp. Sig. (2-tailed) 1.000 a. The sum of negative ranks equals the sum of positive ranks. b. Wilcoxon Signed Ranks Test

137
Lampiran Hasil perhitungan Statistik wilcoxon pada Stabilitas Busa
Formula III Bets 1 dan Bets 2
Descriptive Statistics
N Mean Std. Deviation Minimum Maximum
Bets_1 3 2.0000 .00000 2.00 2.00 Bets_2 3 2.0000 .00000 2.00 2.00
Test Statisticsb
Bets_2 - Bets_1
Z .000a Asymp. Sig. (2-tailed) 1.000
a. The sum of negative ranks equals the sum of positive ranks.
b. Wilcoxon Signed Ranks Test
Lampiran Hasil perhitungan Statistik wilcoxon pada Stabilitas busa
Basis Bets 1 dan Bets 2 Descriptive Statistics
N Mean Std. Deviation Minimum Maximum
Bets_1 3 2.0000 .00000 2.00 2.00 Bets_2 3 2.0000 .00000 2.00 2.00
Test Statisticsb
Bets_2 - Bets_1
Z .000a
Asymp. Sig. (2-tailed) 1.000
a. The sum of negative ranks equals the sum of positive ranks.

138
HASIL STATISTIK ANTAR FORMULA Perhitungan Nilai Chi-square dengan metode Friedman test
secara manual
Lampiran Hasil perhitungan Statistik Friedman test pada Stabilitas busa antar formula
Hasil penetapan peringkat dan analisis statistik uji stabilitas busa Bets Rep Formula 0 Formula 1 Formula 2 Formula 3
Skor Peringkat Skor Peringkat Skor Peringkat Skor Peringkat
1 1 2 2,5 2 2,5 2 2,5 2 2,5 2 2 2,5 2 2,5 2 2,5 2 2,5 3 2 2,5 2 2,5 2 2,5 2 2,5
2 1 2 2,5 2 2,5 2 2,5 2 2,5 2 2 2,5 2 2,5 2 2,5 2 2,5 3 2 2,5 2 2,5 2 2,5 2 2,5
Jumlah pengamatan
6 6 6 6
Jumlah peringkat
15 15 15 15
Keterangan I : Formula dengan konsentrasi xanthan gum 0,1% II : Formula dengan konsentrasi xanthan gum 0,3% III : Formula dengan konsentrasi xanthan gum 0,5% Blangko : Blangko tanpa xanthan gum
= 0
Chi-squarehit(0)< Chi-squaretabel(11,070), sehingga tidak ada perbedaan bermakna pada kemapuan menghasilkan busa antar formula

139
LAMPIRAN L HASIL UJI TEGANGAN PERMUKAAN SAMPO EKSTRAK
KERING SELEDRI (APIUM GRAVEOLENS L.)
Diketahui: Percepatan gravitasi = 9,8 m/s = 980 cm/s Massa kawat = 1,2 gram Panjang benang = 8 cm Panjang kawat = 6 cm
Nilai uji tegangan permukaan sediaan sampo ekstrak kering seledri (Apium graveolens L.)
Pengamatan Panjang bagian benang
yang sempit
Jari-jari Tegangan permukaan (dyne/cm)
Formula I Bets I 1 3,5 7,025 33.5 2 3,2 6.414 36.68 3 3,3 6.601 35.63 Bets II 1 3,3 6.601 35.63 2 3,4 6.804 34.57 3 3,4 6.804 34.57
Formula II Bets I 1 3 6.083 38.77 2 3,2 6.414 36.68 3 3,4 6.804 34.57 Bets II 1 3,2 6.414 36.68 2 3,3 6.601 35.63 3 3,3 6.601 35.63
Formula III Bets I 1 3,3 6.601 35.63 2 3,2 6.414 36.68 3 3,4 6.804 34.57 Bets II 1 3,2 6.414 36.68 2 3,4 6.804 34.57 3 3,5 7,025 33.5
Basis Bets I 1 3,2 6.414 36.68 2 3,4 6.804 34.57 3 3,5 7,025 33.5 Bets II 1 3,3 6.601 35.63 2 3,4 6.804 34.57 3 3,4 6.804 34.57
Keterangan I : Formula dengan konsentrasi xanthan gum 0,1% II : Formula dengan konsentrasi xanthan gum 0,3% III : Formula dengan konsentrasi xanthan gum 0,5% Blangko : Blangko tanpa xanthan gum Contoh perhitungan
Menghitung jari-jari Formula 1 Bets 1 Replikasi 1
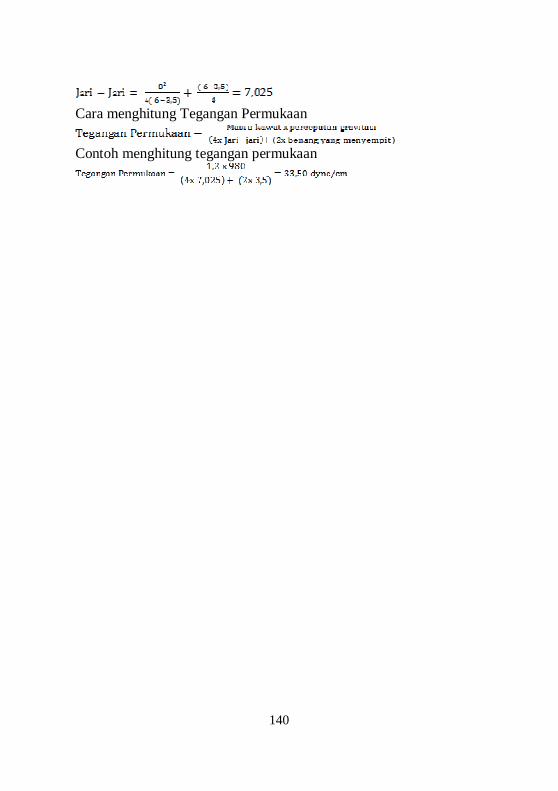
140
Cara menghitung Tegangan Permukaan
Contoh menghitung tegangan permukaan

141
HASIL STATISTIK ANTAR BETS Uji Statistik tegangan permukaan antar bets mengunakan
independent t-test Lampiran Hasil perhitungan Statistik Uji t-bebas pada tegangan
permukaan Formula I Bets 1 dan Bets 2
Independent Samples Test
Levene's Test for Equality of
Variances t-test for Equality of Means
95% Confidence Interval of the
Difference
F Sig. T df Sig. (2-tailed)
Mean Differe
nce
Std. Error
Difference Lower Upper
Tegangan_permukaan
Equal variances assumed
2.607 .182 .347 4 .746 .34667 .99997 -2.42970
3.12303
Equal variances not assumed
.347 2.55
9 .755 .34667 .99997 -
3.16935 3.86268
Lampiran Hasil perhitungan Statistik Uji t-bebas pada tegangan
permukaan Formula II Bets 1 dan Bets 2
Group Statistics
Bets N Mean Std. Deviation Std. Error Mean
Tegangan_permukaan 1.00 3 36.6733 2.10001 1.21244
2.00 3 35.9800 .60622 .35000
Group Statistics
Bets N Mean Std. Deviation Std. Error Mean
Tegangan_permukaan 1.00 3 35.2700 1.62028 .93547
2.00 3 34.9233 .61199 .35333

142
Independent Samples Test
Levene's Test for Equality of
Variances t-test for Equality of Means
95% Confidence Interval of the
Difference
F Sig. t Df Sig. (2-tailed)
Mean Differe
nce
Std. Error Differenc
e Lower Upper
Tegangan_permukaan
Equal variances assumed
1.749 .257 .549 4 .612 .69333 1.26195 -2.8103
9
4.19706
Equal variances not assumed
.549 2.33
1 .631 .69333 1.26195 -
4.06046
5.44713
Lampiran Hasil perhitungan Statistik Uji t-bebas pada tegangan permukaan
Formula III Bets 1 dan Bets 2 Group Statistics
Bets N Mean Std. Deviation Std. Error Mean
Tegangan_permukaan 1.00 3 35.6267 1.05500 .60911
2.00 3 34.9167 1.61810 .93421 Independent Samples Test
Levene's Test for Equality of Variances t-test for Equality of Means
95% Confidence Interval of the
Difference
F Sig. T df Sig. (2-tailed)
Mean Differen
ce
Std. Error
Difference Lower Upper
Tegangan_permukaan
Equal variances assumed
.728 .441 .637 4 .559 .71000 1.11524 -2.38640
3.80640
Equal variances not assumed
.637 3.440 .564 .71000 1.11524 -
2.59561 4.01561
143
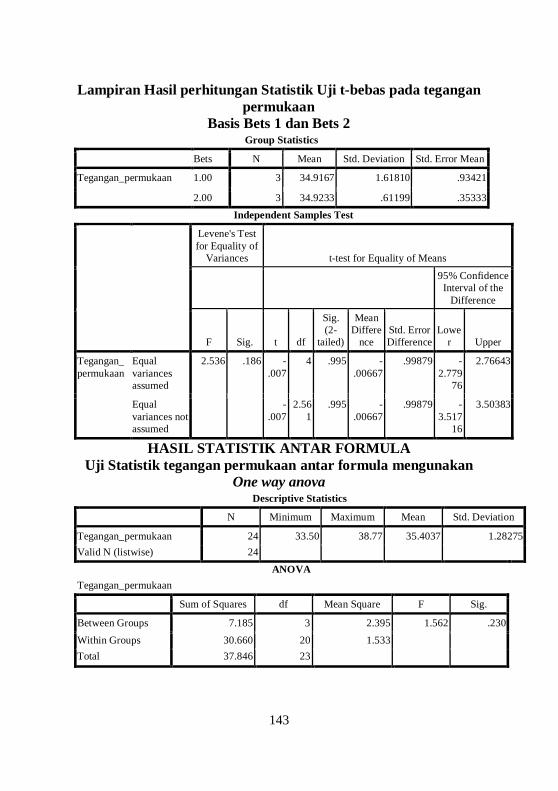
Lampiran Hasil perhitungan Statistik Uji t-bebas pada tegangan permukaan
Basis Bets 1 dan Bets 2 Group Statistics
Bets N Mean Std. Deviation Std. Error Mean
Tegangan_permukaan 1.00 3 34.9167 1.61810 .93421
2.00 3 34.9233 .61199 .35333 Independent Samples Test
Levene's Test for Equality of
Variances t-test for Equality of Means
95% Confidence Interval of the
Difference
F Sig. t df
Sig. (2-
tailed)
Mean Differe
nce Std. Error Difference
Lower Upper
Tegangan_permukaan
Equal variances assumed
2.536 .186 -.007
4 .995 -.00667
.99879 -2.779
76
2.76643
Equal variances not assumed
-
.007 2.56
1 .995 -
.00667 .99879 -
3.51716
3.50383
HASIL STATISTIK ANTAR FORMULA Uji Statistik tegangan permukaan antar formula mengunakan
One way anova Descriptive Statistics
N Minimum Maximum Mean Std. Deviation
Tegangan_permukaan 24 33.50 38.77 35.4037 1.28275 Valid N (listwise) 24
ANOVA Tegangan_permukaan
Sum of Squares df Mean Square F Sig.
Between Groups 7.185 3 2.395 1.562 .230 Within Groups 30.660 20 1.533 Total 37.846 23
144
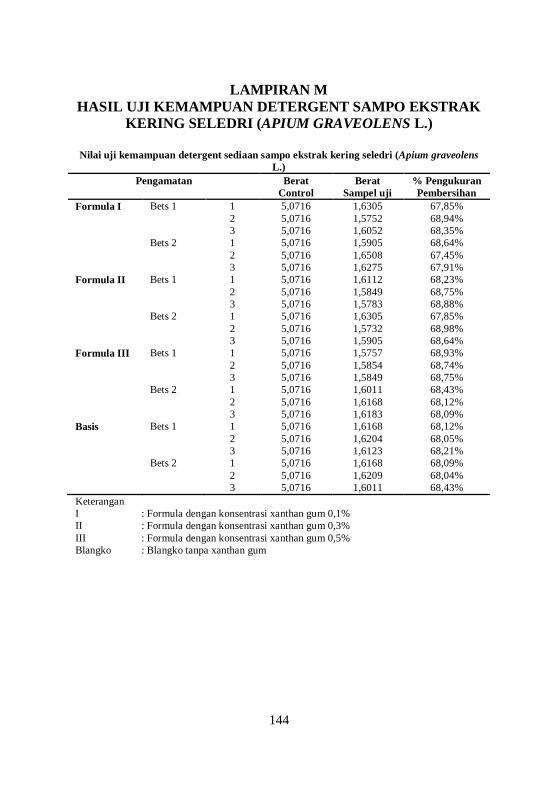
LAMPIRAN M HASIL UJI KEMAMPUAN DETERGENT SAMPO EKSTRAK
KERING SELEDRI (APIUM GRAVEOLENS L.)
Nilai uji kemampuan detergent sediaan sampo ekstrak kering seledri (Apium graveolens L.)
Pengamatan Berat Control
Berat Sampel uji
% Pengukuran Pembersihan
Formula I Bets 1 1 5,0716 1,6305 67,85% 2 5,0716 1,5752 68,94% 3 5,0716 1,6052 68,35% Bets 2 1 5,0716 1,5905 68,64% 2 5,0716 1,6508 67,45% 3 5,0716 1,6275 67,91% Formula II Bets 1 1 5,0716 1,6112 68,23% 2 5,0716 1,5849 68,75% 3 5,0716 1,5783 68,88% Bets 2 1 5,0716 1,6305 67,85% 2 5,0716 1,5732 68,98% 3 5,0716 1,5905 68,64% Formula III Bets 1 1 5,0716 1,5757 68,93% 2 5,0716 1,5854 68,74% 3 5,0716 1,5849 68,75% Bets 2 1 5,0716 1,6011 68,43% 2 5,0716 1,6168 68,12% 3 5,0716 1,6183 68,09% Basis Bets 1 1 5,0716 1,6168 68,12% 2 5,0716 1,6204 68,05% 3 5,0716 1,6123 68,21% Bets 2 1 5,0716 1,6168 68,09% 2 5,0716 1,6209 68,04% 3 5,0716 1,6011 68,43% Keterangan I : Formula dengan konsentrasi xanthan gum 0,1% II : Formula dengan konsentrasi xanthan gum 0,3% III : Formula dengan konsentrasi xanthan gum 0,5% Blangko : Blangko tanpa xanthan gum

145
Contoh perhitungan Formula 1 Bets 1 Replikasi 1
Nilai uji Kemampuan detergen sediaan sampo ekstrak kering seledri (Apium graveolens
L.) Formula Replikasi Bets 1 Bets 2
I 1 67,85% 68,64% 2 68,94% 67,45% 3 68,35% 67,91%
X ± SD 68,38%±0,56 68,00%±0,64
II 1 68,23% 67,85% 2 68,75% 68,98% 3 68,88% 68,64%
X ± SD 68,62%±0,39 68,49%±0,64
III 1 68,93% 68,43% 2 68,74% 68,12%
3 68,75% 68,09%
X ± SD 68,81%±0,12 68,21%±0,22
Basis 1 2 3
68,12% 68,05% 68,21%
68,09% 68,04% 68,43%
X ± SD 68,13%±0,08 68,19%±0,24
Keterangan I : Formula dengan konsentrasi xanthan gum 0,1% II : Formula dengan konsentrasi xanthan gum 0,3% III : Formula dengan konsentrasi xanthan gum 0,5% Blangko : Blangko tanpa xanthan gum
146
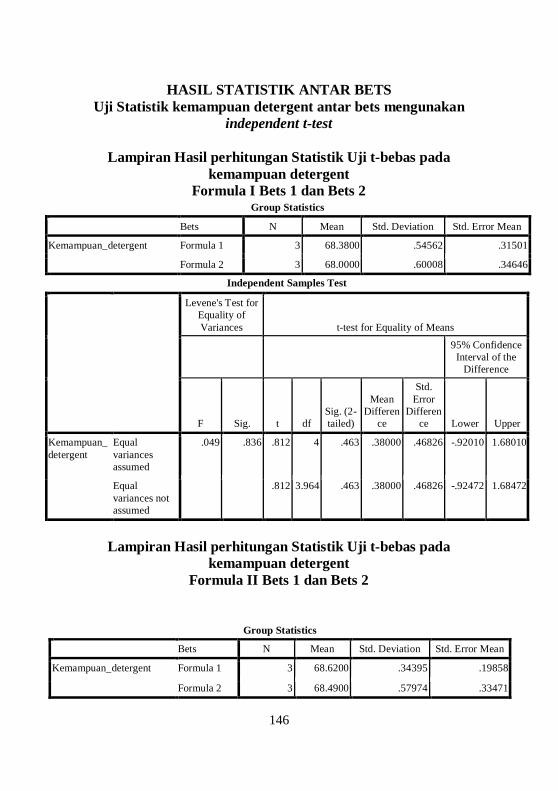
HASIL STATISTIK ANTAR BETS Uji Statistik kemampuan detergent antar bets mengunakan
independent t-test
Lampiran Hasil perhitungan Statistik Uji t-bebas pada kemampuan detergent
Formula I Bets 1 dan Bets 2 Group Statistics
Bets N Mean Std. Deviation Std. Error Mean
Kemampuan_detergent Formula 1 3 68.3800 .54562 .31501
Formula 2 3 68.0000 .60008 .34646
Independent Samples Test
Levene's Test for Equality of Variances t-test for Equality of Means
95% Confidence Interval of the
Difference
F Sig. t df Sig. (2-tailed)
Mean Differen
ce
Std. Error
Difference Lower Upper
Kemampuan_detergent
Equal variances assumed
.049 .836 .812 4 .463 .38000 .46826 -.92010 1.68010
Equal variances not assumed
.812 3.964 .463 .38000 .46826 -.92472 1.68472
Lampiran Hasil perhitungan Statistik Uji t-bebas pada
kemampuan detergent Formula II Bets 1 dan Bets 2
Group Statistics
Bets N Mean Std. Deviation Std. Error Mean
Kemampuan_detergent Formula 1 3 68.6200 .34395 .19858
Formula 2 3 68.4900 .57974 .33471

147
Independent Samples Test
Levene's Test for Equality of Variances t-test for Equality of Means
95% Confidence Interval of the
Difference
F Sig. T df Sig. (2-tailed)
Mean Differe
nce
Std. Error
Difference Lower Upper
Kemampuan_detergent
Equal variances assumed
1.043 .365 .334 4 .755 .13000 .38919 -.95056 1.21056
Equal variances not assumed
.334 3.25
3 .759 .13000 .38919 -
1.05587 1.31587
Lampiran Hasil perhitungan Statistik Uji t-bebas pada kemampuan detergent
Formula III Bets 1 dan Bets 2 Group Statistics
Bets N Mean Std. Deviation Std. Error Mean
Kemampuan_detergent Formula 1 3 68.8067 .10693 .06173
Formula 2 3 68.2133 .18824 .10868 Independent Samples Test
Levene's Test for Equality of Variances t-test for Equality of Means
95% Confidence Interval of the
Difference
F Sig. T df Sig. (2-tailed)
Mean Differe
nce
Std. Error
Difference Lower Upper
Kemampuan_detergent
Equal variances assumed
2.139 .217 4.747
4 .009 .59333 .12499 .24631 .94036
Equal variances not assumed
4.74
7 3.16
9 .016 .59333 .12499 .20730 .97937
148
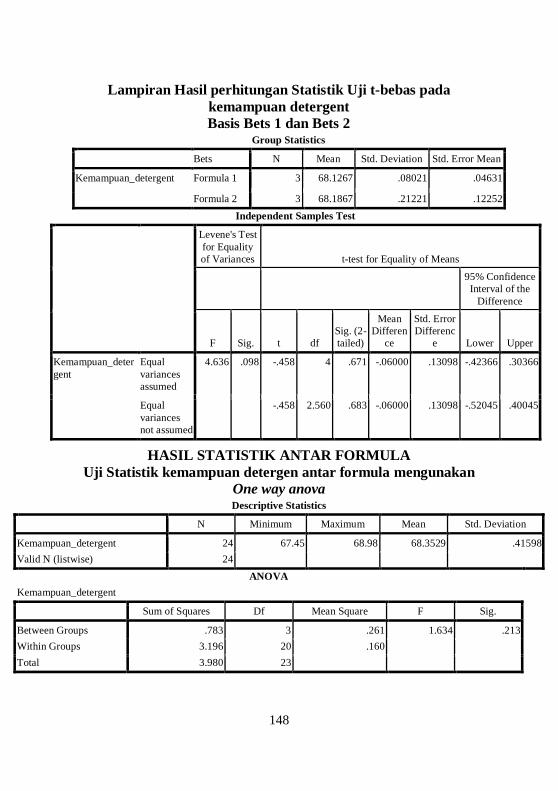
Lampiran Hasil perhitungan Statistik Uji t-bebas pada kemampuan detergent Basis Bets 1 dan Bets 2
Group Statistics
Bets N Mean Std. Deviation Std. Error Mean
Kemampuan_detergent Formula 1 3 68.1267 .08021 .04631
Formula 2 3 68.1867 .21221 .12252 Independent Samples Test
Levene's Test for Equality of Variances t-test for Equality of Means
95% Confidence Interval of the
Difference
F Sig. t df Sig. (2-tailed)
Mean Differen
ce
Std. Error Differenc
e Lower Upper
Kemampuan_detergent
Equal variances assumed
4.636 .098 -.458 4 .671 -.06000 .13098 -.42366 .30366
Equal variances not assumed
-.458 2.560 .683 -.06000 .13098 -.52045 .40045
HASIL STATISTIK ANTAR FORMULA Uji Statistik kemampuan detergen antar formula mengunakan
One way anova Descriptive Statistics
N Minimum Maximum Mean Std. Deviation
Kemampuan_detergent 24 67.45 68.98 68.3529 .41598 Valid N (listwise) 24
ANOVA Kemampuan_detergent
Sum of Squares Df Mean Square F Sig.
Between Groups .783 3 .261 1.634 .213 Within Groups 3.196 20 .160 Total 3.980 23
149
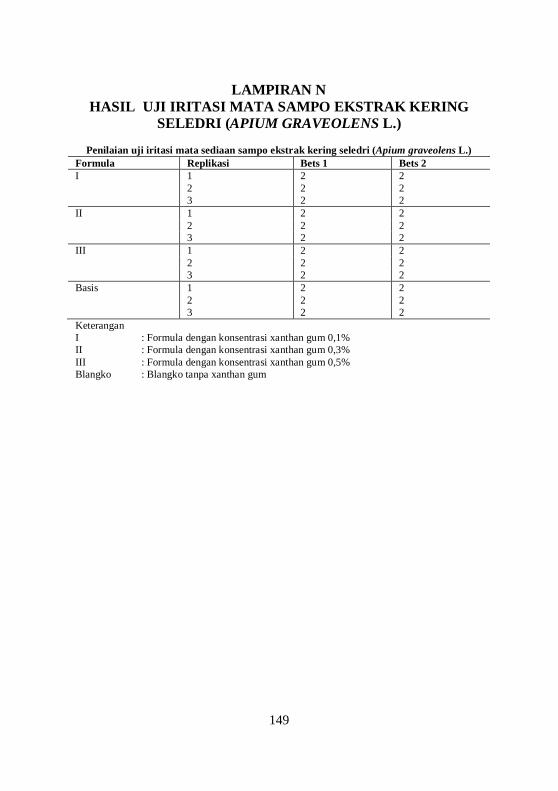
LAMPIRAN N HASIL UJI IRITASI MATA SAMPO EKSTRAK KERING
SELEDRI (APIUM GRAVEOLENS L.)
Penilaian uji iritasi mata sediaan sampo ekstrak kering seledri (Apium graveolens L.) Formula Replikasi Bets 1 Bets 2 I 1 2 2 2 2 2 3 2 2 II 1 2 2 2 2 2 3 2 2 III 1 2 2 2 2 2 3 2 2 Basis 1 2 2 2 2 2 3 2 2 Keterangan I : Formula dengan konsentrasi xanthan gum 0,1% II : Formula dengan konsentrasi xanthan gum 0,3% III : Formula dengan konsentrasi xanthan gum 0,5% Blangko : Blangko tanpa xanthan gum

150
HASIL STATISTIK ANTAR BETS Uji Statistik iritasi mata antar bets mengunakan wilcoxon
Lampiran Hasil perhitungan Statistik wilcoxon pada Iritasi
Mata Formula I Bets 1 dan Bets 2
Descriptive Statistics
N Mean Std. Deviation Minimum Maximum
Bets_1 3 2.0000 .00000 2.00 2.00 Bets_2 3 2.0000 .00000 2.00 2.00
Test Statisticsb
Bets_2 - Bets_1
Z .000a Asymp. Sig. (2-tailed) 1.000 a. The sum of negative ranks equals the sum of positive ranks. b. Wilcoxon Signed Ranks Test
Lampiran Hasil perhitungan Statistik wilcoxon pada Iritasi mata
Formula II Bets 1 dan Bets 2 Descriptive Statistics
N Mean Std. Deviation Minimum Maximum
Bets_1 3 2.0000 .00000 2.00 2.00 Bets_2 3 2.0000 .00000 2.00 2.00
Test Statisticsb
Bets_2 - Bets_1
Z .000a Asymp. Sig. (2-tailed) 1.000
a. The sum of negative ranks equals the sum of positive ranks. b. Wilcoxon Signed Ranks Test
151
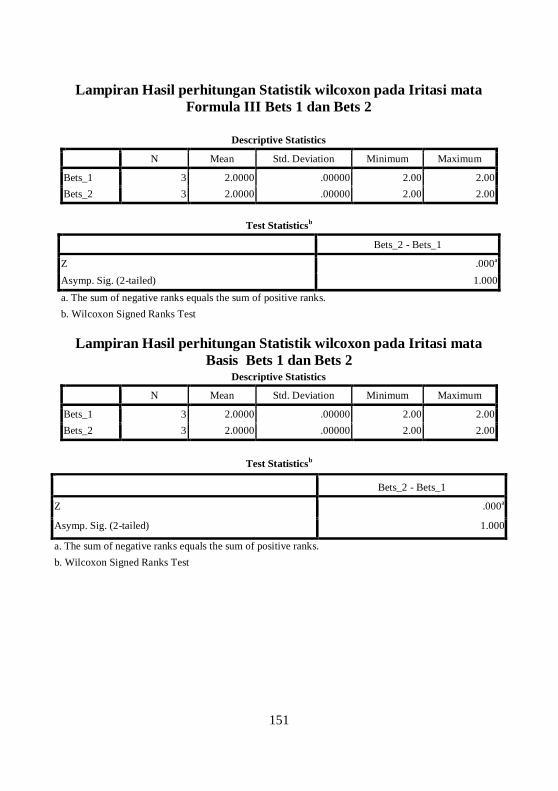
Lampiran Hasil perhitungan Statistik wilcoxon pada Iritasi mata Formula III Bets 1 dan Bets 2
Descriptive Statistics
N Mean Std. Deviation Minimum Maximum
Bets_1 3 2.0000 .00000 2.00 2.00 Bets_2 3 2.0000 .00000 2.00 2.00
Test Statisticsb
Bets_2 - Bets_1
Z .000a Asymp. Sig. (2-tailed) 1.000 a. The sum of negative ranks equals the sum of positive ranks. b. Wilcoxon Signed Ranks Test
Lampiran Hasil perhitungan Statistik wilcoxon pada Iritasi mata
Basis Bets 1 dan Bets 2 Descriptive Statistics
N Mean Std. Deviation Minimum Maximum
Bets_1 3 2.0000 .00000 2.00 2.00 Bets_2 3 2.0000 .00000 2.00 2.00
Test Statisticsb
Bets_2 - Bets_1
Z .000a
Asymp. Sig. (2-tailed) 1.000
a. The sum of negative ranks equals the sum of positive ranks. b. Wilcoxon Signed Ranks Test

152
HASIL STATISTIK ANTAR FORMULA Perhitungan Nilai Chi-square dengan metode Friedman test
secara manual
Lampiran Hasil perhitungan Statistik Friedman test pada Iritasi mata antar formula
Hasil penetapan peringkat dan analisis statistik uji iritasi mata Bets Rep Formula 0 Formula 1 Formula 2 Formula 3
Skor Peringkat Skor Peringkat Skor Peringkat Skor Peringkat
1 1 2 2,5 2 2,5 2 2,5 2 2,5 2 2 2,5 2 2,5 2 2,5 2 2,5 3 2 2,5 2 2,5 2 2,5 2 2,5
2 1 2 2,5 2 2,5 2 2,5 2 2,5 2 2 2,5 2 2,5 2 2,5 2 2,5 3 2 2,5 2 2,5 2 2,5 2 2,5
Jumlah pengamatan
6 6 6 6
Jumlah peringkat
15 15 15 15
Keterangan I : Formula dengan konsentrasi xanthan gum 0,1% II : Formula dengan konsentrasi xanthan gum 0,3% III : Formula dengan konsentrasi xanthan gum 0,5% Blangko : Blangko tanpa xanthan gum
= 0
Chi-squarehit(0)< Chi-squaretabel(11,070), sehingga tidak ada perbedaan bermakna pada iritasi mata antar formula

153
LAMPIRAN O HASIL UJI IRITASI KULIT SAMPO EKSTRAK KERING
SELEDRI (APIUM GRAVEOLENS L.)
HASIL STATISTIK ANTAR BETS Uji Statistik iritasi kulit antar bets mengunakan wilcoxon
Lampiran Hasil perhitungan Statistik wilcoxon pada Iritasi Kulit
Formula I Bets 1 dan Bets 2 Descriptive Statistics
N Mean Std. Deviation Minimum Maximum
Bets_1 10 2.0000 .00000 2.00 2.00 Bets_2 10 2.0000 .00000 2.00 2.00
Test Statisticsb
Bets_2 - Bets_1
Z .000a Asymp. Sig. (2-tailed) 1.000
a. The sum of negative ranks equals the sum of positive ranks. b. Wilcoxon Signed Ranks Test
Lampiran Hasil perhitungan Statistik wilcoxon pada Iritasi Kulit
Formula II Bets 1 dan Bets 2
Descriptive Statistics
N Mean Std. Deviation Minimum Maximum
Bets_1 10 2.0000 .00000 2.00 2.00 Bets_2 10 2.0000 .00000 2.00 2.00
Test Statisticsb
Bets_2 - Bets_1
Z .000a Asymp. Sig. (2-tailed) 1.000 a. The sum of negative ranks equals the sum of positive ranks. b. Wilcoxon Signed Ranks Test

154
Lampiran Hasil perhitungan Statistik wilcoxon pada Iritasi Kulit
Formula III Bets 1 dan Bets 2
Descriptive Statistics
N Mean Std. Deviation Minimum Maximum
Bets_1 10 2.0000 .00000 2.00 2.00 Bets_2 10 2.0000 .00000 2.00 2.00
Test Statisticsb
Bets_2 - Bets_1
Z .000a
Asymp. Sig. (2-tailed) 1.000
a. The sum of negative ranks equals the sum of positive ranks. b. Wilcoxon Signed Ranks Test
Lampiran Hasil perhitungan Statistik wilcoxon pada Iritasi kulit
Basis Bets 1 dan Bets 2 Descriptive Statistics
N Mean Std. Deviation Minimum Maximum
Bets_1 10 2.0000 .00000 2.00 2.00 Bets_2 10 2.0000 .00000 2.00 2.00
Test Statisticsb
Bets_2 - Bets_1
Z .000a Asymp. Sig. (2-tailed) 1.000
a. The sum of negative ranks equals the sum of positive ranks. b. Wilcoxon Signed Ranks Test

155
HASIL STATISTIK ANTAR FORMULA Perhitungan Nilai Chi-square dengan metode Friedman test
secara manual
Lampiran Hasil perhitungan Statistik Friedman test pada Iritasi Kulit antar formula
Hasil penetapan peringkat dan analisis statistik uji keamanan (iritasi) Bets Rep Formula 0 Formula 1 Formula 2 Formula 3
Skor Peringkat Skor Peringkat Skor Peringkat Skor Peringkat
1 1 2 2,5 2 2,5 2 2,5 2 2,5 2 2 2,5 2 2,5 2 2,5 2 2,5 3 2 2,5 2 2,5 2 2,5 2 2,5
2 1 2 2,5 2 2,5 2 2,5 2 2,5 2 2 2,5 2 2,5 2 2,5 2 2,5 3 2 2,5 2 2,5 2 2,5 2 2,5
Jumlah pengamatan
6 6 6 6
Jumlah peringkat
15 15 15 15
Keterangan I : Formula dengan konsentrasi xanthan gum 0,1% II : Formula dengan konsentrasi xanthan gum 0,3% III : Formula dengan konsentrasi xanthan gum 0,5% Blangko : Blangko tanpa xanthan gum
= 0
Chi-squarehit (0)< Chi-squaretabel (16,919), sehingga tidak terdapat perbedaan bermakna pada uji keamanan sampo
156
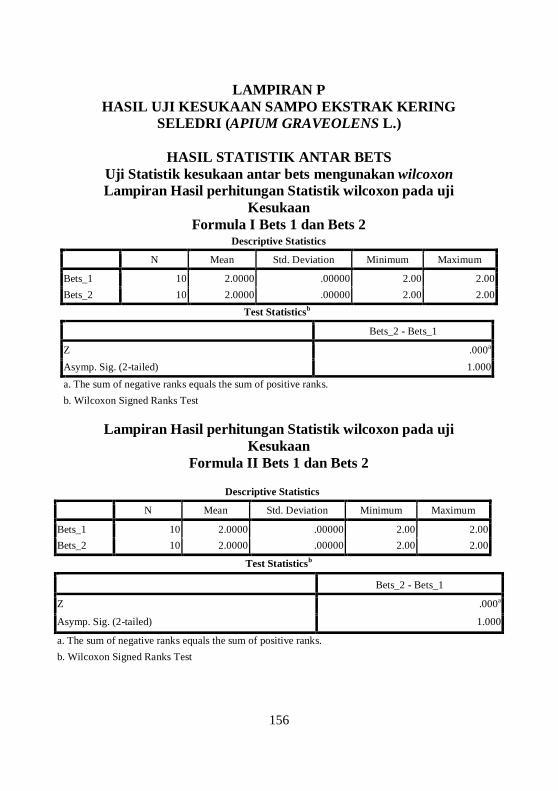
LAMPIRAN P HASIL UJI KESUKAAN SAMPO EKSTRAK KERING
SELEDRI (APIUM GRAVEOLENS L.)
HASIL STATISTIK ANTAR BETS Uji Statistik kesukaan antar bets mengunakan wilcoxon Lampiran Hasil perhitungan Statistik wilcoxon pada uji
Kesukaan Formula I Bets 1 dan Bets 2
Descriptive Statistics
N Mean Std. Deviation Minimum Maximum
Bets_1 10 2.0000 .00000 2.00 2.00 Bets_2 10 2.0000 .00000 2.00 2.00
Test Statisticsb
Bets_2 - Bets_1
Z .000a Asymp. Sig. (2-tailed) 1.000 a. The sum of negative ranks equals the sum of positive ranks. b. Wilcoxon Signed Ranks Test
Lampiran Hasil perhitungan Statistik wilcoxon pada uji Kesukaan
Formula II Bets 1 dan Bets 2
Descriptive Statistics
N Mean Std. Deviation Minimum Maximum
Bets_1 10 2.0000 .00000 2.00 2.00 Bets_2 10 2.0000 .00000 2.00 2.00
Test Statisticsb
Bets_2 - Bets_1
Z .000a
Asymp. Sig. (2-tailed) 1.000
a. The sum of negative ranks equals the sum of positive ranks. b. Wilcoxon Signed Ranks Test
157
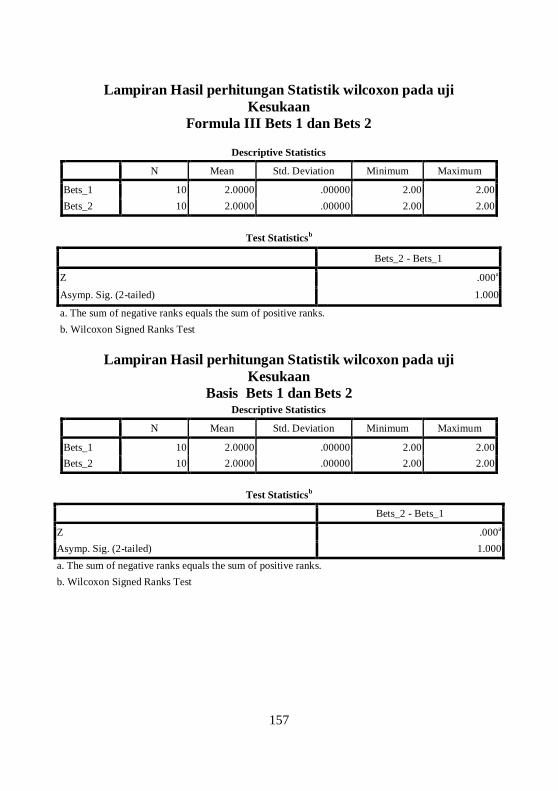
Lampiran Hasil perhitungan Statistik wilcoxon pada uji Kesukaan
Formula III Bets 1 dan Bets 2
Descriptive Statistics
N Mean Std. Deviation Minimum Maximum
Bets_1 10 2.0000 .00000 2.00 2.00 Bets_2 10 2.0000 .00000 2.00 2.00
Test Statisticsb
Bets_2 - Bets_1
Z .000a Asymp. Sig. (2-tailed) 1.000
a. The sum of negative ranks equals the sum of positive ranks. b. Wilcoxon Signed Ranks Test
Lampiran Hasil perhitungan Statistik wilcoxon pada uji
Kesukaan Basis Bets 1 dan Bets 2
Descriptive Statistics
N Mean Std. Deviation Minimum Maximum
Bets_1 10 2.0000 .00000 2.00 2.00 Bets_2 10 2.0000 .00000 2.00 2.00
Test Statisticsb
Bets_2 - Bets_1
Z .000a Asymp. Sig. (2-tailed) 1.000 a. The sum of negative ranks equals the sum of positive ranks. b. Wilcoxon Signed Ranks Test
158
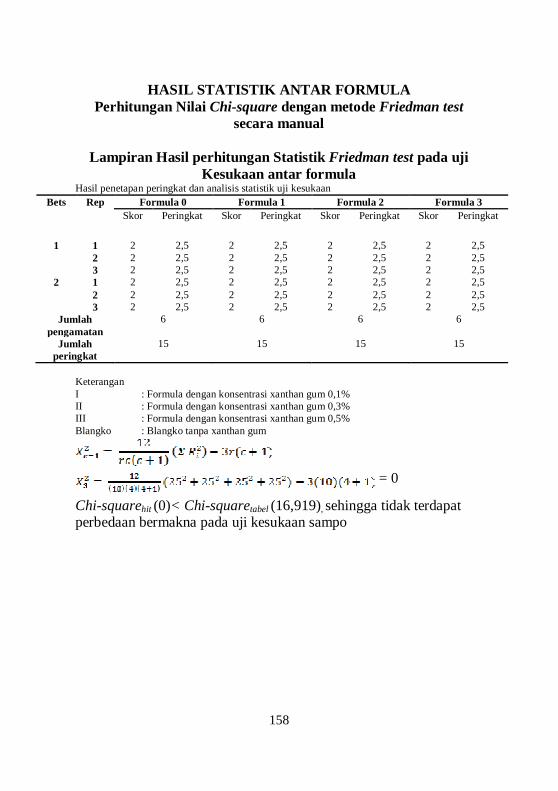
HASIL STATISTIK ANTAR FORMULA Perhitungan Nilai Chi-square dengan metode Friedman test
secara manual
Lampiran Hasil perhitungan Statistik Friedman test pada uji Kesukaan antar formula
Hasil penetapan peringkat dan analisis statistik uji kesukaan Bets Rep Formula 0 Formula 1 Formula 2 Formula 3
Skor Peringkat Skor Peringkat Skor Peringkat Skor Peringkat
1 1 2 2,5 2 2,5 2 2,5 2 2,5 2 2 2,5 2 2,5 2 2,5 2 2,5 3 2 2,5 2 2,5 2 2,5 2 2,5
2 1 2 2,5 2 2,5 2 2,5 2 2,5 2 2 2,5 2 2,5 2 2,5 2 2,5 3 2 2,5 2 2,5 2 2,5 2 2,5
Jumlah pengamatan
6 6 6 6
Jumlah peringkat
15 15 15 15
Keterangan I : Formula dengan konsentrasi xanthan gum 0,1% II : Formula dengan konsentrasi xanthan gum 0,3% III : Formula dengan konsentrasi xanthan gum 0,5% Blangko : Blangko tanpa xanthan gum
= 0
Chi-squarehit (0)< Chi-squaretabel (16,919), sehingga tidak terdapat perbedaan bermakna pada uji kesukaan sampo
159
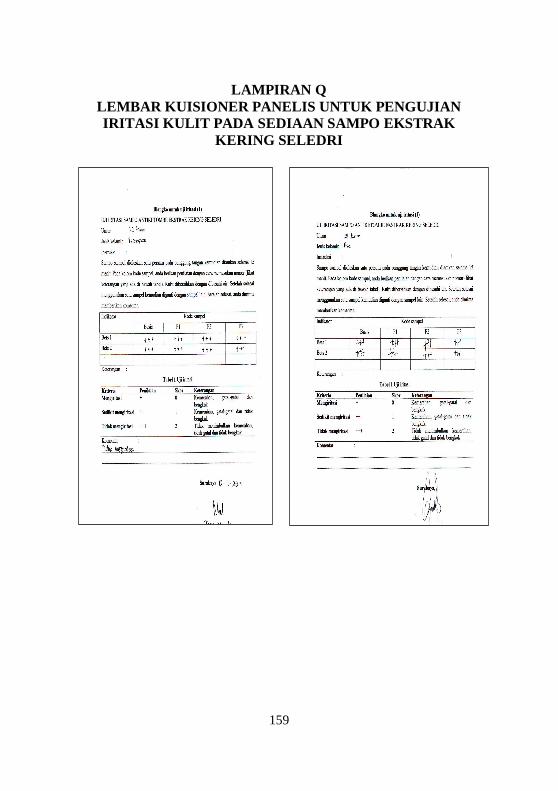
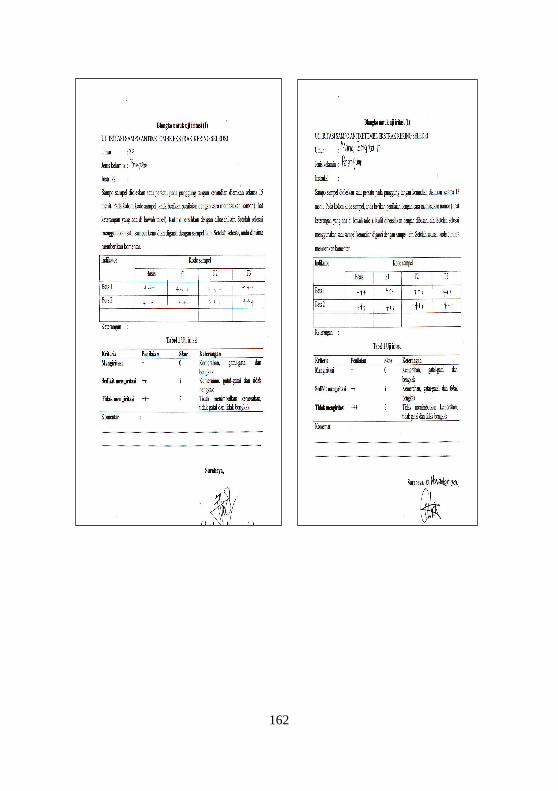
LAMPIRAN Q LEMBAR KUISIONER PANELIS UNTUK PENGUJIAN IRITASI KULIT PADA SEDIAAN SAMPO EKSTRAK
KERING SELEDRI

160

161
162

163

164
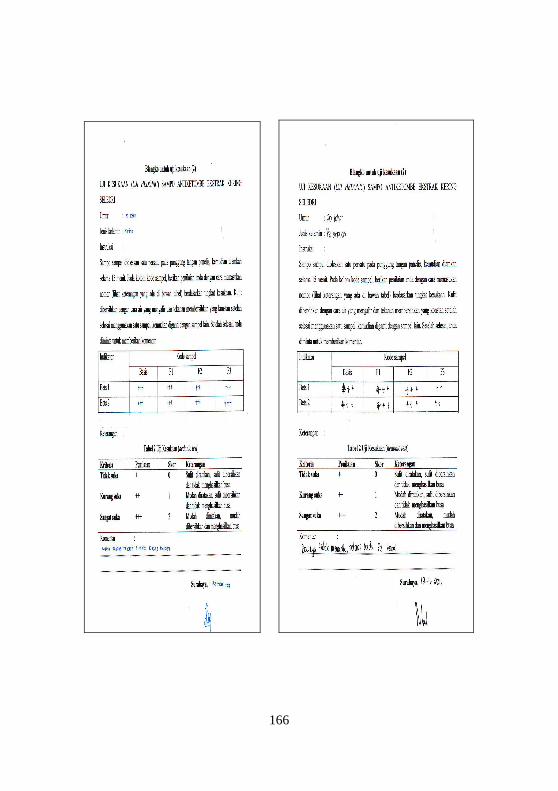
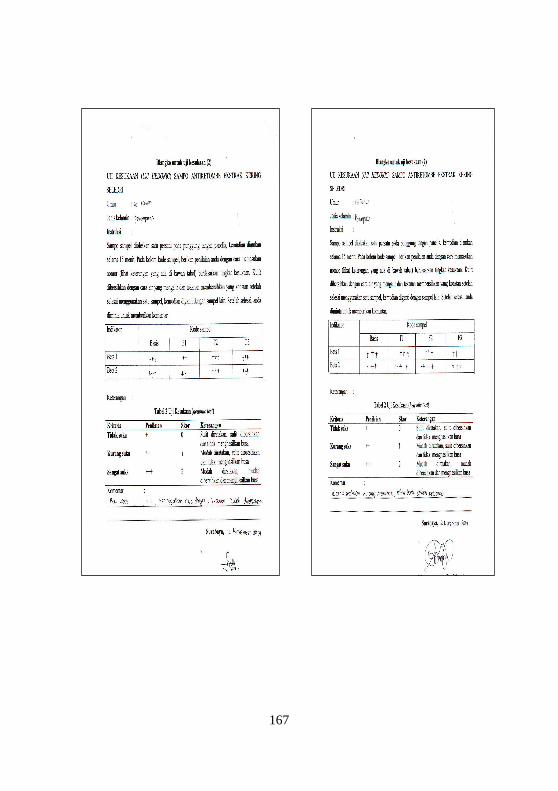
LAMPIRAN R
LEMBAR KUISIONER PANELIS UNTUK PENGUJIAN KESUKAAN TERHADAP SEDIAAN SAMPO EKSTRAK
KERING SELEDRI

165
166
167

168
169
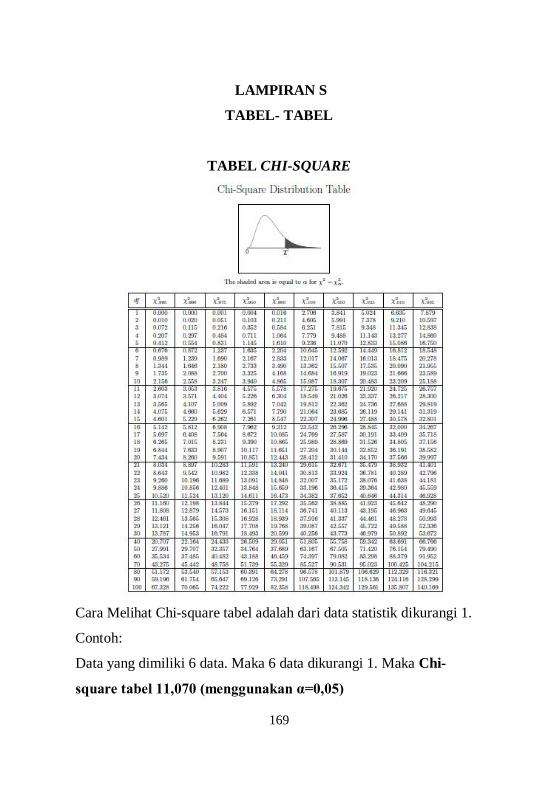
LAMPIRAN S
TABEL- TABEL
TABEL CHI-SQUARE
Cara Melihat Chi-square tabel adalah dari data statistik dikurangi 1.
Contoh:
Data yang dimiliki 6 data. Maka 6 data dikurangi 1. Maka Chi-
square tabel 11,070 (menggunakan α=0,05)

170
TABEL F
Cara Melihat F tabel adalah dari statistic terlihat between group (df1)
dan within group (df2).
Contoh:
between group (df1)= 3 dan within group (df2) = 20. Maka F tabel
3,10.

171
TABEL T
Cara Melihat t tabel adalah dari data statistik dikurangi 2 apabila
menggunakan statistik independent t-test.
Contoh:
Data yang dimiliki 6 yang terdiri dari bet 1 direplikasi 3 kali dan bets
2 direplikasi 3. Maka t tabel 2,776 (menggunakan α=0,05)
172
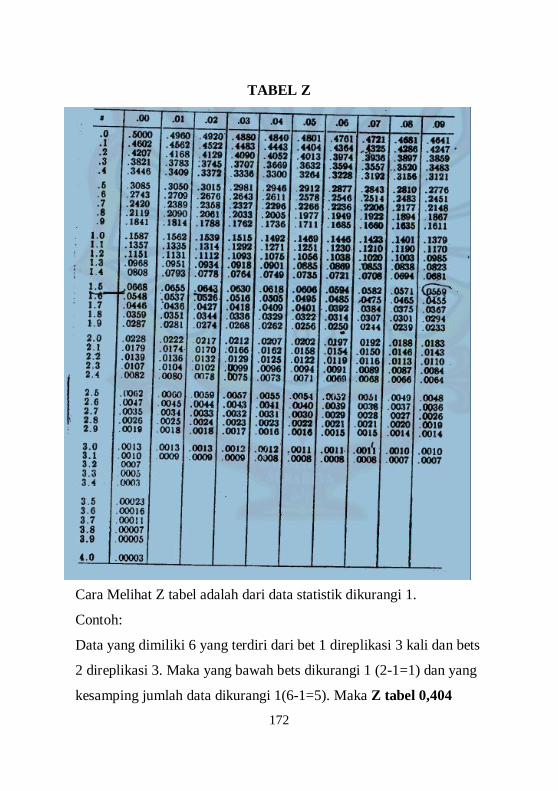
TABEL Z
Cara Melihat Z tabel adalah dari data statistik dikurangi 1.
Contoh:
Data yang dimiliki 6 yang terdiri dari bet 1 direplikasi 3 kali dan bets
2 direplikasi 3. Maka yang bawah bets dikurangi 1 (2-1=1) dan yang
kesamping jumlah data dikurangi 1(6-1=5). Maka Z tabel 0,404

173
LAMPIRAN T
CERTIFICATE OF ANALYSES (CoA)